objectives and strategies of m&a
TRANSCRIPT

OBJECTIVES AND STRATEGIES OF
M&A
By
Kumar T
Abstract

Mergers and acquisitions (M&A’s) are strategic decisions taken for maximization of a company's growth by enhancing its production and marketing operations. They are being used to gain strength, expand the customer base, cut competition or enter into a new market or product segment. When globalization of the Indian economy was started in 1991, it was believed that it would mean foreigners not only doing business in India but also taking over Indian companies. However, integrating the Indian economy with rest of the world has proved to be a two-way experience. Presently, Indian companies are not only doing business abroad but there are many instances of their taking over foreign companies with a very significant value which shows the vision strategy and dominance of Indian corporate,s in the global market (i.e. TATA SONS, Aditya Birla Group)
In post-liberalization era, Indian corporate sector has experienced a boom in M&A’s led restructuring strategies, mainly due to the presence of subsidiaries of big MNCs here as well as the pressure recorded by such strategies on the domestic firms. Finance, Aluminium, Drugs & Pharmaceutical, Telecommunication, Textiles, Automobiles, Beverage Industries etc are the major sectors in which it has been occurred. Out of these, we would focus on Majors of Indian Automobile and Alcohol Industries.
This paper tries to analysis the objectives, benefits, and trends of M&A’s in India by acquiring target, and how they worked synergies for long term as well as shortterm.
AKNOWLEDGEMENT

Acknowledgement is merely not a group of words but a state of mind. This
Acknowledgement is a real outburst of satisfaction and appreciation. At the outset, I would
like to place on record my sincere thanks to the management of “BINGE Consulting”,
Bangalore for their permission to undertake corporate exposure and learning in their
organization.
I am very grateful to Prof. Suryanarayana, who guided me throughout my
Academics and with the project thesis. I also sincerely thank Sreenivas, Senior Executive at
Binge Consulting being very helpful in furnishing information and making this project
successful. I owe my sincere thanks to my College for this opportunity to undertake this
project.
Finally, I would like to thank my dear parents, my dear and near ones and all my
friends who have helped me in the completion of the project work.
Thank You
Contents
1. Introduction

1.1. International Trend in M&A 021.2. Driving forces and objectives of M&A 061.3. Synergies as Objectives 111.4. Objectives of M&A 12 1.5. Mergers acquisitions and business strategy 13
2. Classifications 2.1. Classifications Of M&A 162.2. Motives behind M&A 172.3. Financing M&A 18
3. Company profile3.1. Profile and History of JLR (Target) 193.2. Profile and History of TATA (Acquirer) 213.3. Profile and History of Diageo (Acquirer) 233.4. Profile and History of United Spirits LTD (Target) 24
4. Case Study 1 (Analysis & Interpretation)4.1. TATA Group buying JLR CASE STUDY 254.2. TATA Motor consolidated P&L Account 284.3. TATA Motor consolidated Balance Sheet 294.4. TATA Motors Financial ratios 314.5. TATA Motors Stock performance 334.6. Synergies Of the Deal 34
5. Case study 2 (Analysis & Interpretation)5.1. Diageo Buying Stake In USL 365.2. USL Consolidated Cash Flow & Estimates 425.3. USL Consolidated Profit & Loss Account & Estimates 445.4. USL Consolidated Balance sheet & Estimates 465.5. USL Financial Ratios Analysis 485.6. Deal Synergies 50
6. Suggestions6.1. Conclusions Of TATA JLR Deal 516.2. Conclusions of Diageo USL Deal 53
Bibliography 55

Objectives and Strategies of M&A
Chapter-1
Introduction
‘Mergers and Acquisitions’ (M&As) are strategically planned transactions between two ormore companies in which the target and the acquiring firm jointly create a new entity togain competitive advantage in the market place. The motives and objectives for M&Aactivity are various. Competitive advantage could arise from synergies due to economiesof scale, an increase in market share, better access to a customer base, ownership ofdistribution channels and access to knowledge and technology to mention just a few. Inother words, mergers and acquisitions allow the purchase of assets that would bedifficult, risky, time-consuming or even impossible to obtain by other alternative businesscollaborations or organic growth.
In market economies where free competition is the principal rule by establishment and extinction of enterprises, a third natural process, the concentration of companies can be observed. In the widest meaning concentration is the gaining control over the other company, gaining influence on the decisions of the other company and the joining of companies. In a more narrow sense only the achievement of influence above a certain extent and the joining of companies can be considered as concentration. Corporate merges and acquisitions are the most spectacular forms of concentration.
Merge is an incorporation or fusion that results in the decrease of the companies’ number. The acquisition or takeover is a qualified case of the sharing, according to the corporate and security act the obtaining of a majority part in a given company or at least the 25% - in case of public corporation the 33% - of the shares.
Merger is a most important form of the corporate concentration, when at least one of the companies is wound up and on the organizational level joins with another company. According to the corporate act the merger can be realized through incorporation (A + B » A) and through fusion (A + B » C). In the case of incorporation one of the companies is wound up and the other company remains its general successor whose name will not change. The fusion wounds up both of the companies and their capital falls to the newly established legal successor company.
Acquisition takesplace when one exisiting company purchases the business of another company, generally refered to as target or target company. It means that most of the shareholders of target company may become shareholders in the acquirer company if the acquisitiin involves share swaping.On the other hand, if the acquisition takes place for cash,non of the shareholders of the target company are accomadeted in the acquirer company, in thescence, all the shareholders of target company are adiquatly compansated in cash by acquirer company.
In addition to the previous mergers and acquisition can be characterized as the following also. In case of acquisitions we can differentiate between: Leverage BuyOut - LBO where the transaction is financed from debt and the target company’s assets are the coverage. In case of Management Buy Out - MBO the company’s management takes over the owners’ right. We are talking about Employee Buy Out
Page 1

Objectives and Strategies of M&A
- EBO if employees of the company become the owners.1.1International trends
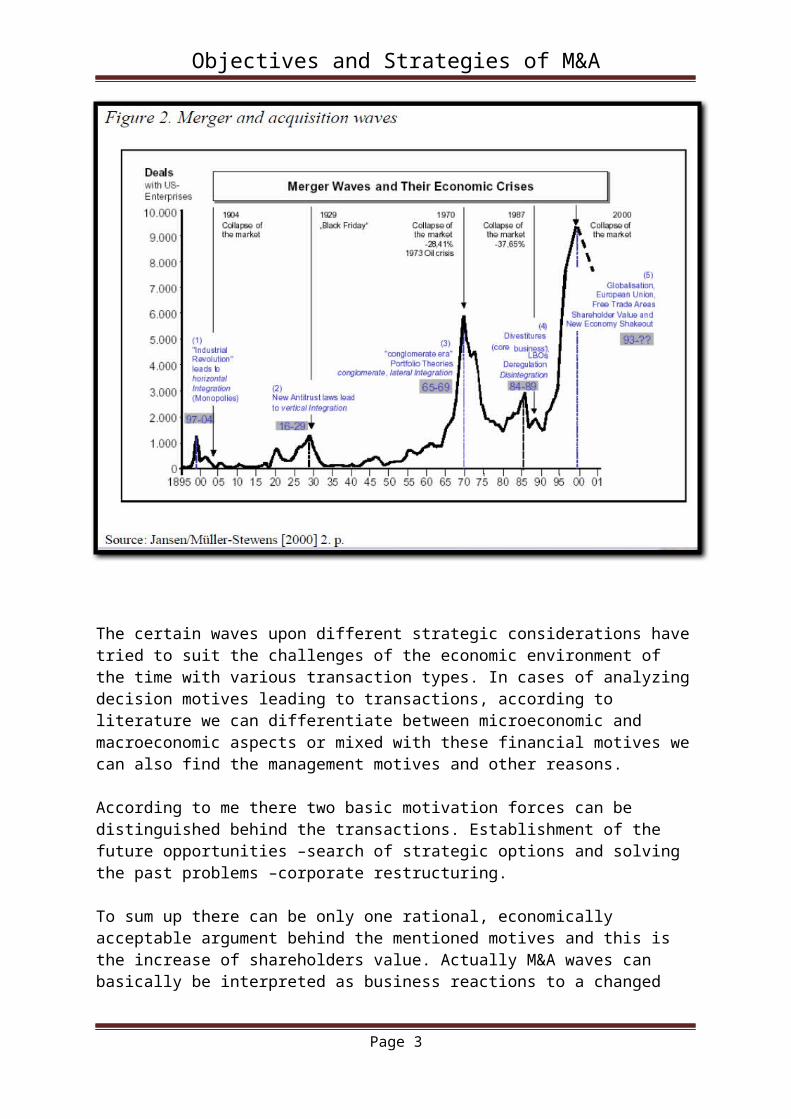
Mergers and acquisitions are not inventions of recent times. Internationally, M&A transaction intensive periods occurred several times in the past hundred years. As it can be seen on the figure 2.we can observe five M&A intensive waves when the number of transactions was enormous.
The certain waves upon different strategic considerations have tried to suit the challenges of the economic environment of the time with various transaction types. In cases of analyzing decision motives leading to transactions, according to literature we can differentiate between microeconomic and macroeconomic aspects or mixed with these financial motives we can also find the management motives and other reasons.
According to me there two basic motivation forces can be distinguished behind the transactions. Establishment of the future opportunities –search of strategic options and solving the past problems –corporate restructuring.
To sum up there can be only one rational, economically acceptable argument behind the mentioned motives and this is the increase of shareholders value. Actually M&A waves can basically be interpreted as business reactions to a changed environment. These changes may vary and differ over time, but are mostly related to technology changes.
Page 2

Objectives and Strategies of M&A
The following tab1.summarizes the probable strategic considerations and business reactions regarding to the five M&A waves showed on figure below
Strategic background of M&A waves
M&A WAVE
Period Strategic Background
Transaction Type
1. WAVE 1880-1904 Realization of monopoly rents. Pooling of market power.
Horizontal M&A
2. WAVE 1916-1929 Integration to gain control of the complete value chain. Optimization of the interface
Vertical M&A
3. WAVE 1965-1969 Anti-Cyclical portfolio building to harmonize different industry-driven economic downturns.
Conglomerate M&A
4. WAVE 1984-1989 Back to core business. Speculative gains for financial acquirers.
LBO
5. WAVE 1993-2000 Increasing shareholders value and globalization. Technology & Consolidation of the new economy
Cross-borderM&A
Sources: Own completion
As we could seen on above figure among the M&A waves the last wave, 5th in the line (period 1993-2000) was the largest. Knowing the strategic considerations and business reactions to the changed environment as it can be seen on above table.
Cross-Border Mergers and Acquisitions were the most typical transactions in that wave.These transactions differ from the traditional M&A transactions in the means thatthe origin country of the two participating companies is not the same.
Page 3

Objectives and Strategies of M&A
CBMA IN 1998-2004 Period:
The last M&A wave was characterized not only by the CBM&A transactions but with the enormous transaction value both in developed and developing countries (UNCTADT [2000] ). In the fifth M&A wave CBM&A transaction volume has reached its top in year 2000. The total sum of transaction value was 1144 billion USD and the number of transactions was 6520. The number of mega deals / deals with value over 1 billion US$ / was 175. The top year in this category was also 2000.
Page 4
Objectives and Strategies of M&A
Sources: Reuters
Page 5
Objectives and Strategies of M&A
1.2 DRIVING FORCES AND OBJECTIVES OF THE TRENDS in M&A
Driving forces of the trends
The combination of cheap borrowing costs and high share prices is ideal for merger mania, boosting the buying power of acquisitive chief executives.
The announcement of a number of international large-scale M&A transactions in the first few months of 2013 has led to increased awareness of corporate takeovers by international investors. Although this is just a momentary snapshot of what is happening, a trend could develop, powered by three driving forces in particular:
Healthy corporate balance sheets Low interest rates with inexpensive refinancingopportunities Emerging markets: Coming of age in terms of mergers and acquisitions
Healthy corporate balance sheets
Global companies (excluding financial service providers),especially US ones, seem to have dramatically scaled back their investments as a result of the financial crisis, thereby cutting their costs. As a result, their capital gearing ratios – the ratio of net debt to earnings before interest, tax, depreciation and amortisation (EBITDA) – have been trending towards a long-term low. The capital gearing ratio of global companies is currently 1.5, 13 % below the 20-year average.
Low capital gearing ratio at global companies:
Page 6

Objectives and Strategies of M&A
However, there are regional differences. Reductions in capital expenditures and cost-cutting measures were particularly pronounced at companies based in the US and the UK. Those companies cut their gearing ratios by approximately 40 % between the third quarter of 2009 and the fourth quarter of 2010 or 2011. It is also interesting to note that US companies, in contrast to their British counterparts,did not increase their ratios of net debt to EBITDA on a disproportionately large scale as a result of the economic recovery in 2011. With a current gearing ratio of 1.3, US companies still remain 15 % below the 20-year average.
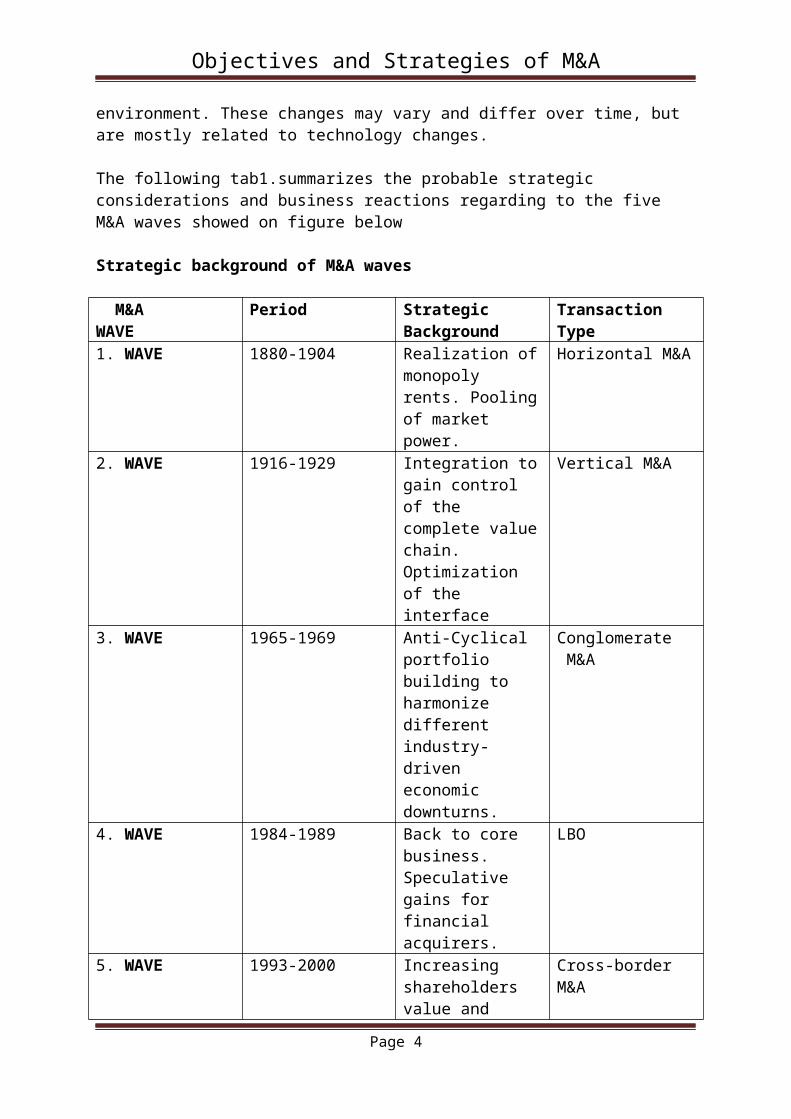
This deleveraging, which has been particularly pronounced at US companies, has helped businesses (excluding financial service providers) clean up their balance sheets and achieve a higher cash flow measured on the basis of free cash flow in per cent of gross domestic product (GDP), as seen in Chart below. US companies currently have a free cash flow of 4.4 % of US GDP, nearing the all-time high of 4.7 %. For the G4 countries (USA, Europe, United Kingdom and Japan), this figure had increased to 4 % of their combined GDP by late 2010, despite amounting to slightly above 2 % in mid-2009.
High level of free cash flows in US:
Page 7

Objectives and Strategies of M&A
As a result of the stepped-up reduction in gearing in the wake of the financial crisis and an increased cash flow in the past few years, US companies have been able to nearly double their net cash flow. As of March 2013, they boasted financial reserves of more than US$1.7 trillion. In comparison, European companies had stockpiled some US$475 billion by the end of 2012.
US Companies have financial reserves of more than 1.7 trillion
A low-interest-rate environment
It is almost logical for corporate management to now turn its thoughts back to how they can use their free cash flow. After all, the current low-interest-rate environment equates to negative real returns in some cases, making cash an unattractive option in terms of yield. For companies, two options seem to stand out among a sea of possibilities:
1. Increased investment activity: The uncertainty about further economic growth seems to be increasingly giving way to wider-spread optimism.According to various preliminary indicators, companies seem to be taking a more optimistic view of the future, prompting them to be more willing to step up their investment activity. In fact, capital expenditures (“capex”) has recently reached a new all-time high in the US and emerging countries.
Page 8

Objectives and Strategies of M&A
2. Increased M&A activity: Companies with a high free cash flow could increasingly look for M&A opportunities. A look at the number of mergers and acquisitions announced in the corporate sector in the first quarter of 2013 indicates that many corporate decision makers will likely focus on M&A activities in the months to come.
Whether it is increased investment activity or M&A activity, both options seem likely to profit from companies’ increasingly opportune refinancing conditions. Not only have interest charges improved in relation to revenue over the past few years (from some 2.5 % of revenue around the year 2000 to 1.7 % of revenue today), the improvement in balance-sheet structure has made it easier for companies to take out loans, as evidenced by the returns on US corporate bonds.
US Non Financials Interest rate change
Page 9

Objectives and Strategies of M&A
Emerging markets: Coming of age in terms of mergers and acquisitions:
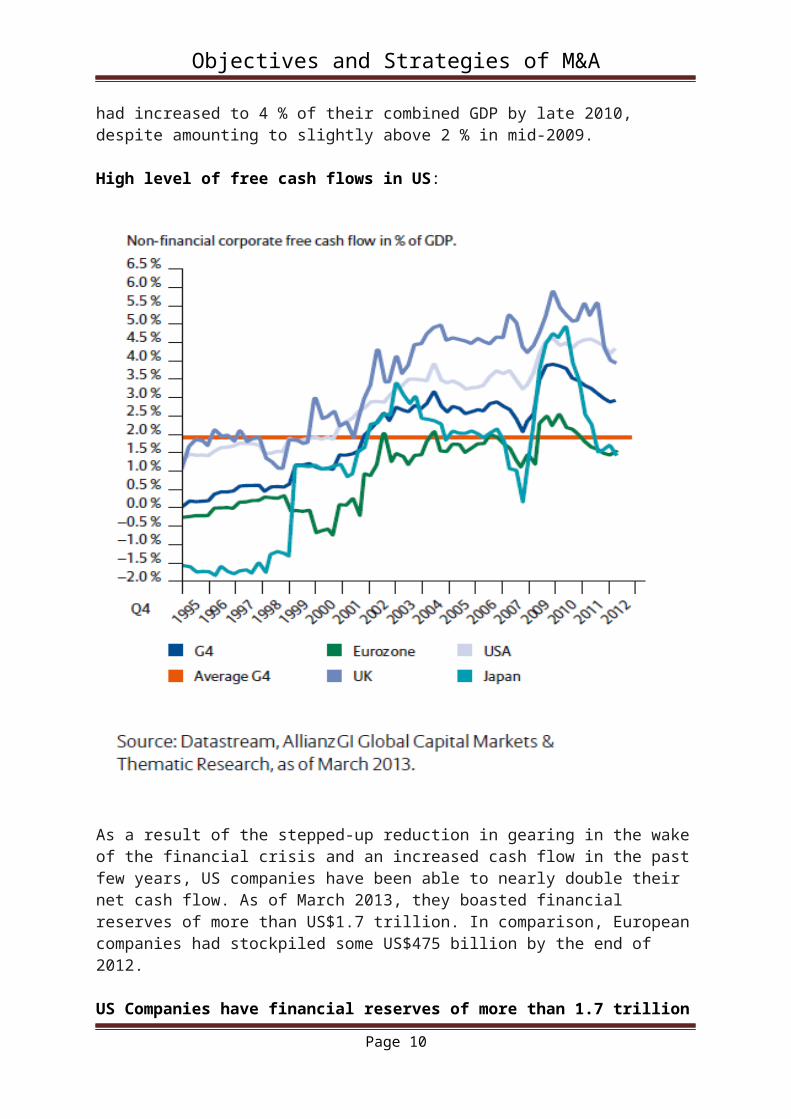
Still, the data shows that there is room to grow. Even though M&A volume in 2011 increased slightly year on year, this development seems to have fallen flat in the twelve months that followed. By late 2012, global M&A volume was not only 20 % lower than one year before, but had also fallen significantly below the long-term average over the past 20 years. The figure for western Europe even came in nearly 50 % lower than average. In fact, global M&A volume in relation to market capitalisation has sunk to its lowest level in 20 years.
However, it is interesting to note that the M&A environment has changed noticeably in recentyears. Whereas US companies were at the forefront of mergers and acquisitions from the mid-1990s until the early 2000s (accounting for a nearly 40 % share of all mergers and acquisitions worldwide at the peak of activity), the tide has started turning in favour of companies from emerging markets in recent years. Now accounting for a large portion ofmergers and acquisitions (41 %), companies from this region are becoming increasingly active players on the M&A stage. In comparison, they accounted for a mere 6 % of mergers and acquisitions in the mid-1990s. As of late 2012, US companies were behind just 17 % of the world’s M&A transactions. Western European companies accounted for 13 %of all takeover activities. Political insecurity in the wake of the European Union debt crisis and its global impact are among the possible reasons for this development. Adding the Asia / Pacific region to the equation results in a share of 70 % for emerging markets, meaning that almost three-quarters of all mergers and acquisitions worldwide took place in countries with high growth rates.
Emerging markets have accounted for a large share of M&A in recent years:
Page 10

Objectives and Strategies of M&A
1.3 Synergy as objective
The term synergy is often associated with the physical sciences rather than with economics or finance. It refers to the type of reactions that occur when two substances or factors combine to produce a greater effect together than that which the sum of the two operating independently could account for. For example, a synergistic reaction occurs in chemistry when two chemicals combine to produce a more potent total reaction than the sum of their separate effects. Simply stated, synergy refers to the phenomenon of 2 + 2 = 5. In mergers this translates into the ability of a corporate combination to be more profitable than the individual parts of the firms that were combined.
Synergy systemization
Synchronic DiachronicEconomies of sameness(Interaction of similar parts)
Economies of scale (Less cost per units as volume increases)
Economies of experience(The learning curve. Etc..)
Economies of fitness Complementary(Mutually supportive parts)
Economies of speed(Just in time production, etc..)
Sources: Larsson
The complex structure of the factors, affecting the synergy development, dividedinto the initial and internal groups can be seen below
Page 11
Objectives and Strategies of M&A
1.4 Objectives of M&A
The immediate objective of an acquisition is self-evidently growth and expansion of the acquirer's assets, sales and market share. A more fundamental objective may be the enhancement of shareholders' wealth through acquisitions aimed at accessing or creating sustainable competitive advantage for the acquirer. In modern finance theory, shareholder wealth maximization is posited as a rational criterion for investment and financing decisions made by managers.
Share holder wealth maximization may, however, be supplanted by the self-interest pursuit of managers making those decisions. According to the managerial utility theory, acquisitions may be driven by mangerial ego or desire for power, empire building or perquisites that go with the size of the firm.
Shareholder wealth maximization perspective
In this neo-classical perspective, all firms' decisions including acquisitions are made with the objective of maximizing the wealth of the shareholders of the firm. This means that the incremental cash-flows from the decision, when discounted at the appropriate discount rate, should yield zero or positive net present value. Under uncertainty, the discount rate is the risk-adjusted rate with a market-determined risk premium for risk.
With acquisitions, the shareholder wealth maximization criterion in satisfied when the added value created by the acquisition exceeds the cost of acquisition :
Added value from acquisition = value of acquirer and the acquired after acquisition - their aggregate value before
Increase in acquirer share value = Added value - Cost of Acquisition
Cost of Acquisition = Acquisition transaction cost + Acquisition premium
Acquisition Transaction cost = advisers' fees + regulator's fees + stock exchange fees + cost of underwriting + other expenses
Acquisition premium ( or control price) = Offer price paid to target - target's pre-bid price
When managers seek to enhance shareholders' wealth, they must not only add value, but also ensure that the cost of the acquisition dies not exceed that value. Value creation may occur in the target alone, or in both the acquirer and the acquired firm.
Page 12

Objectives and Strategies of M&A
1.5 MERGERS AND ACQUISITIONS AND BUSINESS STRATEGY
Whatever the fundamental objective of the managers in acquiring other companies, such acquisitions must form part of the business and corporate strategies of the acquirer. Business strategy is aimed at creating sustainable competitive advantage for the firm. Such an advantage may stem form economies of scale and scope, or market power, or access to unique strengths which the acquired company may possess.
Often the acquirer may aim to transfer its 'superior' management skills to the target of acquisition and thereby enhance the earning power of the target's assets. Here the added value can be created even when the target remains a stand-alone entity, and does not depend upon any possible synergy between the acquirer and the acquired. The acquirer is pursuing a corporate strategy of value creation through efficiency improvements in the target.
An acquisition may also fulfil the acquirer's corporate strategy of building a portfolio of unrelated businesses. The aim here may be risk reduction if the earnings streams of the different businesses in the portfolio are highly positively correlated. In an efficient capital market framework, the ability of this strategy to create value for shareholders is open to doubt.
Analytical Framework For Generic Strategies
Thus we have seen the decision to acquire another firm is a strategic decision, which requires a lot of thought and evaluation. By this it is meant that the company strategists should try to identify and quantify opportunities available to them. These are done by using the frameworks mentioned below. Each of these models map out market attractiveness and company strengths. This way strategic investable opportunities are identified.
A Few Common Models Are as follows :
BCG Matrix:
The BCG matrix, invented by the Boston Consulting Group, is a tool that allows to classify and evaluate the products and services of a business. It is a decision making tool in order to balance the activities of a company among those which make profits, those who ensure growth, those which constitute the future of the firm or those who are its heritage. With this tool one is able to define the development policy of the company. The matrix will position the products/services in two ways:
„The rate of growth of the market ; The market share of a product/service offered facing the competitors
Page 13

Objectives and Strategies of M&A
Golden Rules:
„ Positioning = the company has to place each of its products/services on the matrix. Thus it is able to obtain information on the market share of the product or service and the market growth.
„ Creating long-term value = the company should have a product portfolio that includes products with high growth where it is necessary to inject cash and products where growth is weaker but which generate a lot of cash.
Source:BCG
Porter's 5 Force Model:
1. Market Penetration that is increasing market share in its existing products.
2. Market extension with the firm selling its existing products in new geographical markets.
3. Product Extension in which the firm sells new products related to its existing ones in its present market.
4. Diversification in which the firm sells new products in new markets.
Thus the strategy followed by any firm depends on the firm's evaluation of market attractiveness, competitive strength, and potential for Value creation by matching these strengths with demands made by the market.
Page 14

Objectives and Strategies of M&A
Product Life Cycle Model and Ansoff Product And Market Strategic Choice Model are other common models generally adopted to help devise a takeover or acquisition strategy for the firm.
Strategy formulation is a loosely sequential process which consists of the following broad steps:
Strategic Situation Analysis: By this we mean the company's analysis of the present scenario, its strengths and weaknesses. How they match with the opportunities and threats that the market analysis throws up.
Strategic Choice Analysis: By this it is meant a forward looking scenario building analysis by the company. Where does it see itself in the future, what kind of capability must it build to reach that position it sees for itself and most importantly how should it go about building these capabilities.
After the corporate has done its homework that is it has identified segments of the market to invest in. Now it is time for the next part of the strategy and that is Market Entry. The different entry level strategies available to any corporate are
1. Organic Growth
2. Acquisitions or Strategic Alliances
The choice of entry strategy depends upon the market scenario which is defined by:
1. Level of Competition
2. Start-up risks (to greenfield ventures)
3. Availability of organizational resource for organic growth.
4. Advantage of Speed of Entry.
Page 15

Objectives and Strategies of M&A
Chapter-22.1Classifications of mergers
1. Horizontal merger - Two companies that are in direct competition and share the same product lines and markets.
2. Vertical merger - A customer and company or a supplier and company. Think of a cone suppliermerging with an ice cream maker.
3. Market-extension merger - Two companies that sell the same products in different markets.
4. Product-extension merger - Two companies selling different but related products in the same market.
5. Conglomeration - Two companies that have no common business areas.
There are two types of mergers that are distinguished by how the merger is financed. Each has certain implications for the companies involved and for investors:
1. Purchase Mergers - As the name suggests, this kind of merger occurs when one companypurchases another. The purchase is made with cash or through the issue of some kind of debtinstrument; the sale is taxable.
Acquiring companies often prefer this type of merger because it can provide them with a tax benefit.Acquired assets can be written-up to the actual purchase price, and the difference between the book value and the purchase price of the assets can depreciate annually, reducing taxes payable by the acquiring company. We will discuss this further in part four of this tutorial.
2. Consolidation Mergers - With this merger, a brand new company is formed and both companies are bought and combined under the new entity. The tax terms are the same as those of a purchase merger.
3. Accretive mergers are those in which an acquiring company's earnings per share (EPS) increase. An alternative way of calculating this is if a company with a high price to earnings ratio (P/E) acquires one with a low P/E.
4. Dilutive mergers are the opposite of above, whereby a company's EPS decreases. The company will be one with a low P/E acquiring one with a high P/E.
Page 16
Objectives and Strategies of M&A
2.2 Motives behind M&A
The dominant rationale used to explain M&A activity is that acquiring firms seek improved financial performance. The following motives are considered to improve financial performance:
1. Synergy: This refers to the fact that the combined company can often reduce its fixed costs by removing duplicate departments or operations, lowering the costs of the company relative to the same revenue stream, thus increasing profit margins.
2. Increased revenue or market share: This assumes that the buyer will be absorbing a major competitor and thus increase its market power (by capturing increased market share) to set prices.
3. Cross-selling: For example, a bank buying a stock broker could then sell its banking products to the stock broker's customers, while the broker can sign up the bank's customers for brokerage accounts.Or, a manufacturer can acquire and sell complementary products.
4. Economy of scale: For example, managerial economies such as the increased opportunity of managerial specialization. Another example are purchasing economies due to increased order size and associated bulk-buying discounts.
5. Taxation: A profitable company can buy a loss maker to use the target's loss as their advantage by reducing their tax liability. In the United States and many other countries, rules are in place to limit the ability of profitable companies to "shop" for loss making companies, limiting the tax motive of an acquiring company.
However, on average and across the most commonly studied variables, acquiring firms' financial performance does not positively change as a function of their acquisition activity.[3] Therefore, additional motives for merger and acquisiiton that may not add shareholder value include:
1. Diversification: While this may hedge a company against a downturn in an individual industry it fails to deliver value, since it is possible for individual shareholders to achieve the same hedge by diversifying their portfolios at a much lower cost than those associated with a merger. (ex:TATA SONS, Birla)
2. Manager's hubris: manager's overconfidence about expected synergies from M&A which results in overpayment for the target company. (ex:Microsoft buying Skpe, Google buyin motorola)
3. Empire-building: Managers have larger companies to manage and hence more power. (ex:GE, Cisco, Citi Group, etc...)
4. Manager's compensation: In the past, certain executive management teams had their payout based on the total amount of profit of the company, instead of the profit per share, which would give the team a perverse incentive to buy companies to increase the total profit while decreasing the profit per share (which hurts the owners of the company, the shareholders); although some empirical studies show that compensation is linked to profitability rather than mere profits of the company. (ex:Goldman sach, Barckley,etc)
Page 17

Objectives and Strategies of M&A
2.3Financing M&A
Mergers are generally differentiated from acquisitions partly by the way in which they are financed and partly by the relative size of the companies. Various methods of financing an M&A deal exist:
CashPayment by cash. Such transactions are usually termed acquisitions rather than mergers because the shareholders of the target company are removed from the picture and the target comes under the (indirect) control of the bidder's shareholders alone.
A cash deal would make more sense during a downward trend in the interest rates. Another advantage of using cash for an acquisition is that there tends to lesser chances of EPS dilution for the acquiring company. But a caveat in using cash is that it places constraints on the cash flow of the company.
FinancingFinancing capital may be borrowed from a bank, or raised by an issue of bonds. Alternatively, the acquirer's stock may be offered as consideration. Acquisitions financed through debt are known as leveraged buyouts if they take the target private, and the debt will often be moved down onto the balance sheet of the acquired company.
HybridsAn acquisition can involve a combination of cash and debt or of cash and stock of the purchasing entity
Page 18

Objectives and Strategies of M&A
Chapter 3
3.1 Company Profiles of JLR (Target)
History of JLR
Jaguar Land Rover is a company that brings together two much loved, highly prestigious British car brands. After Tata Motors acquired Jaguar and Land Rover from Ford in 2008, it merged the two marques into a single company and its success has flourished, with memorable vehicles and innovative technologies that add to a long-lasting legacy.
The origins of Jaguar can be traced back to a company that began by making motorcycle sidecars in 1922.
The Swallow Sidecar Company later started building automobiles and moved to Coventry, switching its name to Jaguar after the Second World War. It produced premium saloons and sports cars , including the legendary XK120.
Around this time, Rover started to develop a new all-terrain vehicle, inspired by the American Jeep. Lightweight and rustproof, the first land Rover was clad in aluminium alloy, due to the post-war steel shortage, and cost £450. It introduced 4x4 capabilities to road cars and was soon adopted by the military as well.
Adding to Jaguar’s reputation was its motorsport success in the 1950s, winning the Le Mans 24 Hours race twice with a C-type – in 1951 and again in 1953 – and then with a D-type in 1955, 1956 and 1957. In 1961, the company launched what became perhaps the most iconic sports cars of all time, the E-type. In 1968 it merged with BMC (British Motor Corporation), which later became part of British Leyland and included Rover.
With an increasing demand for recreational off- roaders, the Range Rover made its debut in 1970.
So popular was the new car that British Leyland made Land Rover a standalone company in 1978. Very little about the first Range Rover was altered over the years – 1981 introduced a four-door, while a diesel arrived in 1986. As the Range Rover became seen as more upmarket, the Land Rover Discovery was launched in 1988 as a third model in the range.
After splitting from British Leyland, Jaguar became independent again in the 1980s, before being purchased by Ford in 1989. Land Rover, meanwhile, was bought by BMW in 1994, which expanded the range further by introducing the Freelander. It then joined Jaguar under Ford in 2000, with the two companies becoming closely linked, sharing engineering knowledge and facilities.
In 2008, the two were bought by Tata Motors, India’s biggest car maker, and officially joined together as one company in 2013. Sales and profits have risen year on year, with more exciting chapters in the histories of these two brands still to be written.
Page 19

Objectives and Strategies of M&A
INTERNATIONALOPERATIONS
Jaguar Land Rover benefits from worldwide expansion.
The company has a worldwide network of dealers and Land Rover Experience centres, where the full range of Land Rover vehicles can be put through their paces.
With Jaguar Land Rover experiencing global sales growth, it is increasingly important to expand its global presence. Production of the Freelander 2 and Jaguar XF saloon commenced at a facility in Pune, India, overseen by experienced manufacturing and quality managers who have relocated to India from the UK.
In addition to the Pune plant, Jaguar Land Rover has local assembly facilities in Kenya, Malaysia, Pakistan and Turkey as well as testing and development centres in Dubai, Minnesota in the United States and at the Nurburgring in Germany.
The business has formed partnerships across the globe, including a Joint Venture with Chery Automobile in China where we will manufacture vehicles for Chinese customers.
We have also recently signed a letter of intent paving the way for an automotive partnership in Saudi Arabia. Together with Saudi Arabia’s National Industrial Clusters Development Program (NICDP) we have begun a detailed feasibility study to determine the viability of setting up an automotive facility.
Page 20
Objectives and Strategies of M&A
3.2 COMPANY PROFILE OF TATA MOTORS (ACQUIRER)
Tata Motors Limited is India's largest automobile company, with consolidated revenues of INR 1,88,818 crores (USD 34.7 billion) in 2012-13. It is the leader in commercial vehicles in each segment, and among the top in passenger vehicles with winning products in the compact, midsize car and utility vehicle segments. It is also the world's fifth largest truck manufacturer and fourth largest bus manufacturer.
The Tata Motors Group's over 60,000 employees are guided by the mission "to be passionate in anticipating and providing the Best Vehicles and experiences that excite our customers globally."
Established in 1945, Tata Motors' presence cuts across the length and breadth of India. Over 8 million Tata vehicles ply on Indian roads, since the first rolled out in 1954. The company's manufacturing base in India is spread across Jamshedpur (Jharkhand), Pune (Maharashtra), Lucknow (Uttar Pradesh), Pantnagar (Uttarakhand), Sanand (Gujarat) and Dharwad (Karnataka). Following a strategic alliance with Fiat in 2005, it has set up an industrial joint venture with Fiat Group Automobiles at Ranjangaon (Maharashtra) to produce both Fiat and Tata cars and Fiat powertrains. The company's dealership, sales, services and spare parts network comprises over 6,600 touch points.
Tata Motors, also listed in the New York Stock Exchange (September 2004), has emerged as an international automobile company. Through subsidiaries and associate companies, Tata Motors has operations in the UK, South Korea, Thailand, South Africa and Indonesia. Among them is Jaguar Land Rover, acquired in 2008. In 2004, it acquired the Daewoo Commercial Vehicles Company, South Korea's second largest truck maker. The rechristened Tata Daewoo Commercial Vehicles Company has launched several new products in the Korean market, while also exporting these products to several international markets. Today two-thirds of heavy commercial vehicle exports out of South Korea are from Tata Daewoo. In 2006, Tata Motors formed a 51:49 joint venture with the Brazil-based, Marcopolo, a global leader in body-building for buses and coaches to manufacture fully-built buses and coaches for India - the plant is located in Dharwad. In 2006, Tata Motors entered into joint venture with Thonburi Automotive Assembly Plant Company of Thailand to manufacture and market the company's pickup vehicles in Thailand, and entered the market in 2008. Tata Motors (SA) (Proprietary) Ltd., Tata Motors' joint venture with Tata Africa Holding (Pty) Ltd. set up in 2011, has an assembly plant in Rosslyn, north of Pretoria. The plant can assemble, semi knocked down (SKD) kits, light, medium and heavy commercial vehicles ranging from 4 tonnes to 50 tonnes.
Tata Motors is also expanding its international footprint, established through exports since 1961. The company's commercial and passenger vehicles are already being marketed in several countries in Europe, Africa, the Middle East, South East Asia, South Asia, South America, CIS and Russia. It has franchisee/joint venture assembly operations in Bangladesh, Ukraine, and Senegal.
The foundation of the company's growth over the last 68 years is a deep understanding of economic stimuli and customer needs, and the ability to translate them into customer-desired offerings through leading edge R&D. With over 4,500 engineers, scientists and technicians the company's Engineering Research Centre, established in 1966, has enabled pioneering technologies and products. The company today has R&D centres in Pune, Jamshedpur, Lucknow, Dharwad in India, and in South Korea, Italy, Spain, and the UK.
Page 21

Objectives and Strategies of M&A
It was Tata Motors, which launched the first indigenously developed Light Commercial Vehicle in 1986. In 2005, Tata Motors created a new segment by launching the Tata Ace, India's first indigenously developed mini-truck. In 2009, the company launched its globally benchmarked Prima range of trucks and in 2012 the Ultra range of international standard light commercial vehicles. In their power, speed, carrying capacity, operating economy and trims, they will introduce new benchmarks in India and match the best in the world in performance at a lower life-cycle cost.
Tata Motors also introduced India's first Sports Utility Vehicle in 1991 and, in 1998, the Tata Indica, India's first fully indigenous passenger car.
In January 2008, Tata Motors unveiled its People's Car, the Tata Nano. The Tata Nano has been subsequently launched, as planned, in India in March 2009, and subsequently in 2011 in Nepal and Sri Lanka. A development, which signifies a first for the global automobile industry, the Nano brings the joy of a car within the reach of thousands of families.
Tata Motors is equally focussed on environment-friendly technologies in emissions and alternative fuels. It has developed electric and hybrid vehicles both for personal and public transportation. It has also been implementing several environment-friendly technologies in manufacturing processes, significantly enhancing resource conservation.
Through its subsidiaries, the company is engaged in engineering and automotive solutions, automotive vehicle components manufacturing and supply chain activities, vehicle financing, and machine tools and factory automation solutions.
Tata Motors is committed to improving the quality of life of communities by working on four thrust areas - employability, education, health and environment. The activities touch the lives of more than a million citizens. The company's support on education and employability is focused on youth and women. They range from schools to technical education institutes to actual facilitation of income generation. In health, the company's intervention is in both preventive and curative health care. The goal of environment protection is achieved through tree plantation, conserving water and creating new water bodies and, last but not the least, by introducing appropriate technologies in vehicles and operations for constantly enhancing environment care.
With the foundation of its rich heritage, Tata Motors today is etching a refulgent future.
Note:
We are going to look into the Valuation part of TATA acquiring JLR. Using different analysis such as consolidated balance sheet, P&L, & Cash flow statements of both (Acquirer and Target companies). And we also analyses how TATA leveraged acquiring JLR to its crown in chapter 4 & 5.
Page 22

Objectives and Strategies of M&A
3.3 Company profile of Diageo
Diageo is the world's leading premium drinks business with an outstanding collection of beverage alcohol brands across spirits, beer and wine. These brands include Johnnie Walker, Crown Royal, J&B, Windsor, Buchanan's and Bushmills whiskies, Smirnoff, Ciroc and Ketel One vodkas, Baileys, Captain Morgan, Tanqueray and Guinness.
Many of our brands have been around for generations, while some have been developed more recently to meet new consumer tastes and experiences. Our great range of brands and geographic spread means that people can celebrate with our products at every occasion no matter where they are in the world. This is why 'celebrating life every day, everywhere' is at the core of what we do.
Trading in approximately 180 countries, we employ over 28,000 talented people around the world. With offices in 80 countries, we also have manufacturing facilities across the globe including Great Britain, Ireland, United States, Canada, Spain, Italy, Africa, Latin America, Australia, India and the Caribbean. And the people who work for us across these markets really care for the legacy of each of our brands. We want them to be enjoyed by consumers for generations to come, which means we also take our role as a producer of alcohol very seriously. Diageo is at the forefront of industry efforts to promote responsible drinking.
The company is listed on both the London Stock Exchange (DGE) and the New York Stock Exchange (DEO). The following information is registered with the Registrar of Companies for England and Wales.
HistoryDiageo is still a relatively young company – we have only existed in our current form since 1997- but our brands and our business have a rich heritage.
For example our earliest ancestor company formed in 1749, is Justerini & Brooks - wine merchants, and blenders of the famous J&B whisky range. 10 years after that, in 1759 Arthur Guinness signed the lease on the now world famous St James's Gate brewery in Dublin, going on to create a globally iconic brand.
Many of our distilleries were also fired-up in the late eighteenth century. Through the nineteenth and twentieth centuries our range of brands and our business continued to innovate and expand under various parent companies, and in 1997 Diageo was created through the merger of Grand Metropolitan Public Limited Company and Guinness PLC, creating a food and drinks conglomerate which included the world's greatest collection of premium drinks.
Between 2000 and 2002 we made the strategic decision to exit our food interests – with Burger King and Pillsbury being the two main divestments - and to focus exclusively on premium beverage alcohol. It was during this period, in 2001, that we acquired additional spirits and wine brands from Seagram, and we have subsequently expanded our range through both selective long term value acquisitions, strategic partnerships and innovation.
While we look always to the next step in the Diageo journey, we are grateful for the strength which the long and rich heritage of our brands brings to our company.
Page 23

Objectives and Strategies of M&A
3.4Company Profile of United Spirits LTD
United Spirits Limited (USL) is the largest Alcobev Company in India selling 123.7 million cases for the fiscal ending March 31st, 2013.
One of the leading global players with a portfolio of more than 140 brands, of which several are global iconic brands across flavors. The company has twenty-one brands in its portfolio that sell more than a million cases each year, of which five brands each sell more than 10 million cases annually, Additionally it also has nine brands that sell over half a million cases each year. USL brands in the prestige and above segment including McDowell's No.1, Royal Challenge, Signature Antiquity and Black Dog constitute a quarter of the company's total annual volume.
The company enjoys a strong 59% market share for its first line brands in India. United Spirits' brands have won the most prestigious awards for flavors, ranging from Mondial to International Wine and Spirit Competition (IWSC) to International Taste & Quality Institute (ITQI); 184 awards & certificates.
United Spirits has pioneered several innovations that have pushed the paradigm in the industry. This includes the first diet versions of whisky and vodka in India, first pre-mixed gin, the first Tetrapack in the spirits industry in India and the first single malt manufactured in Asia.
USL has a global footprint with exports to over 37 countries. The company has established a strong presence in African and Far Eastern Markets, under its Emerging Markets initiatives. It has a sizeable presence in India with distilleries and sales offices all across the country, and a committed team of over 7500 people dedicated to the fulfillment of the company's mission. It has established manufacturing and bottling plants in every State in India. USL's robust distribution network covers the entire country to deliver its products to customers located anywhere in India.
Whyte & Mackay, Bouvet Ladubay, Four Seasons Wines Limited and Royal Challengers Sports Private Limited, are 100% subsidiaries of USL.
History:
United Spirits Limited's (USL) history arcs through the space-time-continuum, leaping backwards to the British Raj of the 19th Century, trotting through the license Raj of an Independent and Socialist India - through the 50s, 60s, 70s and 80s, coming into its own at the cusp of the new millennium and now in the Info Age, the clear Numero Uno in the world alcohol beverages market.
Page 24
Objectives and Strategies of M&A
CHAPTER 4
ANALYSING AND INTERPRETATION
Case study 1
Tata Group buys Jaguar Land Rover
The Tata acquisition of Jaguar Land Rover is a superb example to include in research notes on takeovers and mergers. At the time (early 2008), Tata’s investment in JLR seemed to be poorly timed and there were many critics who questioned the strategic logic of the move as well as its timing. Shortly after the takeover, demand in the global market for luxury cars collapsed as a result of the financial crisis and Tata was forced to refinance to support its investment.
Several years later, however, the takeover appears to be a compelling example of a successful acquisition which is generating substantial shareholder value for Tata as well as continued support from JLR’s many stakeholder groups in the UK.
Background
Jaguar Land Rover (JLR):
- Jaguar Cars bought by Ford in 1989
- Land Rover bought by Ford from BMW for $1.4bn in 1989
- A difficult relationship between the UK firm and its US owners
- Jaguar fell into heavy losses whilst owned by Ford (reaching up to $600million per year)
- However, Ford invested heavily in new model development
Tata Group:
- One of India’s largest private conglomerates - used to investing in the UK
- Bought Tetley Tea in 2000
- Bought Corus Steel - a big supplier to JLR - in 2007
- Tata Motors - was already India’s third largest car-maker, but struggling with a poor image and hampered by rising raw material costs
Page 25

Objectives and Strategies of M&A
The Deal
- Ford sells JLR to Tata for in March 2008 just over £1bn - just a few months before a collapse in global demand in the international car market
- Tata financed the takeover with $3bn of new long-term loans
- The price paid by Tata was approximately half of what Ford paid to buy Jaguar and Land Rover.; + Ford had continued to incur heavy losses in Jaguar as it failed to turn the business around.
- The deal took over a year to agree - which may have helped with the post-merger integration. Tata recognised that it would continue to need support from Ford who are a main supplier of car components to the two brands.
- No significant change proposed to the businesses by Tata. They claimed that staff, trade unions and the UK government had been kept informed about the proposed takeover and supported the move.
- The deal has been endorsed by trade unions, which secured a commitment from Tata to continue with JLR’s production plans until the end of 2011. This includes development of new models.
Key drivers of / motives for the takeover
- Acquiring JLR would provide significant potential for revenue synergies, including giving Tata greater international distribution, broader product range and better customer service skills
- Tata gains access to world-class engineering capability
- Strengthens relationship between Tata’s steel and motoring businesses
What happened next?
Significant slump in new car sales in late 2008 as a result of the credit crunch; Tata had to refinance in order to keep JLR solvent. UK government considered a financial aid package, indicating the strategic importance of JLR to the UK economy
February 2010: Tata secures a £340million loan from the European Investment Bank to support JLR through recession
May 2011: Tata announces £5b five year investment programme in JLR - focused on new product development & new equipment at JLR three UK plants + investment in a planned factory in China. JLR also to link closer with Tata Steel to provide new lightweight steel alloys for new car models.
Page 26

Objectives and Strategies of M&A
November 2011: JLR announces 1,000 new jobs a Land Rover plant in Solihull boosted by rising demand for SUVs in China, Russia, India and Brazil.
February 2012: Soaring sales of Jaguar and Land Rover cars have helped Indian firm Tata Motors to a huge rise in profits (up 41% on 2010). JLR arm saw sales rise 37%, helped by selling 32,000 of its new Range Rover Evoque. China overtakes the UK as JLR’s biggest market.
March 2012: JLR and Chery Automobile agree a joint venture that should pave the way for production of Jaguar and Land Rover cars in China.
April 2012: JLR announces that it will build a successor to its previous sports cars called the F-type at its factory in Birmingham.
Other evidence of success / failure?
2012: Share price of Tata Motors makes it the-best performing major car maker (up 70%)JLR worth $14 billion, according to the average estimate of three analysts surveyed by Bloomberg (compare with takeover price of approx)
“There has been one triumph; JLR, where earnings have soared despite a near-death experience after the 2008 crash. A chunk of the recovery is due to the fall of the pound: JLR’s plants are mainly in Britain, though it sells largely in other countries. But that is not the whole story. Under Tata’s ownership JLR has also launched a killer product, the Range Rover Evoque, and cracked emerging markets, not least China. “
Page 27
Objectives and Strategies of M&A
Consolidated P&L Account in RS CroresParticulars Mar' 08 Mar'11 Mar'12 Mar'13 Income
Sales Turnover40,089.3
1 122,127.9
2165,654.4
9188,817.6
3
Excise Duty 4,676.12 0 0 0
Net Sales35,413.1
9 122,127.9
2165,654.4
9188,817.6
3
Other Income 652.87 660.47 -169.77 208.82
Stock Adjustments 0.3 1,836.19 2,535.72 3,031.43
Total Income36,066.3
6 124,624.5
8168,020.4
4192,057.8
8
Expenditure
Raw Materials25,111.8
1 82,033.81113,220.5
4124,746.4
0
Power & Fuel Cost 377.72 851.6 1,017.19 1,069.06
Employee Cost 2,745.16 9,342.67 12,298.45 16,584.05
Other Manufacturing Expenses 683.68 997.55 1,389.23 2,021.59
Selling and Admin Expenses 1,968.81 0 0 0
Miscellaneous Expenses 1,870.27 13,921.00 17,953.56 22,880.66
Preoperative Exp Capitalised-
1,360.70 0 0 0
Total Expenses31,396.7
5 107,146.6
3145,878.9
7167,301.7
6
Mar '08 Mar '11 Mar '12 Mar '13
Operating Profit 4,016.74 16,817.48 22,311.24 24,547.30
PBDIT 4,669.61 17,477.95 22,141.47 24,756.12
Interest 800.35 2,385.27 2,982.22 3,553.34
PBDT 3,869.26 15,092.68 19,159.25 21,202.78
Depreciation 782.07 4,655.51 5,625.38 7,569.30
Other Written Off 0.9 0 0 0
Profit Before Tax 3,086.29 10,437.17 13,533.87 13,633.48
Extra-ordinary items 0 0 0 0
PBT (Post Extra-ord Items) 3,086.29 10,437.17 13,533.87 13,633.48
Tax 851.54 1,216.38 -40.04 3,770.99
Reported Net Profit 2,234.75 9,220.79 13,573.91 9,862.49
Minority Interest 132.25 48.52 82.33 83.67
Share Of P/L Of Associates -65.2 -101.35 -24.92 -113.79
Net P/L After Minority Interest & Share Of Associates 2,167.70 9,042.61 14,348.04 10,495.32
Total Value Addition 6,284.94 25,112.82 32,658.43 42,555.36
Preference Dividend 0 0 0 0
Equity Dividend 578.43 1,274.23 1,280.70 645.2
Corporate Dividend Tax 98.31 207.07 207.92 110.94
Per share data (annualised)
Shares in issue (lakhs) 3,855.04 6,346.14 31,735.47 31,901.16
Earning Per Share (Rs) 57.97 145.3 42.77 30.92
Equity Dividend (%) 0 0 0 0
Book Value (Rs) 224.95 302.1 104.46 117.98
Page 28

Objectives and Strategies of M&A
Consolidated Balancesheet Of TATA Motors in Rs croresSource of funds March'2008 March'2011 March'2012 March'2013
Total Share Capital
385.54
637.71
634.75
638.07
Equity Share Capital
385.54
637.71
634.75
638.07
Share Application Money
-
-
-
-
Preference Share Capital
-
-
-
-
Init. Contribution Settler
-
-
-
-
Preference Share Application Money
-
-
-
-
Employee Stock Opiton
-
-
-
-
Reserves
8,286.47
18,533.76
32,515.18
36,999.23
Revaluation Reserves
25.51
-
-
-
Networth
8,697.52
19,171.47
33,149.93
37,637.30
Secured Loans
6,011.87
18,745.66
15,774.04
16,981.04
unsecured Loans 5,573.00
11,616.49
22,930.03
26,741.24
Total Debt
11,584.87
30,362.15
38,704.07
43,722.28
Minority Interest
468.31
246.60
307.13
370.48
Policy Holders Funds
-
-
-
-
Group Share in Joint Venture
-
-
-
-
Total Liabilities
20,750.70
49,780.22
72,161.13
81,730.06
Application Of Funds
Gross Block
13,163.68
71,757.47
87,926.36
98,046.05
Less: Accum. Depreciation
6,060.49
36,408.42
43,565.95
42,877.77
Net Block
7,103.19
35,349.05
44,360.41
55,168.28
Capital Work in Progress
6,326.41
11,456.79
15,945.83
18,417.70
Investments
2,665.83
2,544.26
8,917.71
9,057.72
Page 29

Objectives and Strategies of M&A
Inventories
3,294.64
14,070.51
18,216.02
20,969.01
Sundry Debtors
2,060.51
6,525.65
8,236.84
10,942.66
Cash and Bank Balance
1,090.51
11,409.60
18,238.13
21,112.67
Total Current Assets
6,445.66
32,005.76
44,690.99
53,024.34
Loans and Advances
10,609.71
19,658.32
31,467.70
34,358.41
Fixed Deposits
2,742.66
-
-
-
Total CA, Loans & Advances
19,798.03
51,664.08
76,158.69
87,382.75
Deffered Credit
-
-
-
-
Current Liabilities
12,824.32
41,276.83
60,379.75
72,224.55
Provisions
2,325.37
9,957.13
12,841.76
16,071.74
Total CL & Provisions
15,149.69
51,233.96
73,221.51
88,296.39
Net Current Assets
4,648.34
430.12
2,937.18
- 913.64
Minority Interest
-
-
-
-
Group Share in Joint Venture
-
-
-
-
Miscellaneous Expenses
6.93
-
-
-
Total Assets
20,750.70
49,780.22
72,161.13
81,730.06
Page 30

Objectives and Strategies of M&A
TATA Motor Financial ratio
ParticularsMarch'2008
March'2011
March'2012
March'2013
Investment Valuation Ratios
Face Value 10 10 2 2
Dividend Per Share -- -- -- --
Operating Profit Per Share (Rs) 104.19 264.91 70.3 76.95
Net Operating Profit Per Share (Rs) 918.62 1,937.13 521.62 591.88
Free Reserves Per Share (Rs) 191.47 359.04 -- --
Bonus in Equity Capital 28.86 17.53 17.53 17.44
Profitability Ratios
Operating Profit Margin(%) 11.34 13.77 13.46 13
Profit Before Interest And Tax Margin(%) 9.04 9.92 10.03 8.95
Gross Profit Margin(%) 9.13 9.95 10.07 8.99
Cash Profit Margin(%) 7.6 11.13 12.04 9.51
Adjusted Cash Margin(%) 7.6 10.9 12.05 9.51
Net Profit Margin(%) 6.06 7.48 8.13 5.21
Adjusted Net Profit Margin(%) 6.06 7.56 8.12 5.21
Return On Capital Employed(%) 17.72 25.41 24.14 21.86
Return On Net Worth(%) 25.01 48.37 40.77 26.28
Adjusted Return on Net Worth(%) 22.37 46.51 44.05 27.8
Return on Assets Excluding Revaluations 224.77 299.77 103.03 117.98
Return on Assets Including Revaluations 225.43 302.05 103.03 117.98
Return on Long Term Funds(%) 24 31.94 24.29 25.5
Liquidity And Solvency Ratios
Current Ratio 0.88 0.76 1.03 0.81
Quick Ratio 1.17 0.75 0.72 0.7
Debt Equity Ratio 1.34 1.58 1.17 1.16
Long Term Debt Equity Ratio 0.72 0.9 0.84 0.85
Debt Coverage Ratios
Interest Cover 4.83 5.28 5.82 5.01
Total Debt to Owners Fund 1.34 1.72 1.18 1.16
Financial Charges Coverage Ratio 5.46 5.88 7.7 7.14
Financial Charges Coverage Ratio Post Tax 4.69 5.62 7.42 5.91
Management Efficiency Ratios
Inventory Turnover Ratio 12.79 8.68 9.09 9
Debtors Turnover Ratio 18.82 17.81 22.44 19.69
Page 31
Objectives and Strategies of M&A
Investments Turnover Ratio 12.79 9.21 9.37 9.23
Fixed Assets Turnover Ratio 2.87 2.06 2.34 2.51
Total Assets Turnover Ratio 1.65 3.28 3.02 3.2
Asset Turnover Ratio 2.87 2.08 2.67 2.46
Average Raw Material Holding 23.39 12.3 -- --
Average Finished Goods Held 14.94 35.98 -- --
Number of Days In Working Capital 62.55 7.58 5.41 -1.74
Profit & Loss Account Ratios
Material Cost Composition 70.91 66.73 68.39 66.06Imported Composition of Raw Materials Consumed -- -- -- --
Selling Distribution Cost Composition 3.72 9.17 -- --
Expenses as Composition of Total Sales -- -- -- --
Cash Flow Indicator Ratios
Dividend Payout Ratio Net Profit 31.21 15.97 11.01 7.64
Dividend Payout Ratio Cash Profit 22.93 10.63 7.77 4.33
Earning Retention Ratio 65.09 83.27 89.67 92.78
Cash Earning Retention Ratio 75.14 89.04 92.57 95.81
AdjustedCash Flow Times 4.26 2.43 1.93 2.42
Page 32

Objectives and Strategies of M&A
4.5 TATA Motor stock Performance During Deal process:
Note:TATA Motor stock value nose-dived in the mid 2008, may be due to deep recession in that period as well as the negative market scentiments about the tata acquiring JLR. The acquisition proposal was made in 2007 itself when there was scent of recession ahead. Yet, the TATA went ahead to acquire JLR. The graph above displays an upward climbe of TATA Motor share value from 2009-2010 onwards with not so significant fluctuations. With suggest that TATA strategy behind acquiring JLR has yielded fruitful results as vision by tata completed by the slow but steady global economic recovery. More over TATA operations concentrate in domestic market (India) and the emerging economyof India also must have contributed for the up suiting of value of TATA motor stock value.
Over all strategy of acquiring JLR is not bad.
TATA JLR Case Analysis
Page 33

Objectives and Strategies of M&A
Based on the empirical evidence I have presented in both stock market performance and the case studies, I conclude that large foreign acquisitions by Indian firms have not created shareholder value for the acquiring firms and have probably destroyed shareholder value. The Economist comes to a similar conclusion that “several of corporate India’s acquisitions now seem ill-advised.” The causes of this negative outcome are too little integration to achieve synergies, agency problems, and inadequate discipline due to easy capital. Examples: TATA Acquiring Corus.
4.6 SYNERGIES FROM THE DEAL:
The deal was anticipated to generate a lot of synergies such as well known brands, customer preferences for that car brands, emerging Indian car market, product being taken over by Tata group. This Deal generates two synergies such as Cost Synergies and Revenue Synergies. In the Cost Synergies the TATA Motors has the Competitive Advantage from the overall International Market through the Tata Group.
Cost Synergies include the following things:
· The TATA motors have Joint Venture in Auto Ancillary Space.
· In International Market they have acquired Corus, which provided the Raw Material at lower Cost for manufacturing Cars.
· Tata Consultancy Services provide the help regarding the engineering design.
Revenue Synergies:· It was expected in the long run TATA group and Tata Motors should help Jaguar & Land Rover diversified the geographic dependence.
Page 34

Objectives and Strategies of M&A
The company reported a 37 per cent rise in its revenue to £13.5 billion (Rs 1.10 lakh crore) and a 43 per cent jump in its net profit to £1.48 billion (Rs 12,062 crore) in FY12 – more than the acquisition price in 2008.
Obviously, Tata Sons director R K Krishna Kumar is elated. “In the long run, shareholders have benefitted from our daring moves… JLR being one of them,” he said.
The company now has a 30-product actions (products with variants) planned for the next three to five years that has the potential to expand the market and boost profit. All-aluminium product line-ups targeting new customer segments and better geographical penetration are also in the works.
The deal hasn’t been without hiccups. Initial all we worry about the deal was that the JLR acquisition increased Tata Motors’s debt-equity ratio 3.03 in 2008-09 from 1.1 a year ago. Just after taking over, Tata Motors faced its toughest challenge when it incurred a £300 million loss in the first year, with JLR sales slumping by a third. This was followed by labour problems and negotiations with the British government for access to loans and guarantees. However, in August 2009, it raised £469 million through global depository shares. It was the beginning of the turnaround story.
Since then, the company has raised money through several bond issues, which allowed it greater strategic flexibility to invest in modernisation of plant, product development, and expansion into emerging markets.
The company turned profitable in 2010-11, when it reported £1.03 billion
When current CEO Ralf Speth joined the company about two years ago, Tata Motors retained most of the management, including the heads of marketing, product development and production. They continue to oversee the execution of its product strategy expansion and investments.
Page 35

Objectives and Strategies of M&A
Chapter 5
CASE Study 2
Would the wine turn sweet?
Diageo Acquiring USL:
A cool breeze meandered in the hot atmosphere of financial market on November 9, 2013. Diageo Inc, the world's largest distiller by revenue, tendered an offer to buy stakes of United Spirits Ltd. Shares of United Spirit registered the biggest surge since 1995, as the prices of shares rose by 35% from 1359 INR to 1834 INR(Exhibit:1). The market capital of United Spirits Limited rose by 6211 crore INR to 23995 crore INR. Shares of distilleries and breweries corporations surged 1to 27% after the announcement of Diageo-US deal .
United Spirits Limited was the flagship company of United Breweries (UB) Group, a conglomerate found by Thomas Leishman in 1957. Vittal Mallya, an academic product of Presidency College (Kolkata) who was a part of UB group, was appointed the director at the age of 22. Mallya, who was the first Indian to serve as director of UB Group, steadily built the UB Empire 2 with a careful mix of diversification .
After sudden demise of Vittal Mallya, the UB board unanimously elected his son Vijay Mallya as the Chairman of UB Group after his father's demise. Vijay Mallya consolidated various corporations under one group and divorced non-core and loss-making business. With a prudent focus on core business, Mallya turned UB Group from beer and spirits company (during his father regime), to 2nd largest drinks conglomerate in world today .
Mallya, who was popular in media for his flamboyant lifestyle, was under considerable pressure today to revive the dwindling business in UB Group. The airline business, Kingfisher airlines, was stranded on ground due to lack of capital funding and non payment of wages to workers. United Spirits was carrying a substantial amount of debt (Exhibit: 2)and witnessing a plunge in profits (Exhibit: 3). Speculations brewed across the market as whether the proceeds from the acquisition would be ploughed back to reduce the debt of United Spirits or channelled to revive the faltering business of Kingfisher airlines.
Page 36

Objectives and Strategies of M&A
“I am doing what is best for my businesses. I believe that I have done what is best for my spirits business. I will be doing what is best for Kingfisher Airlines separately, and I would be doing (it) fairly and squarely.” – Vijay Mallya
The largest spirits company by volume was all set to marry the largest distilleries company by revenues. Diageo appointed JM Financial as lead transaction and financial advisor, while Slaughter & May and Platinum Partners were appointed as the legal advisor. Deloitte LLP performed the financial and tax due diligence services to the British liquor company. For United Spirits, Citigroup Global Markets were chosen as the lead financial adviser and Amit Corporate Finance advised UB Holdings on tax and structural related issues.
The acquisition of United Spirits by Diageo Inc was seen to be pivotal for Diageo's strategy to venture into Indian wine market. The market was growing at a rate of fifteen percent with rising preference of premium brands. The increasing state norms made it extremely tough for a foreign player to set foot in the market, with each state drafting its own laws on production, distribution and sale of liquor. For instance, spirits in Tamil Nadu are sold through government machineries and procurement is done through the manufacturing units licensed within the State. Foreign players cannot import and sell their brands without paying a hefty import duty of 150 percent. With 40 manufacturing units and 42 sub contracting units across India, United Spirits omnipresence in almost every India state with its robust supply chain made it a top candidate for Diageo.
The acquisition was planned in two steps. In the first step, Diageo would acquire 19.3 percent stake in United Spirits from four entities:12.8 percent from UB Holdings, 3.35 percent from Palmer Investment, 2.64 percent from United Spirits Limited Benefit Trust and remaining 0.51 percent from UB Sports Management.
In addition to acquiring stakes from the four entities, Diageo would acquire 10 percent shares from United Spirits through a preferential share allotment at 1440 INR per share. The preferential share allotment needs the approval of shareholders. In case the shareholdersdo not approve the preferential share allotment, UB Holdings would sell additional shares in United Spirits to make sure that Diageo obtains a minimum shareholding of 25.1 percent.
Incidentally, Diageo was the first foreign liquor company to venture into Indian market, formed a joint venture with Kilachand Group before an exit. The venture was taken over by director Deepak Roy in a management buyout and remanded to Triumph. Distilleries. Triumph Distilleries was acquired by Vijay Mallya in 2005.
The acquisition of shares greater than 24.99% would trigger an open offer, which would comprise the second step of acquisition 9. As per SEBI guidelines, if the acquirer acquired more than 25% of shares, then it is supposed to purchase (from existing shareholders) a minimum of 26% of additional shares of the target company.
Page 37

Objectives and Strategies of M&A
However the acquisition was looming with speculative problems. As per the FY11 and FY12 annual report of United Spirits Limited, Palmer Investment Group is a100 percent subsidiary. Section 42 of Companies Act restricted any subsidiary from holding shares in parent company or any inter-se transfer of shares from a parent company to its subsidiary. Palmer, UB Sports and USL Benefit, which were the subsidiaries (Exhibit: 4) of United Spirits Limited made is difficult for the deal to proceed. However, Palmer became USL's subsidiary as a result of merger between USL and Zlika Ltd (a Cyprus based company). An exception to the Section 42 of companies act, subsection (2) granted exemptions to the deal where: 1.The subsidiary is concerned as the legal representative of deceased member of the holding company, 2.The subsidiary in concern is a trustee, unless the holding company thereof is beneficially interested under the trust.
While Morgan Stanley has put the target price at 1,905 INR and CLSA's price target is 1,800 INR and raised its rating to 'buy', Religare set the target price at an even higher 2,100 INR. JP Morgan also raised the rating to equivalent buy. Market seemed to echo a coherent belief that the deal would benefit United Spirits by reducing debt levels, increasing earnings, impose financial discipline and yield operational advantages. The price paid by Diageo was 20 x multiple of USL's earnings before interest, tax, depreciation and amortization. An investment banker noted that the capital intensive nature of the business attracted 8x to 10x EBITDA multiple as the norm 11.
United Spirit's valuation ratios were no different and reflected the investment banker's comments.
From subsidiaries being the promoters to the offer price of 1440 INR lower than the current market price of 1791.5 INR, media was abuzz with negative speculation concerning the merger. The shareholders of United Spirits wondered whether should they tender the shares to Diageo, retain the shares with themselves or exit the secondary market. However, the king of good times Vijay Mallya was fighting the tough times. Would Diageo be made to shell more cash out of its pocket to lure USL investors? Was the valuation of USL share reflective of the market belief? Would the deal go through? All such questions girdled the financial market as the analysts continue to monitor the scenario closely. Would this marriage be approved by the guardians? With the current market share price pegged at 1791.5 INR, it looks unlikely that shareholders of US would tender their shared for 1440 INR/share price offer of Diageo.
Page 38

Objectives and Strategies of M&A
5.1USL DIAGEO TRANSACTION
Background: On 9th November 2012, Transaction between Diageo plc (along with PAC) and UB group (UBH) was announced. The public announcement was made by JM Financial Institutional Securities Pvt. Ltd., on behalf of acquirer Diageo and PACs , to inform the exchange of the open offer by Diageo to acquire up to 37,785,214 fully paid up equity shares of face value of Rs. 10.0 (Rupees ten only) each of the United Spirits Ltd at a price of INR 1440 per share .
The transaction announced by the company and its agents is as under;
1. Diageo and PAC will acquire a 19.3% interest (25,226,839 shares) in the current share capital of USL at a price of INR 1440 per share from the UBHL group, the USL Benefit Trust, Palmer Investment Group Limited and UB Sports Management (two subsidiaries of USL) and SWEW Benefit Company (a company established for the benefit of certain USL employees).
2. Following this disposal, the UBHL group would continue to have a shareholding in USL amounting to 14.9% of current share capital.
3. Diageo has reached agreement with USL (PAA) under which the shareholders of USL will be asked to approve (by special resolution) the preferential allotment of new shares (14,532,775 shares) to Diageo, at a price of INR 1440 per share. The price is subject to applicable pricing rules under Indian regulations. These new shares will amount to 10% of USL’s post-allotment enlarged share capital. UBHL will vote in favour of the resolution. The preferential allotment is subject to certain conditions including USL shareholder approval and if successful, combined with the above acquisition of shares, would result in Diageo owning27.4% (39,759,614 shares) of the enlarged share capital of USL.
4. These agreements trigger an obligation on Diageo to launch a Mandatory Tender Offer tothe public shareholders of USL. Diageo has therefore also announced that it will launch atender offer to acquire, at a price of INR 1440 per share, a maximum of 37,785,214 shares,
Page 39

Objectives and Strategies of M&A
which equates to 26% of the enlarged share capital of USL.
5. In certain circumstances where the preferential allotment is not successful (including where it is not approved by the shareholders of USL), UBHL has agreed to sell additional shares ( 7,602,698 shares) in USL to Diageo at a price of INR 1440 per share to ensure thatDiageo has a minimum shareholding of 25.1%.
6. In addition, if the share purchase agreement, the preferential allotment and the tender offer do not result in Diageo holding a majority interest in USL, UBHL has agreed to vote its remaining shareholding in USL as directed by Diageo for a four year period. UBHL will also vote its USL shares to enable Diageo to ensure that its nominees are appointed to the USL board.
7. In the event that Diageo does not acquire a majority interest it is likely that a minimumshareholding of 25.1%, together with the voting arrangements and other governance arrangements agreed with the UBHL group and its relationship with Dr Mallya as Chairman of USL, would enable Diageo to reflect the results of USL in its consolidated accounts.
Target USLAcquirer Relay BVPACs PAC1,PAC2,PAC3,And PAC4Sellers Sellers (as defined in glossary of terms)Modes of acquisition Proposed i. Secondary Purchase
Acquisition of Sale Shares by Acquirer from the Sellers under the SPA representing 17.36% of the Emerging Voting Capital of the Target. ii. Primary Subscription Allotment of Subscription Shares by the Target under the PAA representing 10% of the Emerging Voting Capital. iii. Open Offer Open Offer made by the Diageo Group to the Public Shareholders of the Target under the Takeover Code for the acquisition of 26% shares in the Target.
Total contemplated acquisition 53.36% of the Emerging Voting Capital of the Target.
Total action acquisition 36,359,192 shares representing 25.02% of the Emerging voting capital of the Target. Secondary Purchase (under the SPA)
• From UBHL: 9,070,595 Equity Shares, representing 6.24% of the Emerging Voting Capital of the Target
• From KFIL: 7,646,392 Equity Shares, representing 5.26% of the Emerging Voting Capital of the Target.
Page 40

Objectives and Strategies of M&A
• From SWEW: 125,531 Equity Shares, representing 0.09% of the Emerging Voting Capital of the Target.
• From PIGL: 4,376,771 Equity Shares, representing 3.01% of the Emerging Voting Capital of the Target. • From UB Sports:
548,460 Equity Shares, representing 0.38% of the Emerging Voting Capital of the Target.
The above acquisitions of Equity Shares of the Target represents 14.98% of the Emerging Voting Capital of the Target.
i.It is to be noted that the shares held by USL Benefit Trust, comprising of 3,459,090 Equity Shares, representing 2.38% of the Emerging Voting Capital of the Target, which was part of the Sale Shares under the SPA, could not be acquired as USL Benefit Trust was unable to obtain the necessary lender approvals.
ii. Primary Subscription (under the PAA) Subscription to the Subscription Shares pursuant to the PAA representing 10% of the Emerging Voting Capital of the Target. iii. Open Offer Acquisition of Equity Shares from the Public Shareholders representing 0.04% of the Emerging Voting Capital of the Target.
Total acquisition (after completion of PAA, SPA and Open Offer)
25.02% of the Emerging Voting Capital in the Target
Acquisition Price INR 1,440 (Rupees one thousand and four hundred and forty) per each share.
Total Consideration Sale Shares consideration INR 31,430,040,480 (Rupees thirty one billion, four hundred and thirty million, forty thousand, four hundred and eighty only).
• Open Offer INR 84,481,920 (Rupees eighty four million, four hundred and eight one thousand, nine hundred and twenty only).
Page 41

Objectives and Strategies of M&A
• Preferential Allotment price INR 20,927,196,000 (Rupees twenty billion nine hundred and twenty seven million, one hundred and ninety six thousand only)
• Total purchase consideration Approx. INR 52,441,718,400 (Rupees fifty two billion four hundred and forty one million, seven hundred and eighteen thousand, and four hundred only).
USL Total Income & Expenditure: In RS crores
March'09 March'10 March'11 March'12 March'130.00
1,000.00
2,000.00
3,000.00
4,000.00
5,000.00
6,000.00
7,000.00
8,000.00
9,000.00
4,319.79
5,171.84
6,747.39
7,889.26
8,517.79
3,637.29
4,293.33
5,682.69
6,773.277,305.80
Total IncomeTotal Expenses
Note: After Ananlysing the above chart United spirirts Ltd Incomes and expenditure. It was in line with the growth path of healthy 11%. And in line with Industry standard.Strategic brands of the Company continue to perform well. The No.1 McDowell’s Whisky family has registered a healthy growth of just under 25 percent.
The company’s key strengths include its strong market position in the Indian alcoholic beverages industry supported by leadership position across segments, wide product portfolio and well established brands. With the industry being highly regulated and governed by restrictions across the value chain, United Spirits’ pan India foot print in manufacturing and
Page 42

Objectives and Strategies of M&A
distribution supports its position against rising competitive pressures. The company’s overall strategy to enhance the share of more profitable premium segment brands both in India and around the world also player key role in incresing the revenues.
USL operating profit & PBT: In Rs crores
Note:Company was growing at double digit, but PBT showing that company profit are going to the downwardside due to higher interest payment of debt it took. It has a total debt of 81,864crores (39,692 is secured & 31,691 is unsecured).So company need to adjust its debt/equity ratio to reduce debt to show positive PBT & Reported net profit. Company can
Page 43
March'09
March'10
March'11
March'12
March'13
0200400600800
10001200
Operating Profit
Operating Profit
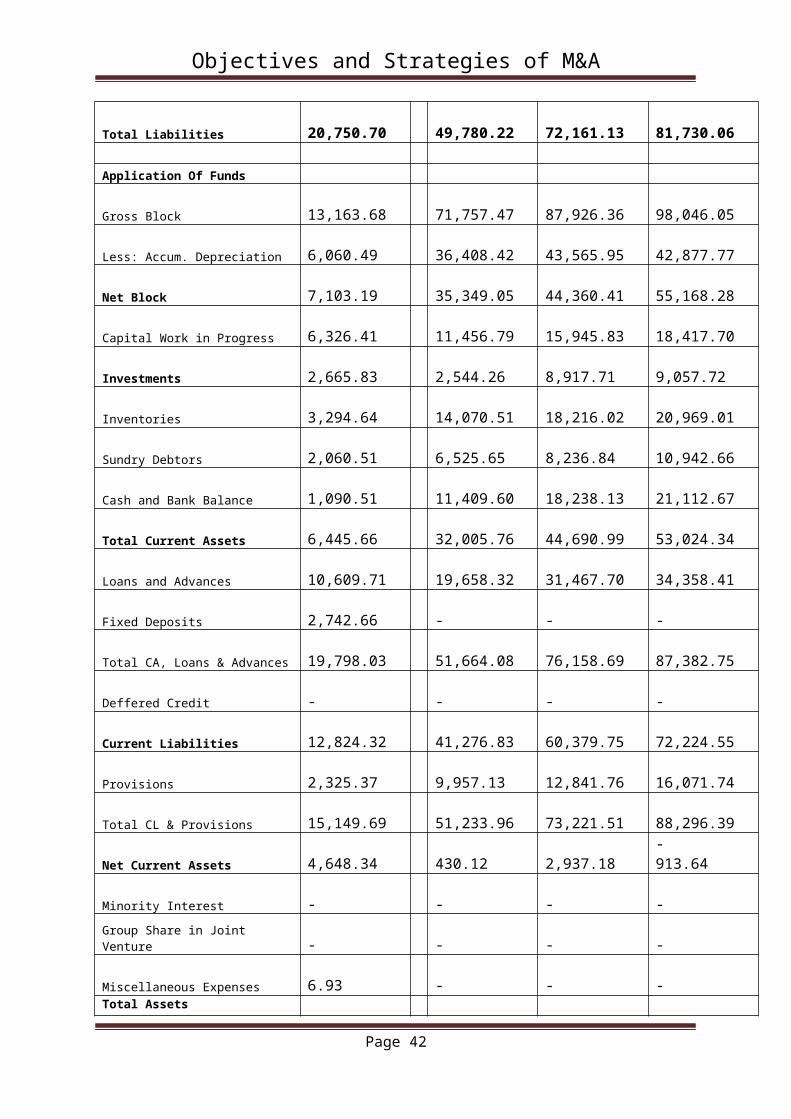
Objectives and Strategies of M&A
premiumize their brands so that they can turn volumes up. And also want to focus on margins.So that it can obtain its objective easily.
March'09 March'10 March'11 March'12 March'130
50
100
150
200
250
300
350
400
450
Reported Net Profit
Reported Net Profit
5.4 United Spirits Consolidated Balance sheet in Million₹
Particulars 31st March 2011 in Million ₹
31st March 2010 in Million ₹
31st March 2009 in Million ₹
Shareholders' Funds
Share capital 1,307.950
1,255.943
1,001.633
Share capital suspense -
-
77.491
Reserves and surplus 49,729.727
46,601.859
29,708.037
Loan Funds
Secured Loans 25,179.658
25,892.537
13,064.790
Unsecured Loans 10,903.812
9,268.220
6,362.590
Foreign Currency Monetary Items translation Difference
-
-
311.347
83,018.559
50,525.888
Application Of funds
Page 44

Objectives and Strategies of M&A
Fixed Assets
Gross Block 11,837.587
9,288.565
7,876.187
Less:Depreciation 2,715.624
2,222.046
1,949.852
Net Block 9,121.96
7,066.519
5,926.335
Capital WIP 592.768
395.842
282.632
9,714.73
7,462.361
6,208.967
Investments 14,532.508
12,539.973
20,514.765
Deferred Tax Assets (Net) 202.736 64.874
216.403
Foreign currency monetary items translation difference
-
323.641
-
Current assets,Loans and advances
Inventories 11,621.315
8,291.882
6,539.691
Sundry debtors 9,585.883
9,461.639
6,650.397
Cash and bank balances 1,597.912
2,464.670
848.628
Other current assets 3,203.092
3,268.493
2,103.003
Loans and advances 51,136.172
50,471.227
16,709.818
77,144.374
73,957.911
32,851.537
Less:Current Liabilities and provisions
Liabilities 13,406.160
10,512.451
8,582.6530
Provisions 1,067.042
817.750
683.1310
14,473.202
11,330.201
9,265.784
Net Current Assets 62,671.172
62,627.710
23,585.753
87,121.147
83,018.559
50,525.888
Page 45

Objectives and Strategies of M&A
5.5 Financial ratios Of USL (Post merger):
Financial Ratios of USL
ParticularMarch'2011
March'2010
March'2009
Investment Valuation ratio Face Value 10 10 10Dividend Per Share -- -- --Operating Profit Per Share (Rs) 89.97 85.96 78.49Net Operating Profit Per Share (Rs) 565.37 506.59 545.08Free Reserves Per Share (Rs) 300.52 275.6 154.29Bonus in Equity Capital -- -- --Profitability Ratios Operating Profit Margin(%) 15.5 16.96 14.4Profit Before Interest And Tax Margin(%) 13.72 15.34 12.49Gross Profit Margin(%) 14.12 15.47 12.7Cash Profit Margin(%) 8.35 4.67 0.87
Page 46

Objectives and Strategies of M&A
Adjusted Cash Margin(%) 6 4.67 0.87Net Profit Margin(%) 7.6 -0.35 -7.35Adjusted Net Profit Margin(%) 7.5 -0.35 -7.35Return On Capital Employed(%) 15.77 10.8 8.15Return On Net Worth(%) 13.62 -0.63 -23.34Adjusted Return on Net Worth(%) 8.4 5.71 -2.5Return on Assets Excluding Revaluations 316.06 285.64 174.68Return on Assets Including Revaluations 316.06 285.64 174.68Return on Long Term Funds(%) 12.33 12.21 9.12
Liquidity And Solvency Ratios Current Ratio 1.43 1.36 1.19Quick Ratio 1.95 1.7 1.39Debt Equity Ratio 0.9 1.55 4.28Long Term Debt Equity Ratio 0.59 1.26 3.72Debt Coverage Ratios Interest Cover 2.75 1.9 1.13Total Debt to Owners Fund 1.61 1.55 4.28Financial Charges Coverage Ratio 2.28 1.77 1.19Financial Charges Coverage Ratio Post Tax 2.21 1.11 0.57
Management Efficiency Ratios Inventory Turnover Ratio 3.48 6.73 5.69Debtors Turnover Ratio 5.41 5.71 6.33Investments Turnover Ratio 7.25 6.73 5.69Fixed Assets Turnover Ratio 3.4 3.44 3.1Total Assets Turnover Ratio 2.42 1.28 1.18Asset Turnover Ratio 3.44 3.44 3.1 Average Raw Material Holding 25.22 32.47 35.89Average Finished Goods Held 26.36 24.25 24.94Number of Days In Working Capital 204.77 184.24 163.7
Profit & Loss Account Ratios Material Cost Composition 56.46 49.71 52.49Imported Composition of Raw Materials Consumed -- -- --Selling Distribution Cost Composition 17.56 16.22 13.43Expenses as Composition of Total Sales -- -- --
Cash Flow Indicator Ratios Dividend Payout Ratio Net Profit 6.65 -- --Dividend Payout Ratio Cash Profit 5.63 50.6 -7.96Earning Retention Ratio 89.1 -- --Cash Earning Retention Ratio 91.58 87.8 48.33AdjustedCash Flow Times 14.92 19.51 160.34
Page 47

Objectives and Strategies of M&A
5.6 The Success forecast for Diageo acquiring USL: (Synergies):
The stake purchase by Diageo will alter the dynamics of United Spirits in two ways:
The high import tax had limited so far Diageo’s access to the domestic market
It will result in premiumisation of United Spirits portfolio. The famous Johnnie Walker, Smirnoff, Crown Royal, Windsor foreign brands will make easy inroads into the Indian market. This implies products yielding high margin.
The management of Diageo will be calling the shots:
Diageo can position its nominees as CEOs, CFOs, Head of Internal Audit
Page 48

Objectives and Strategies of M&A
United Breweries Holding which holds United Spirits shares, are required to vote as per Diageo’s direction for four years
Diageo will have the right to appoint the majority of United Spirits’ directors and senior executives.
For Diageo Group, the Deal represents their first step towards consolidating their ever expanding hold in one of the fastest growing spirits market in the world i.e. India. For Dr. Mallya and the UB Group, the Deal represents a new partnership with an experienced global player and reduction of their (respective) debt. For the Target, it represents the best of both worlds as an established local presence meets international governance and operational standards and also deleverages itself.
In light of all this, the much recent order of the Karnataka HC annulling the sale of stake by UBHL to the Diageo Group has created another faltering roadblock for the Deal. Time will tell whether Diageo will get hold of the ‘family jewel’ and, if so, whether Diageo will be able to do justice to the ‘King of Good Times’ going ahead.
CHAPTER 6
Suggestions and conclusions
6.1: conclusion: TATA Jaguar- Land Deal
The present scenario of the world is about Globalization where the Organizations have to explore the domestic market as well as the International Market. One of the critical factors which is affecting the Organization in International Market is Recession. In the Competitive market for attaining the Success, one needs to be a global player like TATA Sons. A company can assess its potential only in the Global Environment, which provides prospects for exploring new perspective and transforming entities.
Page 49

Objectives and Strategies of M&A
The concept of M&A can be better understood with the case of TATA Jaguar- Land Deal. The deal basically focuses on the prime sector of automobile and the reputation of these companies at their own segment. Globally, the number and size of deals is heading toward record levels, with cross-border deals taking centre stage, as companies take advantage of cheap financing to pursue their expansive M&A strategies.
Today, corporate strategy is focused firmly on M&A as a tool to foster future growth and create sustainable value. As a result, companies are aggressively seeking and buying compatible and synergistic businesses to bolster core strengths, and shedding non-core operations. But they are overlooking the evil effects of M&A to weaken the position of a country after acquiring the firm and not running competently. Merger of one company with another was viewed, as a sign of failure. The laws and regulations previously allowed the acquisition of only sick, dying, moribund (declining), and impossible, unviable and almost hopeless units. The acquirer was driven mostly by the tax benefits of the loss carry forward.
Merger and acquisition (‘M&A’) activity in India, though currently at its peak, is not as vibrant as that in the U.S. or Europe. M&A transactions tend to be financed largely by equity and / or by cash. While debt-financed deals are a handful, financing of acquisitions using high-yield bonds is non-existent in India.
This is a case of LEVERAGED BUYOUTS
A leverage buyout (‘LBO’) is the acquisition of a business, typically a mature company, by a financial investor whose objective is to exit the investment after 3-7 years realizing an Internal Rate of Return (‘IRR’) of in excess of 20% on its investment over the horizon. The term ‘Leveraged’ signifies a significant use of debt for financing the transaction.The purpose of a LBO is to allow an acquirer to make large acquisitions without having to commit a significant amount of capital. A typically transaction involves the setup of an acquisition vehicle that is jointly funded by a financial investor and management of the target company. Often the assets of the target company are used as collateral for the debt.Typically, the debt capital comprises of a combination of highly structured debt instruments including pre payable bank facilities and / or publicly or private placed bonds commonly referred to as high-yield debt.
Page 50

Objectives and Strategies of M&A
Buyout:
The term ‘Buyout’ suggests the gain of control of a majority of the target company’s equity. The target company goes private after a LBO. It is owned by a partnership of private investors who monitor performance and can act right away if something goes awry. Again, the private ownership is not intended to be permanent. The most successful LBOs go public again as soon as debt has been paid down sufficiently and improvements in operating performance have been demonstrated by the target company.
TATA Jaguar- Land Deal
This deal has provided the Leveraged to TATA Group in many ways to repay the amount for the deal.· Rs. 1.92 Billion underwriting agreement with J M financial Consultants.
· Rs.1.75 Billion was raised through a deposits scheme from the Public.
· Additional subscriptions by promoter companies such as TATA sons, TATA Capital and investment.
· And above that TATA was leveraged by British Government also.
Valuation
JLR is the key driver for Tata Motor’s fortunes. JLR contribution in total sales of Tata Motors has increased from 74% in Q1FY13 to 79% in Q1FY14 and EBITDA contribution increased from 86% in Q1FY13 to 98% in Q1FY14. However, Indian business continues to be under pressure (except LCVs). There are no visible signs of improvement for MHCVs and LCV growth also started to decline. The domestic passenger car business continues to struggle, with lower capacity utilization, higher discounts and ad spends. At CMP 372 stock is trading at 9.8x of its FY14E. We don’t have any rating on the stock.
6.2 Case Study 2 conclusion: Diageo acquiring stake in USL
The deal valued at about INR 52 Billion is one of the largest transactions for acquisition, especially in the food and beverages industry, not just in India but across the world. The deal gave the Diageo Group a much anticipated entry into one of the world’s fastest growing liquor market in India and also saw the leading premium alcohol maker extend its footprint to the lower segment of the market that drives scale. India now becomes Diageo’s second-biggest market by sales revenue. For the UB Group, the deal offers a new partnership with an experienced global player and reduction of their respective debt while for USL it represents the best of both worlds as an established local presence meets international governance and operational standards and also deleverages itself. The deal integrates the well positioned USL range of brands across categories and price points to capitalise on the very strong growth trends that are predicted in the alcohol segment in India with Diageo bringing its skills and capabilities to this market. It brings Diageo's strengths in marketing and innovation together
Page 51
Objectives and Strategies of M&A
with USL's scale, leading local spirits brands, strong routes to market, and an exceptional supply base.
Expansion will be slow now given the regulatory challenges in Indian courts and the UK competition regulator’s intervention, yet the sale of Whyte & McKay is very much on track. Only a 6.9 % stake will be affected by the Indian High Court verdict and this has already been cushioned by the initial agreement between the two players that had taken the winding up petition into consideration. United Spirits has given assurance to Diageo that the latter will be able to retain operational and management control even if they are not a majority shareholder. USL has a contractual obligation to go out of its way to ensure that Diageo gradually becomes a majority shareholder over time. For now, Diageo will continue to vote side by side on the board with USL per its deal contractual commitments. In addition there may be other contractual provision which gives them ability to purchase additional shares from the Indian promoter but that will depend on what the exact terms of the definitive agreements are. If UB Holdings is not able to return the cash, Diageo can initiate recovery proceedings against the company. Subsequently, Diageo can increase its shareholding either through open market purchases or through another open offer. It could also bid for the UB Holdings' shareholding as and when a liquidator organizes sale of assets of the company. At the time when the transaction in question was entered into, Diageo was fully alive to the fact that there were at that point in time winding up petitions pending in the Karnataka high court and deal structures were created to mitigate these outcomes. Further, while this deal is being touted as one of the biggest investments in the F&B space, an analysis of the various compliance touch-points across jurisdictions raises a pertinent complexity. The sheer volume of regulatory compliance mechanisms in place globally and the increased scrutiny regulators are undertaking demonstrates the difficulty in doing business.
The industry is fairly complex, both in terms of operation and consumer choice. The consumer’s choice between the different price segments and further between the brands within such segment is highly subjective and is dependent on various complex factors. Alcoholic beverages can be broadly categorized into three main categories i.e. beer, wine and spirits. The distinction between these various types of beverages is made on the basis of ingredients, alcoholic content and the manufacturing process involved. In the last two to three years, the wine and spirits market in India has not only witnessed the entry of several new players, both domestic and foreign, but also the introduction of several new brands at various prices.
Further, the production of alcoholic beverages requires licenses from the respective state governments which determine the production capacity of each manufacturing facility and control the production and movement of both the raw materials and finished products. In order to commence manufacture of liquor, an entity requires an excise license from the
Page 52
Objectives and Strategies of M&A
respective state governments for possession of raw material and sale of liquor. Introduction of new brands also requires the permission of the state government. Additionally, new brand recognition is also fairly difficult due to prohibition on advertising of alcoholic beverages in India.
In India, prior to this Deal, the Diageo Group has been present through its wholly owned subsidiary – Diageo India, which is engaged in the manufacturing of Diageo Group products, through lease arrangements with four distillers in the states of Punjab, Maharashtra, Karnataka and Madhya Pradesh. Diageo India also has three custom bonded warehouses in Delhi, Mumbai and Kolkata. Diageo Group had presence in the premium price range in the whiskey and vodka segments; however, had insignificant presence in the rum and gin segments.
As discussed above, the Indian alcoholic beverages industry poses significant challenge for a new entrant because of the following reasons: (a) procurement of multiple licenses, (b) knowledge of local choices of consumers, and (c) dealer and distributor network. Thus, it would have been difficult for the Diageo Group to organically grow in India. Thus, in order to have a significant presence in India the viable option was to look for an inorganic (acquisition) option.
The acquisition of a substantial stake in the Target, which holds approximately 55% of the market positions prior to the Deal, was perhaps the most viable option for the Diageo Group to establish its presence in India. Further, both Diageo Group and the Target had good product synergies The acquisition, as it is estimated, should give Diageo Group a 70% market share in the Indian alcohol beverages industry.
Bibliography:
http://www.diageo.com/en-row/ourbusiness/aboutus/Pages/default.aspx
http://unitedspirits.in/Search.aspx?rpt=Annual%20Report&yr=2010
http://unitedspirits.in/aboutus.aspx
http://www.jaguarlandrover.com/gl/en/about-us/
http://www.tatamotors.com/about-us/company-profile.php
http://www.business-standard.com/article/companies/jlr-steers-tata-motors-fortune-112112600024_1.html
Page 53

Objectives and Strategies of M&A
http://blog.thomsonreuters.com/index.php/tag/ma/
http://www.slideshare.net/purval/tata-motors-jlr-deal-part2
Page 54