objective-based vegetation management (obvm) program sop · standard operating procedures for obvm...
TRANSCRIPT

September 2018
Objective-Based Vegetation Management (OBVM)
Program
Vegetation Monitoring Standard
Operating Procedure
Revised September 2018
Prepared by:
Florida Fish and Wildlife Conservation Commission Wildlife and Habitat Management Section,
Habitat Assessment and Restoration Program
and
Florida Wildlife Research Institute, Upland Habitat Research and Monitoring,
Ecosystem Assessment and Restoration Section

September 2018
TABLE OF CONTENTS
1. INTRODUCTION ................................................................................................................................. 4
1.1 Objective-based Vegetation Management ..................................................................................... 5
1.2 Vegetation Structure and Composition Objectives ....................................................................... 5
1.3 Natural Community Sampling Protocol and Methodology ......................................................... 5
1.4 Targeted Monitoring ....................................................................................................................... 6
2. SKILL REQUIREMENTS FOR DATA COLLECTION ................................................................. 7
2.1 Plant Taxonomy Skills ..................................................................................................................... 7
2.2 Survey and Ecology Skills ............................................................................................................... 7
3. MATERIALS AND EQUIPMENT ..................................................................................................... 7
3.1 Quadrats ........................................................................................................................................... 7
3.2 Datalogger/GPS ................................................................................................................................ 8
3.3 Additional Equipment List ............................................................................................................. 8
4. PREPARATIONS FOR FIELD SAMPLING .................................................................................... 8
4.1 Sampling Technique Calibration ................................................................................................... 8
4.2 Notifications...................................................................................................................................... 8
4.3 Personnel Safety ............................................................................................................................... 8
4.4 Preliminary Data Preparation and Explanation ........................................................................... 9
5. LOCATING SAMPLE STATIONS .................................................................................................... 9
5.1 Navigation ......................................................................................................................................... 9
5.2 Alternate Sample Points .................................................................................................................. 9
5.2.1 Alternate Sample Points – Standard Protocol............................................................................ 9
5.2.2 Alternate Sample Points – Bad Polygon Protocol .................................................................... 10
6. SAMPLE STATION LAYOUT ......................................................................................................... 10
6.1 Sample Station Center Point ......................................................................................................... 10
6.2 Quadrats ......................................................................................................................................... 11
7. VEGETATION MEASUREMENTS ................................................................................................. 13
7.1 Measurements within Each Sampling Station ............................................................................ 13
7.1.1. Station center point measurements .................................................................................. 13
7.1.2. 7m radius (154m2) plot measurements ............................................................................. 13
7.1.3. Quadrat Measurements ..................................................................................................... 13
7.2 Specifics for Certain Quadrat Measurements ............................................................................. 13
7.2.1. Cover Estimates ................................................................................................................. 14
7.2.2. Stem and Petiole Counts .................................................................................................... 14

September 2018
7.2.3. Maximum Vegetation Heights .......................................................................................... 16
8. DATA COLLECTION ....................................................................................................................... 16
8.1 Datalogger ...................................................................................................................................... 16
8.2 Alternative Data Collection Methods ........................................................................................... 16
8.3 Data Fields – Missing or Null Values ........................................................................................... 16
8.4 Recording Species .......................................................................................................................... 17
8.5 Comments ....................................................................................................................................... 17
9. DATA MANAGEMENT .................................................................................................................... 17
9.1 Data Files ........................................................................................................................................ 17
9.2 Quality Assurance/ Quality Control ............................................................................................ 18
10. DATA ANALYSES AND STATISTICAL PROCEDURES ......................................................... 18
REFERENCES ........................................................................................................................................ 19
APPENDIX A: OBVM Sampling Station Creation Standard Operating Procedure ....................... 21
APPENDIX B: Equipment List .............................................................................................................. 26
APPENDIX C: Standard Sampling Definitions and Protocols ........................................................... 27
APPENDIX D: Data Dictionary ............................................................................................................ 32
APPENDIX E: Taxonomic Resources ................................................................................................... 42

September 2018
Standard Operating Procedures for OBVM (Revised September 2018)
1. INTRODUCTION
The Fish and Wildlife Conservation Commission (FWC) has lead management responsibility for
approximately 1.5 million acres on 50 Wildlife Management Areas, and Wildlife and Environmental
Areas (WMA/WEA), in Florida. The FWC, in cooperation with the Florida Natural Areas Inventory
(FNAI), has developed and implemented an objective-based vegetation management (OBVM) approach
to wildlife habitat conservation on these State lands.
As first implemented in 2004, OBVM sampled the actively managed natural communities at both the
natural community level and at the management unit level. The purpose of community level monitoring
was to provide insight into the overall condition of the natural community. Community level monitoring
called for the random distribution of 30 to 50 sampling points in each actively managed natural
community, within each managed area. The plan was to monitor at the community level every 5 years.
The purpose of management unit monitoring was to determine the influence of land management
activities on the specific management unit. Management unit monitoring was conducted by randomly
placing 10 to 30 sampling points within each management unit that was treated, and management units
were to be sampled 2 years following a significant management action (e.g. Rx fire, herbicide treatment
or mid-story reduction). Resource managers found OBVM data collected under the pre-2011 protocol
complex and of limited utility for making management decisions. Further, applying the management unit
level monitoring statewide was too expensive to sustain.
In 2011-2012, the OBVM program underwent a review that included a workshop and a series of meetings
with Habitat Assessment and Restoration Program (HARP), staff from the Fish and Wildlife Research
Institute (FWRI), WMA/WEA staff, and Wildlife and Habitat Management (WHM) leadership. FWC
used information gathered at the workshop to modify the OBVM program to better meet staff needs and
the Commission’s budgetary constraints.
Since 2012, OBVM sampling primarily occurs at the natural community level. OBVM sampling will
occur every 5 years and in conjunction with FNAI natural community re-certification mapping. To assure
consistency in data collection, FNAI will conduct all OBVM sampling. FNAI staff should contact area
staff at least 1 week in advance of the sampling to allow area staff the opportunity to inform FNAI about
any planned management treatments (e.g. prescribed fire or timber harvest) or special events (e.g. special
opportunity hunts) that would inhibit sampling. FWRI staff will audit a portion of the data to verify data
integrity. This will assure the delivery of consistent, long-term, and quality sampling data to area
managers.
This approach supports science-based land management decisions by setting measurable management
objectives for natural communities and collecting data to evaluate progress towards the objectives. The
OBVM program collects data that quantifies present natural community conditions on FWC managed
lands, provides data interpretation, and facilitates discussion about whether management is having the
desired influence on the natural community attributes. OBVM provides data to support decision-making,
provides accountability for land management, and helps confirm whether or not management is having
the desired outcome. The OBVM program provides the data necessary to support adaptive management
that managers use to maintain natural communities. Healthy natural communities provide benefits to
Florida’s wildlife and people.

September 2018
1.1 Objective-based Vegetation Management
Objective-Based Vegetation Management (OBVM) is a monitoring program that measures specific
vegetative attributes that provide insight about vegetative structure and composition in native plant
communities. Managers can use the data on vegetative attributes to determine habitat suitability for
species or to assess the relationship between land management actions and desired habitat condition.
The purpose of OBVM is to provide consistent, long-term monitoring of managed natural
communities. Consistent, long-term monitoring of managed natural communities will quantify
changes in habitat conditions, provide information on the cumulative effects of management
activities, and measure progress towards meeting management objectives for desired habitat
conditions. Measured changes in vegetation condition are intended to be used to inform future land
management actions. Statistical questions that the data are well suited to answer include:
• Multi-Year Sampling; 5-Year, Change Over Time Analysis: Is the structural character of an
attribute significantly different between two 5-year sampling periods?
• Within Year Sampling; Benchmark Test: Is greater than 50% of the community (or targeted
area) within DFC (WDFC) by attribute?
HARP staff will assist in the analysis and interpretation of the data through meetings with area staff
followed by a document to assist staff with future management decisions.
1.2 Vegetation Structure Objectives
OBVM samples 11 core vegetative structural attributes (Table 1) within a set of sampling stations
(typically 60), randomly placed within a natural community. For each attribute, the acceptable range
of values for the attribute is the DFC. The DFCs describe structural vegetative characteristics that
should be found, or not found, in a given 7-meter radius plot, a 4m2 quadrat or a 1m2 quadrat.
Typically, the OBVM program compares area-specific data to DFCs established, or based on data
found at FNAI Natural Community Reference sites. A DFC set to ‘0’ or ‘<1’ for a given attribute
does not infer that the attribute in question should be absent from the natural community. Rather, that
the occurrence of the attribute should be low enough within the natural community, that it should not
typically be detected at a random sampling station at the scale at which OBVM data are collected.
Further, it may not be the management objective to have all (100%) points within the DFC for all
attributes. Having a small number of points outside of the DFC can be acceptable as it provides
habitat heterogeneity.
1.3 Natural Community Sampling Protocol and Methodology
Since 2012, FNAI has performed all OBVM sampling, and FWRI conducts data Quality control
auditing in the field. HARP and FWRI staff will work cooperatively to analyze and distribute the
data, interacting with staff to develop the OBVM management implications derived from discussing
the data. Sampling of actively managed natural communities on a WMA/WEA occurs every 5 years,
in the same year that FNAI natural community map re-certification occurs for an area. The
monitoring schedule will then repeat on a 5-year cycle.
FWC staff will use the natural community map of the WMA/WEA and GIS software to select 60
random sample points within each natural community (Appendix A). Sampling fewer than 60 points
may occur if the number of acres of a managed natural community is small. Sampling of the standard
60 points will occur if the natural community area is greater than 120 acres; however, sampling of 45
points will occur if the managed natural community has 60 to 120 acres, and sampling of 30 points
will occur for managed areas of 30 to 59 acres. Typically, no monitoring of natural communities of
less than 30 acres occurs. To minimize the ecotonal effects associated with natural community

September 2018
boundaries, when practical, do not place sampling station center points closer than 20 meters from the
edge of a natural community polygon.
HARP staff may exclude some polygons of actively managed natural communities from OBVM
sampling. Excluded polygons may be excluded for several reasons, typically due to small size, urban
interface, isolated location within non-fire maintained surrounding communities, or impractical access
issues. Typically, staff discuss and agree upon these issues during OBVM data delivery meetings, or
WCPR workshops. When a natural community polygon cannot be appropriately managed by area
staff, it will be updated in the current natural community map database for the WMA/WEA, as not
fire maintained or ‘FMC=N’. This designation will prevent future OBVM sampling points from
falling within those polygons.
OBVM sampling collects data on 11 core vegetation attributes at three different scales corresponding
to the layer sampled: over-story, mid-story, and groundcover (Table 1). Sampling of over-story
attributes occurs from the center point of 7m radius (154m2) circular plots. Sampling of mid-story
and groundcover attributes occur in the four-meter square (4m2) plots. Sampling of the herbaceous
groundcover attribute occurs in the one-meter square (1m2) plots. All attributes sampled at the 4m2
and 1m2 scales are measured in plots located along three 7m transects radiating at 0°, 120°, and 240°
from the center point of the sampling station (Figure 1). There are 3 plots per point for each of these
attributes. For each attribute quantified in the plots, we average the value of the 3 plots to determine
the value for the point. See Appendix B for a complete listing of all sampling protocol and attribute
definitions.
FNAI is expected to contact area staff at least 1 week prior to sampling to inform staff of the planned
sampling event and to determine if there are any access constraints. If FNAI cannot contact the area
biologist, they will attempt to contact the District biologist. Area or District staff are expected to
inform FNAI about any planned management treatments or activities (e.g. special op hunts, education
events) that could inhibit OBVM sampling and arrange for access (provide gate keys or combos), as
necessary.
1.4 Targeted Monitoring
Under specific conditions, staff may choose to have monitoring targeted to assess intensity of
management or the effect of a specific management objective. This will be done by dividing the
target natural community into subsections according to management intensity levels, or by selecting
an area within the community that has a pre-defined land management objective (for a species and or
a habitat condition). To measure management progress in these areas, additional sample locations
may need to be randomly selected so adequate data can be collected. Monitoring and data analysis for
these targeted areas will occur as distinct monitoring events. These may occur in conjunction with
NC level monitoring, or they may by nature need to be separate from NC level monitoring.
September 2018
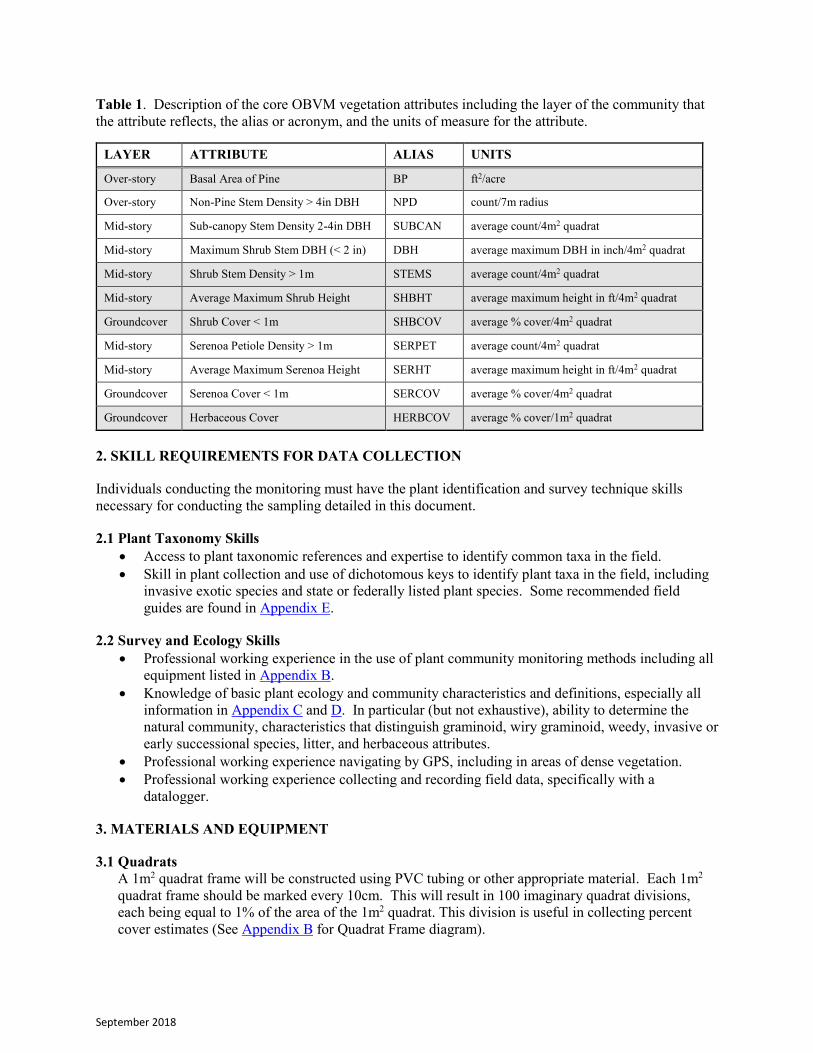
Table 1. Description of the core OBVM vegetation attributes including the layer of the community that
the attribute reflects, the alias or acronym, and the units of measure for the attribute.
LAYER ATTRIBUTE ALIAS UNITS
Over-story Basal Area of Pine BP ft2/acre
Over-story Non-Pine Stem Density > 4in DBH NPD count/7m radius
Mid-story Sub-canopy Stem Density 2-4in DBH SUBCAN average count/4m2 quadrat
Mid-story Maximum Shrub Stem DBH (< 2 in) DBH average maximum DBH in inch/4m2 quadrat
Mid-story Shrub Stem Density > 1m STEMS average count/4m2 quadrat
Mid-story Average Maximum Shrub Height SHBHT average maximum height in ft/4m2 quadrat
Groundcover Shrub Cover < 1m SHBCOV average % cover/4m2 quadrat
Mid-story Serenoa Petiole Density > 1m SERPET average count/4m2 quadrat
Mid-story Average Maximum Serenoa Height SERHT average maximum height in ft/4m2 quadrat
Groundcover Serenoa Cover < 1m SERCOV average % cover/4m2 quadrat
Groundcover Herbaceous Cover HERBCOV average % cover/1m2 quadrat
2. SKILL REQUIREMENTS FOR DATA COLLECTION
Individuals conducting the monitoring must have the plant identification and survey technique skills
necessary for conducting the sampling detailed in this document.
2.1 Plant Taxonomy Skills
• Access to plant taxonomic references and expertise to identify common taxa in the field.
• Skill in plant collection and use of dichotomous keys to identify plant taxa in the field, including
invasive exotic species and state or federally listed plant species. Some recommended field
guides are found in Appendix E.
2.2 Survey and Ecology Skills
• Professional working experience in the use of plant community monitoring methods including all
equipment listed in Appendix B.
• Knowledge of basic plant ecology and community characteristics and definitions, especially all
information in Appendix C and D. In particular (but not exhaustive), ability to determine the
natural community, characteristics that distinguish graminoid, wiry graminoid, weedy, invasive or
early successional species, litter, and herbaceous attributes.
• Professional working experience navigating by GPS, including in areas of dense vegetation.
• Professional working experience collecting and recording field data, specifically with a
datalogger.
3. MATERIALS AND EQUIPMENT
3.1 Quadrats
A 1m2 quadrat frame will be constructed using PVC tubing or other appropriate material. Each 1m2
quadrat frame should be marked every 10cm. This will result in 100 imaginary quadrat divisions,
each being equal to 1% of the area of the 1m2 quadrat. This division is useful in collecting percent
cover estimates (See Appendix B for Quadrat Frame diagram).
September 2018
3.2 Datalogger/GPS
OBVM samplers will use a GPS unit with at least 1-3m accuracy to navigate to each sampling point.
All field data will be collected with a field datalogger or datalogger/GPS combination. Paper field
forms will only be allowed as a backup data collection method during datalogger failure. The
collected field data will then be converted manually into the respective shapefiles. Data will not be
accepted without a field GPS point collected at the sample location.
3.3 Additional Equipment List
FNAI or their staff should provide any necessary personal safety or comfort needs, such as bug spray,
water, etc. A detailed list of field equipment to be used for data collection is provided in Appendix B.
4. PREPARATIONS FOR FIELD SAMPLING
4.1 Sampling Technique Calibration
Each year, a field coordination and calibration meeting between HARP, FNAI, and FWRI will be
required on the first day of data collection. This meeting would allow for sampling calibration
between FNAI staff that will be collecting the OBVM data and FWRI staff that will be auditing the
data, thus ensuring sampling results are comparable and reproducible. All OBVM involved biologists
should practice estimating each of the OBVM core attributes, from canopy to groundcover. Data
collectors and auditors will practice estimating attribute values and come to a consensus as to the
most appropriate stem count or cover class. This will create a unified standard among biologists, both
data collectors and data auditors, assuring more consistent and accurate data. Practice should
continue until error between the individual biologists’ estimates are minimized.
Other potential meetings between HARP, FWRI, and FNAI staff may be required as needed.
Periodically staff will meet prior to the field season to discuss any minor procedural changes from the
previous sampling season and to discuss any points of concern raised by area staff. Likewise, an end
of season meeting to discuss any issues encountered during field sampling may be required if
necessary.
4.2 Notifications
FNAI staff will develop a schedule for sampling in coordination with the FWC Area Manager at least
two weeks prior to beginning sampling. If conflicts exist between scheduled activities on a property
and the sampling schedule, FNAI scientists and the Area Biologist will come to agreement on an
alternative sampling schedule that fits within the time frame of data collection requirements.
FWC Area Biologists will coordinate sampling activities with FNAI being mindful of conflicting
operations (i.e., hunting, prescribed burning) taking place on the property. Area Staff will also
provide gate keys/combinations and advice on road accessibility.
Sampling Team: One week prior to sampling, the sampling team will contact both the FWC Area
Manager and the OBVM staff via email to confirm a schedule, identify access to the property, and to
coordinate on-site activities.
4.3 Personnel Safety
FNAI is responsible for setting up procedures for tracking the safety of, and providing all necessary
safety equipment/supplies for, field data collectors.

September 2018
4.4 Preliminary Data Preparation and Explanation
FWC will provide sample station locations in the form of an ArcMap Shapefile. FWC OBVM staff
assigns each sampling station a sample station ID. The sample station ID must be recorded for each
data record.
Overall maps should be printed of sample station locations in order to plan travel routes, identify
habitat limitations, and track completed sample points. While sampling, marking off each completed
sampling point on the maps eliminates points being accidentally omitted in the field.
5. LOCATING SAMPLE STATIONS
5.1 Navigation
The sample station points will be loaded onto the datalogger/GPS unit as a data file (not a jpeg) to
facilitate accurate navigation to each point. The order in which sampling points are visited and the
route taken to points should be systematic to maximize efficiency. We recommend background files
such as aerial photographs, topographic maps, polygon files, etc., to be loaded onto the
datalogger/GPS unit in order to conduct efficient fieldwork.
The GPS navigation feature will be used to accurately locate sample stations. FNAI scientists shall
make all reasonable efforts to navigate to within 1m of each sampling point. Accuracy of collected
sample station locations relative to provided sample station locations will be evaluated for each
dataset submitted. As FNAI submits data, FWC OBVM staff will conduct field QA/QC on a schedule
worked out between FNAI and FWC staff.
5.2 Alternate Sample Points
In the unusual event that there are large numbers of points situated in the incorrect natural community,
there is a good chance that either an error occurred and points were placed in the incorrect
community, or the natural community maps used had errors in natural community typing. If either
circumstance is suspected, please contact the HARP office to discuss the problem and to determine a
best solution that will preserve the random character of the points and quality of the final data. The
Alternate Sample Point protocols that follow are intended to address minor errors in point placement
or natural community typing.
5.2.1 Alternate Sample Points – Standard Protocol
Sample stations that fall on roads, fire breaks, in incorrect natural communities, or are otherwise
poorly located will not be sampled, and will be moved. Alternate sample station coordinates will be
established by moving 20 meters along one of the following azimuths starting with: 30o, then 90o, then
150o, then 210o, then 270o, then 330o.
In the event that the original point is more than 20 meters from an appropriate natural community
area, a point will be moved some multiple of 20 meters (up to 5 multiples or 100 meters) in any of the
above directions. The alternate point should not coincide with an existing sampling point or be
moved outside of the Natural Community boundary. If an alternate sample point is selected, FNAI
scientists must document it in the following data fields: the distance and azimuth from original point
(Alt_Pt_Distance, Alt_Pt_Bearing), the reason for moving the point (Alt_Pt_Reason), and the sample
point type (Pt_type, in this case “alternate”); (See Appendices C and D). If it is not possible to
establish an alternate sample station using the above method, and the reasons documented in the
Pt_Type and Pt_Reason fields of the sample station record, however the station ID will be retained
and used under the ‘bad polygon’ protocol.
September 2018
5.2.2 Alternate Sample Points – Bad Polygon Protocol
In the event that the station falls into a natural community polygon that is mistyped, where either the
entirety or much of the natural community polygon will change to a different natural community after
community re-certification mapping or the sampling station falls into an incorrect natural community
that is >100 meters from the appropriate natural community, the sampling station will not be sampled.
The sampling station location will be moved (but the station ID retained) by continuing to the next,
unvisited, sampling station that is within the appropriate natural community (and within the same
natural community assigned to the station(s) that was (or were) bypassed). Data will be collected at
this sampling station using the standard protocols. The center point of the station just sampled will
then be used to establish new alternative sampling points for the one (or more) sampling stations that
were located in the incorrect natural community and bypassed. The new sampling station will be
placed by using the first azimuth that will situate the alternative station within the appropriate natural
community. Place the alternative point by moving 20 meters (or multiples of 20 meters as needed)
along one of the following azimuths starting with: 30o, then 90o, then 150o, then 210o, then 270o, then
330o, from the center point of the last station sampled in the current natural community. However,
FNAI staff will consider the number of alternative points and the size of the polygon and strive to
avoid clumping points. When there are three or more points to relocate, it will be necessary to use the
alternate point approach at a number of points (as no more than 2 consecutive alternate points can be
based off of a single standard sampling station) rather than stringing all of them from 1 point.
One additional alternative sampling station, if required, will be established from the preceding (last
completed) alternative sampling station by repeating the method just described. If additional alternate
sampling stations are required, data collectors may either backtrack to the standard sampling station
that preceded the standard sampling station used to make the last two alternate sampling stations, or
proceed to the next standard sampling station. Data Samplers will then employ the alternative point
protocol as needed from that standard station. Up to 2 alternative sampling points to be located based
on the location of the standard sampling station, until each station that was bypassed prior to locating
an appropriately placed sampling station has been completed. If further sampling stations are in the
incorrect community type, the procedure will be repeated from the next appropriately placed sampling
station that follows the discovery of the mistyped station. FNAI will repeat this procedure for any
additional alternative sampling coordinates that are required, and will assign the station ID of the
previous station that had to be relocated to the new alternative station. In the circumstance that the
final remaining sampling station for a community needs to be moved, data collectors will return to the
last station sampled within the assigned community, and apply the described method for placing an
alternative final station.
FNAI is required to document the reason for moving or abandoning a point in the Alt_Pt_Reason
field of the sample station record. The field data logger contains several options in the drop-down
menu, and only one may be selected. If the original sampling station (or part of it) is located in a
firebreak, road, food plot, or other inappropriate area, select road, food plot, or firebreak from the
drop down as most appropriate. Select different community than assigned from the drop-down
options if the sampling station is located in a different community than the assigned community (e.g.,
point falls in a small depression marsh located within a mesic flatwoods polygon), or the sampling
station is located in a community polygon that will be changed following community re-certification
mapping. FWC OBVM staff must approve any other reason.
6. SAMPLE STATION LAYOUT
6.1 Sample Station Center Point
Upon arrival at the sampling station, the center point will be temporarily marked with a pole or stake-
type marker. The center point will be left marked with biodegradable flagging pushed several inches
September 2018
into the ground, with a portion of the flagging being left above ground to serve as a location marker
for later auditing. Biodegradable flagging also will be used to mark the nearest tree or shrub (if
available) to aid in relocation of the point. Record the Station ID on at least one of these flags.
6.2 Quadrats
Establish the three 7m reaches radiating from the sampling station center point, one at each of the
following radial directions: 0º, 120º, and 240º, Magnetic North (Figure 1). Direction of each reach
will be determined using a handheld compass that is calibrated with at least 2º increments. Distance
will be measured using an ultrasonic distance measurement instrument or a tape measure (in meters).
Hold the compass over the sample station center point when identifying the bearings of the three
reaches.
The 5 and 7m points along the transect, as measured from center point, will mark the midpoint of the
proximal and distal edges of the 4m2 quadrat relative to the center point, respectively. Establish a 4m2
quadrat between the 5m and 7m points of each reach such that the quadrat is parallel to the reach and
the reach bisects the 4m2 quadrat (Figure 1). Thus, if using four 1m2 quadrat frames to compose the 4
m2 quadrat, two of the 1m2 frames will fall on the left side of the reach and two frames will fall on the
right side. Quadrats will be placed as close to the ground as possible (on top of herbaceous layer);
weaving the PVC quadrat through obstructing woody vegetation as necessary. Take care in placing
the quadrat to not artificially include or exclude vegetation.
The 4m2 quadrat will be used for woody vegetation measurements. Each 4m2 quadrat will be made up
of four 1m2 quadrats, marked as described in Section 3.1. When recording percent cover for the 4m2
quadrat, each 20x20 cm division (delineated by the marked segments on the frame) is equal to 1% of
the 4m2 quadrat. The 1m2 quadrat used for herbaceous vegetation measurements in all communities is
the 1m2 quadrat at the left, nearest the center.

September 2018
Figure 1. OBVM sample station layout with quadrat detail showing length and direction of the three
arms, the positions of the 4m2 and 1m2 quadrat.
• Canopy level attributes are counted if they occur within the 7-meter radius of the OBVM sampling
station (Non-Pine Density) or from the center point: Basal Pine.
• Mid-story and ground cover attributes for shrubs and Serenoa will be sampled within the 4m2
quadrats then averaged: Sub-Canopy, Shrub Cover, Shrub Stems, Avg. Max. Shrub Height,
DBH, Serenoa Cover, Serenoa Petiole Density and Max. Serenoa Height as well as a list of all
woody species occurring in the 4m2 quadrat will be recorded.
• The herbaceous ground cover attribute is sampled at the left, 1m2 quadrat nearest the center, then
averaged: Percent Herbaceous Cover.

September 2018
7. VEGETATION MEASUREMENTS
FWC will provide FNAI a list of vegetation attributes specific to each WMA/WEA. The list will
typically consist of the 11 core attributes but may be amended as needed to meet management goals.
Detailed alphabetized definitions and details of all OBVM attributes are provided in Appendix C:
Standard Sampling Definitions and Protocols.
7.1 Measurements within Each Sampling Station
7.1.1. Station center point measurements
• Data recorder or sampler will verify that the sampling station is located wholly within the
typed natural community prior to collecting data.
• Data recorder or sampler will appropriately mark the center points location for potential
auditing.
• Attributes related to basal area and will be sampled at the station center point. Basal area is
determined using a 10X prism. Data collectors must be familiar with the use of this tool.
In instances where a tree is on the border of in or out, the first counts as in, the next is out,
and continue this alternation at the point.
• With Basal Pine, the distance of the tree from the center point does not matter; all pines
will be counted if the offset image overlaps in the prism when viewed from the center
point.
• General comments and observations that relate to the data being collected at the station
center point are recorded. Examples may include: cattle disturbance, wind thrown tree at
sample station, large gopher tortoise apron present, etc.
• A complete list of canopy trees is recorded
• Core attribute = Basal Pine
7.1.2. 7m radius (154m2) plot measurements
• Attributes related to stem densities of canopy (>4” DBH) hardwoods are measured within the
7m radius circle encompassing the 3 transects and quadrats.
• A list of all canopy species observed within the 7m radius plot will be recorded by scientific
name.
• A list of all sub-canopy species observed within the 7m radius plot will be recorded by
scientific name.
• A count of all Sand Pine stems observed within the 7m radius plot using the standard stem
count classes (Table 3).
• Core attribute = Non-Pine Density
7.1.3. Quadrat Measurements
• Attributes related to mid-story or shrub layer will be sampled within the 4m2 quadrat. A list
of all woody species occurring in the 4m2 quadrat will be recorded.
• Core attributes = Sub-Canopy, Max Shrub Stem DBH, Shrub Stem Density, Average Max
Shrub Height, Shrub Cover, Serenoa Petiole Density, Average Max Serenoa Height,
Serenoa Cover
• Herbaceous vegetation cover will be sampled in the left (as viewed from center point) 1m2
quadrat, nearest the center. A list of all herbaceous species occurring in the 1m2 quadrat
will be recorded.
• Core attribute = Herbaceous Cover
7.2 Specifics for Certain Quadrat Measurements

September 2018
7.2.1. Cover Estimates
Cover class estimates will be made for woody, Serenoa, and herbaceous covers found within
the sampling quadrats constructed as described in Section 3.1. Cover classes are the sampling
bands that field data will be placed into (Table 2). Count classes eliminate the imprecision of
attempting to determine the exact amount of cover, and instead sorts attribute condition into
classes that adequately describe attribute condition and simplifies analysis (e.g., there is no
difference in the shading effect of shrub cover estimated to be 34% or 35%, but differences in
the effect of shading are detectable between cover class 31-40% vs 41-50%).
Cover estimates will be determined by counting/adding the number of full imaginary divisions
within the quadrat that are covered by vegetation (Figure 2) and recording the corresponding
class (Appendix D). This only includes vegetation that falls within the quadrat when it is
placed. For example, when vegetation is rooted inside the quadrat but extends outside the
quadrat, only the portion within the boundaries of the quadrat will be counted in the cover
estimate. Vegetation rooted outside the plot may be counted for those portions overhanging
into the plot. All efforts will be made not to move existing vegetation either in or out of the
plot, in order to capture the most accurate existing conditions. No vegetation moving should
take place. Some visualization of cover will be necessary so that open spaces between plant
materials are not included within the cover estimate. This can be done by visually
“aggregating” vegetative cover into imaginary divisions that are 100% covered by plant
material. In dense vegetation, it may be easier to estimate percent NOT covered by vegetation
and subtract that estimate from 100% to arrive at a cover percentage.
7.2.2. Stem and Petiole Counts
• Sub-canopy stem counts will be performed by counting all living primary stems of non-
pine woody species that are 2-4" diameter at breast height within the spatial extent of the
4m2 quadrat. Secondary (coppiced) stems that branch from the main stem below 10cm
height will also be counted.
• Shrub stem and petiole counts will be sorted into count classes or sampling bands (Table
3). Count classes eliminate the imprecision, and relative unimportance, of attempting to
determine the exact number of stems or petioles, and instead sorts attribute condition into
classes that adequately describe attribute condition and simplifies analysis.
• Stem count class estimates will be made for living shrubs (woody vegetation) and petiole
count class estimates will be made for Serenoa (see Appendices C and D), all from 1 m
height upward.
• A determination of stem count class will be made for all living primary non-pine, non-
Serenoa woody stems <2" DBH within the spatial extent of the 4m2 quadrat from 1m height
upward. A primary stem is defined as one that is identifiable as a single stem at the ground
surface and may or may not be branched. These may be rooted in or outside the 4m2
quadrat.
• A determination of petiole count class will be made for Serenoa petioles within the spatial
extent of the 4m2 quadrat from 1 m height upward. This includes living petioles and dead
petioles with fronds; dead petioles without fronds will not be counted.
• Station Point values for these attributes are the average of the values for the 3 quads for
each attribute.

September 2018
Figure 2. Example of shrub cover in a 1m2 quadrat. In this diagram, the saw palmetto fronds
represent 10% cover and the gallberry branches represent 10% cover (cover class 2).
Table 2. Sampling bands used for Percent Cover Attributes: Shrub, Serenoa, and Herbaceous.
Cover Class % Cover
0 0
1 <1
2 1 - 10
3 11 - 20
4 21 - 30
5 31 - 40
6 41 - 50
7 51 - 60
8 61 - 70
9 71 - 80
10 81 - 90
11 > 90
Table 3. Sampling bands used for Stem and Petiole Count Attributes: Serenoa and Shrub
Stem Count Class No. of Stems
0 0
1 1 - 5
2 6 - 10
3 11 - 15
4 16 - 25
5 26 - 50
6 51 - 100
7 101 - 200
8 >200
September 2018
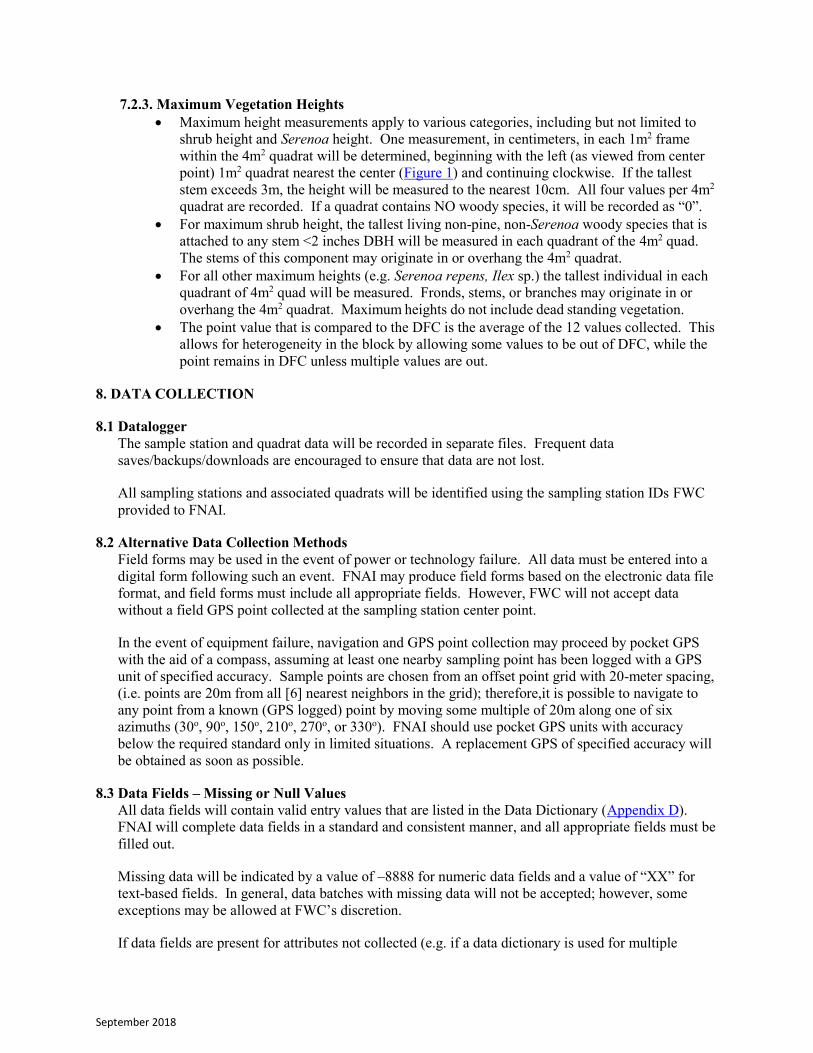
7.2.3. Maximum Vegetation Heights
• Maximum height measurements apply to various categories, including but not limited to
shrub height and Serenoa height. One measurement, in centimeters, in each 1m2 frame
within the 4m2 quadrat will be determined, beginning with the left (as viewed from center
point) 1m2 quadrat nearest the center (Figure 1) and continuing clockwise. If the tallest
stem exceeds 3m, the height will be measured to the nearest 10cm. All four values per 4m2
quadrat are recorded. If a quadrat contains NO woody species, it will be recorded as “0”.
• For maximum shrub height, the tallest living non-pine, non-Serenoa woody species that is
attached to any stem <2 inches DBH will be measured in each quadrant of the 4m2 quad.
The stems of this component may originate in or overhang the 4m2 quadrat.
• For all other maximum heights (e.g. Serenoa repens, Ilex sp.) the tallest individual in each
quadrant of 4m2 quad will be measured. Fronds, stems, or branches may originate in or
overhang the 4m2 quadrat. Maximum heights do not include dead standing vegetation.
• The point value that is compared to the DFC is the average of the 12 values collected. This
allows for heterogeneity in the block by allowing some values to be out of DFC, while the
point remains in DFC unless multiple values are out.
8. DATA COLLECTION
8.1 Datalogger
The sample station and quadrat data will be recorded in separate files. Frequent data
saves/backups/downloads are encouraged to ensure that data are not lost.
All sampling stations and associated quadrats will be identified using the sampling station IDs FWC
provided to FNAI.
8.2 Alternative Data Collection Methods
Field forms may be used in the event of power or technology failure. All data must be entered into a
digital form following such an event. FNAI may produce field forms based on the electronic data file
format, and field forms must include all appropriate fields. However, FWC will not accept data
without a field GPS point collected at the sampling station center point.
In the event of equipment failure, navigation and GPS point collection may proceed by pocket GPS
with the aid of a compass, assuming at least one nearby sampling point has been logged with a GPS
unit of specified accuracy. Sample points are chosen from an offset point grid with 20-meter spacing,
(i.e. points are 20m from all [6] nearest neighbors in the grid); therefore,it is possible to navigate to
any point from a known (GPS logged) point by moving some multiple of 20m along one of six
azimuths (30o, 90o, 150o, 210o, 270o, or 330o). FNAI should use pocket GPS units with accuracy
below the required standard only in limited situations. A replacement GPS of specified accuracy will
be obtained as soon as possible.
8.3 Data Fields – Missing or Null Values
All data fields will contain valid entry values that are listed in the Data Dictionary (Appendix D).
FNAI will complete data fields in a standard and consistent manner, and all appropriate fields must be
filled out.
Missing data will be indicated by a value of –8888 for numeric data fields and a value of “XX” for
text-based fields. In general, data batches with missing data will not be accepted; however, some
exceptions may be allowed at FWC’s discretion.
If data fields are present for attributes not collected (e.g. if a data dictionary is used for multiple
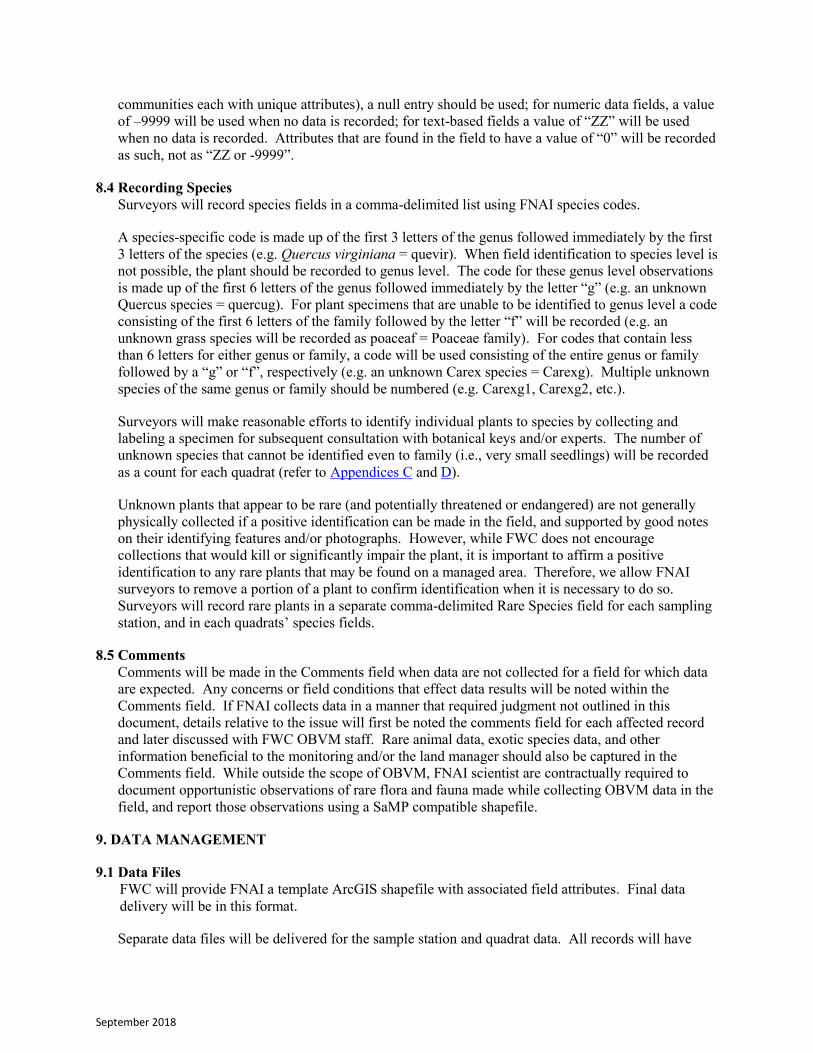
September 2018
communities each with unique attributes), a null entry should be used; for numeric data fields, a value
of –9999 will be used when no data is recorded; for text-based fields a value of “ZZ” will be used
when no data is recorded. Attributes that are found in the field to have a value of “0” will be recorded
as such, not as “ZZ or -9999”.
8.4 Recording Species
Surveyors will record species fields in a comma-delimited list using FNAI species codes.
A species-specific code is made up of the first 3 letters of the genus followed immediately by the first
3 letters of the species (e.g. Quercus virginiana = quevir). When field identification to species level is
not possible, the plant should be recorded to genus level. The code for these genus level observations
is made up of the first 6 letters of the genus followed immediately by the letter “g” (e.g. an unknown
Quercus species = quercug). For plant specimens that are unable to be identified to genus level a code
consisting of the first 6 letters of the family followed by the letter “f” will be recorded (e.g. an
unknown grass species will be recorded as poaceaf = Poaceae family). For codes that contain less
than 6 letters for either genus or family, a code will be used consisting of the entire genus or family
followed by a “g” or “f”, respectively (e.g. an unknown Carex species = Carexg). Multiple unknown
species of the same genus or family should be numbered (e.g. Carexg1, Carexg2, etc.).
Surveyors will make reasonable efforts to identify individual plants to species by collecting and
labeling a specimen for subsequent consultation with botanical keys and/or experts. The number of
unknown species that cannot be identified even to family (i.e., very small seedlings) will be recorded
as a count for each quadrat (refer to Appendices C and D).
Unknown plants that appear to be rare (and potentially threatened or endangered) are not generally
physically collected if a positive identification can be made in the field, and supported by good notes
on their identifying features and/or photographs. However, while FWC does not encourage
collections that would kill or significantly impair the plant, it is important to affirm a positive
identification to any rare plants that may be found on a managed area. Therefore, we allow FNAI
surveyors to remove a portion of a plant to confirm identification when it is necessary to do so.
Surveyors will record rare plants in a separate comma-delimited Rare Species field for each sampling
station, and in each quadrats’ species fields.
8.5 Comments
Comments will be made in the Comments field when data are not collected for a field for which data
are expected. Any concerns or field conditions that effect data results will be noted within the
Comments field. If FNAI collects data in a manner that required judgment not outlined in this
document, details relative to the issue will first be noted the comments field for each affected record
and later discussed with FWC OBVM staff. Rare animal data, exotic species data, and other
information beneficial to the monitoring and/or the land manager should also be captured in the
Comments field. While outside the scope of OBVM, FNAI scientist are contractually required to
document opportunistic observations of rare flora and fauna made while collecting OBVM data in the
field, and report those observations using a SaMP compatible shapefile.
9. DATA MANAGEMENT
9.1 Data Files
FWC will provide FNAI a template ArcGIS shapefile with associated field attributes. Final data
delivery will be in this format.
Separate data files will be delivered for the sample station and quadrat data. All records will have

September 2018
latitude/longitude coordinates included. Data will be delivered to FWC as outlined by OBVM staff
and in accordance with the Scope of Work.
9.2 Quality Assurance/ Quality Control
Prior to submitting the data, FNAI will proof all data in the office and missing data elements corrected
or recollected in the field.
All text fields will be spell-checked (including genus and species names, or coded scientific names).
The scientific name decoder, provided by FNAI, must be kept up to date and able to accurately
decode any coded botanical scientific name within the submitted data files.
FNAI will compare all field data with the sample station points provided by FWC in ArcGIS to ensure
the proper location and labeling of all data. For each sample station (provided by FWC), FNAI will
assure that data for four points consisting of the sample station center and three quadrats (0, 120, and
240) has been collected, and that the Sample Station IDs match.
FNAI will ensure that field data is submitted in a timely manner to allow for FWRI auditing. FNAI
will submit the data to FWRI in both a GIS and spreadsheet format. FNAI will make an effort to
complete monitoring on any given management area within the shortest time possible to allow
auditing of the complete set of points.
The FNAI data collector will provide the OBVM sampling data to the FWRI data auditor within 2
weeks of completing the OBMV data collection on a specific area. The FWRI OBVM data auditor
will randomly select a minimum 10% of the sampling points from each sampled natural community
on a WMA/WEA for auditing. Auditing will be performed using the standard OBVM sampling
techniques, soon after data collection and before any conditions in the field are likely to have changed.
Within one week following data auditing, FWRI auditors will inform the HARP OBVM Coordinator
of audit results.
Auditing should occur within 2 to 3 weeks of data collection to minimize any changes in vegetative
condition or loss of flagged sampling point markers. When possible, the FWRI auditor will visit
sampling sites where data was gathered by different individual FNAI data collectors. This will help
assure that there is not a user effect, where an individual data collector is out of calibration.
Audited OBVM data is expected to be accurate to one (+/-) “sampling band”. FWRI and FNAI data
collectors and auditors will work cooperatively to assure consistent, high quality data, and to calibrate
the judgement calls that are required of skilled observers when collecting various percent cover
attributes.
Plans for the auditing season can be confirmed at the field coordination and calibration meeting (4.1
Sampling Technique Calibration) held between HARP, FNAI, and FWRI staff at the beginning of
the annual data collection cycle. FWRI and FNAI naturalist will maintain frequent communication
during the sampling season to correct any problems that may be observed with data consistency.
10. DATA ANALYSES AND STATISTICAL PROCEDURES
The OBVM program is designed to satisfy statistical tests that ensure monitoring has the ability to detect
significant changes in ecological condition of the sampled natural community. For OBVM data to be
scientifically and statistically valid, monitoring and analysis must be done using appropriate statistical
design and procedures. If analyzed properly the monitoring data can answer these questions:

September 2018
1. Is greater than 50% of the community Within DFC by attribute?
2. Is the structural quality (or condition) of the natural community improving, remaining constant, or
declining over a 5-year period (by attribute)?
3. Do targeted areas represent different populations by attribute (i.e.; are attributes conditions within
an area of ‘targeted management’ different from those same attributes outside the area of targeted
management?)
To answer these questions quantitatively and credibly, they are rephrased as hypotheses that can be tested
statistically. The OBVM monitoring protocol uses a statistical procedure known as the two-proportion z-
test. This test requires that the OBVM monitoring data be in the form of just two possible outcomes,
statistically referred to as a ‘success’ or a ‘failure’. This two-outcome form, known as binary
classification, classifies members of a sample population into two groups based on whether or not they
have some property. The sampled vegetation attribute values of OBVM monitoring data are divided into
two groups: values within DFC and values not within DFC for the natural community being monitored
(i.e., the sample population). For each attribute sampled, the number of sample points with values within
DFC is divided by the total number of sample points to create a proportion that is representative of the
entire population. The proportion of points determined to be within DFC serves as a numerical
benchmark for measuring quality or condition of that attribute in the natural community monitored. This
Benchmark Test is applied to within year OBVM sampling data to answer Question 1 above.
Additionally, if a specific community or area on a WMA/WEA has been targeted for further OBVM
monitoring (e.g., areas of different management intensity, SMAs); this test is used to compare that
“targeted area” to the natural community as a whole. For within year sampling data, this Targeted Areas
Difference Test can provide an answer to Question 3 above.
OBVM samples vegetation attributes every 5 years to provide information about natural community
attributes. Using the scientific method, staff will use OBVM data to determine if the difference in
vegetation attributes observed between two sampling events is significant. OBVM conducts hypothesis
testing using a two-proportion z-test with a sample size = 60, an alpha = 0.20, and a 90% power to detect
a 14% change. In areas where the number of acres being monitored is small (<120 acres) the sample size
may be reduced to 45 or 30 sampling points. In smaller patches of natural community using 45 or 30
sampling points, a sample size = 45, an alpha = 0.20, gives a 90% power to detect a 16% change; with a
sample size = 30, an alpha = 0.20, gives a 90% power to detect a 20% change
The purpose of the test is to determine if the null hypothesis (Ho) can be rejected. The null hypothesis
states that the sample population at time1 (P1) cannot be differentiated from the sample population at time2
(P2). If the test shows the null hypothesis is true, this means the system has not changed between the two
sample times. If the null hypothesis is rejected, this establishes that the two sampled populations are
different. If the vegetation attributes of a managed natural community are proceeding toward or are being
maintained at the desired condition, then no overall change in land management strategy is indicated. If
the community’s vegetation attributes are not responding to management actions or are not in their
desired state, different management intensities or approaches may be considered.
Lastly, it should be noted that the exact steps, software, and processes used to analyze OBVM data has
evolved over the years. The current process is as quick and accurate as we have found to date, but the
process will likely be updated in the future. Please contact HARP staff if you or your organization is
interested in the specific details of how OBVM data is being evaluated at the time of your request.
REFERENCES

September 2018
Elzinga, C. L., D. W. Salzer, and J. W. Willoughby. 1998. Measuring and Monitoring Plant Populations.
USDI, Bureau of Land Management. Technical Reference 1730-1, Washington, D.C., USA.
Florida Natural Areas Inventory and Florida Department of Natural Resources. 1990. Guide to the Natural
Communities of Florida. Florida Natural Areas Inventory, Tallahassee, Florida, USA.
Lemmon, P. E. 1957. A new instrument for measuring forest overstory density. Journal of Forestry
55:667-669.
Mitchell, W. A., H. G. Hughes, and L. E. Marcy. 1995. “Prism sampling: section 6.2.3, U. S. Army Corp
of Engineers Wildlife Resources Management Manual,” Technical Report EL-95-24, U. S. Army
Engineer Waterways Experimental Station, Vicksburg, Mississippi, USA.
USDI, Bureau of Land Management. 1996. Sampling Vegetation Attributes. Technical Reference 1734-4,
Washington, D.C., USA.

September 2018
APPENDIX A: OBVM Sampling Station Creation Standard Operating Procedure
Task 1. Point Generation:
The goal of this Task is to generate Target stations for OBVM monitoring. Staff tasked with generating
sampling points should have proficiency in the use of the TechStaff Module. See “unit procedures” at the
end of this document for information on generating Target stations for specific management units.
Procedure:
1. Click on the Start Menu and navigate to LMIS then double click on “Technical Staff and
Administrator’s Tools”
2. When the OBVM Database Login opens enter your User Name, Password and click “OK”.
3. When the LMIS Tech Staff dialog application opens up, The “Manage Projects” sub-tab within
the “Projects and Activities” tab will be selected. Click on the “plus” box to expand the Region
and WMA of interest.
4. Make sure “Community 2012” is checked and the default dates are usually fine.
5. Click generate. In the popup window select the communities and the number of stations you wish
to generate in those communities. Then click next.
6. The next screen will give you the opportunity to select specific management units for the
generation of points. This is useful if you are trying to avoid a specific area of the property or
having to stratify sampling (e.g. Big Bend, LWR, etc.) You want all management units selected
if you want the entire area sampled for that specific community. However, some areas have
polygons that have been identified as unmanageable, or identified as critical to a WCPR species
that may have different needs. Prior to generating points, ensure you are aware of polygons that
should not be sampled.
7. Once the points are generated, give the points a unique name (e.g. Big Bend 2016/17 OBVM
monitoring) in the “Description” box. Then hit “Export” to begin the review of the station points.
It is useful to export these points into a folder that clearly identifies the data.
8. Select File and Commit Changes then exit Techstaff.
Task 2. Point Review and Edit:
The goal of this Task is to determine, point by point, whether each Target station falls within 20 meters of
its natural community boundary or if it falls on something that isn’t its natural community. In either case
it should be moved the minimum distance possible so that it falls within its natural community.
Procedures:
1. Open ArcMap and click the “Add Data” button. Navigate to the .mdb created in the export from
Task 1 and add the TARGET_STATION feature class.
2. Click the “Add Data” button and add the Natural Community layer from the FWC Linnaea drive
(\\fwc-tlblx1\Linnaea\OBVM_Program\OBVM\MasterGeodatabases\Master OBVM
Geodatabase.mdb\OBVM_Layers\COMMUNITY\)
3. Right click on this COMMUNITY layer and select “Properties” then the “Display” tab. In the
“Transparency” value entry box type 55 to set up a 55% transparency. Click on the “Symbology”
tab then click on the “Categories” option. In the “Value Field”, select “FNAI_NC” than click on
“Add All Values”. Uncheck the “<all other values>” checkbox then click on “OK”.
4. Click the dropdown arrow next to the “Add Data” button and click on “Add Basemap”. In the
pop-up window, double click on “Imagery” icon to add a recent Aerial Imagery layer.
5. Order the layers by the following with the first at top, TARGET_STATION then COMMUNITY,
then Aerial Imagery.
6. Click on the ArcToolbox Icon. When ArcToolbox opens, expand the Analysis Tools then the
Proximity tools then double click “Buffer”
7. When the Buffer Tool dialog box opens, for “Input Features” click on the “TARGET_STATION”
layer, for “Output Feature Class” give it the name “TwentyMeter_Buffer” and in the “Linear
unit” text entry box type 20 and then click “OK”.

September 2018
8. The 20-meter buffers will appear in the ArcMap Map data frame and Table of Contents as
polygons around each Target Station. Change the Transparency of these polygons to 45 % as in
step 3 above.
9. Right click on the TARGET_STATION feature class and select “Open Attribute Table”
a. Click on the “Options” button at the bottom of the Attribute Table and select Add Field.
b. In the Add Field dialog box, enter and select the following variables:
i. Name: Reviewed
ii. Type: Text
iii. Change length to "1"
10. If the Editor toolbar is not added to the ArcMap project, select “Customize” then Toolbars and
check on the Editor choice
11. Click the down arrow next to the Editor Tool on the ArcMap toolbar once it’s added and select
“Start Editing” and select the parent folder within which the TARGET_STATION Feature Class
resides and hit “OK”
12. Arrange windows so that the Attribute Table and the ArcMap Map Frame are both visible.
13. At the bottom of the TARGET_STATION attribute table click the Show: “Selected” button.
14. Zoom in so that an individual or a few TARGET_STATIONs are clearly discernable.
TARGET_STATIONs that fall within 20 meters of a Natural Community Boundary are those that
have boundaries intersecting the buffer. These should be moved AT LEAST as far as the interior
most point of the buffer, it’s preferable to move even farther. TARGET_STATION that is within
20 meters of a boundary and close to a road will need to be moved farther than the buffer alone
would indicate.
15. Right click on the TARGET_STATION layer move down to “Selection” and select “Make This
The Only Selectable Layer”.
16. Click on one of the points to move. Mouse over the point to display the four-sided arrow “move”
and then click and drag the point to its new location and release the mouse button to drop the
point.
17. When the point is selected in the step above, the record for this point displays in the Attribute
table, click in the Reviewed Field record for this point and type the value “Y” and enter.
September 2018
18. Right click on the TARGET_STATION Feature class in the Table of Contents and select
“Properties” and then the “Symbology” Tab. Click on the Categories in the Show: Features panel
of the Layer Properties dialog box. In the Value Field selection box, click on the down arrow and
select the “REVIEWED” field created earlier and then click the “Add All Values” Button and hit
“Apply” which displays the newly edited point as a different color than the <Null> values,
indicating that that point has been reviewed.
19. Click on each point and move it and change the value for that point to “Y” or if it doesn’t need to
move, simply change the attribute to “Y”. When done, Click the down arrow next to the Editor
Tool on the ArcMap and then select “Stop editing”. In the pop-up window choose to save edits.
Always save edits between editing sessions.
Task 3. Prepare and Send for Review:
The goal of this Task is to send TARGET_STATIONS feature class to HARP staff for review. The
HARP GIS Analyst and others within HARP should evaluate points.
1. In the LMIS Technical Staff and Administrator’s Tools, navigate to the Manage Projects sub-tab
of the Projects and Activities Tab, Navigate to the WMA of interest and the project. In the
Stations tab of the Project Frame, select Import and navigate to the edited TARGET_STATION
feature class.
2. If the import completes without error, select File and Commit Changes.
3. Click on “Export” to create a new TARGET_STATIONS feature class file form the imported
edits points. It is useful to export these points into a folder that clearly identifies the data.
4. Send a link to the exported TARGET_STATIONS feature class to HARP Staff for review.
a. If HARP staff recommends changes, follow step 1-2 above to re-import the changes into
TechStaff module so that the Quadrat and Centerpoint files are synched. If the import is
successful click “File” from the Menu then “Commit Changes”.
b. If no changes are needed, then select File and Commit Changes again
Task 4. Final Review and Deliver to FNAI:
The goal of this Task is to create and finalize the “Geodatabase” and send the centerpoint and quadrat
files to FNAI.
Procedures:
1. In the LMIS Technical Staff and Administrator’s Tools, navigate to the “Database Configuration”
tab and then the “Required Attributes Matrix” sub tab then navigate to, expand and choose the
WMA of interest
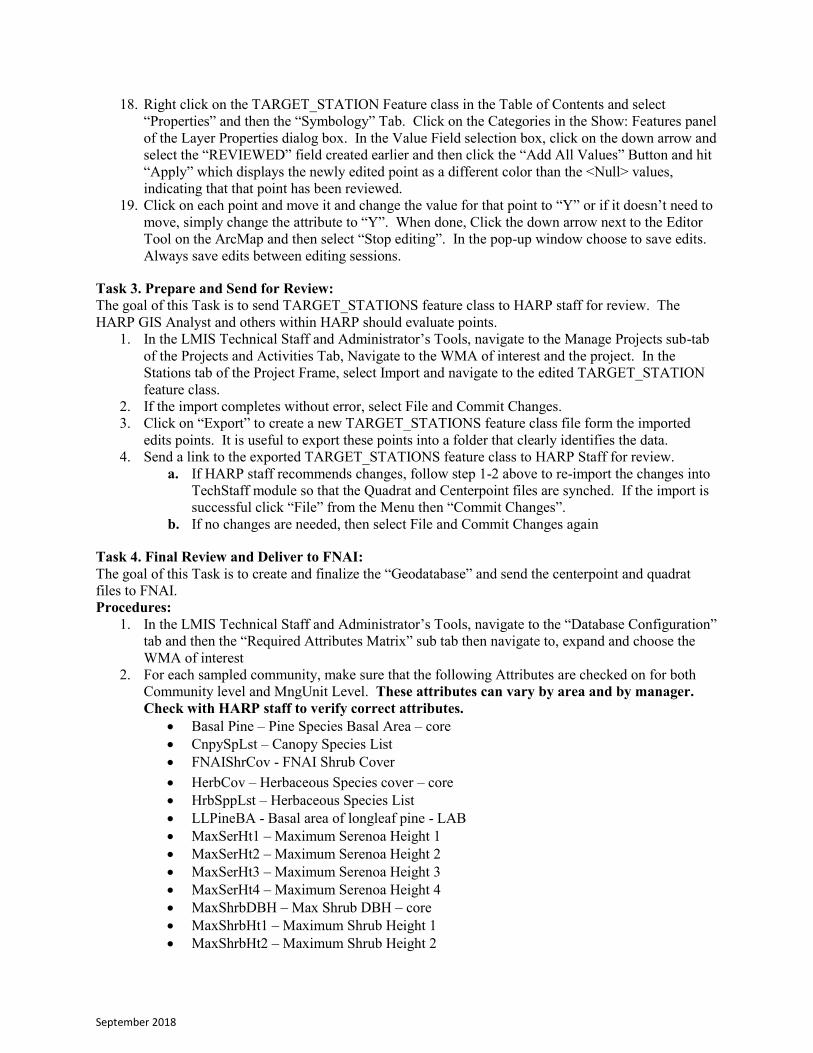
2. For each sampled community, make sure that the following Attributes are checked on for both
Community level and MngUnit Level. These attributes can vary by area and by manager.
Check with HARP staff to verify correct attributes.
• Basal Pine – Pine Species Basal Area – core
• CnpySpLst – Canopy Species List
• FNAIShrCov - FNAI Shrub Cover
• HerbCov – Herbaceous Species cover – core
• HrbSppLst – Herbaceous Species List
• LLPineBA - Basal area of longleaf pine - LAB
• MaxSerHt1 – Maximum Serenoa Height 1
• MaxSerHt2 – Maximum Serenoa Height 2
• MaxSerHt3 – Maximum Serenoa Height 3
• MaxSerHt4 – Maximum Serenoa Height 4
• MaxShrbDBH – Max Shrub DBH – core
• MaxShrbHt1 – Maximum Shrub Height 1
• MaxShrbHt2 – Maximum Shrub Height 2

September 2018
• MaxShrbHt3 – Maximum Shrub Height 3
• MaxShrbHt4 – Maximum Shrub Height 4
• NonPineDns – Non Pine Stem Density – core
• NumUnkHerb – Number of Unknown Herbaceous Plants
• NumUnkWoody – Number of UnknownWoodyPlants
• RareSpList – Rare Species List
• SerenoaCov – Serenoa Repens cover – core
• SerPetDns – Serenoa Repens Petioles – core
• ShrubCov – Shrub Cover –core
• Shrub Stems – Shrub Stem Count – core
• SndPinDens - Sand Pine Stem Density - LAB
• SubCan – Sub-Canopy Stem Count – core
• SubcnpyLst – Sub-canopy species list.
• WdySpLst – Woody Species List
3. When complete, select File then “Commit Changes”
4. Go to the “Projects and Activities” tab then “Project Geodatabases” sub-tab, click on the
checkbox under Generate GeoDB for the project that you named in Task 1 step 7. Make sure
“Save to Folder” at bottom is selected, and then click “Generate”. It is useful to export these files
into a folder that clearly identifies the data.
5. Output Centerpoint and Quadrat feature classes from previous step should be sent to HARP Staff
for review in .shp format.
6. When all edits are completed:
a. Click the “Status” dropdown arrow and select “Active” to change the Status from
upcoming to Active.
b. Click on the “Users” tab and select individuals that will have access to upload
data.
c. Select File and Commit Changes.
7. After all edits have been made and saved, regenerate the Geodatabase by following step 4
directions above.
8. Open ArcMap and click the “Add Data” button. Navigate to the .mdb created in the export from
step 1 and add the centerpoint and quadrant feature classes.
9. Right click on the centerpoint and quadrat feature classes and select “Open Attribute Table”
10. Double check that the attribute tables contain the correct attribute columns.
a. If all attribute columns are present, send quadrat and centerpoint files to FNAI for
sampling.
b. If feature classes are missing attributes, repeat steps 1-4.
Unit Procedures
There will be areas that require point generation in specific management units (Big Bend, LWR, Half
Moon, etc.). As TechStaff stands, you will need to generate these points separately by creating multiple
projects. For example, you might want to monitor each Big Bend unit separately. You would have to
generate 5 separate projects (1 for each unit) or you could first create a Project Group for better
organization. To create a project, right click on the WMA/WEA of interest and select “Create Project
Group”. Give the project group a name (e.g. Big Bend Monitoring 2016). After the project group is
created, right click on the project group name and select “Create Project”. After selecting “Create
Project” follow Task 1 directions to finish creating the project. Another example in Big Bend, you may
want to generate 30 points for the Hickory Mound unit for mesic and wet flatwoods. You will need to
determine what management units are in the Hickory Mound unit. Under Projects and Activities-
>Actively Managed Communities, you will need to put 30 as the number of samples for the 2

September 2018
communities you wish to sample. Then in the managed projects you will need to select the management
units for mesic and wet flatwoods in the Hickory Mound unit. You will repeat this process with the
others units in Big Bend, changing the sampled communities and number points as desired.

September 2018
APPENDIX B: Equipment List
• Datalogger/GPS or comparable unit
• Field forms for collecting monitoring data if datalogger unit fails
• 1m x 1m (1m2) quadrats used for woody and herbaceous measurements (Fig. 3)
• 10-meter (minimum) fiberglass measuring tape
• A stake or pole, marked to a of minimum 140cm, to serve as a center point marker and DBH
reference guide
• Sectional measuring pole ca. 3 meters long, used to measure woody vegetation heights
• Biodegradable flagging
• 10X Basal area prism
• DBH tape
• Compass
• Digital camera (or other device capable of taking photographs such as cell phone or GPS unit)
• Pens, pencils, Sharpie markers, etc.
• Paper maps of site displaying aerial photography, labeled sample station locations, site boundaries,
and other features deemed useful during field work (site specific).
• Excel spreadsheet list of sample points to mark off as completed in the field
• Plastic bags, plant press, etc. for collecting unidentifiable plant specimens
• Plastic bags for waterproofing maps, datalogger, books, etc.
• Plant manuals/ field guides
• Copy of Vegetation Monitoring Standard Operating Procedure
• Machete for fire suppressed areas
• Software installed on PC
1. ArcGIS 10- used to edit and display data
2. Trimble Pathfinder Office (or similar software)- used to transfer and/or convert field data to
ESRI shapefiles
Figure 3. A 1x1m quadrat with 10cm divisions. One 10x10 square (shown in blue) equals 1% of the 1m2
quadrat; the area comprised of 4 divisions (shown in green) equals 1% of the 4m2 area.

September 2018
APPENDIX C: Standard Sampling Definitions and Protocols
AltPtBear (Alternate point bearing)
• Accepted azimuth from original point to the Alternate Point, taken from the original sample
station center.
• The first azimuth used for alternates should be 30o, then 90o if 30o was unacceptable, then 150o,
then 210o, then 270o, then 330o.
AltPtDist (Alternate point distance)
• Distance of the Alternate Point from original sample station center point.
• Measured from original sample station center to Alternate Point sample station center point.
AltReason (Alternate point reason)
• Accepted Reasons for moving an original sampling point include: 1) original sampling station (or
part of it) is located in firebreak, road, food plot, or other inappropriate area; 2) sampling station
is located in a different community than the assigned community (e.g., plot falls in a small
included depression marsh in the mesic flatwoods polygon that is being sampled) 3) sampling
station is located in a community polygon that will be changed after community recertification.
• Alternate points for community different than assigned should only be used in very clear
situations.
• Taken at the sample station center.
Basal area factor 10 prism (definition)
• The prism is a wedge-shaped piece of glass which refracts light rays so that a tree viewed through
the prism is displaced through an angle depending on the diopter strength of the prism. One
prism diopter is equivalent to the right-angle displacement of an object by 1 unit per 100 units of
distance.
• All basal area values are gathered while the prism is located directly over the sample station
center.
BasalPine (Pine species basal area)
• Total basal area (BA) per acre of living pine species estimated at each sample station center point
using a Basal Area Factor 10 prism (Mitchell et al. 1995). BA per tree is the cross-sectional area
of a tree at breast height. BA per acre is the sum of all BA per tree occurring within the acre.
The method used for estimating BA per acre is angle counting, where inclusion of a tree in the
count depends on BA of the tree and its proximity to the sample station center point.
• The prism is held at eye level and arm’s length and remains over the sample station center point
for the entire procedure. FNAI staff will view all trees through the prism and counts each time
the offset image of a tree trunk overlaps the true image. The count is done for 360º around the
center point with the prism held over the sample station center point while FNAI staff pivot
around it evaluating each tree (i.e., do not stand in one place while moving the prism around your
body). The count is then multiplied by 10 to produce basal area per acre. This is the number to
be reported to FWC.
• In counting using a BAF prism, the first case of borderline trees (i.e. those trees whose
displacement is not clearly overlapping or separated) is counted; thereafter every other borderline
tree is counted. Alternatively, diameter at breast height (DBH) and distance from center point of
borderline trees may be measured using a reverse prism function measuring device (e.g. Haglöf
DME 201 Cruiser).
• Basal pine trees will be counted toward the total basal area from the sampling station center point.
The distance of the tree from the center point does not matter; all pines will be counted if the
offset image overlaps in the prism.
• Sand pine (Pinus clausa) is generally an undesired species in most managed communities.
Therefore, only in the scrub and scrubby flatwoods natural communities, will sand pine be
quantified as part of the Basal Pine attribute. Sand pine will be quantified as part of the Non-Pine

September 2018
Density attribute when encountered in any other natural community.
Canopy Species (definition)
• All woody species greater than 4” DBH.
CnpySpList (Canopy species list)
• A comma delimited list of canopy and sub-canopy species (>2” DBH) occurring within the 7m
radius of the sample station center point, or that contributes to the pine BA, even if beyond 7m.
Comments
• General comments the data recorder wishes to make.
Community (definition)
• Natural community in which sampling is intended to take place.
• Natural community characteristics as defined by the Florida Natural Areas Inventory Natural
Community Guide (FNAI 2010).
• Designated for each sample station by FWC.
• If the community at the assigned station is clearly of a different type than that assigned (e.g.
cypress dome within mesic flatwoods), an alternate point will be established (see Section 6.6) or
the point abandoned; surveyors will NOT reassign the community designation.
Date
• Date data was collected.
Datum
• Datum in which coordinates are collected. Datum is the coordinate system that the location of the
data is based on. Collectors should record locations (Latitude/Longitude) using true North, and
Decimal Degrees as the preferred coordinate system.
DBH (Diameter Breast Height)
• Diameter of a woody stem at 1.4m (4.5ft) above soil surface.
FNAIShrCov
• Shrub cover of all shrub species (including Serenoa repens and Sabal palmetto) within the 4m2
quadrat regardless of height.
• To be counted in this category, the stem of the plant must be less than 2" DBH.
GPSLat (GPS coordinates latitude)
• Actual GPS Latitude coordinate in decimal degrees.
GPSLong (GPS coordinates longitude)
• Actual GPS Longitude coordinates in decimal degrees.
GPSMethod (GPS method)
• Method in which coordinates are collected.
HerbCov (Herbaceous species cover)
• Total herbaceous percent cover class within the 1m2 quadrat.
• Includes living and attached dead plant material.
• Only consider native plants when estimating percent herbaceous cover.
• Note exotic species in comments field.
Herbaceous species (definition)
• Non-woody, soft-tissued plant species regardless of height, including non-woody vines (e.g.,
Galactia elliottii, Smilax pumila), legumes (e.g., Crotalaria rotundifolia), forbs (e.g., Pityopsis
graminifolia) and graminoids (grasses, sedges, rushes; e.g., Aristida stricta, Rhynchospora
tracyi).
HerbSpList (Herbaceous species list)
• A comma delimited list of all herbaceous species occurring within the 1m2 quadrat.
• This list can include species only keyed to genus or family (see Section 8.4).
MaxSerHt (Maximum Serenoa height)
• Maximum height of tallest living Serenoa repens in each of the four 1m2 quadrats.
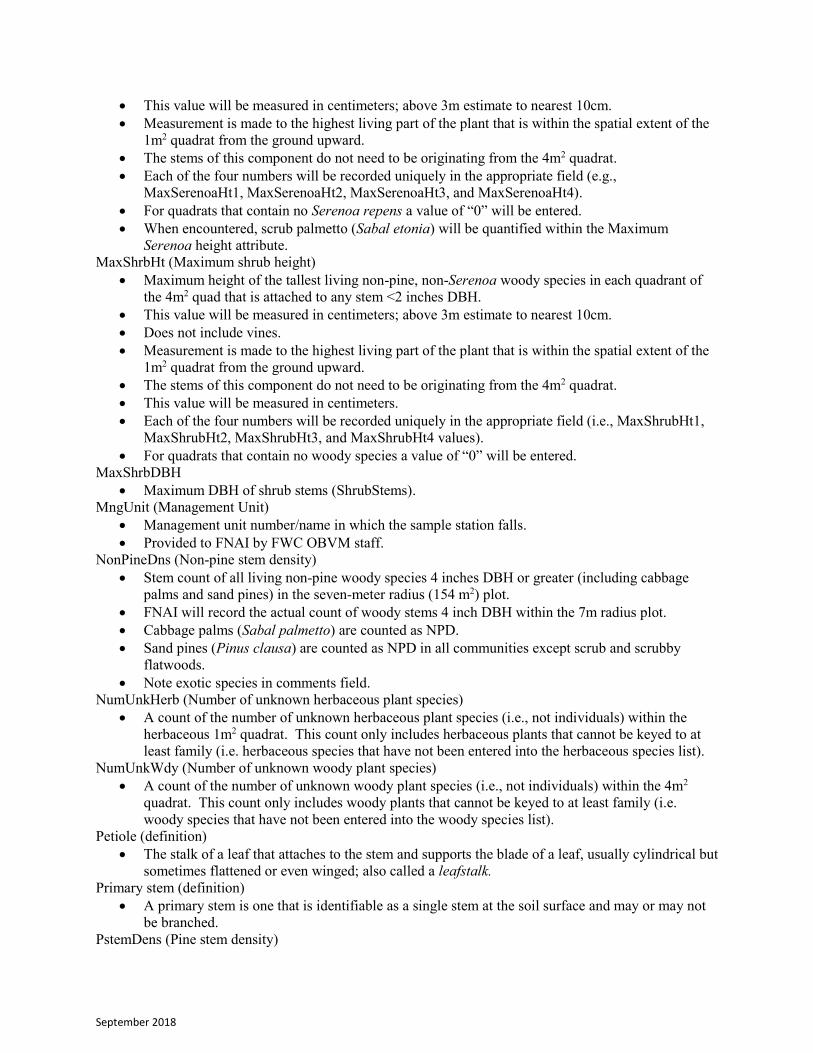
September 2018
• This value will be measured in centimeters; above 3m estimate to nearest 10cm.
• Measurement is made to the highest living part of the plant that is within the spatial extent of the
1m2 quadrat from the ground upward.
• The stems of this component do not need to be originating from the 4m2 quadrat.
• Each of the four numbers will be recorded uniquely in the appropriate field (e.g.,
MaxSerenoaHt1, MaxSerenoaHt2, MaxSerenoaHt3, and MaxSerenoaHt4).
• For quadrats that contain no Serenoa repens a value of “0” will be entered.
• When encountered, scrub palmetto (Sabal etonia) will be quantified within the Maximum
Serenoa height attribute.
MaxShrbHt (Maximum shrub height)
• Maximum height of the tallest living non-pine, non-Serenoa woody species in each quadrant of
the 4m2 quad that is attached to any stem <2 inches DBH.
• This value will be measured in centimeters; above 3m estimate to nearest 10cm.
• Does not include vines.
• Measurement is made to the highest living part of the plant that is within the spatial extent of the
1m2 quadrat from the ground upward.
• The stems of this component do not need to be originating from the 4m2 quadrat.
• This value will be measured in centimeters.
• Each of the four numbers will be recorded uniquely in the appropriate field (i.e., MaxShrubHt1,
MaxShrubHt2, MaxShrubHt3, and MaxShrubHt4 values).
• For quadrats that contain no woody species a value of “0” will be entered.
MaxShrbDBH
• Maximum DBH of shrub stems (ShrubStems).
MngUnit (Management Unit)
• Management unit number/name in which the sample station falls.
• Provided to FNAI by FWC OBVM staff.
NonPineDns (Non-pine stem density)
• Stem count of all living non-pine woody species 4 inches DBH or greater (including cabbage
palms and sand pines) in the seven-meter radius (154 m2) plot.
• FNAI will record the actual count of woody stems 4 inch DBH within the 7m radius plot.
• Cabbage palms (Sabal palmetto) are counted as NPD.
• Sand pines (Pinus clausa) are counted as NPD in all communities except scrub and scrubby
flatwoods.
• Note exotic species in comments field.
NumUnkHerb (Number of unknown herbaceous plant species)
• A count of the number of unknown herbaceous plant species (i.e., not individuals) within the
herbaceous 1m2 quadrat. This count only includes herbaceous plants that cannot be keyed to at
least family (i.e. herbaceous species that have not been entered into the herbaceous species list).
NumUnkWdy (Number of unknown woody plant species)
• A count of the number of unknown woody plant species (i.e., not individuals) within the 4m2
quadrat. This count only includes woody plants that cannot be keyed to at least family (i.e.
woody species that have not been entered into the woody species list).
Petiole (definition)
• The stalk of a leaf that attaches to the stem and supports the blade of a leaf, usually cylindrical but
sometimes flattened or even winged; also called a leafstalk.
Primary stem (definition)
• A primary stem is one that is identifiable as a single stem at the soil surface and may or may not
be branched.
PstemDens (Pine stem density)
September 2018
• Stem count of all living pine species >6 feet tall in the 7-meter radius (154m2) plot.
• This includes saplings and mature trees.
• This measure could be very useful to capture density of pine regeneration, especially where pine
recruitment may be weedy since pines are not captured in the woody cover estimate.
• FNAI will record actual count of the number of pine stems within the 7m radius (154m2) plot.
• Exclude sand pine (Pinus clausa) unless sampling in scrub or scrubby flatwoods natural
communities.
Pt_Type (Point type)
• Designates type (original, alternate, or abandoned) of point collected.
• Taken at the sample station center.
Quad (Quadrat)
• The quadrat from which data are being collected (Figure 3). Values for the quadrat include 0,
120, and 240 (bearing degrees)
RareSpList (Rare species list)
• A comma delimited list of all rare species occurring within sampling station.
• This list can include species only keyed to genus or family (see Section 8.4).
SampLevel (Sample Level)
• Sampling level for each sampling station (i.e., community or SMA).
• Predetermined by FWC, not defined by FNAI in the field.
SerenoaCov (Serenoa repens cover)
• Percent cover class below 1 meter of saw palmetto (Serenoa repens) within the 4m2 quadrat.
• Includes living and attached dead fronds and petioles.
• Does not include trunks.
• When encountered, scrub palmetto (Sabal etonia) will be quantified within the Serenoa Repens
cover attribute and noted in the species list.
SerPetDens (Serenoa repens petiole density)
• Actual count of Serenoa repens petioles within the spatial extent of the 4m2 quadrat from 1 m
height upward.
• Includes living petioles and dead petioles with fronds; does not include dead petioles without
fronds.
• The petioles of this component do not need to be originating from the 4m2 quadrat.
• When encountered, scrub palmetto (Sabal etonia) will be quantified within the Serenoa repens
petiole density attribute and noted in the species list.
ShrubCov (Shrub Cover)
• Percent cover class of living shrub species below 1 meter height within the 4m2 quadrat.
• Includes all woody species except Pinus sp., Serenoa repens and Sabal etonia.
• The stems of this component do not need to be originating from the 4m2 quadrat.
• Exotic species do count towards this attribute. Note exotic species in comments field.
ShrubStems (Shrub species stem count)
• Stem count class for all living primary non-pine, non-Serenoa woody stems <2" DBH within the
spatial extent of the 4m2 quadrat from 1 m height upward.
• The stems of this component do not need to be originating from the 4m2 quadrat.
• A primary stem is one that is identifiable as a single stem at the soil surface and may or may not
be branched.
• Does not include vines.
SndPinDens (Sand Pine Stem Density)
• Stem count of all living sand pine > 6 inches tall in the 7-meter radius (154 m2) plot. Record a
count of the number of sand pine stems within the 7m radius (154 m2) plot using the standard
stem count classes (Table 3).

September 2018
StationID (Station ID)
• Unique code for the Sample Station as assigned by FWC.
Stem (definition)
• The main aerial axis, trunk, or body of a tree or other plant.
SubCan (Sub-canopy)
• Count of all living primary non-pine woody species that are 2-4" diameter at breast height within
the space above the 4m2 quad.
• Stems that divide below breast height and coppiced shoots should be counted individually.
• The stems of this component do not need to be originating from the 4m2 quadrat.
• A primary stem is one that is identifiable as a single stem at the soil surface and may or may not
be branched.
• Note exotic species in comments field.
SubcnpyLst
• A comma delimited list of sub-canopy species occurring within the 7m radius of the sample
station center point using accepted species codes.
Surveyor
• Person recording the data
Woody species (definition)
• All woody plant species except pines, including woody vines and palms, regardless of height.
• Perennial containing wood or wood fibers consisting mainly of hard lignified tissues.
WdySpLst (Woody species list)
• A comma delimited list of woody species occurring in the quadrat using accepted species codes.

September 2018
APPENDIX D: Data Dictionary
• The following standard fields and possible values must be used by FNAI when collecting data.
• Any modifications to the fields must be pre-approved by FWC.
• Refer to Appendix C for detailed definitions of attributes.
1.00 - DATA FIELDS & VALUES, CENTER POINT
1.01 - BasalPine
1.01.1 - Name: Pine species basal area - core.
1.01.2 - Description: Total basal area (BA) of living pine species per acre estimated using Basal
Area Factor 10 prism (Mitchell et al. 1995) at each sample station center point. BA
per tree is the cross-sectional area of a tree at breast height. BA per acre is the sum of all
BA per tree occurring within the acre. The method used for estimating BA per acre is
angle counting, where inclusion of a tree in the count depends on BA of the tree and its
proximity to the sample station center point.
Specific subsets of pine may be required, for example, basal area of only longleaf pine
(LLPineBasalArea).
The prism is held at eye level over the sample station center point and needs to be kept
stationary for the entire procedure. FNAI staff will view all trees through the prism and
counts each time the offset image of a tree trunk overlaps the true image. The count needs
to be done for 360° around the prism. The prism will be held over the sample station center
point while FNAI staff pivot around it evaluating each tree (i.e., do not stand in one place
while moving the prism around your body). The count is then multiplied by 10 to produce
basal area per acre. This is the final number to be reported to FWC.
In counting using a BAF prism, the first case of borderline trees (i.e. those trees whose
displacement is not clearly overlapping or separated) is counted; thereafter every other
borderline tree is counted.
1.01.1 - Data Type: Number.
1.01.2 - Requirement: Required (may not apply to some communities or sample levels--refer to
Required Attributes table for details).
1.02 - ColDate
1.02.1 - Name: Date Collected.
1.02.2 - Description: Date of data collection.
1.02.3 - Data Type: Date.
1.02.4 - Requirement: Required.
1.03 - Comments
1.03.1 - Name: Comments.
1.03.2 - Description: General comments the data recorder wishes to make. Comments are useful
for data recorders to communicate to the auditors and to place general observations into the
data record. Comments should be annotated as being information relevant to: general area
(GA), centerpoint (CP) or quadrat (Q0, Q120, Q240).
1.03.3 - Data Type: Text.
1.03.4 - Requirement: Optional.
1.04 - LLPineBA
1.04.1 - Name: Longleaf Pine basal area.
1.04.2 - Description: Basal area (BA) per acre of living longleaf pine estimated at each sample
station center point using a Basal Area Factor 10 prism (Mitchell et al. 1995). Use the
standard basal area method but collect the BA value for longleaf pine only.
1.05 - StationID
1.05.1 - Name: Station ID.

September 2018
1.05.2 - Description: Sampling Station ID as assigned by FWC.
1.05.3 - Data Type: Text.
1.05.4 - Requirement: Required.
2.00 - DATA FIELDS & VALUES, 7M RADIUS PLOT (~154m2)
2.01 - AltPtBear
2.01.1 - Name: Alternate point bearing.
2.01.2 - Description: Accepted azimuth from original point to the Alternate Point.
The first azimuth used for alternates should be 30°, then 90° if 30° was unacceptable, then
150°, then 210°, then 270°, then 330°.
2.01.3 - Data Type: Number.
2.01.4 - Requirement: Optional.
2.02 - AltPtDist
2.02.1 - Name: Alternate point distance.
2.02.2 - Description: Distance in meters that alternate point was moved from original.
2.02.3 - Data Type: Number.
2.02.4 - Requirement: Optional.
2.03 - AltReason
2.03.1 - Name: Alternate point reason.
2.03.2 - Description: Accepted reason for moving an original sampling point to an alternate point.
Acceptable reasons include:
1) original sampling station (or part of it) is located in firebreak, road, food plot, or other
inappropriate area;
2) sampling station is located in a different community than the assigned community (e.g.,
plot falls in a small included depression marsh in the mesic flatwoods polygon that is being
sampled);
3) sampling station is located in a community polygon that will be changed after
community recertification.
2.03.3 - Data Type: Text.
2.03.4 - Requirement: Optional.
2.04 - CnpySpLst
2.04.1 - Name: Canopy species list.
2.04.2 - Description: A comma delimited list of species codes representing all canopy species (pine
and non-pine woody vegetation) greater than 4 inches DBH occurring within the 7m radius
circle plot of the sample station, or that contributes to the pine BA, even if beyond 7m.
A species-specific code is made up of the first 3 letters of the genus followed immediately
by the first 3 letters of the species (e.g. Quercus virginiana = Quevir). When field
identification to species level is not possible, the plant should be recorded to genus level.
The code for these genus level observations is made up of the first 6 letters of the genus
followed immediately by the letter "g" (e.g. an unknown Quercus species = Quercug). For
plant specimens that are unable to be identified to genus level a code consisting of the first
6 letters of the family followed by the letter "f" will be recorded (e.g. an unknown grass
species will be recorded as Poaceaf = Poaceae family). For codes that contain less than 6
letters for either genus or family, a code will be used consisting of the entire genus or
family followed by a "g" or "f", respectively (e.g. an unknown Carex species = Carexg).
Multiple unknown species of the same genus or family are recorded with duplicated codes
(e.g., two unknown Carex species are recorded as "Carexg, Carexg").
September 2018
2.04.3 - Data Type: Text (Comma-Separated List).
2.04.4 - Requirement: Required (may not apply to some communities or sample levels--refer to
Required Attributes table for details).
2.05 - Community
2.05.1 - Name: Community Type.
2.05.2 - Description: Natural community as defined by the Florida Natural Areas Inventory's
Natural Community Guide (FNAI and FDNR 1990). These designations are provided by
FWC.
2.05.3 - Data Type: Text.
2.05.4 - Requirement: Optional.
2.06 - Datum
2.06.1 - Name: Datum.
2.06.2 - Description: Datum in which coordinates are collected (Decimal Degrees).
2.06.3 - Data Type: Text.
2.06.4 - Requirement: Optional.
2.07 - GPSLat
2.07.1 - Name: GPS Latitude.
2.07.2 - Description: Actual GPS Latitude in decimal degrees.
2.07.3 - Data Type: Number.
2.07.4 - Requirement: Optional.
2.08 - GPSLong
2.08.1 - Name: GPS Longitude.
2.08.2 - Description: Actual GPS Longitude in decimal degrees.
2.08.3 - Data Type: Number.
2.08.4 - Requirement: Optional.
2.09 - GPSMethod
2.09.1 - Name: Coordinate Collection Method.
2.09.2 - Description: Method by which coordinates are collected.
2.09.3 - Data Type: Text.
2.09.4 - Requirement: Required.
2.10 - MngUnit
2.10.1 - Name: Management Unit.
2.10.2 - Description: Management unit number/name in which the sample station falls, regardless
of whether sample level is community or management unit level data collection.
Provided to FNAI by FWC OBVM staff.
2.10.3 - Data Type: Text.
2.10.4 - Requirement: Required.
2.11 - NonPineDns
2.11.1 - Name: Non-pine stem density - core.
2.11.2 - Description: Stem count of all living non-pine woody species 4 inches DBH or greater
in the seven meter radius (154 m2) plot.
FNAI staff will record the actual count of woody stems 4 inch DBH within the 7m radius
plot.
2.11.3 - Data Type: Number.

September 2018
2.11.4 - Requirement: Required (may not apply to some communities or sample levels--refer to
Required Attributes table for details).
2.12 - Pt_type
2.12.1 - Name: Type of point.
2.12.2 - Description: Designates type of point (Original, Alternate or Abandoned).
2.12.3 - Data Type: Text.
2.12.4 - Requirement: Required.
2.13 - RareSpList
2.13.1 - Name: Rare Species List -FNAI Reference Area.
2.13.2 - Description: A comma delimited list of species codes representing all rare species
occurring in the 7m radius (152 m2) plot. All species tracked by FNAI are included here.
The code for these genus level observations is made up of the first 3 letters of the genus
followed immediately by the 3 letters of the species.
2.13.3 - Data Type: Text (Comma-Separated List).
2.13.4 - Requirement: Required (may not apply to some communities or sample levels--refer to
Required Attributes table for details).
2.14 - SampLevel
2.14.1 - Name: Sampling Level.
2.14.2 - Description: Sampling level for each sampling station (i.e., community or management
unit). Predetermined by FWC, not defined by FNAI in the field.
2.14.3 - Data Type: Text.
2.14.4 - Requirement: Required.
2.15 - SndPinDens:
2.15.1 - Name: Sand Pine Stem Density
2.15.2 - Description: Stem count of all living sand pine > 6 inches tall in the 7-meter radius (154
m2) plot. Contractors will record a count of the number of sand pine stems within the 7m
radius (154 m2) plot using the standard stem count classes (Table 3).
2.15.3 - Data Type: Number
2.15.4 - Requirement: Required (may not apply to some communities or sample levels--refer to
Required Attributes table for details).
2.16 - SubcnpyLst
2.16.1 - Name: Sub-canopy species list.
2.16.2 - Description: A comma delimited list of species codes representing all sub-canopy species
(pine and non-pine woody vegetation) occurring within the 7m radius circle plot of the
sample station.
A species-specific code is made up of the first 3 letters of the genus followed immediately
by the first 3 letters of the species (e.g. Quercus virginiana = Quevir). When field
identification to species level is not possible, the plant should be recorded to genus level.
The code for these genus level observations is made up of the first 6 letters of the genus
followed immediately by the letter "g"(e.g. an unknown Quercus species = Quercug). For
plant specimens that are unable to be identified to genus level a code consisting of the first
6 letters of the family followed by the letter "f" will be recorded (e.g. an unknown grass
species will be recorded as Poaceaf = Poaceae family). For codes that contain less than 6
letters for either genus or family, a code will be used consisting of the entire genus or
family followed by a "g" or "f", respectively (e.g. an unknown Carex species = Carexg).
Multiple unknown species of the same genus or family are recorded with duplicated codes
September 2018
(e.g., two unknown Carex species are recorded as "Carexg, Carexg").
2.16.3 - Data Type: Text (Comma-Separated List).
2.16.4 - Requirement: Required (may not apply to some communities or sample levels--refer to
Required Attributes table for details).
2.17 - Surveyor
2.17.1 - Name: Surveyor.
2.17.2 - Description: Initials or names of the person recording the data.
2.17.3 - Data Type: Text.
2.17.4 - Requirement: Required.
3.00 - DATA FIELDS & VALUES, 4M2 PLOT
3.01 - FNAIShrCov
3.01.1 - Name: FNAI Shrub Cover
3.01.2 - Description: Shrub cover of all shrub species (including Serenoa repens and Sabal
palmetto) within the 4m2 quadrat regardless of height. To be counted in this category, the
stem of the plant must be less than 2" DBH.
3.01.3 - Data Type: Text (Constrained to Accepted Values List).
3.01.4 - Requirement: Varies by WMA Community Type & Sample Level.
3.02 - HerbCov
3.02.1 - Name: Herbaceous species cover - core.
3.02.2 - Description: Total herbaceous percent cover class within the 1m2 quadrat. Includes living
and attached dead plant material. Possible % cover class values: 0, <1, 1-10, 11-20, 21-
30, 31-40, 41-50, 51-60, 61-70, 71-80,81-90, >90.
3.02.3 - Data Type: Text (Constrained to Accepted Values List).
3.02.4 - Requirement: Required (may not apply to some communities or sample levels--refer to
Required Attributes table for details).
3.03 - HrbSppLst
3.03.1 - Name: Herbaceous species list.
3.03.2 - Description: A comma delimited list of species codes representing all native herbaceous
species occurring in the 1m2 quadrat.
Herbaceous species include non-woody, soft-tissued plant species regardless of height,
including non-woody vines (e.g., Galactia elliottii, Smilax pumila), legumes (e.g.,
Crotalaria rotundifolia), forbs (e.g., Pityopsis graminifolia) and graminoids (grasses,
sedges, rushes; e.g., Aristida stricta, Rhynchospora tracyi). This includes attached dead
plant material.
This list can include species only keyed to genus or family. A species-specific code is
made up of the first 3 letters of the genus followed immediately by the first 3 letters of the
species (e.g. Quercus virginiana = Quevir). When field identification to species level is not
possible, the plant should be recorded to genus level. The code for these genus level
observations is made up of the first 6 letters of the genus followed immediately by the letter
"g" (e.g. an unknown Quercus species = Quercug). For plant specimens that are unable to
be identified to genus level a code consisting of the first 6 letters of the family followed by
the letter “f” will be recorded (e.g. an unknown grass species will be recorded as Poaceaf =
Poaceae family). For codes that contain less than 6 letters for either genus or family, a code
will be used consisting of the entire genus or family followed by a “g” or ”f”, respectively
(e.g. an unknown Carex species = Carexg). Multiple unknown species of the same genus
or family are recorded with duplicated codes (e.g., two unknown Carex species are
recorded as "Carexg, Carexg").

September 2018
3.03.3 - Data Type: Text (Comma-Separated List).
3.03.4 - Requirement: Required (may not apply to some communities or sample levels--refer to
Required Attributes table for details).
3.04 - MaxSerHt1
3.04.1 - Name: Maximum Serenoa height 1 - core.
3.04.2 - Description: Maximum height of tallest living Serenoa repens in the first of the four
1m2 quadrats.
This value will be measured in centimeters; above 3m estimate to nearest 10cm.
Measurement is made to the highest living part of the plant that is within the spatial extent
of the 1m2 quadrat from the ground upward.
The stems or petioles of this component do not need to be originating from the 4m2 quadrat.
Measured in the left (as viewed from center point) 1m2 quadrat nearest the center.
For quadrats that contain no Serenoa repens a value of “0” will be entered.
3.04.3 - Data Type: Number.
3.04.4 - Requirement: Required (may not apply to some communities or sample levels--refer to
Required Attributes table for details).
3.05 - MaxSerHt2
3.05.1 - Name: Maximum Serenoa height 2 - core.
3.05.2 - Description: Maximum height of tallest living Serenoa repens in the second of the four
1m2 quadrats.
This value will be measured in centimeters; above 3m estimate to nearest 10cm.
Measurement is made to the highest living part of the plant that is within the spatial extent
of the 1m2 quadrat from the ground upward.
The stems or petioles of this component do not need to be originating from the 4m2 quadrat.
Measured in the left (as viewed from center point) 1m2 quadrat furthest from the center.
For quadrats that contain no Serenoa repens a value of “0” will be entered.
3.05.3 - Data Type: Number.
3.05.4 - Requirement: Required (may not apply to some communities or sample levels--refer to
Required Attributes table for details).
3.06 - 3.06 - MaxSerHt3
3.06.1 - Name: Maximum Serenoa height 3 - core.
3.06.2 - Description: Maximum height of tallest living Serenoa repens in the third of the four
1m2 quadrats.
This value will be measured in centimeters; above 3m estimate to nearest 10cm.
Measurement is made to the highest living part of the plant that is within the spatial extent
of the 1m2 quadrat from the ground upward.
The stems or petioles of this component do not need to be originating from the 4m2 quadrat.
Measured in the right (as viewed from center point) 1m2 quadrat furthest from the center.
For quadrats that contain no Serenoa repens a value of “0” will be entered.
3.06.3 - Data Type: Number.
3.06.4 - Requirement: Required (may not apply to some communities or sample levels--refer to
Required Attributes table for details).
3.07 - MaxSerHt4
3.07.1 - Name: Maximum Serenoa height 4 - core.
3.07.2 - Description: Maximum height of tallest living Serenoa repens in the fourth of the four
1m2 quadrats.
This value will be measured in centimeters; above 3m estimate to nearest 10cm.

September 2018
Measurement is made to the highest living part of the plant that is within the spatial extent
of the 1m2 quadrat from the ground upward.
The stems or petioles of this component do not need to be originating from the 4m2 quadrat.
Measured in the right (as viewed from center point) 1 m2 quadrat nearest the center.
For quadrats that contain no Serenoa repens a value of “0” will be entered.
3.07.3 - Data Type: Number.
3.07.4 - Requirement: Required (may not apply to some communities or sample levels--refer to
Required Attributes table for details).
3.08 - MaxShrbDBH
3.08.1 - Name: Max Shrub DBH - core.
3.08.2 - Description: Maximum DBH of shrub stems (ShrubStems), recorded as a range. For DBH
values that fall on the boundary between two classes, choose the higher of the two classes
(e.g.: if DBH is 0.5, choose the 0.5-1.0 class. Preferred values are:
0, <0.25", 0.25-0.5", 0.5-1", 1.0-1.5", 1.5-2.0".
3.08.3 - Data Type: Text (Constrained to Accepted Values List).
3.08.4 - Requirement: Required (may not apply to some communities or sample levels--refer to
Required Attributes table for details).
3.09 - MaxShrbHt1
3.09.1 - Name: Maximum shrub height 1 - core.
3.09.2 - Description: Maximum height of the tallest living non-pine, non-Serenoa woody
species in the first quadrant of the 4m2 quad that is attached to any stem < 2 inches
DBH.
This value will be measured in centimeters; above 3m estimate to nearest 10cm.
Does not include vines.
This value will be measured in centimeters; above 3m estimate to nearest 10cm.
Measurement is made to the highest living part of the plant that is within the spatial extent
of the 1m2 quadrat from the ground upward.
The stems of this component do not need to be originating within the 4m2 quadrat.
Measured in the left (as viewed from center point) 1m2 quadrat nearest the center.
For quadrats that contain no woody species a value of “0” will be entered.
3.09.3 - Data Type: Number.
3.09.4 - Requirement: Required (may not apply to some communities or sample levels--refer to
Required Attributes table for details).
3.10 - 3.10 - MaxShrbHt2
3.10.1 - Name: Maximum shrub height 2 - core.
3.10.2 - Description: Maximum height of the tallest living non-pine, non-Serenoa woody
species in the second quadrant of the 4m2 quad that is attached to any stem < 2 inches
DBH.
This value will be measured in centimeters; above 3m estimate to nearest 10cm.
Does not include vines.
This value will be measured in centimeters; above 3m estimate to nearest 10cm.
Measurement is made to the highest living part of the plant that is within the spatial extent
of the 1m2 quadrat from the ground upward.
The stems of this component do not need to be originating within the 4m2 quadrat.
Measured in the left (as viewed from center point) 1m2 quadrat furthest from the center.
For quadrats that contain no woody species a value of “0” will be entered.
3.10.3 - Data Type: Number.
3.10.4 - Requirement: Required (may not apply to some communities or sample levels--refer to
September 2018
Required Attributes table for details).
3.11 - MaxShrbHt3
3.11.1 - Name: Maximum shrub height 3 - core.
3.11.2 - Description: Maximum height of the tallest living non-pine, non-Serenoa woody
species in the third quadrant of the 4m2 quad that is attached to any stem < 2 inches
DBH.
This value will be measured in centimeters; above 3m estimate to nearest 10cm.
Does not include vines.
This value will be measured in centimeters; above 3m estimate to nearest 10cm.
Measurement is made to the highest living part of the plant that is within the spatial extent
of the 1m2 quadrat from the ground upward.
The stems of this component do not need to be originating within the 4m2 quadrat.
Measured in the right (as viewed from center point) 1m2 quadrat furthest from the center.
For quadrats that contain no woody species a value of “0” will be entered.
3.11.3 - Data Type: Number.
3.11.4 - Requirement: Required (may not apply to some communities or sample levels--refer to
Required Attributes table for details).
3.12 - MaxShrbHt4
3.12.1 - Name: Maximum shrub height 4 - core.
3.12.2 - Description: Maximum height of the tallest living non-pine, non-Serenoa woody
species in the fourth quadrant of the 4m2 quad that is attached to any stem < 2 inches
DBH.
This value will be measured in centimeters; above 3m estimate to nearest 10cm.
Does not include vines.
This value will be measured in centimeters; above 3m estimate to nearest 10cm.
Measurement is made to the highest living part of the plant that is within the spatial extent
of the 1m2 quadrat from the ground upward.
The stems of this component do not need to be originating within the 4m2 quadrat.
Measured in the right (as viewed from center point) 1m2 quadrat nearest the center.
For quadrats that contain no woody species a value of “0” will be entered.
3.12.3 - Data Type: Number.
3.12.4 - Requirement: Required (may not apply to some communities or sample levels--refer to
Required Attributes table for details).
3.13 - NumUnkHerb
3.13.1 - Name: Number of unknown herbaceous plant species.
3.13.2 - Description: A count of the number of unknown herbaceous plant species (i.e., not
individuals) within the herbaceous 1m2 quadrat. This count only includes herbaceous
plants that cannot be keyed to at least family (i.e. herbaceous species that have not been
entered into the herbaceous species list).
3.13.3 - Data Type: Number.
3.13.4 - Requirement: Required (may not apply to some communities or sample levels--refer to
Required Attributes table for details).
3.14 - NumUnkWdy
3.14.1 - Name: Number of unknown woody plant species.
3.14.2 - Description: A count of the number of unknown woody plant species (i.e., not individuals)
within the 4m2 quadrat. This count only includes woody plants that cannot be keyed to at
least family (i.e. woody species that have not been entered into the woody species list).

September 2018
3.14.3 - Data Type: Number.
3.14.4 - Requirement: Required (may not apply to some communities or sample levels--refer to
Required Attributes table for details).
3.15 - Quad
3.15.1 - Name: Quadrat.
3.15.2 - Description: Quadrat from which data are collected in bearing degrees.
3.15.3 - Data Type: Number.
3.15.4 - Requirement: Required.
3.16 - 3.16 - SerenoaCov
3.16.1 - Name: Serenoa repens cover - core
3.16.2 - Description: Percent cover class below 1 meter of saw palmetto (Serenoa repens)
within the 4m2 quadrat.
Includes living and attached dead fronds and petioles.
Does not include trunks. Possible % cover class values: 0, <1, 1-10, 11-20, 21-30, 31-40,
41-50, 51-60, 61-70, 71-80,81-90, >90.
3.16.3 - Data Type: Text (Constrained to Accepted Values List)
3.16.4 - Requirement: Required (may not apply to some communities or sample levels--refer to
Required Attributes table for details).
3.17 - SerPetDens
3.17.1 - Name: Serenoa repens petioles - core
3.17.2 - Description: Count class of Serenoa repens petioles with fronds within the spatial
extent of the 4m2 quadrat from 1m height upward.
Includes living petioles and dead petioles with fronds; does not include dead petioles
without fronds.
The petioles of this component do not need to be originating from the 4m2 quadrat.
Possible petiole count class values: 0, 1-5, 6-10, 11-15, 16-25, 26-50, 51-100, 101-200,
>200.
3.17.3 - Data Type: Text (Constrained to Accepted Values List).
3.17.4 - Requirement: Required (may not apply to some communities or sample levels--refer to
Required Attributes table for details).
3.18 - ShrubCov
3.18.1 - Name: Shrub cover - core
3.18.2 - Description: Percent cover class of living shrub species below 1 meter height within the
4m2 quadrat.
Includes all woody species except pine and Serenoa repens.
The stems of this component do not need to be originating from the 4m2 quadrat.
For quadrats that contain no shrub cover, a value of "0" will be entered. Possible % cover
class values: 0, <1, 1-10, 11-20, 21-30, 31-40, 41-50, 51-60, 61-70, 71-80,81-90, >90.
3.18.3 - Data Type: Text (Constrained to Accepted Values List).
3.18.4 - Requirement: Required (may not apply to some communities or sample levels--refer to
Required Attributes table for details).
3.19 - ShrubStems
3.19.1 - Name: Shrub Stem Count - core
3.19.2 - Description: Stem count class for all living primary non-pine, non-Serenoa woody stems
less than 2" DBH within the spatial extent of the 4m2 quadrat from 1m height upward.
The stems of this component do not need to be originating from the 4m2 quadrat.

September 2018
A primary stem is one that is identifiable as a single stem at the soil surface and may or
may not be branched. Possible stem count class values: 0, 1-5, 6-10, 11-15, 16-25, 26-50,
51-100, 101-200, >200.
Does not include vines.
3.19.3 - Data Type: Text (Constrained to Accepted Values List).
3.19.4 - Requirement: Required (may not apply to some communities or sample levels--refer to
Required Attributes table for details).
3.20 - SubCan
3.20.1 - Name: Sub-canopy stem count - core
3.20.2 - Description: Count of all living primary non-pine woody species that are 2-4"
diameter at breast height within the space above the 4m2 quad. Stems that divide
below breast height and coppiced shoots should be counted individually. The stems of this
component do not need to be originating from the 4m2 quadrat. A primary stem is one that
is identifiable as a single stem at the soil surface and may or may not be branched.
3.20.3 - Data Type: Number.
3.20.4 - Requirement: Required (may not apply to some communities or sample levels--refer to
Required Attributes table for details).
3.21 - WdySpLst.
3.21.1 - Name: Woody species list
3.21.2 - Description: Comma delimited list of species codes representing all woody species
occuring in the quadrat.
Use the correct 6 or 7 letter species code.
Include all woody plant species, including woody vines and palms, regardless of height and
excluding pines.
Includes attached dead plant material. A species-specific code is made up of the first 3
letters of the genus followed immediately by the first 3 letters of the species (e.g. Quercus
virginiana = quevir). When field identification to species level is not possible, the plant
should be recorded to genus level. The code for these genus level observations is made up
of the first 6 letters of the genus followed immediately by the letter "g" (e.g. an unknown
Quercus species = Quercug). For plant specimens that are unable to be identified to genus
level a code consisting of the first 6 letters of the family followed by the letter “f” will be
recorded (e.g. an unknown grass species will be recorded as Poaceaf = Poaceae family).
For codes that contain less than 6 letters for either genus or family, a code will be used
consisting of the entire genus or family followed by a ”g” or ”f”, respectively (e.g. an
unknown Carex species = Carexg). Multiple unknown species of the same genus or family
are recorded with duplicated codes (e.g., two unknown Carex species are recorded as
"Carexg, Carexg").
3.21.3 - Data Type: Text (Comma-Separated List)
3.21.4 - Requirement: Required (may not apply to some communities or sample levels--refer to
Required Attributes table for details).
September 2018
APPENDIX E: Taxonomic Resources
The following are commonly referenced plant taxonomy resources for Florida. There are other resources
available but these are referenced routinely by FWC/FWRI research staff in their research and monitoring
activities.
Godfrey, Robert K. and Jean W. Wooten. 1981. Aquatic and wetland plants of southeastern United
States. Dicotyledons. University of Georgia Press, Athens, USA.
Godfrey, Robert K. and Jean W. Wooten. 1979. Aquatic and wetland plants of southeastern United
States. Monocotyledons. University of Georgia Press, Athens, USA.
Godfrey, Robert K. 1989. Trees, Shrubs, and Woody Vines of Northern Florida and Adjacent Southern
Georgia and Alabama. University of Georgia Press, Athens, USA.
Gould, Frank W. 1951, The Grasses of Texas. 1977 Reprint. Texas A&M University Press, College
Station, USA.
Wunderlin, R. P. and B. F. Hansen. 2003. Guide to the vascular plants of Florida. Second Edition.
University Press of Florida, Gainesville, USA.