object detection based on faster r-cnn algorithm with skip
TRANSCRIPT

sensors
Article
Object Detection Based on Faster R-CNN Algorithmwith Skip Pooling and Fusion ofContextual Information
Yi Xiao , Xinqing Wang *, Peng Zhang, Fanjie Meng and Faming ShaoDepartment of Mechanical Engineering, College of Field Engineering, Army Engineering University of PLA,Nanjing 210007, China; [email protected] (Y.X.); [email protected] (P.Z.);[email protected] (F.M.); [email protected] (F.S.)* Correspondence: [email protected]; Tel.: +86-185-4985-4591
Received: 2 August 2020; Accepted: 24 September 2020; Published: 25 September 2020�����������������
Abstract: Deep learning is currently the mainstream method of object detection. Faster region-basedconvolutional neural network (Faster R-CNN) has a pivotal position in deep learning. It hasimpressive detection effects in ordinary scenes. However, under special conditions, there can still beunsatisfactory detection performance, such as the object having problems like occlusion, deformation,or small size. This paper proposes a novel and improved algorithm based on the Faster R-CNNframework combined with the Faster R-CNN algorithm with skip pooling and fusion of contextualinformation. This algorithm can improve the detection performance under special conditions onthe basis of Faster R-CNN. The improvement mainly has three parts: The first part adds a contextinformation feature extraction model after the conv5_3 of the convolutional layer; the second part addsskip pooling so that the former can fully obtain the contextual information of the object, especially forsituations where the object is occluded and deformed; and the third part replaces the region proposalnetwork (RPN) with a more efficient guided anchor RPN (GA-RPN), which can maintain the recallrate while improving the detection performance. The latter can obtain more detailed informationfrom different feature layers of the deep neural network algorithm, and is especially aimed at sceneswith small objects. Compared with Faster R-CNN, you only look once series (such as: YOLOv3),single shot detector (such as: SSD512), and other object detection algorithms, the algorithm proposedin this paper has an average improvement of 6.857% on the mean average precision (mAP) evaluationindex while maintaining a certain recall rate. This strongly proves that the proposed method hashigher detection rate and detection efficiency in this case.
Keywords: object detection; Faster R-CNN; context; skip pooling; guided anchor RPN
1. Introduction
With the vigorous development of deep learning, object detection technology has receivedextensive attention and many scholars have conducted in-depth research. Object detection algorithmsinclude frame difference [1], background subtraction [2], optical flow [3], and Hough transform [4]methods. These are commonly used as traditional object detection methods, and they have manylimitations in the process of detecting objects [5]; for example, the classification is too narrow, theapplication scenarios are limited to simple backgrounds, too much manual intervention is required toobtain features, or autonomy cannot be achieved. They also have serious shortcomings in robustness,which leads to problems such as poor generalization ability and poor detection results. Traditionalobject detection algorithms can no longer meet the application requirements of industrial and militaryfields, and object detection based on deep learning has thus become a popular research direction formany scholars around the world.
Sensors 2020, 20, 5490; doi:10.3390/s20195490 www.mdpi.com/journal/sensors

Sensors 2020, 20, 5490 2 of 20
Object detection algorithms based on deep learning are basically not restricted by the applicationscenario; they can realize autonomous learning and have good detection performance [6]. At present,object detection algorithms based on deep learning tend to be relatively mature and can have betterdetection performance in specific scenes, such as pedestrian detection [7], face detection [8], etc.These algorithms can be widely used in intelligent monitoring systems [9], intelligent transportationsystems [10], military object detection [11], medical object detection [12], etc. However, there is moreroom for optimization in more special scenes [13], such as the problems of occlusion, too small scale,deformation, and camouflage of the object in the image. For example, problems exist in how the objectcan be accurately and quickly captured by part of the feature information when it is partially occludedand how it can be selected and located from the limited feature information when its scale is too small.
It is also worth mentioning the problem of generating more suitable anchors in object detection.An anchor is often used as a benchmark frame for classification and regression in object detection.Most of the commonly used anchoring methods cannot cover the object area well due to their fixedshape. In order to ensure a high recall rate, an excessively large number of anchors is required, whichwill result in too many negative samples in the range enclosed by the anchors. The general anchorgeneration method will have such problems, resulting in poor detection performance.
In order to deal with the above problems, this paper proposes an improved algorithm basedon faster region-based convolutional neural network (R-CNN), with higher detection performance.It uses the guided anchor method [14] to replace the previous region proposal network (RPN), selectivesearch [15], and other candidate region methods. On this basis, the context feature is also used toobtain the network module [16] to solve the problem of object occlusion. The skip pooling method [17]is used for multi-feature fusion of different deep neural network algorithms to solve the problem ofsmall object scale, so as to optimize the detection performance of Faster R-CNN in complex scenes.
This paper proposes a Faster R-CNN algorithm combined with skip pooling and fusion ofcontextual information. This method can provide detection and classification accuracy comparable tothe latest methods. The main contributions of this paper are summarized as follows:
• A new RPN algorithm is used, guided anchor RPN (GA-RPN), which predicts the position andshape of the anchor to generate a sparse anchor that can tightly surround the object and fit theobject shape. This method can reduce the calculation time while maintaining a high recall rate.
• A context information feature extraction network fused with contextual information is used.The network can provide the contextual information of a partially occluded object for the proposedmethod and use the contextual information around the object as the information reference for theobject’s own feature detection.
• In order to solve the problem of less feature information from smaller objects in a single featurelayer, this paper proposes skip pooling, which combines the features of multiple feature layers,greatly improving the expression ability of features, and is suitable for small object detection.
The organization of the rest of this paper is as follows: Section 2 is about related work. Section 3 isa detailed discussion of the proposed method, which includes two parts, the context feature extractedmodel, and the multi-layer feature fusion. Section 4 analyzes the experimental results. Finally,conclusions and future work are presented in Section 5.
2. Related Work
Object detection algorithms are mainly traditional or based on deep learning. Currently, algorithmsbased on deep learning are widely used in various fields as a mainstream method of object detection.In the process of object detection, there can be many uncertain factors, such as too-small object scale,rotated object, etc. In addition, the object is usually affected by factors such as illumination andocclusion, which makes the detection algorithm difficult. In order to improve the generalization abilityof the algorithm, researchers need to make appropriate modifications and improvements according tothe specific situation.

Sensors 2020, 20, 5490 3 of 20
For example, for the object rotation problem, a simple but effective method was proposed in [18]to train rotation-invariant and Fisher discriminative CNN models to further boost object detectionperformance. For the object occlusion problem, a simple but effective framework was developedin [19] for camouflaged object detection (COD), termed search identification network, which can helpfacilitate future research on COD. This paper focuses on the problem of too-small object scale andpartial occlusion. The network framework of object detection affects the detection process. The mainpurpose of optimization for this framework is to avoid redundant and missed detection. Therefore,the framework structure usually determines the detection performance. The current object detectionalgorithm framework based on deep learning includes a two-stage algorithm represented by theR-CNN series and the one-stage algorithm represented by you only look once (YOLO) and single shotdetector (SSD) series. The main difference between the two is that the two-stage algorithm needs togenerate a large number of preselected boxes that may contain objects, and then perform fine-grainedobject detection. The object detection framework requires a preselected box algorithm.
The pioneering work of the two-stage algorithm for object detection began with R-CNN [20],which includes three modules: region proposal, vector transformation, and classification. SSP-net [21]optimizes R-CNN in many aspects and improves detection performance. Fast R-CNN [22] combinesthe essence of R-CNN and SPP-net, and introduces a multi-task loss function, which makes the trainingand testing of the entire network very convenient. Faster R-CNN [23] uses RPN to replace the selectivesearch module in Fast R-CNN, and RPN shares functions with Fast R-CNN. This greatly improves thetime and accuracy of object detection.
Other object detection frameworks do not require the process of generating candidate boxes.The one-stage algorithm can directly extract features from the network to predict object classificationand location. The OverFeat method [24] classifies the detection area by sliding windows with differentproportions at each feature point of the topmost feature layer. The YOLO method [25] classifies andlocates objects in one step, and directly returns the position and category of the bounding box in theoutput layer. The SSD method [26] uses convolutional kernels on feature maps to predict the class andcoordinate offsets of a series of default bounding boxes.
Whether it is a one-stage or two-stage algorithm, they both use anchors extensively. Usuallythe former uses RPN to generate anchors, and the latter directly classifies and regresses anchors.Therefore, the number and shape of anchors greatly affect the performance of the object detectionalgorithm. Wang et al. [14] proposed an anchor that can generate sparse and arbitrary shapes throughimage features, which can reduce the number of anchors and optimize their shape while ensuring acertain recall rate. Cheng et al. [27] proposed a proposal generation method, which can generate moreproposals that have higher intersection over union (IoU) with ground truth boxes than those obtainedby greedy search approaches, which can better envelop entire objects. Zhang et al. [28] proposed afast matching algorithm that robustly matches region proposals with massive exemplars in termsof appearance and spatial context, and can robustly handle noisy localizations of image exemplars.Compared with two-stage algorithms in terms of detection speed, one-stage algorithms are faster, butin terms of detection accuracy, the popular version of the former is better than the latter.
The accuracy of detection and classification in the object detection process usually depends on thefeature expression of the detection object, which includes two aspects: the feature expression of thearea where the detection object belongs, and the feature expression outside the detection area, whichinvolves the fusion of contextual information. Whether or not the object can be characterized well, thistests the detection performance of the algorithm. However, small object detection has problems, suchas blurred images, low information, and easy misjudgment. Therefore, the feature expression of smallobject detection is particularly important. Because the RGB color space is unstable and unreliable,manual features that improve detection efficiency by transforming the original image features [29]were widely used in the initial stage of object detection. Due to the large amount of hand-made featuredata and the lack of high-level semantic expression capability, it was gradually replaced by relateddeep learning technologies.

Sensors 2020, 20, 5490 4 of 20
The R-CNN method [6] uses trained CNNs to classify the object area and then judges whetherit belongs to the object or background area. Faster R-CNN [9] uses a VGG16-based networkas a feature extraction network and has obtained very good results. Since many methods onlyfocus on detecting the object itself [30,31], the relationship between the object and its surroundingenvironment is often ignored, and this information is usually helpful for the correct judgment of thedetection algorithm. Context-based object detection was summarized, experimented on, and analyzedin [32]. They concluded that the combination of contextual information and object detection canimprove detection performance. The proposed inside-outside network (ION) [17] combines contextualinformation with regions of interest. It uses skip pooling and contextual information with spatialrecurrent neural networks, which can detect small and occluded objects. In [33], a multi-scale spatialcontext was attached to a region-based CNN model to extract the relationship between the objectand the background. Multi-scale context was used in [34] to attach to the detection function andimprove the detection performance. These methods achieved good results in the performance of objectdetection, such as accuracy and speed.
Recently, more studies have improved object detection algorithms by using multi-layer andmulti-scale representation methods. Compared with using only one layer of deep convolution features,multi-layer and multi-scale feature fusion methods can achieve richer feature expression [35–38].A three-layer deep convolution feature in ResNet-50 was used in [39] for small object detection inoptical remote sensing images. A feature pyramid network (FPN) was proposed in [40], which useda multi-scale feature fusion method that combined semantic information and location information,greatly improving the performance of object detection, especially for small objects. A backbone networkspecifically for small object detection was proposed in [41]. This network was an improved algorithmbased on the ResNet-50 network, and its detection accuracy was several percentage points higher.Multi-scale and multi-level deep feature information of a fully convolutional neural network was usedin [38], which provided more semantic information. Skip layer connection was used to extract featuresin [42]. The information obtained was especially important for small objects. The results showed thatmulti-scale representation can improve small object detection.
3. SC-Faster R-CNN
Faster R-CNN has significant detection performance for object detection in general scenes, butusually the detected objects in such scenes have problems such as occlusion, deformation, and largescale. In scenes where these special problems exist, the detection performance of Faster R-CNNhas greater limitations. The SC-Faster R-CNN algorithm proposed in this paper effectively solvessuch problems.
The deep network algorithm is based on Faster R-CNN as the framework. The structuralframework of SC-Faster R-CNN is shown in Figure 1, and its operation process is as follows:
1. Skip pooling operations are performed on multiple feature layers. Through GA-RPN processingof conv3_3, conv4_3, and conv5_3 multi-feature layers to obtain the feature map mapped to theregion of interest (ROI), the size of the mapped area is adjusted to the same size sections, thenthe max pooling operation is performed on each section, so that fixed-size feature maps can beobtained from ROIs of different sizes.
2. The feature maps are linearly combined by L2 normalize. Because the features between dimensionshave certain differences in position and value, L2 normalize can improve the accuracy of the modeland make features of the same type in different dimensions have a certain degree of similarity.
3. By using the concat [43] method and 1x1 conv processing, the feature map after ROI mapping isshaped and dimension reduced. The ROI in the processed image will generate a feature vector ofa fixed size.
4. The feature vectors are input to the classifier through the fully connected layer to classifythe features.

Sensors 2020, 20, 5490 5 of 20
Sensors 2020, 20, x FOR PEER REVIEW 5 of 21
Figure 1. Structural framework of SC-Faster region-based convolutional neural network (R-CNN). The method is the Faster R-CNN framework combined with skip pooling and fusion of contextual information.
3.1. Context Feature Extracted Model
Occlusion is currently a problem that needs to be solved urgently in object detection, because after the object is occluded, its feature information will be greatly reduced, and this will have an effect on the occluded object, making it extremely difficult to detect and easy to be misrecognized [44]. In view of this situation, this paper proposes a feature extraction model based on contextual information. Before introducing the model, a more important theoretical method used by the model is introduced, recurrent neural network (RNN) [45].
From Figure 2, we can see that the recurrent neural network maps all directional features into a two-dimensional vector space. The directions of some of the upper left and lower left features are very close, so the two vectors representing them are very close in the vector space. The upper right and lower left direction features are quite different, and the distance between them is much larger compared to the vectors in the other directions. In this way, by comparing the distance between vectors, a representation of semantic information can be obtained.
Figure 2. Schematic of recurrent neural network based on directional characteristics in texture features.
We placed one-way moving RNNs in the last layer of the fifth convolutional layer based on VGG-16 (i.e., conv5_3), as shown in Figure 3. Generally, RNNs will have a certain input loss in each step of the operation, but important details in the image will still learn the feature information well
conv1 conv2 conv3 conv4 conv5
proposal
context feature extracted model
fc fc1x1
softmax
bbox
fc
concat
L2 normalize
RoI pooling
1x11x1
1x1
1x1
3x3
shape
location
1x1
GA-RPN
Anchor generation
Feature adaption
GA-RPN
GA-RPN
GA-RPN
Figure 1. Structural framework of SC-Faster region-based convolutional neural network (R-CNN).The method is the Faster R-CNN framework combined with skip pooling and fusion ofcontextual information.
3.1. Context Feature Extracted Model
Occlusion is currently a problem that needs to be solved urgently in object detection, because afterthe object is occluded, its feature information will be greatly reduced, and this will have an effect onthe occluded object, making it extremely difficult to detect and easy to be misrecognized [44]. In viewof this situation, this paper proposes a feature extraction model based on contextual information.Before introducing the model, a more important theoretical method used by the model is introduced,recurrent neural network (RNN) [45].
From Figure 2, we can see that the recurrent neural network maps all directional features intoa two-dimensional vector space. The directions of some of the upper left and lower left features arevery close, so the two vectors representing them are very close in the vector space. The upper rightand lower left direction features are quite different, and the distance between them is much largercompared to the vectors in the other directions. In this way, by comparing the distance between vectors,a representation of semantic information can be obtained.
Sensors 2020, 20, x FOR PEER REVIEW 5 of 21
Figure 1. Structural framework of SC-Faster region-based convolutional neural network (R-CNN). The method is the Faster R-CNN framework combined with skip pooling and fusion of contextual information.
3.1. Context Feature Extracted Model
Occlusion is currently a problem that needs to be solved urgently in object detection, because after the object is occluded, its feature information will be greatly reduced, and this will have an effect on the occluded object, making it extremely difficult to detect and easy to be misrecognized [44]. In view of this situation, this paper proposes a feature extraction model based on contextual information. Before introducing the model, a more important theoretical method used by the model is introduced, recurrent neural network (RNN) [45].
From Figure 2, we can see that the recurrent neural network maps all directional features into a two-dimensional vector space. The directions of some of the upper left and lower left features are very close, so the two vectors representing them are very close in the vector space. The upper right and lower left direction features are quite different, and the distance between them is much larger compared to the vectors in the other directions. In this way, by comparing the distance between vectors, a representation of semantic information can be obtained.
Figure 2. Schematic of recurrent neural network based on directional characteristics in texture features.
We placed one-way moving RNNs in the last layer of the fifth convolutional layer based on VGG-16 (i.e., conv5_3), as shown in Figure 3. Generally, RNNs will have a certain input loss in each step of the operation, but important details in the image will still learn the feature information well
conv1 conv2 conv3 conv4 conv5
proposal
context feature extracted model
fc fc1x1
softmax
bbox
fc
concat
L2 normalize
RoI pooling
1x11x1
1x1
1x1
3x3
shape
location
1x1
GA-RPN
Anchor generation
Feature adaption
GA-RPN
GA-RPN
GA-RPN
Figure 2. Schematic of recurrent neural network based on directional characteristics in texture features.
We placed one-way moving RNNs in the last layer of the fifth convolutional layer based onVGG-16 (i.e., conv5_3), as shown in Figure 3. Generally, RNNs will have a certain input loss in eachstep of the operation, but important details in the image will still learn the feature information well

Sensors 2020, 20, 5490 6 of 20
and then output the feature map with contextual information after updating the hidden layer stateinformation. The specific operation is to place the RNNs along the horizontal and vertical directions ofthe output image of conv5_3, so it can be considered that the RNNs move in four directions on theimage: up, down, left, and right. Since initializing the recursive weight matrix as an identity matrixcan greatly optimize model training and facilitates good performance in modeling the dependenciesof further layers, RNNs adopt the nonlinear method of recursive weight matrix and use it in eachstep. The image generated in this way has the same size as the output image of conv5_3. In order tostrengthen the learning of feature information but also reduce the input loss due to RNN operations,experiments have shown that RNNs can obtain better feature learning results through three types ofrecursive contextual information learning. This paper uses this structure because it is easy to achieveparallelization, which is conducive to improving network performance.
Sensors 2020, 20, x FOR PEER REVIEW 6 of 21
and then output the feature map with contextual information after updating the hidden layer state information. The specific operation is to place the RNNs along the horizontal and vertical directions of the output image of conv5_3, so it can be considered that the RNNs move in four directions on the image: up, down, left, and right. Since initializing the recursive weight matrix as an identity matrix can greatly optimize model training and facilitates good performance in modeling the dependencies of further layers, RNNs adopt the nonlinear method of recursive weight matrix and use it in each step. The image generated in this way has the same size as the output image of conv5_3. In order to strengthen the learning of feature information but also reduce the input loss due to RNN operations, experiments have shown that RNNs can obtain better feature learning results through three types of recursive contextual information learning. This paper uses this structure because it is easy to achieve parallelization, which is conducive to improving network performance.
Figure 3. Feature extraction model based on contextual information.
In order to initialize the weight identity matrix for RNNs, the activation function uses the rectified linear unit (ReLU) function, which can improve the training speed. Le et al. [46] called the motion module composed of ReLU and RNNs as “IRNNs”. There are four IRNNs moving in different directions on the image being operated, and all the IRNNs can obtain information characteristics in the corresponding direction. From the structure diagram of the contextual feature extraction model, it can be seen that before each IRNN operation, it must be filtered by a 1 × 1 shared convolution kernel. The shared convolution kernel can work in different directions, and it can ensure accuracy. In the case of reducing redundant convolution kernels, in the process of sharing, the deviation of each layer will be transmitted with the shared convolution kernel, which helps the effective convergence of the function. The output of IRNNs is based on cascading calculations of the hidden states in different directions at each spatial position.
When IRNNs move from left to right or top to bottom in the image, each time an input is consumed, a hidden unit is updated and an output is generated at the same time. In this way, it expands in four directions from left to right, right to left, top to bottom, and bottom to top. In order to realize the function of IRNNs as efficiently as possible, the internal IRNNs are split and calculated during the operation. The formula of IRNNs for different directions in the process of moving is
( )derc
, , 1 ,max , 0derc derc derc
i j ff i j i jf W f f−← + (1)
where derc represents the four motion directions of IRNNs (up, down, left, and right); derc
ffW and , 1
derc
i jf −
represent the weight of the hidden state in the corresponding direction and the input from 1 1× convolution to the hidden layer, respectively. In order to simplify the calculation, set derc
ffW as the
identity matrix, so that Formula (1) is equivalent to an accumulator:
( )derc
, , 1 ,max , 0derc derc
i j i j i jf f f−← + . (2)
3.2. GA-RPN
Anchors are widely used in object detection based on deep learning as a mechanism for generating object region proposals. The number and shape of anchors greatly affect the performance of the object detection algorithm. Since the commonly used anchors have a limited aspect ratio, in
Figure 3. Feature extraction model based on contextual information.
In order to initialize the weight identity matrix for RNNs, the activation function uses the rectifiedlinear unit (ReLU) function, which can improve the training speed. Le et al. [46] called the motionmodule composed of ReLU and RNNs as “IRNNs”. There are four IRNNs moving in differentdirections on the image being operated, and all the IRNNs can obtain information characteristics in thecorresponding direction. From the structure diagram of the contextual feature extraction model, itcan be seen that before each IRNN operation, it must be filtered by a 1 × 1 shared convolution kernel.The shared convolution kernel can work in different directions, and it can ensure accuracy. In thecase of reducing redundant convolution kernels, in the process of sharing, the deviation of each layerwill be transmitted with the shared convolution kernel, which helps the effective convergence of thefunction. The output of IRNNs is based on cascading calculations of the hidden states in differentdirections at each spatial position.
When IRNNs move from left to right or top to bottom in the image, each time an input is consumed,a hidden unit is updated and an output is generated at the same time. In this way, it expands in fourdirections from left to right, right to left, top to bottom, and bottom to top. In order to realize thefunction of IRNNs as efficiently as possible, the internal IRNNs are split and calculated during theoperation. The formula of IRNNs for different directions in the process of moving is
f derci, j ← max
(Wderc
f f f derci, j−1 + f derc
i, j , 0)
(1)
where derc represents the four motion directions of IRNNs (up, down, left, and right); Wdercf f and
f derci, j−1 represent the weight of the hidden state in the corresponding direction and the input from 1× 1
convolution to the hidden layer, respectively. In order to simplify the calculation, set Wdercf f as the
identity matrix, so that Formula (1) is equivalent to an accumulator:
f derci, j ← max
(f derci, j−1 + f derc
i, j , 0). (2)
3.2. GA-RPN
Anchors are widely used in object detection based on deep learning as a mechanism for generatingobject region proposals. The number and shape of anchors greatly affect the performance of the

Sensors 2020, 20, 5490 7 of 20
object detection algorithm. Since the commonly used anchors have a limited aspect ratio, in orderto maintain a high recall rate, more anchors need to be generated, which is not only inefficient butalso leads to decreased detection accuracy, because most of the area surrounded by the anchor frameis background. Therefore, an anchor generation strategy that can effectively reduce the number ofanchors and tightly surround the object without manual intervention will have great significance foroptimizing the performance of object detection.
In this paper, we utilized the guided anchor method instead of the RPN in Faster R-CNN togenerate anchors with no redundancy and suitable size. In the guided anchor method, first, we usedfour parameters (x, y, w, h) to describe an anchor, where (x, y) represents the coordinates and w and hrepresent the width and height, respectively, of the anchor. Therefore, the distribution probability ofthe anchor on image I can be expressed by the formula
p(x, y, w, h∣∣∣I) = p(x, y
∣∣∣I)p(w, h∣∣∣x, y, I). (3)
As can be seen from the formula, the probability distribution of the anchor is decomposed intotwo conditional probability distributions, that of the anchor center point on a given feature map andthat of the shape after the image feature and the center point. These two probabilities respectivelyindicate that the object may have a certain area and the shape of the object has a close relationship withits position.
According to the distribution probability formula of the anchor on image I, Wang et al. [14]designed an anchor generation module that uses two branches to predict the position and shape ofthe anchor. For example, in the skip pooling branch in this paper, we first used the anchor positionprediction branch to generate a probability distribution map in feature map F1, which indicates thepossible position of the object in the image. Similarly, the shape predicts the shape of the branchposition. The results generated by these two prediction branches are combined, and then the mostlikely object position and corresponding shape are selected through a preset threshold.
3.2.1. Position Prediction of Anchor
As shown in Figure 4, the size of the probability distribution map generated by the anchor positionprediction branch is the same as the input feature map F1. The area of the entire feature map is dividedinto an object center area, a peripheral area, and an ignored area through the position probabilitydistribution map. The main idea is to set a small piece of ground truth boxing center corresponding tothe area on F1 as a positive sample during the training process, and set the threshold for the remainingareas to mark the ignore area or peripheral area according to the distance from the center. Throughsuch position prediction, part of the area can be screened out as the candidate center position of theanchor, so that the number of anchors is greatly reduced while still maintaining the same recall rate.When doing inference, because there is no need to consider the excluded area, masked convolution canbe used instead of ordinary convolution, so that calculations can be performed only where there is ananchor, thereby speeding up the calculation.
3.2.2. Shape Prediction of Anchor
The purpose of the shape prediction branch is to predict the best length and width given theanchor center point, which is a regression problem. According to the usual practice, first calculate theobject, that is, the optimal w and h of the anchor at the center point, and then use losses such as L1, L2,or Smooth L1 to supervise. The length and width of the object are not easy to calculate, and it will bemore difficult to implement, so we directly use IoU as supervision to learn w and h.

Sensors 2020, 20, 5490 8 of 20Sensors 2020, 20, x FOR PEER REVIEW 8 of 21
Figure 4. Architecture of guided anchor, based on anchor generation module with two branches to predict the anchor location and shape. Feature adaption module is applied to the feature map to make the new feature map aware of anchor shapes.
3.2.2. Shape Prediction of Anchor
The purpose of the shape prediction branch is to predict the best length and width given the anchor center point, which is a regression problem. According to the usual practice, first calculate the object, that is, the optimal w and h of the anchor at the center point, and then use losses such as L1, L2, or Smooth L1 to supervise. The length and width of the object are not easy to calculate, and it will be more difficult to implement, so we directly use IoU as supervision to learn w and h.
Previously, IoU was used to directly calculate the anchor and all ground truth, but the current w and h are uncertain, so they cannot be calculated according to the conventional algorithm. To solve this problem, refer to [14], which defines the IoU between a variable anchor
( ){ }0 0 , , , 0, 0|wha x y w h w h= > > and a ground truth bounding box ( ) , , , g g g ggt x y w h=
as follows, denoted as vIoU:
0, 0, ( ) ( , )wh normal wh
w hvIoU a gt max IoU a gt
> >= . (4)
Since the parameters in the formula are all variables, the calculation of ( ),whvIoU a gt is complicated and it is difficult to realize effective operation in the end-to-end network, so an approximate substitution method is adopted to solve this problem. The approximate replacement method is to match the anchor with the specific gt according to the sampled w and h, and then use the bounded IoU loss as the loss of this branch.
1 11 ,( ( )) (1 , ) ( )g gshape
g g
w hw hL L min L minw w h h
= − + − (5)
Here, (w, h) and (wg, hg) represent the shape of the predicted anchor and the corresponding ground-truth bounding box, and L1 is the smooth L1 loss.
3.2.3. Anchor-Guided Feature Adaptation
In different positions of conv in the same layer, the receptive field of the feature is the same. In the original RPN, both represent anchors of the same shape, but now each anchor has its own unique shape and size, which does not match the feature particularly well. In addition, for the original feature map, it does not know the shape of the anchor or the branch prediction, but the subsequent
proposal
1x1
1x1 shape
location
1x1
Anchor generation
Feature adaption
offset field
anchors
F1NT
Figure 4. Architecture of guided anchor, based on anchor generation module with two branches topredict the anchor location and shape. Feature adaption module is applied to the feature map to makethe new feature map aware of anchor shapes.
Previously, IoU was used to directly calculate the anchor and all ground truth, but thecurrent w and h are uncertain, so they cannot be calculated according to the conventionalalgorithm. To solve this problem, refer to [14], which defines the IoU between a variable anchorawh =
{(x0, y0, w, h)
∣∣∣w > 0, h > 0}
and a ground truth bounding box gt =(xg, yg, wg, hg
)as
follows, denoted as vIoU:
vIoU(awh, gt) = maxw>0,h>0
IoUnormal(awh, gt). (4)
Since the parameters in the formula are all variables, the calculation of vIoU(awh, gt) is complicatedand it is difficult to realize effective operation in the end-to-end network, so an approximate substitutionmethod is adopted to solve this problem. The approximate replacement method is to match the anchorwith the specific gt according to the sampled w and h, and then use the bounded IoU loss as the loss ofthis branch.
Lshape = L1(1−min(wwg
,wg
w)) + L1(1−min(
hhg
,hg
h)) (5)
Here, (w, h) and (wg, hg) represent the shape of the predicted anchor and the correspondingground-truth bounding box, and L1 is the smooth L1 loss.
3.2.3. Anchor-Guided Feature Adaptation
In different positions of conv in the same layer, the receptive field of the feature is the same. In theoriginal RPN, both represent anchors of the same shape, but now each anchor has its own unique shapeand size, which does not match the feature particularly well. In addition, for the original feature map,it does not know the shape of the anchor or the branch prediction, but the subsequent classificationand regression are based on the predicted anchor, and errors may occur. So, a feature adaption modulewas added to solve this problem.
This module directly integrates the shape information of the anchor into the feature map, sothat the newly obtained feature map can adapt to the shape of each position anchor. Using a 3 × 3deformable convolution to correct the original feature map, the offset of the deformable convolution isobtained through a 1 × 1 conv through the w and h of the anchor. Through this operation, the purposeof making the effective range of the feature closer to the shape of the anchor is achieved, and different
Sensors 2020, 20, 5490 9 of 20
positions of the same conv can also represent anchors of different shapes and sizes. The formula offeature adaption is as follows:
f ′i = NT( fi, wi, hi) (6)
where fi is the feature at the ith location, (wi, hi) is the corresponding anchor shape, and NT representsa 3 × 3 deformable convolutional layer.
3.3. Multi-Layer Feature Fusion
The deep neural network algorithm is currently the mainstream method in the field of objectdetection. It extracts and classifies features in an image through autonomous learning during thetraining process and finally achieves the effect of object detection. The network structure in deepneural network algorithms is usually divided into shallow and deep networks. The characteristicsof shallow network are that it has a relatively small receptive field and a strong ability to representdetailed geometric information. Although the resolution is high, its ability to represent semanticinformation is very weak [47]. The characteristics of the deep network are that it has a relatively largereceptive field and a strong ability to represent semantic information, but the resolution of its featuremap is low, and details of spatial geometric feature are lacking [48]. Usually objects of different scalesare stored in the scene of object detection at the same time. In order to be able to detect large andsmall objects at the same time, it is necessary to use the small receptive field network to obtain featureinformation for small objects and the large receptive field network to process large objects. Therefore,this paper uses a multi-layer feature fusion method to solve this problem.
The fusion of features of different dimensions is actually the superposition of information onthe input data, which can enrich the information and improve the performance of the model [49].For feature fusion that is directly added, the premise is that the dimensions are the same. If thedimensions of the initial features are not the same, then the features of different dimensions needto be linearly combined. The original features are projected to the same dimensional space, thenfeature fusion is performed. Because the dimensions of feature layers in this paper are different, itis necessary to linearly combine the features of the different dimensions of each layer before featurefusion. The linear combination method used in this paper is L2 normalize [50].
The main idea of normalization is to calculate the p-norm [51] for each sample, then divideeach element in the sample by the norm. The result of this processing is to make the p-norm of eachprocessed sample equal to 1. The formula is defined as
||X||p =((x1)
p + (x2)p + · · ·+ (xn)
p) 1
p . (7)
The loss function of L2 regularization is
L(ω) = LD(ω) +λ2n
n∑i=1
ω2i . (8)
The gradient of the loss function L (ω) is calculated by
∂L(ω)∂ω
=∂LD(ω)
∂ω+ λω. (9)
The parameter ω is updated to become
ω′ = ω− η∂L(ω)∂ω
= ω
(1−
ηλ
n
)−∂LD(ω)
∂ω(10)
where LD(ω) represents the sum of squares of the difference between the object value and the predictedvalue; λ
2n∑n
i=1 ω2i represents a penalty item; n is the number of object categories in the feature layer;

Sensors 2020, 20, 5490 10 of 20
and λ, ωi, and i are the weight coefficient, the weight coefficient of various objects, and the indexof a certain category of objects, respectively. According to ω′, we know that the parameters afterregularization update are one more ηλ
n ω than those without updates. When ω′ tends toward 0, thespeed of parameter decrease becomes very slow. Therefore, the parameters can be reduced to a smallrange, so that the cosine similarity of two vectors can be obtained, and the features of different layerscan be projected to the same dimensional space. This facilitates better feature fusion for subsequentfeature maps of different scales from the same figure.
4. Analysis of Experimental Results
In order to reflect the high detection performance of SC-Faster R-CNN, first, it should be reflectedin the improved module based on Faster R-CNN, which has relatively obvious improvement in thedetection performance of certain features of the object. Therefore, it is necessary to start the experimentof the influence of the improved module on the performance of the entire network one by one, thatis, the ablation experiment of the proposed method. Then, SC-Faster R-CNN is compared withFaster R-CNN and other related algorithms in the same field. Through such a series of comparativeexperiments, we can evaluate the comprehensive performance of SC-Faster R-CNN in the objectdetection process. We evaluated the detection performance of these algorithms on the PASCAL VOC2007 and 2012 datasets for experimental verification. Three experiments were done: selection of thenumber of groups of IRNNs and the feature layers, ablation of SC-Faster R-CNN, and comparisonexperiment of SC-Faster R-CNN with other algorithms.
4.1. Experimental Platform Construction
The experimental implementation platform of this paper is 64-bit Ubuntu 16.04 LTS based on a DellPrecision R7910 (AWR7910) graphics workstation, the processor is Intel Xeon e5-2603 v2 (1.8 gHz/10 M),and Quadro K620 GPU is used for accelerated calculation. As a framework for deep neural networkalgorithm training, Pytorch takes into account the calculation speed and modularity. Training in thePytorch framework has faster computing speed thanks to its support for parallel computing on CPUand GPU.
4.1.1. Network Training Parameter Settings
The initial learning rate of the training model was 0.01, the optimization method used stochasticgradient descent, the gamma value was 0.1, the momentum was 0.9, the weight decay was 0.005, themaximum number of iterations was 80,000, the learning rate for the first 20,000 times was 0.01, and thelearning rate for the next 60,000 times was 0.001.
4.1.2. Dataset
The experiment was carried out on the benchmark PASCAL VOC detection dataset, which includesthe PASCAL VOC 2007 and 2012 datasets (represented as 07 + 12). These two datasets have 9963and 23,080 images for the object detection task, respectively, including 116,492 test images. The testimages contain 39,482 objects. During the experiment, 16,551 images from the 2007 and 2012 train + valdatasets were used for training, and 4952 images from the 2007 test dataset were used for testing.
4.1.3. Evaluation Index and Loss Function
In order to evaluate the detection performance of deep neural network algorithms, this paperuses several evaluation indicators: precision, recall rate, intersection over union (IoU), mean precision(mP), and mean average precision (mAP). The evaluation standard judges the pros and cons of thecorresponding attribute according to the value of the evaluation index. In these evaluation indices, thelarger the value, the better the corresponding attribute. The formulas for accuracy, recall, IoU, andmAP are defined as follows:

Sensors 2020, 20, 5490 11 of 20
Precision:Precision =
TP + TN
TP + TN + FP + FN× 100% (11)
Recall:Recall =
TP
TP + TN× 100% (12)
IoU:IoU =
GT ∩DRGT ∪DR
× 100% (13)
mAP:
mAP =N∑
k=1
P(k)∆r(k) (14)
where TP, TN, FP, and FN are real objects predicted as real objects, false objects predicted as real objects,real objects predicted as false objects, and false objects predicted as false objects, respectively; GT isthe ground truth of object boxes; DR is the test result; N is the number of figures in the test set; P(k)represents the value of precision when k figures can be recognized; and ∆r(k) represents the change ofthe recall value when the number of recognized figures changes from k − 1 to k.
For the images in the training dataset, the model will aim to minimize the joint loss during thetraining process and fine-tune the network parameters. The loss function is defined as
L =1
Nc
∑k
Lc(Pk, P∗k
)+λ
NrP∗kLt
(tk, t∗k
)(15)
where L, Lc, and Lt are the joint loss, classification loss, and regression loss of the border; Nc and Nr arethe number of categories and boxes; λ and k represent the weight coefficient and the selected anchorbox index; Pk and P∗k represent the probability that candidate box k is the object, the value of the label(if the candidate box is a positive label, P∗k = 1, otherwise P∗k = 0); t∗k is the predicted offset of the anchorbox; and t∗k is the offset between the anchor box and the actual object box.
4.2. Parameter Selection Experiment of Detection Algorithms
Before conducting comparative experiments on multiple object detection algorithms, first wediscuss the context feature extraction module and skip pooling method.
For the context feature extraction module, the number of groups of RNNs will affect the detectionperformance and efficiency of the network. In order to effectively carry out comparative experiments,the impact of the number of groups of RNNs on the detection performance has to be considered.In order to facilitate the experiment, for the training framework we chose RS-Faster R-CNN, forwhich the detection performance is evaluated by adjusting the number of IRNN groups to select theoptimal number.
As shown in Table 1, the number of IRNNs in the experiment ranged from 1 to 5. In order toobtain the optimal context feature extraction module, the evaluation standard was mAP. It can beseen that when the number of IRNNs increases from 1 to 3, the value of mAP increases significantly,and the data become flatter when it reaches 4 and 5. In order to ensure the detection accuracy of theobject detection algorithm while considering the calculation efficiency, the number of IRRN groupswas selected as 3.

Sensors 2020, 20, 5490 12 of 20
Table 1. Influence of number of IRNNs groups in context feature extraction module on objectdetection accuracy.
mAP (%)Time(sec)
Number of IRNNs
1 2 3 4 5
70.5 0.58√
72.2 0.71√ √
76.7 0.79√ √ √
76.9 0.84√ √ √ √
77.1 1.63√ √ √ √ √
For the selection of multi-layer features in the skip pooling method, it is necessary to discuss whichfeature layers should be selected and the effect of post-processing them on the detection performanceof SC-Faster R-CNN. This paper discusses the feature layers that may become skip pooling operationsone by one, as shown in Table 2. It can be seen that the presence or absence of L2 normalize has a greatimpact on the accuracy of detection. If there is no L2 normalize processing, the accuracy will decreaserapidly as feature layers increase. Through the L2 + 1 × 1 item in the last three rows of the “Mergefeatures using” column, it can be found that the feature layer of skip pooling operation includes eitherC2 or both C1 and C2, which slightly promotes accuracy. Compared to C3 + C4 + C5+context, it bringsa lot of calculation to the deep neural network algorithm. Based on this situation, C3 + C4 + C5+contextwas chosen as the feature layer of skip pooling operation.
Table 2. Effect of combining features from different layers on detection accuracy.
ROI Pooling From Merge Features Using
C1 C2 C3 C4 C5 Context1 × 1 L2 + 1 × 1
mAP Time mAP Time√
68.4 0.72 s 70.9 0.73 s√ √
66.1 0.76 s 73.8 0.76 s√ √ √
62.5 0.80 s 75.3 0.79 s√ √ √ √
58.6 0.82 s 77.8 0.81 s√ √ √ √ √
52.7 0.91 s 78.0 0.88 s√ √ √ √ √ √
44.3 1.45 s 78.4 1.17 s
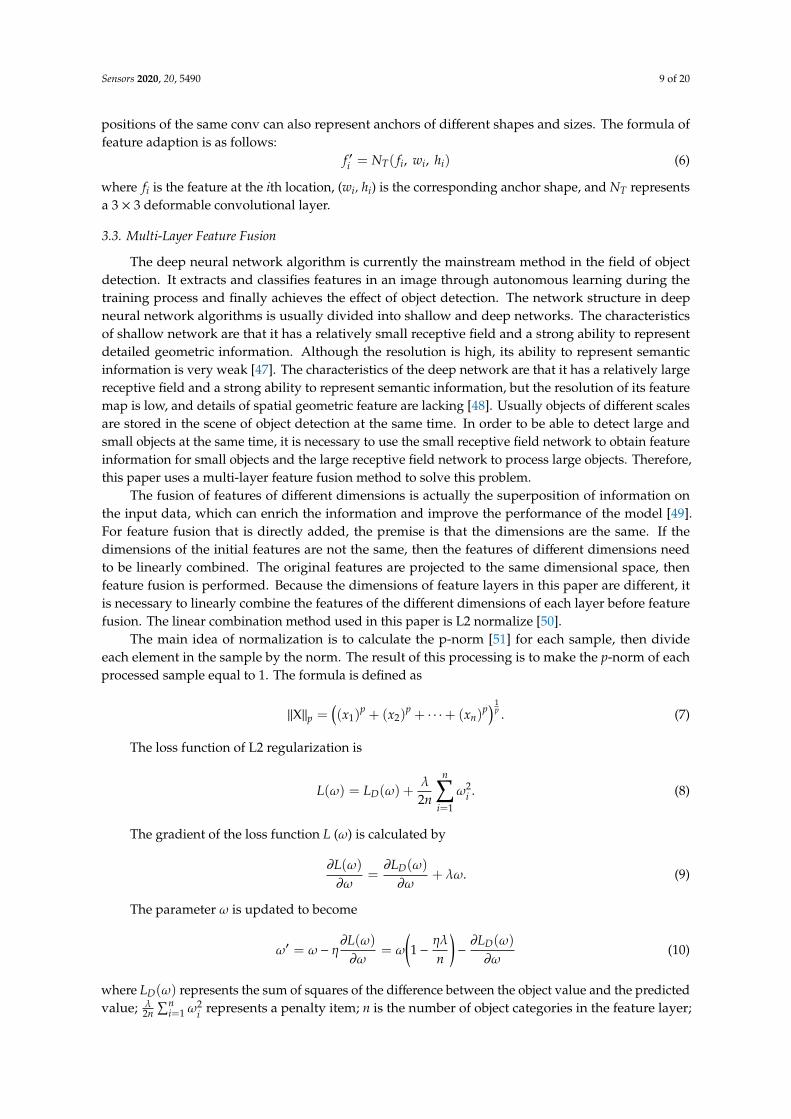
4.3. Ablation Experiment of SC-Faster R-CNN
In order to evaluate whether the context feature extraction module and skip pooling method wereadded to the improved Faster R-CNN and how the detection performance is affected, the ablationexperiment on SC-Faster R-CNN was conducted. First, the network after removing the module on theframework is referred to as RC-Faster R-CNN; the network without the skip pooling method on theframework is referred to as RS-Faster R-CNN; and SC-Faster R*-CNN recommends reducing GA-RPNto RPN for the proposed method. Then, the object detection performance of RC-Faster CNN (RC-FR),RS-Faster R-CNN (RS-FR), SC-Faster R*-CNN (SC-FR*), and SC-Faster R-CNN (SC-FR) was comparedwith Faster R-CNN (FR).
Table 3 shows the main performance parameters of the five deep neural networks in ablationexperiments. By analyzing the values of mAP, it can be found that based on the method proposed inthis paper, the effect of the context feature extraction module and skip pooling method acting alone onthe 07 + 12 dataset is slightly better than the detection effect of Faster R-CNN. The time consumptionof RS-Faster R-CNN and RC-Faster R-CNN in a figure is slightly larger than Faster R-CNN, however,the detection accuracy is superior. It is worth noting that after the regional recommendation method ischanged from RPN to GA-RPN, the detection accuracy and operation speed of the proposed method inthis paper are improved. In terms of test time, SC-Faster R-CNN is not only faster than Faster R-CNN,but also it has great advantages in detection performance improvement.

Sensors 2020, 20, 5490 13 of 20
Table 3. Main performance parameters in ablation process of SC-Faster R-CNN.
Method Train mAP (%) Time (sec)
FR 07 + 12 70.8 2.2RS-FR 07 + 12 73.2 1.1RC-FR 07 + 12 71.7 0.6SC-FR* 07 + 12 75.8 2.9SC-FR 07 + 12 77.6 0.8
Figure 5 shows part of the experimental test results, which can be found intuitively by combiningthe test results in Table 3. RS-Faster R-CNN and RC-Faster R-CNN under different scales and degrees ofocclusion and using different detection algorithms have their own outstanding detection performancefor certain features. Combining the evaluation parameter mAP (%) and the test time, it can be foundthat Faster R-CNN has greatly improved detection performance after adding the context featureextraction module and skip pooling method. Therefore, the detection performance of these fivedetection algorithms under different conditions can be ranked:
(1) Comparison of detection accuracy:
• When detecting small objects:
SC− FR > SC− FR∗ > RC− FR > RS− FR > FR
• When part of the object is occluded:
SC− FR > SC− FR∗ > RS− FR > RC− FR > FR
(2) Comparison of detection efficiency:
FR > RC− FR > RS− FR > SC− FR > SC− FR∗
4.4. Comparative Experiment of Multiple Detection Algorithms
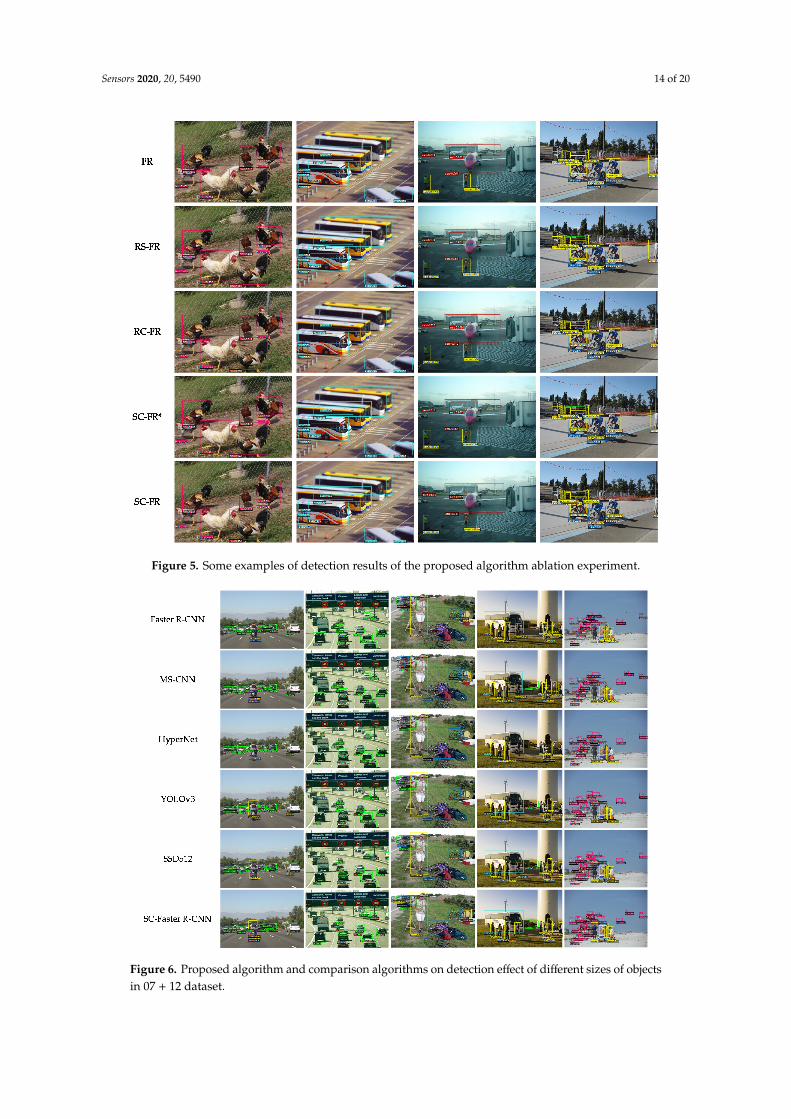
In this section, we present comparison experiments on the detection performance of the fivenetworks: SC-Faster R-CNN with Faster R-CNN [23], Multi-Scale CNN(MS-CNN) [52], HyperNet [42],SSD512 [26], and YOLOv3 [53]. The comparison experiment mainly focuses on the detection accuracyand calculation efficiency of each algorithm.
4.4.1. Accuracy
Table 4 shows the detection results of different networks on the 07 + 12 dataset and ranksthe detection accuracy according to the magnitude of the mAP value in the table: SC-FasterR-CNN > SSD512 > MS-CNN > HyperNet > YOLOv3 > Faster R-CNN. Some examples of detectioneffects for different networks are depicted in Figure 6 for the 07 + 12 dataset.
Sensors 2020, 20, 5490 14 of 20
Sensors 2020, 20, x FOR PEER REVIEW 14 of 21
Figure 5. Some examples of detection results of the proposed algorithm ablation experiment.
4.4. Comparative Experiment of Multiple Detection Algorithms
In this section, we present comparison experiments on the detection performance of the five networks: SC-Faster R-CNN with Faster R-CNN [23], Multi-Scale CNN(MS-CNN) [52], HyperNet [42], SSD512 [26], and YOLOv3 [53]. The comparison experiment mainly focuses on the detection accuracy and calculation efficiency of each algorithm.
4.4.1. Accuracy
Table 4 shows the detection results of different networks on the 07 + 12 dataset and ranks the detection accuracy according to the magnitude of the mAP value in the table: SC-Faster R-CNN > SSD512 > MS-CNN > HyperNet > YOLOv3 > Faster R-CNN. Some examples of detection effects for different networks are depicted in Figure 6 for the 07 + 12 dataset.
Figure 5. Some examples of detection results of the proposed algorithm ablation experiment.Sensors 2020, 20, x FOR PEER REVIEW 15 of 21
Figure 6. Proposed algorithm and comparison algorithms on detection effect of different sizes of objects in 07 + 12 dataset.
Figure 7, with an mP evaluation index, shows the detection of small, medium, and large objects in the test set of the 07 + 12 dataset by various detection algorithms, that is, the detection results of different types and scale objects in the test set by each detection algorithm. Figure 7, especially Figure 7a, shows HyperNet, an algorithm for feature fusion from multiple feature layers, and MS-CNN, the multi-scale detection algorithm and the method proposed in this paper. Their comprehensive detection performance for small object detection is better than other algorithms and other networks. With the cooperation of the context feature extraction module and the skip pooling method, the detection performance of SC-Faster R-CNN for small objects was greatly improved on the basis of Faster R-CNN. It can be seen in Figure 7b,c that as the object scale becomes larger, the detection performance of each algorithm gradually tends to approximate.
In order to more intuitively reflect the detection performance of SC-Faster R-CNN, this paper discusses that when the threshold of IoU is 0.4, 0.6, and 0.8, various detection algorithms are based on the 07 + 12 dataset to obtain precision-recall (PR) curve images. According to Figure 8, it can be concluded that with increased IoU threshold, the improved SC-Faster R-CNN based on the Faster R-CNN framework highlights the state-of-the-art detection performance. The results of the PR curve images are consistent with the conclusion of Table 4.
Figure 6. Proposed algorithm and comparison algorithms on detection effect of different sizes of objectsin 07 + 12 dataset.

Sensors 2020, 20, 5490 15 of 20
Table 4. Result of PASCAL VOC 2007 test set (%). Training data: 07 + 12: VOC 2007 and 2012 train + val.
Method Train mAP Aero Bike Bird Boat Bottles Bus Bar Bat Chair Bow Table Dog Horse mbike Person Plant Sheep Sofa Train TV
FasterR-CNN 07 + 12 70.8 83.1 71.8 73.2 53.5 54.4 77.3 72.8 88.4 49.2 72.7 66.1 85.4 80.3 79.6 74 43.2 78.8 67.4 81.5 63.4
MS-CNN 07 + 12 73.2 79.8 78.6 74.7 59.1 54.8 77.2 73.6 90.3 61.3 77.3 65.7 81.2 84.7 83.6 76.9 50.7 72.6 67.5 83.4 70.9HyperNet 07 + 12 71.2 81.7 70.4 67.2 55.7 51.7 78.6 79.9 88.9 52.4 74.3 63.6 84.3 81.7 80.7 79.1 47.3 71.2 64.2 80.2 71.7YOLOv3 07 + 12 72.0 80.4 75.3 70.9 56.8 53.3 79.6 75.7 86.7 58.8 75.6 60.9 79.4 82.6 81.5 79.3 52.3 71.5 65.6 84.8 68.9SSD512 07 + 12 74.2 84.8 73.5 74.3 57.3 57.6 80.5 74.8 89.5 60.2 82.1 68.4 86.3 84.5 81.4 77.6 49.3 82.4 66.5 79.7 72.8
SC-FasterR-CNN 07 + 12 77.6 86.5 82.4 76.4 61.4 60.5 86.5 76.2 92.1 64.5 83.6 69.3 90.1 89.4 88.5 79.2 58.2 79.1 70.2 85.6 72.7

Sensors 2020, 20, 5490 16 of 20
Figure 7, with an mP evaluation index, shows the detection of small, medium, and large objectsin the test set of the 07 + 12 dataset by various detection algorithms, that is, the detection results ofdifferent types and scale objects in the test set by each detection algorithm. Figure 7, especially Figure 7a,shows HyperNet, an algorithm for feature fusion from multiple feature layers, and MS-CNN, themulti-scale detection algorithm and the method proposed in this paper. Their comprehensive detectionperformance for small object detection is better than other algorithms and other networks. With thecooperation of the context feature extraction module and the skip pooling method, the detectionperformance of SC-Faster R-CNN for small objects was greatly improved on the basis of Faster R-CNN.It can be seen in Figure 7b,c that as the object scale becomes larger, the detection performance of eachalgorithm gradually tends to approximate.
Sensors 2020, 20, x FOR PEER REVIEW 17 of 21
(a) (b) (c)
Figure 7. Detection of (a) small, (b) medium, and (c) large objects in test set of 07 + 12 dataset by various deep neural network algorithms.
(a) IoU = 0.4 (b) IoU = 0.6 (c) IoU = 0.8
Figure 8. PR curve images of various deep neural network algorithms. The object detection situation for different networks in the 07 + 12 dataset can be seen more intuitively when the threshold of intersection over union (IoU) is different: (a) when IoU = 0.4, the overall detection performance of each network is not much different, but SC-Faster R-CNN is better than other networks; (b) when IoU = 0.6, the detection performance of most networks drops sharply, but that of SC-Faster R-CNN is stable; (c) when IoU = 0.8, the overall detection performance of each network decreases, but SC-Faster R-CNN still has splendid detection performance compared to other networks.
4.4.2. Calculation Efficiency
In the training and calculation process of deep neural network algorithms, hundreds of millions of parameters are often involved. The calculation of these parameters requires a lot of computing power. The deep neural network algorithms involved in the object detection experiment in this paper all run on GPU. An excellent object detection algorithm not only needs to focus on detection accuracy, but also consider detection efficiency. In many fields, such as unmanned driving and military object intrusion, the efficiency of object detection has extremely strict requirements. This section discusses the important performance indicators when testing on the 07 + 12 dataset.
It can be seen from Table 5 that the calculation speed of the one-stage algorithm is much higher than that of the two-stage algorithm, but according to the above experimental results, the one-stage algorithm needs to weigh the detection accuracy and time-consumption issues in the object detection process. By comparing SC-Faster R-CNN and SC-Faster R*-CNN, it can be seen that the former’s area recommendation method is improved from RPN to GA-RPN, therefore, the number of proposals is greatly reduced, so both mAP and FPS have been improved.
0.010.020.030.040.050.060.070.080.090.0
100.0
aero bike bird bus car cat dog person train
small object(%)
Faster R-CNN MS-CNN HyperNet YOLOv3 SSD512 SC-Faster R-CNN
0.010.020.030.040.050.060.070.080.090.0
100.0
aero bike bird bus car cat dog person train
large object(%)
Faster R-CNN MS-CNN HyperNet YOLOv3 SSD512 SC-Faster R-CNN
0.010.020.030.040.050.060.070.080.090.0
100.0
aero bike bird bus car cat dog person train
medium object(%)
Faster R-CNN MS-CNN HyperNet YOLOv3 SSD512 SC-Faster R-CNN
Figure 7. Detection of (a) small, (b) medium, and (c) large objects in test set of 07 + 12 dataset byvarious deep neural network algorithms.
In order to more intuitively reflect the detection performance of SC-Faster R-CNN, this paperdiscusses that when the threshold of IoU is 0.4, 0.6, and 0.8, various detection algorithms are basedon the 07 + 12 dataset to obtain precision-recall (PR) curve images. According to Figure 8, it can beconcluded that with increased IoU threshold, the improved SC-Faster R-CNN based on the FasterR-CNN framework highlights the state-of-the-art detection performance. The results of the PR curveimages are consistent with the conclusion of Table 4.
Sensors 2020, 20, x FOR PEER REVIEW 17 of 21
(a) (b) (c)
Figure 7. Detection of (a) small, (b) medium, and (c) large objects in test set of 07 + 12 dataset by various deep neural network algorithms.
(a) IoU = 0.4 (b) IoU = 0.6 (c) IoU = 0.8
Figure 8. PR curve images of various deep neural network algorithms. The object detection situation for different networks in the 07 + 12 dataset can be seen more intuitively when the threshold of intersection over union (IoU) is different: (a) when IoU = 0.4, the overall detection performance of each network is not much different, but SC-Faster R-CNN is better than other networks; (b) when IoU = 0.6, the detection performance of most networks drops sharply, but that of SC-Faster R-CNN is stable; (c) when IoU = 0.8, the overall detection performance of each network decreases, but SC-Faster R-CNN still has splendid detection performance compared to other networks.
4.4.2. Calculation Efficiency
In the training and calculation process of deep neural network algorithms, hundreds of millions of parameters are often involved. The calculation of these parameters requires a lot of computing power. The deep neural network algorithms involved in the object detection experiment in this paper all run on GPU. An excellent object detection algorithm not only needs to focus on detection accuracy, but also consider detection efficiency. In many fields, such as unmanned driving and military object intrusion, the efficiency of object detection has extremely strict requirements. This section discusses the important performance indicators when testing on the 07 + 12 dataset.
It can be seen from Table 5 that the calculation speed of the one-stage algorithm is much higher than that of the two-stage algorithm, but according to the above experimental results, the one-stage algorithm needs to weigh the detection accuracy and time-consumption issues in the object detection process. By comparing SC-Faster R-CNN and SC-Faster R*-CNN, it can be seen that the former’s area recommendation method is improved from RPN to GA-RPN, therefore, the number of proposals is greatly reduced, so both mAP and FPS have been improved.
0.010.020.030.040.050.060.070.080.090.0
100.0
aero bike bird bus car cat dog person train
small object(%)
Faster R-CNN MS-CNN HyperNet YOLOv3 SSD512 SC-Faster R-CNN
0.010.020.030.040.050.060.070.080.090.0
100.0
aero bike bird bus car cat dog person train
large object(%)
Faster R-CNN MS-CNN HyperNet YOLOv3 SSD512 SC-Faster R-CNN
0.010.020.030.040.050.060.070.080.090.0
100.0
aero bike bird bus car cat dog person train
medium object(%)
Faster R-CNN MS-CNN HyperNet YOLOv3 SSD512 SC-Faster R-CNN
Figure 8. PR curve images of various deep neural network algorithms. The object detection situation fordifferent networks in the 07 + 12 dataset can be seen more intuitively when the threshold of intersectionover union (IoU) is different: (a) when IoU = 0.4, the overall detection performance of each networkis not much different, but SC-Faster R-CNN is better than other networks; (b) when IoU = 0.6, thedetection performance of most networks drops sharply, but that of SC-Faster R-CNN is stable; (c) whenIoU = 0.8, the overall detection performance of each network decreases, but SC-Faster R-CNN still hassplendid detection performance compared to other networks.
4.4.2. Calculation Efficiency
In the training and calculation process of deep neural network algorithms, hundreds of millionsof parameters are often involved. The calculation of these parameters requires a lot of computing

Sensors 2020, 20, 5490 17 of 20
power. The deep neural network algorithms involved in the object detection experiment in this paperall run on GPU. An excellent object detection algorithm not only needs to focus on detection accuracy,but also consider detection efficiency. In many fields, such as unmanned driving and military objectintrusion, the efficiency of object detection has extremely strict requirements. This section discussesthe important performance indicators when testing on the 07 + 12 dataset.
It can be seen from Table 5 that the calculation speed of the one-stage algorithm is much higherthan that of the two-stage algorithm, but according to the above experimental results, the one-stagealgorithm needs to weigh the detection accuracy and time-consumption issues in the object detectionprocess. By comparing SC-Faster R-CNN and SC-Faster R*-CNN, it can be seen that the former’s arearecommendation method is improved from RPN to GA-RPN, therefore, the number of proposals isgreatly reduced, so both mAP and FPS have been improved.
Table 5. Important performance indicators of each algorithm when testing on 07 + 12 dataset.
Method mAP FPS Batch Size Proposals
Faster R-CNN 70.8 5 1 2460MS-CNN 73.2 8 1 548HyperNet 71.2 5 1 1140YOLOv3 72.0 87 1 98SSD512 74.2 56 8 24,564
SC-Faster R*-CNN 75.8 5 1 2460SC-Faster R-CNN 77.6 9 1 473
5. Conclusions and Future Work
This paper introduces the Faster R-CNN algorithm with skip pooling and fusion of contextualinformation (SC-Faster R-CNN). The algorithm is based on the Faster R-CNN framework and adds afeature extraction model and skip pooling method that integrates contextual information and usesguided anchors with high performance instead of RPN. In order to prove that it has high detectionperformance, we conducted ablation and comparison experiments between the proposed algorithmand Faster R-CNN, YOLOv3, SSD512, HyperNet, and MS-CNN. Training and testing on PASCAL VOC2007 and 2012 datasets produced state-of-the-art results. Through experimental results, it is found thatthe algorithm proposed in this paper is particularly effective for difficult problems in the detection ofpartially occluded and small objects.
In this paper, the proposed algorithm has high detection performance in general and for objectsthat are too small or partially occluded, but it still has certain limitations in the detection of deformed,rotating, and camouflaged objects. In order to further improve the detection efficiency, we willpay more attention to the research of difficult sample detection. In order to meet the real-timeperformance of the system, we will further study the processing speed of the algorithm and other issues.Also, researching an object detection algorithm with strong generalization ability but considerablecomputational efficiency will be a meaningful future research direction.
Author Contributions: The first author, Y.X., and corresponding author, X.W., are responsible for the overallwork; they proposed the idea and experiments and the methods in the paper. The paper was written mainly bythe two authors. The third author, P.Z., performed part of the experiments and provided effective advice, on bothideas and writing the paper. The fourth author, F.M., provided many positive suggestions and comments for thepaper. The fifth author, F.S., performed part of the experiments and provided many good suggestions. All authorshave read and agreed to the published version of the manuscript.
Funding: This research was funded by the National Natural Science Foundation of China (grant number: 61671470)and the Key Research and Development Program of China (grant number: 2016YFC0802900).
Conflicts of Interest: The authors declare no conflict of interest.

Sensors 2020, 20, 5490 18 of 20
References
1. Li, C. Dangerous Posture Monitoring for Undersea Diver Based on Frame Difference Method. J. Coast. Res.2020, 103, 939–942. [CrossRef]
2. Aronniemi, M.; Sainio, J.; Lahtinen, J. Chemical state quantification of iron and chromium oxides using XPS:The effect of the background subtraction method. Surf. Sci. 2005, 578, 108–123. [CrossRef]
3. Dougherty, L.; Asmuth, J.; Blom, A.; Axel, L.; Kumar, R. Validation of an optical flow method for tagdisplacement estimation. IEEE Trans. Med. Imaging 1999, 18, 359–363. [CrossRef] [PubMed]
4. Shi, D.; Zheng, L.; Liu, J. Advanced Hough Transform Using A Multilayer Fractional Fourier Method.IEEE Trans. Image Process. 2010, 19, 1558–1566. [CrossRef]
5. Song, Y.-S.; Cho, S.-B.; Suh, I.H. Activity-Object Bayesian Networks for Detecting Occluded Objectsin Uncertain Indoor Environment. In Proceedings of the Knowledge-Based Intelligent Information &Engineering Systems, International Conference, Kes, Melbourne, Australia, 14–16 September 2005.
6. Shlezinger, N.; Farsad, N.; Eldar, Y.C.; Goldsmith, A.J. ViterbiNet: A Deep Learning Based Viterbi Algorithmfor Symbol Detection. IEEE Trans. Wirel. Commun. 2020, 19, 3319–3331. [CrossRef]
7. Piotr, D.; Wojek, C.; Schiele, B.; Perona, P. Pedestrian Detection: The State of the Art. IEEE Trans. Softw. Eng.2011, 34, 743–761.
8. Viola, P.; Jones, M.J. Robust Real-Time Face Detection. Int. J. Comput. Vis. 2004, 57, 137–154. [CrossRef]9. Chen, B.-H.; Huang, S.-C. An Advanced Moving Object Detection Algorithm for Automatic Traffic Monitoring
in Real-World Limited Bandwidth Networks. IEEE Trans. Multimedia 2014, 16, 837–847. [CrossRef]10. Zhang, J.; Wang, F.-Y.; Wang, K.; Lin, W.-H.; Xu, X.; Chen, C. Data-Driven Intelligent Transportation Systems.
IEEE Trans. Intell. Transp. Syst. 2011, 12, 1624–1639. [CrossRef]11. Hua, X.; Wang, X.-Q.; Wang, D.; Huang, J.; Hu, X. Military Object Real-Time Detection Technology Combined
with Visual Salience and Psychology. Electronics 2018, 7, 216. [CrossRef]12. Zhu, W.; Huang, W.; Lin, Z.; Yang, Y.; Huang, S.; Zhou, J. Data and feature mixed ensemble based extreme
learning machine for medical object detection and segmentation. Multimed. Tools Appl. 2015, 75, 2815–2837.[CrossRef]
13. Kanezaki, A.; Rodolà, E.; Cremers, D.; Harada, T. Learning Similarities for Rigid and Non-rigid ObjectDetection. In Proceedings of the 2014 2nd International Conference on 3D Vision, Tokyo, Japan, 8–11December 2014; IEEE: Piscataway, NJ, USA, 2014; Volume 1, pp. 720–727.
14. Wang, J.; Chen, K.; Yang, S.; Loy, C.C.; Lin, D. Region Proposal by Guided Anchoring. In Proceedings of the2019 IEEE/CVF Conference on Computer Vision and Pattern Recognition (CVPR), Long Beach, CA, USA,16–20 June 2019; IEEE: Piscataway, NJ, USA, 2019; pp. 2960–2969.
15. Kulkarni, A.; Callan, J.; Selective, S. Efficient and Effective Search of Large Textual Collections. ACM Trans.Inf. Syst. 2015, 33, 17.1–17.33. [CrossRef]
16. Wang, X.; Xiao, T.; Jiang, Y.; Shao, S.; Sun, J.; Shen, C. Repulsion Loss: Detecting Pedestrians in a Crowd.In Proceedings of the 2018 IEEE/CVF Conference on Computer Vision and Pattern Recognition 2018, SaltLake City, UT, USA, 18–23 June 2018; pp. 7774–7783.
17. Bell, S.; Zitnick, C.L.; Bala, K.; Girshick, R. Inside-outside net: Detecting objects in context with skip poolingand recurrent neural networks. arXiv 2015, arXiv:1512.04143.
18. Cheng, G.; Han, J.; Zhou, P.; Xu, D. Learning Rotation-Invariant and Fisher Discriminative ConvolutionalNeural Networks for Object Detection. IEEE Trans. Image Process. 2019, 28, 265–278. [CrossRef]
19. Fan, D.-P.; Ji, G.-P.; Sun, G.; Cheng, M.-M.; Shen, J.; Shao, L. Camouflaged Object Detection. In Proceedingsof the 2020 IEEE/CVF Conference on Computer Vision and Pattern Recognition (CVPR), Seattle, WA, USA,13–19 June 2020; IEEE: Piscataway, NJ, USA, 2020; pp. 2774–2784.
20. Girshick, R.; Donahue, J.; Darrell, T.; Malik, J.; Malik, J. Rich Feature Hierarchies for Accurate Object Detectionand Semantic Segmentation. In Proceedings of the 2014 IEEE Conference on Computer Vision and PatternRecognition, Columbus, OH, USA, 24–27 June 2014.
21. He, K.; Zhang, X.; Ren, S.; Sun, J. Spatial Pyramid Pooling in Deep Convolutional Networks for VisualRecognition. In European Conference on Computer Vision; Springer: Cham, Switzerland, 2014.
22. Girshick, R. Fast R-CNN. In Proceedings of the 2015 IEEE International Conference on Computer Vision,Santiago, Chile, 7–13 December 2015.

Sensors 2020, 20, 5490 19 of 20
23. Ren, S.; He, K.; Girshick, R.; Sun, J. Faster R-CNN: Towards Real-Time Object Detection with Region ProposalNetworks. In Proceedings of the Advances in Neural Information Processing Systems 28 (NIPS 2015),Montreal, QC, Canada, 7–12 December 2015.
24. Sermanet, P.; Eigen, D.; Zhang, X.; Mathieu, M.; Fergus, R.; LeCun, Y. Overfeat: Integrated recognition,localization and detection using convolutional networks. In Proceedings of the 2nd International Conferenceon Learning Representations, ICLR 2014, Banff, AB, Canada, 14–16 April 2014.
25. Redmon, J.; Divvala, S.; Girshick, R.; Farhadi, A. You only look once: Unified, real-time object detection.In Proceedings of the IEEE Conference on Computer Vision and Pattern Recognition, Las Vegas, NV, USA,27–30 June 2016.
26. Liu, W.; Anguelov, D.; Erhan, D.; Szegedy, C.; Reed, S. SSD: Single shot multibox detector. In Proceedingsof the 14th European Conference on Computer Vision, ECCV 2016, Amsterdam, The Netherlands, 11–14October 2016.
27. Cheng, G.; Yang, J.; Gao, D.; Guo, L.; Han, J. High-Quality Proposals for Weakly Supervised Object Detection.IEEE Trans. Image Process. 2020, 29, 5794–5804. [CrossRef]
28. Zhang, Y.; Chen, X.; Li, J.; Teng, W.; Song, H. Exploring Weakly Labeled Images for Video Object SegmentationWith Submodular Proposal Selection. IEEE Trans. Image Process. 2018, 27, 4245–4259. [CrossRef]
29. Xie, Y.; Lu, H.; Yang, M.H. Bayesian saliency via low and midlevel cues. IEEE Trans. Image Process. 2013, 22,1689–1698.
30. Li, H.; Lin, Z.; Shen, X.; Brandt, J.; Hua, G. A convolutional neural network cascade for face detection.In Proceedings of the 2015 IEEE Conference on Computer Vision and Pattern Recognition (CVPR), Boston,MA, USA, 7–12 June 2015; pp. 5325–5334.
31. Yang, F.; Choi, W.; Lin, Y. Exploit all the layers: Fast and accurate CNN object detector with scale dependentpooling and cascaded rejection classifiers. In Proceedings of the IEEE Conference on Computer Vision andPattern Recognition, Las Vegas, NV, USA, 27–30 June 2016; pp. 2129–2137.
32. Zhang, Y.; Mu, Z. Ear Detection under Uncontrolled Conditions with Multiple Scale Faster Region-BasedConvolutional Neural Networks. Symmetry 2017, 9, 53. [CrossRef]
33. Zagoruyko, S.; Lerer, A.; Lin, T.Y.; Pinheiro, P.O.; Gross, S.; Chintala, S.; Dollar, P. A multipath network forobject detection. arXiv 2016, arXiv:1604.02135.
34. Wang, X.; Ma, H.; Chen, X.; You, S. Edge Preserving and Multi-Scale Contextual Neural Network for SalientObject Detection. IEEE Trans. Image Process. 2017, 27, 121–134. [CrossRef]
35. Li, G.; Yu, Y. Visual saliency based on multi-scale deep features. In Proceedings of the IEEE Conference onComputer Vision and Pattern Recognition, Boston, MA, USA, 7–12 June 2015; pp. 5455–5463.
36. Hou, Q.; Cheng, M.-M.; Hu, X.; Borji, A.; Tu, Z.; Torr, P.H.S. Deeply Supervised Salient Object Detection withShort Connections. IEEE Trans. Pattern Anal. Mach. Intell. 2018, 41, 815–828. [CrossRef] [PubMed]
37. Shen, Y.; Ji, R.; Wang, C.; Li, X.; Li, X. Weakly Supervised Object Detection via Object-Specific Pixel Gradient.IEEE Trans. Neural Netw. Learn. Syst. 2018, 29, 5960–5970. [CrossRef] [PubMed]
38. Gao, J.; Wen, C.; Liu, M. Robust Small Object Co-Detection from Airborne Infrared Image Sequences. Sensors2017, 17, 2242. [CrossRef] [PubMed]
39. Ren, Y.; Zhu, C.; Xiao, S. Small Object Detection in Optical Remote Sensing Images via Modified FasterR-CNN. Appl. Sci. 2018, 8, 813. [CrossRef]
40. Lin, T.Y.; Dollár, P.; Girshick, R.; He, K.; Hariharan, B.; Belongie, S. Feature Pyramid Networks for ObjectDetection. arXiv 2016, arXiv:1612.03144.
41. Li, J.; Liang, X.; Wei, Y.; Xu, T.; Feng, J.; Yan, S. Perceptual Generative Adversarial Networks for Small ObjectDetection. arXiv 2017, arXiv:1706.05274v2.
42. Kong, T.; Yao, A.; Chen, Y.; Sun, F. HyperNet: Towards Accurate Region Proposal Generation and JointObject Detection. In Proceedings of the 2016 IEEE Conference on Computer Vision and Pattern Recognition,Las Vegas, NV, USA, 27–30 June 2016; pp. 845–853.
43. Altop, D.K.; Levi, A.; Tuzcu, V. Feature-level fusion of physiological parameters to be used as cryptographickeys. In Proceedings of the 2017 IEEE International Conference on Communications (ICC), Paris, France,21–25 May 2017.
44. Wang, X.; Hou, Z.; Yu, W.; Pu, L.; Jin, Z.; Qin, X. Robust Occlusion-Aware Part-based Visual Tracking withObject Scale Adaptation. Pattern Recognit. 2018, 81, 456–470. [CrossRef]

Sensors 2020, 20, 5490 20 of 20
45. Visin, F.; Kastner, K.; Cho, K.; Matteucci, M.; Courville, A.; Bengio, Y. ReNet: A recurrent neural networkbased alternative to convolutional networks. arXiv 2015, arXiv:1505.00393.
46. Le, Q.V.; Jaitly, N.; Hinton, G.E. A simple way to initialize recurrent networks of rectified linear units. arXiv2015, arXiv:1504.00941.
47. Sun, W.; Wang, R. Fully Convolutional Networks for Semantic Segmentation of Very High ResolutionRemotely Sensed Images Combined With DSM. IEEE Geoence Remote Sens. Lett. 2018, 15, 474–478. [CrossRef]
48. Phaisangittisagul, E.; Chongprachawat, R. Receptive field resolution analysis in convolutional featureextraction. In Proceedings of the 2013 13th International Symposium on Communications and InformationTechnologies (ISCIT), Samui Island, Thailand, 4–6 September 2013.
49. Liang, F.; Duan, L.; Ma, W.; Qiao, Y.; Cai, Z.; Miao, J.; Ye, Q. CoCNN: RGB-D deep fusion for stereoscopicsalient object detection. Pattern Recognit. 2020, 104, 107329. [CrossRef]
50. Wu, Y.; He, K. Group Normalization. Int. J. Comput. Vis. 2018, arXiv:1803.08494.51. Li, M.; Yang, Y.; Xu, L.; Xu, C.; Sun, X. Salient Object Detection Based on Unified Convex Surrogate for
Non-Convex Schatten Norm. IEEE Access 2020, 8, 20171–20180. [CrossRef]52. Cai, Z.; Fan, Q.; Feris, R.S.; Vasconcelos, N. A Unified Multi-scale Deep Convolutional Neural Network for
Fast Object Detection. arXiv 2016, arXiv:1607.07155.53. Redmon, J.; Farhadi, A. YOLOv3. An Incremental Improvement. arXiv 2018, arXiv:1804.02767.
© 2020 by the authors. Licensee MDPI, Basel, Switzerland. This article is an open accessarticle distributed under the terms and conditions of the Creative Commons Attribution(CC BY) license (http://creativecommons.org/licenses/by/4.0/).