obesity in west virginia - wv dhhr€¦ · obesity in west virginia ... it is currently estimated...
TRANSCRIPT

Obesity in West Virginia
Bureau for Public Health 350 Capitol Street, Room 206
Charleston, WV 25301
Earl Ray Tomblin, Governor Michael J. Lewis, M.D., Ph.D.,
Cabinet Secretary


Obesity in West Virginia
Earl Ray Tomblin Governor
Michael J. Lewis, MD, PhD
Cabinet Secretary Department of Health and Human Resources
November 2011

ii
Marian L. Swinker, MD, MPH, FACOEM Commissioner
Nancye M. Bazzle, MPH Deputy Commissioner
West Virginia Bureau for Public Health
Report Prepared By
Eugenia Thoenen, Consultant West Virginia Health Statistics Center
West Virginia Health Statistics Center
Daniel Christy, MPA, Director James C. Doria, Statistical Services Division Director
Thomas N. Leonard, MS, Programmer/Analyst Tom Light, Programmer
Birgit Shanholtzer, MA, Epidemiologist
Additional Acknowledgments
Cindy Hall, Program Integrity Coordinator West Virginia Office of Nutrition Services
Carol V. Harris, PhD
West Virginia University Health Research Center

iii
Report Highlights
Obesity can be classified as a worldwide epidemic, with the United States the major leader in obesity prevalence. It is currently estimated that 72 million American adults (ages 18 and older) are obese, a number that could increase to 103 million adults by 2018. Research has consistently shown that obesity increases the risk for many other conditions, including coronary heart disease, type 2 diabetes, certain cancers, hypertension, dyslipidemia, stroke, liver and gallbladder disease, sleep apnea, and osteoarthritis. In 2009, West Virginia ranked 6th in the nation in obesity; the state was 1st in diabetes, hypertension, and cardiovascular morbidity, and 2nd in arthritis, according to data from the Behavioral Risk Factor Surveillance System (BRFSS). The current report examines the extent of obesity prevalence among the state’s population using data from the BRFSS for adult obesity (having a BMI of 30 or greater) and from five additional sources to examine childhood and adolescent obesity (having a BMI equal to or greater than the 95th percentile BMI‐for‐age based on the 2000 CDC growth charts): the Youth Risk Behavior Surveillance System (YRBSS), the Pediatric Nutrition Surveillance System (PedNSS), the National Immunization Survey (NIS), the National Survey of Children’s Health (NSCH), and West Virginia Healthy Lifestyles Act Year One and Year Two Evaluations. Highlights from the findings are summarized below: Behavioral Risk Factor Surveillance System ● West Virginia’s rate of adult obesity in 2009 was 31.7%, 17% higher than the national rate of 26.9%. Little difference in obesity was noted in 2009 between the sexes; men reported a rate of 31.3%, while women reported a rate of 32.1%. ● The state’s prevalence of obesity has increased an average of 4.6% a year since 1989. If this trend continues, the CDC estimates a prevalence of 46.1% by 2018, nearly half of the state’s adults. ● Using aggregated BRFSS data from 2004‐2008 showed that Logan County had the highest rate of obese adults at 40.3%; Randolph County reported the lowest rate at 22.7%. ● The average weight among men in West Virginia increased from 182.4 pounds in 1988 to 202.1 pounds in 2009. The average weight among women increased over the same time period from 142.2 pounds to 165.2 pounds. ● Morbid obesity (having a BMI of 40 or greater) increased in the state by an average annual change of 10.5% from 1989‐2008, from a rate of 0.8% to 4.9%. Pediatric Nutrition Surveillance System ● The PedNSS survey, which tracks the nutritional status of low‐income children under the age of five, found a prevalence of obesity of 13.4% among children ages two through four in West Virginia who were enrolled in WIC, compared with a national rate of 14.7%. ● In 2009, Mason County had the highest rate of obesity among low‐income preschoolers at 22.0%, while Marion County had the lowest rate at 5.2%. National Immunization Survey ● The NIS, which monitors childhood immunization coverage, has included questions on the initiation and duration of breastfeeding since 2001. Breastfeeding has been found by many researchers to lower the risk of obesity later in childhood. Among infants born in 2007, West Virginia ranked 49th among the 50 states and the District of Columbia in the percentage of infants who were ever breastfed

iv
or fed breast milk. The state rate was 53.0%, compared with a national rate of 75.0%. However, the rate of breastfeeding has increased in the state by 41.5% since 2000, when the rate was 39.0%. National Survey of Children’s Health ● According to 2007 NSCH data, 18.9% of children ages 10 through 17 in West Virginia were obese, slightly higher than the national average of 16.4%. ● The same survey showed that state children were more likely to participate in physical activity on every day of the week (33.2%) than their national counterparts (29.9%). They were also more likely, however, to spend more than one hour on weekdays watching TV or playing video games (57.7% vs. 50.1%). West Virginia Healthy Lifestyles Act Evaluations ● In the 2008‐2009 evaluation, 18.5% of children in kindergarten were found to be obese, compared with 22.1% of second graders and 29.6% of fifth graders. ● A decrease in soda drinking and eating fast food was noted among students in grades 2,4,5,7, and 9 from Year One (2007‐2008) to Year Two (2008‐2009). There was also an increase in drinking milk and eating five or more servings of fruits and vegetables on the day before the survey from Year One to Year Two. ● In Year Two, 26.9% of boys reported being physically active every day for at least 60 minutes (the CDC recommendation); 22.2% of girls reported daily exercise. Youth Risk Behavior Surveillance System ● In 2009, the YRBSS reported that 20.3% of male high school students in West Virginia were obese, a significantly higher prevalence than the 7.7% found among female high school students. ● Little difference in obesity prevalence among students was noted by grade level (grades 9 through 12); the male students, however, were more likely to be obese than the female students in each of the grades. ● A marked change was noted between the 2007 and 2009 surveys in the prevalence of students who reported drinking soda (not including diet soda) at least once a day. In 2007, 50.8% of boys reported daily soda consumption, compared with 35.7% in 2009. Among girls, the prevalence dropped from 40.6% to 33.3%. ● Physical inactivity (not participating in any physical activity on any day during the seven days before the interview) has decreased since the 2005 survey, from 24.3% of all students in 2005 to 17.3% of students in 2009.

v
TABLE OF CONTENTS
Report Highlights ............................................................................................................................ iii
Introduction .................................................................................................................................... 1 Obesity in West Virginia .................................................................................................................. 6 Adult Obesity .............................................................................................................................. 6 Childhood and Adolescent Obesity .......................................................................................... 17 Pediatric Nutrition Surveillance System ........................................................................... 17 National Immunization Survey ......................................................................................... 19 National Survey of Children’s Health ................................................................................ 21 WV Healthy Lifestyles Act Evaluations .............................................................................. 23 Youth Risk Behavior Surveillance System ......................................................................... 25 References .................................................................................................................................... 28 Appendix A: Links to the Data Sources ........................................................................................ 30 Appendix B: Overweight and Obesity by State, BRFSS ................................................................ 31 Appendix C: Obesity by County, BRFSS ........................................................................................ 33 Appendix D: Weight Categories by Year, BRFSS .......................................................................... 34 Appendix E: Morbid Obesity by Year and Gender, BRFSS ........................................................... 35 Appendix F: Obesity among Low‐Income Children by County, PedNSS ...................................... 36 Appendix G: Breastfeeding by State, NIS ..................................................................................... 37 Appendix H: Obesity among High School Students by State, YRBSS ........................................... 39

vi

1
Introduction
The American Heritage Dictionary defines “epidemic” as “a rapid spread, growth, or development” (1). No word more aptly describes the current course of obesity1 prevalence. A global phenomenon, the World Health Organization (WHO) estimates that worldwide obesity has more than doubled since 1980, with 200 million men and nearly 300 million women now obese (2). The United States is the major leader in obesity prevalence, with an estimated 72 million obese adults in this country alone (3). If current trends continue, this number could increase to 103 million Americans by 2018 (4). Figures 1 and 2 illustrate the dramatic change in obesity prevalence in the United States from 2001 to 2009, according to data from the Behavioral Risk Factor Surveillance System (BRFSS).
1 Obesity is determined by Body Mass Index (BMI), calculated as body weight in kilograms divided by height in meters squared (wt/ht2). Obesity is defined in adults as having a BMI of 30 or greater.
Alaska
California
Idaho
Oregon
Washington
Montana
Wyoming
Utah
Co lorado
ArizonaNew Mexico
Texas
Oklahoma
Kansas
Nebraska
South Dakot a
North Dakota Minnesota
Wisconsin
Iowa
Il lino isOhio
Ind iana
Kentucky
WVVirginia
N. Carolina
Georgia
Florida
AlabamaMS
Missouri
Arkansas
LA
Nevada
Hawaii
Michigan
PennsylvaniaNJ
New York CTMA
VT
NH
Maine
Tennessee
MDDE
RI
DC
S. Caro lina
F ig. 1Obesity* Prevalence (%) among U.S. Adults: BRFSS, 2001
*Body Mass I ndex (BMI) of 30 or greater
10%‐14.9%
15%‐19.9%
20%‐24.9%
25%‐29.9%
30% or More
Alaska
California
Idaho
Oregon
Washington
Montana
Wyoming
Utah
Co lorado
ArizonaNew Mexico
Texas
Oklahoma
Kansas
Nebraska
South Dakot a
North Dakota Minnesota
Wisconsin
Iowa
Il lino isOhio
Ind iana
Kentucky
WVVirginia
N. Carolina
Georgia
Florida
AlabamaMS
Missouri
Arkansas
LA
Nevada
Hawaii
Michigan
PennsylvaniaNJ
New York CTMA
VT
NH
Maine
Tennessee
MDDE
RI
DC
S. Caro lina
10%‐14.9%
15%‐19.9%
20%‐24.9%
25%‐29.9%
30% or More
Fig. 2Obesity* Prevalence (%) among U.S. Adults: BRFSS, 2009
*Body Mass I ndex (BM I) of 30 or greater

2
American society is obsessed with thinness, yet increasing numbers of people are becoming fat. This contradiction has become the subject of thousands of research studies. The one obvious explanation for the increasing obesity rate is that people are simply consuming more calories than they are expending. What is not simple, however, is why this phenomenon has happened so quickly and to such a surprising extent.
Causes of Obesity. The causes of obesity fall into two general categories, genetics and environment. The fat in a person’s body is stored in fat cells distributed throughout the body. A normal person has between 25 and 35 billion fat cells, but this number can increase in times of excessive weight gain to as many as 100 to 150 billion cells. The number of fat cells in the body remains constant after their formation; the cells just expand and shrink in size during weight gain and loss. This has been suggested as one reason why weight loss is so hard to maintain for many people. Four critical periods have been identified during which time the number of fat cells a person has will increase: between 12 and 18 months of age; between 12 and 16 years of age, especially in females (in fact, the best predictor of adult obesity is adolescent obesity); in adulthood when an individual gains in excess of 60% of their healthy weight, and during pregnancy (5).
Studies of some extremely obese people have discovered a genetic basis for their obesity; however,
these genetic causes are uncommon and not found in the vast majority of persons at risk from obesity in the United States today. This is not to say that the susceptibility for weight gain is not genetic. There are many ways in which genes affect our weight, from our resting metabolic rate, to how we burn calories when we exercise, to how quickly our brains signal us that we are full. Age and gender significantly alter metabolic rate. As people age, their metabolism normally slows down. Men generally have higher resting metabolic rates than women; women’s rates slow down even more dramatically after menopause.
This all suggests that, while one person might be born with a stronger tendency to gain weight than
another, the circumstances must be right for this to happen. Genetics play a role, but the gene pool has not changed significantly in the few decades during which obesity has become so prevalent. Genetics must be combined with an environment conducive to gaining weight, an environment that has been termed “obesogenic,” in order for the explosive increase in both childhood and adult overweight and obesity to have occurred.
The evolution of our obesogenic environment has been both rapid and multifactorial. There has
been a tremendous increase in the availability of food, especially high‐fat and/or high‐calorie food, at the same time that there has been a decrease in the amount of individual physical activity. To quote one researcher, “Becoming obese is a normal response to the American environment” (5). Snacking and fast food are now a way of life in the United States, and not only have our opportunities to eat away from home increased, so have the portion sizes of these foods. The low cost of many fast foods make this high‐fat, calorie‐dense diet available to just about everyone. Availability, large portions, and low cost present an offer that many Americans can’t resist.
At the same time our diets have taken a turn for the worse, the amount of physical activity in our
lives has decreased. An active lifestyle decreases the risk of several chronic diseases and certain physical and mental disabilities, contributes to more efficient functioning of many of our body’s systems, and improves our overall quality of life. The positive benefits of regular physical activity are present

3
throughout life, during childhood, adolescence, and adulthood. None of these benefits is more important than the critical role physical activity plays in weight maintenance throughout the life span.
Work no longer provides the opportunity for physical activity that it once did for many Americans. While in 1900, 80% of the workforce worked in jobs demanding physical labor and 20% in cerebral jobs, it is estimated by the Wellness Councils of America that by 2020 the opposite will be true: 80% of jobs will be cerebral and 20% manual (5). At the same time that jobs are becoming more sedentary, the work week has been expanding, allowing less time for leisure‐time physical activity. The average worker now works the equivalent of one extra month per year compared with workers in 1970 (5). Obesity‐Related Morbidity and Mortality. Research has consistently shown that obesity increases the risk for many other conditions, including coronary heart disease, type 2 diabetes, certain cancers, hypertension, dyslipidemia, stroke, liver and gallbladder disease, sleep apnea and other respiratory problems, and osteoarthritis. In addition, obesity is associated with an increased risk of pregnancy complications, menstrual irregularities, psychological disorders, memory loss and dementia in later life, and surgical complications. Social discrimination against obese people has a strong negative effect on their quality of life. The table below lists selected risk factors associated with obesity that are measured and monitored by the BRFSS. The consequences of West Virginia’s high prevalence of obesity are reflected in the table’s statistics: In 2009, the state reported the highest rates among the 50 states and the District of Columbia in diabetes, cardiovascular disease morbidity, and hypertension, and was tied for 2nd in the prevalence of arthritis.
Table 1. Prevalence (%) of Selected Risk Factors Associated with Obesity among Adults
Behavioral Risk Factor Surveillance System, 2009 Risk Factor WV Prevalence US Median WV Ranking*
Obesity 31.7 26.9 6Diabetes 12.4 8.3 1Hypertension 37.6 28.7 1Arthritis 33.9 26.0 (tied with Ala.) 2 Ever had heart attack 6.5 4.0 1Have coronary heart disease 7.1 3.8 1*WV ranking among 50 states and District of Columbia. States are ranked worst (1) to best (51).
Obesity has been associated with a significantly increased risk of mortality from all causes, which varied by cause of death, according to a study using NHANES data published by Flegel et al. in the Journal of the American Medical Association in 2007 (6). Researchers found that that obesity was associated with over 112,000 excess deaths due to cardiovascular disease and 14,000 excess deaths due to obesity‐related cancers.
Costs of Obesity. With obesity come tremendous financial costs. A recent National Board of
Economic Research (NBER) study estimated annual obesity‐related medical costs at $168 billion, nearly 17% of total medical costs in the United States (7). The researchers found that obesity adds approximately $2,800 to an individual’s annual medical bills. An earlier NBER study projected that obesity‐related medical costs would account for 21% of America’s direct health care costs by 2018 if present trends continued (4). That same study predicted that obesity‐related health care would cost West Virginia over $2.3 billion in 2018 if the increase in obesity is not abated.

4
Finkelstein et al. looked at the cost of obesity by insurer in a study published in Health Affairs in
2009 (8). They found that, in 2006, Medicare averaged an additional cost of $1,723 for obese beneficiaries, while Medicaid averaged $1,000 more. Private insurers averaged $1,140 more for obese beneficiaries than for normal weight beneficiaries. The excess costs were spread over inpatient services, non‐inpatient services, and prescription drugs.
Childhood and Adolescent Obesity. The prevalence of childhood and adolescent obesity2 has risen in the United States as sharply as that among the nation’s adults. As a result, diseases once thought of as “adult” diseases, such as type 2 diabetes and hypertension, are now being diagnosed among children, putting them at risk for other serious chronic diseases such as heart disease and stroke. A study published in the Journal of the American Medical Association estimated that one out of every three boys and two out of every five girls born in 2000 will be diagnosed with diabetes in their lifetime (9). In another study, researchers suggested that more than 100,000 children ages five to 14 suffer from asthma in this country each year due to overweight or obesity (10). A 2007 article in The New England Journal of Medicine predicted that by 2035 there will be an additional 100,000 cases of coronary heart disease if the trend in adolescent obesity is not stopped (11). As with adults, younger Americans are gaining weight because of an energy imbalance, i.e., more calories taken in than expended. In many neighborhoods, access to healthy, nutritious foods is limited, resulting in food choices that are higher in calories than home‐prepared meals. A study published in Pediatrics in 2004 found that added calories from fast food consumption can cause a child to gain an extra six pounds a year (12). Many schools offer “competitive” foods and drinks that are high in calories and sugar. Along with diets that are not as healthy as they should be, children are not participating in physical activity that could reduce the risk for obesity and overweight. Students have less time to be active while at school, and many live in neighborhoods that do not have safe places for outside play or support walking or bike riding. The estimated annual cost of direct health expenses due to childhood obesity is $14 billion, with children on Medicaid accounting for $3 billion of those costs (13). The average 2006 Medicaid health expenditure for an obese child was $6,730, compared with an average for all children of $2,446. According to an analysis by Trasande et al., the costs of hospitalizations among obese children increased from $125.9 million in 2001 to $237.6 million in 2005 (14). The National Health and Nutrition Examination Survey (NHANES) has monitored overweight and obesity among children ages two through 19 on the national level through its annual survey since 1971 (15,16). According to NHANES data: ● Obesity among children ages two through five has doubled, increasing from 5.0% in 1971‐1974 to 10.4% in 2007‐2008. ● The obesity rate among children ages six through 11 increased over the time period from 4.0% to 19.6%. ● The prevalence among adolescents (ages 12‐19) rose from 6.1% to 18.1%. ● Approximately 17% of children and adolescents, or 12.5 million young Americans, are currently obese according to guidelines issued by the Centers for Disease Control and Prevention (CDC). Boys are more likely to be obese than girls (19.3% vs. 16.8%), and Hispanic and African American children and youth are more likely to be obese than their white counterparts.
2 BMI equal to or greater than the 95th percentile for sex and age based on the 2000 CDC growth charts
5
Current Document. The current document is intended to update information on overweight and
obesity in West Virginia that was originally published in 2002 by the West Virginia Health Statistics Center (HSC) in a report titled Obesity: Facts, Figures, Guidelines (5). State‐level data on childhood, adolescent, and adult overweight and obesity are examined in the present report, with county‐level data provided when available. Links to the sources for the data included in this document are listed in Appendix A; the survey methodologies used to obtain the individual data sets can be accessed at these links.

6
Obesity in West Virginia
Adult Obesity (Ages 18 and Older)
Obesity: Facts, Figures, Guidelines estimated that in 2001 one in four adults (25.1%) in West Virginia was obese; by 2009, the estimate had grown to 31.7%, close to one‐third of the state’s adult population. According to data from the BRFSS, the prevalence of adult obesity in West Virginia increased by an average of 4.6% per year between 1988 and 2008 (using a three‐year moving average). The CDC estimates that, if this trend is not reversed, West Virginia could have a prevalence of adult obesity of 46.1% by 2018, nearly half of the adults in the state (17). Figure 3 illustrates the increase in obesity prevalence in both the United States and West Virginia over the past 15 years. The rate of obesity has increased in both the state and the nation. The 2009 prevalence of 31.7% for West Virginia was 17% higher than the national rate; the state ranked 6th among the 54 participants3 in the BRFSS survey in that year (see Appendix B for obesity rates among all the participants). A comparison of the rates of obesity and overweight (BMI 25.0‐29.9) by gender in West Virginia and the United States is presented in Figure 4. Men were more likely than women to be overweight in both the state and the nation, with little difference in overweight prevalence noted between West Virginia and the nation. Both sexes in the state, however, were more likely than those nationwide to be obese. 3 50 states, the District of Columbia, Guam, Puerto Rico, and the U.S. Virgin Islands
15.9 16
.816
.6 18.3 19
.8 20.1 21
.1 22.2 22
.8 23.2 24
.4 25.1 26
.3 26.6 27
.2
18.3 19
.9 20.6
23.9 24
.6
23.2 25
.127
.627
.727
.630
.6 31 30.3 31
.931
.7
1995 1997 1999 2001 2003 2005 2007 20090
10
20
30
40
Per
cent
age
West Virginia United States
Fig. 3. Prevalence (%) of Obesity (BMI 30+)West Virginia and United States BRFSS, 1995-2009
31.328.8
32.1
25.9
42.3 42.5
29.4 29.9
WV Men US Men WV Women US Women0
10
20
30
40
50
Per
cent
age
Overweight Obese
* Overweight = BMI 25.0-29.9**Obese = BMI 30+
Fig. 4. Prevalence (%) of Overweight* and Obesity** by GenderWest Virginia and United States, BRFSS, 2009

7
Obesity Prevalence by County. Data on obesity prevalence were aggregated for the years 1999‐2003 and 2004‐2008 in order to examine the change in rates on the county level4. Figures 5 and 6 illustrate the striking change that has taken place over the 10‐year period among the state’s counties. In 1999‐2003, only six of the 55 counties had obesity rates that were above 30% of the adult population.
By 2004‐2008, 35 counties reported such rates. While 28 counties reported obesity rates between 20% and 24% in 1999‐2003, only one county (Randolph) had that low a prevalence in 2004‐2008. The overall state rate increased from an average of 25.7% during the five years from 1999 through 2003 to an average of 30.3% during 2004 through 2008. (Individual county rates can be found in Appendix C.)
4 In order to provide risk factor data on a substate level, county BRFSS data were combined into five‐year aggregates. For the prevalence data presented in this report, 24 counties had aggregated sample sizes large enough to yield individual prevalence calculations. Samples from the 31 counties that had sample sizes too small to stand alone were combined with samples from other less‐populated, contiguous counties into 12 groupings, or multicounty regions. A single prevalence was then calculated for each grouping; this rate was used as the prevalence for each county within that grouping.
Barbour
Berkeley
Boone
Braxton
Brooke
Cabell Clay
Fayette
Gilmer
Grant
Greenbrier
Hampshire
Hancock
Hardy
Harrison
Jackson
Kanawha
Lewis
Lincoln
Logan
McDowell
Marion
Mason
Mercer
Mineral
Mingo
Monongalia
Monroe
Morgan
Nicholas
Ohio
Pendleton
Pocahontas
Preston
Putnam
Raleigh
Randolph
Ritchie
Roane
Taylor
Tucker
Tyler
Upshur
Wayne
Webster
Wetzel
Wirt
Wood
Wyoming
Marshall
Cal-houn
Dodd-ridge
Jeff-erson
Pleas-ants
Sum-mers
30% or more
25% - 29%
20% - 24%
Percentage of Adult Population That Is Obese
WV Total: 25.7%
Highest -- Logan (35.7%)Lowest --Hardy, Pendleton, Pocahontas (20.7%)
Fig. 5
Prevalence (%) of Obesity* by CountyWest Virginia BRFSS, 1999-2003
*Obesity = BMI 30 or greater
Barbour
Berkeley
Boone
Braxton
Brooke
Cabell Clay
Fayette
Gilmer
Grant
Greenbrier
Hampshire
Hancock
Hardy
Harrison
Jackson
Kanawha
Lewis
Lincoln
Logan
McDowell
Marion
Mason
Mercer
Mineral
Mingo
Monongalia
Monroe
Morgan
Nicholas
Ohio
Pendleton
Pocahontas
Preston
Putnam
Raleigh
Randolph
Ritchie
Roane
Taylor
Tucker
Tyler
Upshur
Wayne
Webster
Wetzel
Wirt
Wood
Wyoming
Marshall
Cal-houn
Dodd-ridge
Jeff-erson
Pleas-ants
Sum-mers
30% or more
25% - 29%
20% - 24%
Percentage of Adult Population That Is Obese
WV Total: 30.3%
Highest -- Logan (40.3%)Lowest --Randolph (22.7%)
Fig. 6
Prevalence (%) of Obesity* by CountyWest Virginia BRFSS, 2004-2008
*Obesity = BMI 30 or greater

8
Average Weight in Pounds. Another way to track the increase in weight within a population is to look at the average weight in pounds by year. BRFSS data from 1988 through 2009 show that, with few exceptions, the average weight has been steadily increasing for both sexes5. Over the two‐decade period, the average weight for both men and women has risen markedly (19.7 pounds for men and 23 pounds for women), as seen in Table 2. In the nation as a whole, the average American male gained 17.1 pounds and the average American female gained 15.4 pounds between 1988 and 2008 (18).
Table 2. Average Weight in Pounds for Men and Women (Ages 18+) West Virginia BRFSS, 1988‐2009
Year Men Women 1988 182.4 142.2 1989 179.1 144.7 1990 182.2 144.9 1991 184.2 146.8 1992 185.0 147.1 1993 184.1 150.3 1994 186.3 149.7 1995 185.8 150.8 1996 186.9 153.1 1997 188.8 152.6 1998 191.0 154.2 1999 193.3 157.2 2000 194.0 154.9 2001 195.0 157.5 2002 195.9 157.4 2003 196.6 157.2 2004 197.5 159.3 2005 199.1 161.4 2006 201.4 162.8 2007 200.2 162.6 2008 201.9 165.0 2009 202.1 165.2
5The data collected by the BRFSS survey are self reported, and research has shown that many people tend to understate their actual weight. While the numbers are perhaps conservative, however, the trend shown in Table 2 is evident.

9
Weight Categories. To chart changes in weight among the state’s adults, the four weight categories as defined by the CDC and shown in the box below were used. To fully understand the upward trend in obesity, it is necessary to examine the trends in the other three weight categories. Figures 7 through 10 illustrate the course over time of all four categories in West Virginia from 1989 through 2009. (Individual yearly rates can be found in Appendix D.) Three‐year moving averages were used to calculate the rates in order to eliminate yearly aberrations or spikes in prevalence. An average annual percentage change was calculated for each weight category.
BMI Weight Status Examples (adults) 5’ 6” 5’ 10” 6’ 2”<18.5 Underweight <115 lbs. <129 lbs. <144 lbs.18.5‐24.9 Healthy Weight 115‐154 lbs. 129‐174 lbs. 144‐194 lbs.25.0‐29.9 Overweight 155‐185 lbs. 175‐208 lbs. 195‐233 lbs.30.0+ Obese 186+ lbs. 209+ lbs. 234+ lbs.
1989 19
9119
9319
9519
9719
99 2001
2003
2005
2007
0
1
2
3
4
5
Per
cent
age
*BMI <18.5
Fig. 7. Prevalence (%) of Adults Who Were Underweight*West Virginia BRFSS, 1989-2008
(3-Year Moving Averages)
Average Annual Change: -3.0%
1989 19
9119
9319
9519
9719
99 2001
2003
2005
2007
0
10
20
30
40
50
60P
erce
ntag
e
*BMI 18.5-24.9
Fig. 8. Prevalence (%) of Adults Who Were Healthy Weight*West Virginia BRFSS, 1989-2008
(3-Year Moving Averages)
Average Annual Change: -2.7%
1989 19
9119
9319
9519
9719
99 2001
2003
2005
2007
0
10
20
30
40
50
Per
cent
age
*BMI 25.0-29.9
Fig. 9. Prevalence (%) of Adults Who Were Overweight*West Virginia BRFSS, 1989-2008
(3-Year Moving Averages)
Average Annual Change: +0.7%
1989 19
9119
9319
9519
9719
99 2001
2003
2005
2007
0
10
20
30
40
Perc
enta
ge
*BMI 30+
Fig. 10. Prevalence (%) of Adults Who Were Obese*West Virginia BRFSS, 1989-2008
(3-Year Moving Averages)
Average Annual Change: +4.6%

10
Weight Categories6 by Gender, Age, and Race. As shown in Figure 11, in 2009 women were more likely to report a healthy weight, while men were more likely to be overweight. Little difference was noted by sex for obesity prevalence.
Younger respondents (ages 18‐24) were more likely to report having a healthy weight than other respondents (Fig. 12), with middle‐age adults (ages 45‐64) the least likely. Obesity was more likely among middle‐aged adults, with nearly two‐fifths (37.6%) having a BMI of 30 or greater. Overweight steadily increased with age.
White respondents were more likely to report a healthy weight than were African American respondents (Fig. 13). African Americans were more likely to be obese than white, while little difference was noted between the groups in the prevalence of overweight.
6 Underweight respondents were omitted from further analysis for two reasons. First, the sample sizes of adults meeting the definition of underweight were too small to allow for meaningful comparisons; secondly, it was not possible to control for such factors as ongoing illnesses that might be an underlying cause of underweight.
35.2
29.432.1
25
42.4
31.3
Healthy Overweight Obese0
10
20
30
40
50
Perc
enta
ge
Male Female
*Healthy weight = BMI 18.5-24.9; Overweight = BMI 25-29.9; Obese = BMI 30+
Fig. 11. Prevalence (%) of Weight Categories* by GenderWest Virginia BRFSS, 2009
34.1
39.3
24.323.3
37.7 37.6
30.634.4 33.3
43.2
28.2
22
Healthy Overweight Obese0
10
20
30
40
50
Perc
enta
ge
18-24 25-44 45-64 65+
*Healthy weight = BMI 18.5-24.9; Overweight = BMI 25-29.9; Obese = BMI 30+
Fig. 12. Prevalence (%) of Weight Categories* by Age GroupWest Virginia BRFSS, 2009
21.3
34.6
41.8
30.5
35.7
31.5
Healthy Overweight Obese0
10
20
30
40
50
Per
cent
age
White African American
* Healthy weight = BMI 18.5-24.9; Overweight = BMI 25-29.9; Obese = BMI 30+**Other races not included because of small sample sizes
Fig. 13. Prevalence (%) of Weight Categories* by Race**West Virginia BRFSS, 2009

11
Weight Categories and Health Status. Self‐perceived health status was ascertained by asking BRFSS respondents if in general they thought their health was excellent, very good, good, fair, or poor. Figure 14 shows how self‐perceived health status is associated with weight. Obese individuals were far less likely than either healthy weight or overweight respondents to report their health as excellent or very good. Weight Categories and Chronic Disease Prevalence. Excess weight has been strongly linked to many chronic diseases and conditions, including heart disease, diabetes, asthma, hypertension, and arthritis, all of which are monitored through the BRFSS. The survey includes questions asking if a respondent has ever been told they had a heart attack, coronary heart disease, and/or a stroke, i.e., cardiovascular disease. Fifteen percent (15.2%) of obese respondents reported having one or more cardiovascular diagnoses, compared with 12.4% of overweight respondents and 10.6% of respondents having a healthy weight (Fig. 15). Over half (53.1%) of obese respondents had been told they had high blood pressure, a significantly higher rate than those reported by either overweight or healthy weight individuals (Fig. 16).
46.151.1
65
53.948.9
35
Healthy Overweight Obese0
10
20
30
40
50
60
70
Perc
enta
ge
Excellent/Very Good Good/Fair/Poor
* Healthy weight = BMI 18.5-24.9; Overweight = BMI 25-29.9; Obese = BMI 30+
Fig. 14. Prevalence (%) of Self-Reported Health StatusBy Weight Category*
West Virginia BRFSS, 2009
10.6
12.4
15.2
Healthy Overweight Obese0
5
10
15
20
Perc
enta
ge
*Ever told by a health professional that they had heart attack, coronary heart disease, and/or stroke** Healthy weight = BMI 18.5-24.9; Overweight = BMI 25-29.9; Obese = BMI 30+
Fig. 15. Prevalence (%) of Having Cardiovascular Disease*By Weight Category**
West Virginia BRFSS, 2009
25.3
35.6
53.1
Healthy Overweight Obese0
10
20
30
40
50
60
Per
cent
age
*Ever told by a health professional that they had high blood pressure** Healthy weight = BMI 18.5-24.9; Overweight = BMI 25-29.9; Obese = BMI 30+
Fig. 16. Prevalence (%) of Having High Blood Pressure*By Weight Category**
West Virginia BRFSS, 2009

12
Respondents who were obese were also more likely than other respondents to have been told they have high blood cholesterol (Fig. 17) and diabetes (Fig. 18). Obese persons had nearly twice the rate of diabetes than those who were overweight and were over three times more likely to report having the disease than healthy weight individuals.
BRFSS respondents who were classified as obese reported having asthma at a rate that was 67.4% higher than overweight individuals and over two times higher than healthy weight individuals (Fig. 19). Obese individuals were also more likely to have been told they had some form of arthritis, rheumatoid arthritis, gout, lupus, or fibromyalgia than other respondents, as illustrated in Figure 20.
29.6
39.2
45.4
Healthy Overweight Obese0
10
20
30
40
50
Per
cent
age
*Ever told by a health professional that they had high blood cholesterol (Excludes respondents who have never had their cholesterol level checked)** Healthy weight = BMI 18.5-24.9; Overweight = BMI 25-29.9; Obese = BMI 30+
Fig. 17. Prevalence (%) of Having High Blood Cholesterol*By Weight Category**
West Virginia BRFSS, 2009
6.1
10.8
20.8
Healthy Overweight Obese0
5
10
15
20
25
Per
cent
age
*Ever told by a health professional that they had diabetes** Healthy weight = BMI 18.5-24.9; Overweight = BMI 25-29.9; Obese = BMI 30+
Fig. 18. Prevalence (%) of Having Diabetes*By Weight Category**
West Virginia BRFSS, 2009
6
7.4
12.5
Healthy Overweight Obese0
5
10
15
Per
cent
age
*Currently have asthma** Healthy weight = BMI 18.5-24.9; Overweight = BMI 25-29.9; Obese = BMI 30+
Fig. 19. Prevalence (%) of Having Asthma*By Weight Category**
West Virginia BRFSS, 2009
27
31.635
Healthy Overweight Obese0
10
20
30
40
50
Per
cent
age
*Ever told by a health professional they had some form of arthritis, rheumatoid arthritis, gout, lupus, or fibromyalgia** Healthy weight = BMI 18.5-24.9; Overweight = BMI 25-29.9; Obese = BMI 30+
Fig. 20. Prevalence (%) of Having Arthritis*By Weight Category**
West Virginia BRFSS, 2009

13
Weight Categories and Activity Limitation. BRFSS respondents were asked if they were limited in any way in any activities because of physical, mental, or emotional problems. Obese respondents reported a rate of activity limitation that was 38% higher than that of overweight individuals and 61% higher than that reported by individuals of healthy weight (Fig. 21). Weight Categories and Physical Inactivity. Little difference in the prevalence of physical inactivity was noted in 2009 between healthy weight and overweight people. As Figure 22 shows, however, obese respondents to the survey were about 38% more likely to have reported no participation in any leisure‐time physical activity during the month preceding the interview. Among its many other benefits, physical activity is essential in weight management. When an individual engages in physical activity, calories are burned. The more intense the exercise, the more calories are burned. The CDC recommends two hours and 30 minutes of moderate‐intensity aerobic physical activity per week7 for adults, along with muscle‐strengthening activities on two or more days (19).
7 Or one hour and 15 minutes of vigorous‐intensity aerobic physical activity, or an equivalent combination of moderate‐intensity and vigorous‐intensity activity, with muscle‐strengthening activities on two or more days
21.6
25.2
34.8
Healthy Overweight Obese0
10
20
30
40
Per
cent
age
*Limited in any way in any activities because of physical, mental, or emotional problems** Healthy weight = BMI 18.5-24.9; Overweight = BMI 25-29.9; Obese = BMI 30+
Fig. 21. Prevalence (%) of Activity Limitation*By Weight Category**
West Virginia BRFSS, 2009
29.4 29
40.2
Healthy Overweight Obese0
10
20
30
40
50
Per
cent
age
*Did not participate in any physical activities or exercise other than their regular job during the month before the interview** Healthy weight = BMI 18.5-24.9; Overweight = BMI 25-29.9; Obese = BMI 30+
Fig. 22. Prevalence (%) of Physical Inactivity*By Weight Category**
West Virginia BRFSS, 2009

14
According to BRFSS data, only 35.2% of adult West Virginians met the CDC recommendations for moderate or vigorous physical activity in 2009, compared with 50.6% of adults nationwide (Fig. 23). As shown, both sexes were much less likely to exercise in the state than in the nation.
While approximately one‐third of adults in the state exercise enough to meet the CDC recommendations, another one‐third (33.2%) reported having participated in no physical activity at all during the month before the survey (Fig.24). Twenty‐nine percent (29.4%) of men and 36.8% of women in West Virginia reported being physically inactive in 2009, compared with 21.6% and 26.1%, respectively, of their counterparts nationally.
24.221.6
26.1
33.2
29.4
36.8
Total Men Women0
10
20
30
40
Perc
enta
ge
West Virginia United States
*Answered "no" to the question "During the past month, did you participate in any physical activities?"
Fig. 24. Prevalence (%) of Physical Inactivity* by GenderWest Virginia and United States, BRFSS, 2009
50.653.3
48.3
35.237
33.4
Total Men Women0
10
20
30
40
50
60
Perc
enta
ge
West Virginia United States
*30 minutes or more of moderate physical activity 5+ days per week or vigorous physical activity for 20+minutes 3 or more days per week
Fig. 23. Prevalence (%) of Physical Activity* by GenderWest Virginia and United States, BRFSS, 2009

15
Obesity and Related Comorbidities: The Numbers
While the prevalence of a condition or risk factor is helpful in examining trends over time and making comparisons between states or with the United States as a whole, numbers show a problem within a state in more concrete terms. The obesity prevalence of 31.7% of the state’s adult population translates into approximately 436,000 West Virginia residents. In addition to the other problems each of these individuals may face because of his or her obesity, an individual might be suffering from cardiovascular disease, hypertension, or diabetes, or perhaps a combination of two or more of these conditions. An analysis was performed using BRFSS data on obese respondents who also answered survey questions on cardiovascular disease, diabetes, and hypertension (Fig. 25). Among these respondents, more than six in 10 (61.0%) had already developed one or more of the three obesity‐related chronic diseases addressed in the analysis. There are approximately 135,000 adults in the state who are obese and have hypertension, while 43,700 are obese with hypertension and diabetes. Another 20,700 obese individuals have all three illnesses. The rest of the combinations are shown in the chart below.
Obesity without CVD, Diabetes, HBP168400
Obesity, HBP135100
Obesity, Diabetes19400
Obesity, CVD9700
Obesity, Diabetes, HBP43700
Obesity, CVD, HBP29300
Obesity, CVD, Diabetes6000
Obesity,CVD, Diabetes, HBP20700
*Weighted frequencies from sample data**BMI = 30+***CVD = Ever been told had a heart attack, coronary heart disease, and/or a stroke; Diabetes; HBP=High blood pressure
Fig. 25. Estimated Number* of Respondents Who Were Obese**And Also Reported Other Selected Chronic Diseases***
West Virginia BRFSS, 2009

16
Morbid Obesity Even more disturbing than the rapid increase in obesity is the fact that the prevalence of extreme, also called morbid, obesity (i.e., having a BMI of 40 or greater8) has also been increasing at an alarming rate. The overall percentage of the adult population in West Virginia that is morbidly obese increased from 0.9% in 1989 to 4.9% in 2008, an average rise of 10.5% per year (Fig. 26). The annual average increase among men was 12.8%, while that among women was 9.6% (Fig. 27). By age, the highest rate of morbid obesity among men in 2008 was 6.3% among those aged 25 through 44; among women, 6.9% of those aged 25 through 44 and 7.1% of those aged 45 through 64 fit the classification (Fig. 28). (Prevalence data for Figures 26 and 27 are found in Appendix E.)
8 Morbid obesity also refers to a person who is more than 100 pounds over his/her ideal body weight, as well as those who have a BMI of 35 or greater with an existing comorbidity. Only those individuals with a BMI of 40 or greater are included in the present analysis.
1989
1991
1993
1995
1997
1999
2001
2003
2005
2007
0
2
4
6
8
10
Per
cent
age
*BMI >=40
Fig. 26. Prevalence (%) of Adults Who Were Morbidly Obese*West Virginia BRFSS, 1989-2008
(3-Year Moving Averages)
Average Annual Change: +10.5%
1989
1991
1993
1995
1997
1999
2001
2003
2005
2007
0
2
4
6
8
10
Per
cent
age
Men Women
*BMI >=40
Fig. 27. Prevalence (%) of Adults Who Were Morbidly Obese*By Gender, West Virginia BRFSS, 1989-2008
(3-Year Moving Averages)
Average Annual Change Among Men: +12.8%Average Annual Change Among Women: +9.6%
1.3
2.7
4.2
7.16.3
6.9
0.3
5
Men Women
0
2
4
6
8
10
Perc
enta
ge
18-24 25-44 45-64 65+
*BMI >=40
Fig. 28. Prevalence (%) of Morbidly Obese* AdultsBy Gender and Age Group, West Virginia BRFSS, 2008
(3-Year Moving Average)

17
Childhood and Adolescent Obesity While the Behavioral Risk Factor Surveillance System provided the data presented in the examination of obesity among the adult population in West Virginia, five data sources were used to examine childhood and adolescent obesity in the current document, each source addressing different age groups and subpopulations among the youth population (see Appendix A). BMI for children and teenagers is calculated from a child’s weight and height but, unlike that for adults, is age and sex specific and is referred to as BMI‐for‐age. The child’s BMI is plotted on the 2000 CDC BMI‐for‐age growth charts to determine a percentile ranking, which compares the child’s BMI to other children of the same sex and age. The following four categories are used to rate the child’s BMI: (1) underweight: less than the 5th percentile; (2) healthy weight: 5th percentile to less than 85th percentile; (3) overweight: 85th to less than the 95th percentile, and (4) obese: equal to or greater than the 95th percentile.
Pediatric Nutrition Surveillance System
The Pediatric Nutrition Surveillance System (PedNSS) is a public health surveillance system that tracks the nutritional status of low‐income children in federally funded maternal and child health programs. In West Virginia, PedNSS monitors children under the age of five who are enrolled in the Special Supplemental Nutrition Program for Women, Infants, and Children (WIC). The prevalence rates of obesity among low‐income children ages two through four from 2000 through 2009 for both West Virginia and the United States are shown in Figure 29. Although rates are rising both state and nationwide, the state reported consistently lower rates than the nation. Thirteen percent (13.4%) of West Virginia children enrolled in WIC in 2009 were classified as obese.
1313.4
14.314.7 14.8 14.7 14.8 14.9 14.8 14.7
11.512 11.9
13.2
12.6
11.7
12.713.1
13.4 13.4
2000 2001 2002 2003 2004 2005 2006 2007 2008 200910
11
12
13
14
15
16
Per
cent
age
West Virginia United States
*Equal to or greater than 95th percentile BMI-for-age based on 2000 CDC growth charts**As defined by WIC participation
Fig. 29. Prevalence (%) of Obesity* among Low-Income** ChildrenAges 2 through 4 in West Virginia and United StatesPediatric Nutrition Surveillance System, 2000-2009
18
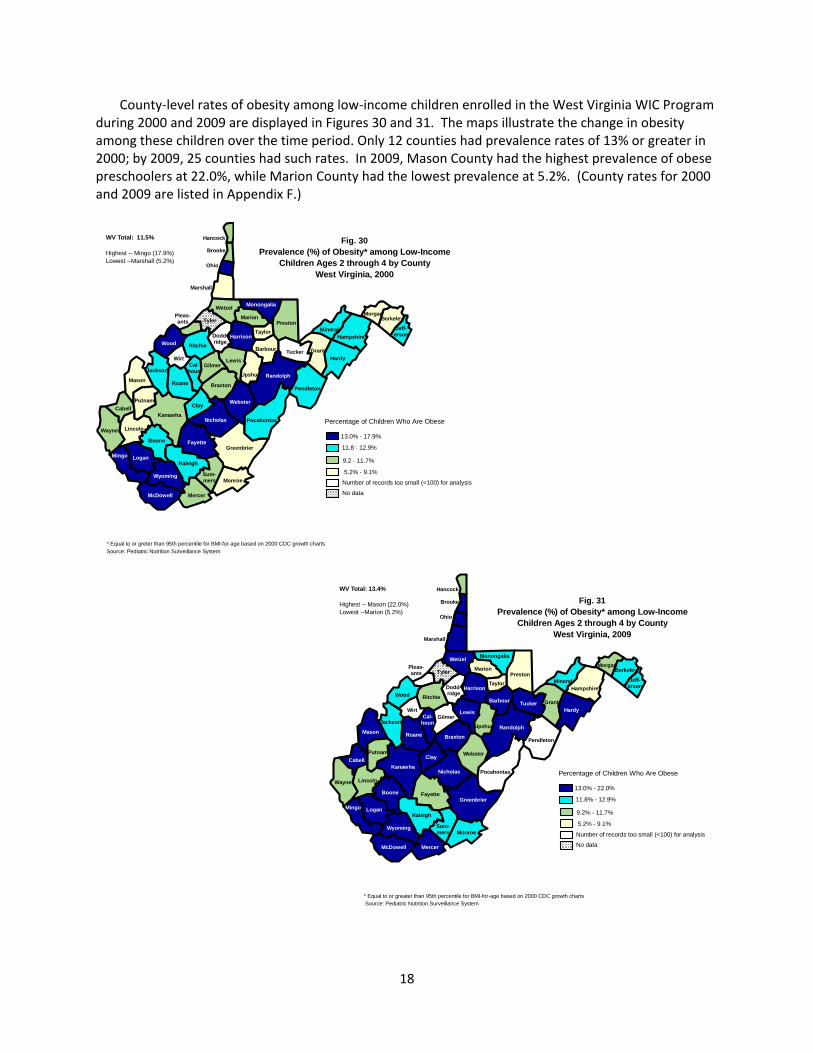
County‐level rates of obesity among low‐income children enrolled in the West Virginia WIC Program during 2000 and 2009 are displayed in Figures 30 and 31. The maps illustrate the change in obesity among these children over the time period. Only 12 counties had prevalence rates of 13% or greater in 2000; by 2009, 25 counties had such rates. In 2009, Mason County had the highest prevalence of obese preschoolers at 22.0%, while Marion County had the lowest prevalence at 5.2%. (County rates for 2000 and 2009 are listed in Appendix F.)
Barbour
Berkeley
Boone
Braxton
Brooke
Cabell Clay
Fayette
Gilmer
Grant
Greenbrier
Hampshire
Hancock
Hardy
Harrison
Jackson
Kanawha
Lewis
Lincoln
Logan
McDowell
Marion
Mason
Mercer
Mineral
Mingo
Monongalia
Monroe
Morgan
Nicholas
Ohio
Pendleton
Pocahontas
Preston
Putnam
Raleigh
Randolph
Ritchie
Roane
Taylor
Tucker
Tyler
Upshur
Wayne
Webster
Wetzel
Wirt
Wood
Wyoming
Marshall
Cal-houn
Dodd-ridge
Jeff-erson
Pleas-ants
Sum-mers
13.0% - 22.0%
11.8% - 12.9%
9.2% - 11.7%
Percentage of Children Who Are Obese
WV Total: 13.4%
Highest -- Mason (22.0%)Lowest --Marion (5.2%)
Fig. 31Prevalence (%) of Obesity* among Low-Income
Children Ages 2 through 4 by CountyWest Virginia, 2009
* Equal to or greater than 95th percentile for BMI-for-age based on 2000 CDC growth charts
5.2% - 9.1%
Number of records too small (<100) for analysisNo data
Source: Pediatric Nutrition Surveillance System
Barbour
Berkeley
Boone
Braxton
Brooke
Cabell Clay
Fayette
Gilmer
Grant
Greenbrier
Hampshire
Hancock
Hardy
Harrison
Jackson
Kanawha
Lewis
Lincoln
Logan
McDowell
Marion
Mason
Mercer
Mineral
Mingo
Monongalia
Monroe
Morgan
Nicholas
Ohio
Pendleton
Pocahontas
Preston
Putnam
Raleigh
Randolph
Ritchie
Roane
Taylor
Tucker
Tyler
Upshur
Wayne
Webster
Wetzel
Wirt
Wood
Wyoming
Marshall
Cal-houn
Dodd-ridge
Jeff-erson
Pleas-ants
Sum-mers
13.0% - 17.9%
11.8 - 12.9%
9.2 - 11.7%
Percentage of Children Who Are Obese
WV Total: 11.5%
Highest -- Mingo (17.9%)Lowest --Marshall (5.2%)
Fig. 30Prevalence (%) of Obesity* among Low-Income
Children Ages 2 through 4 by CountyWest Virginia, 2000
* Equal to or greter than 95th percentile for BMI-for-age based on 2000 CDC growth charts
5.2% - 9.1%
Number of records too small (<100) for analysis
No data
Source: Pediatric Nutrition Surveillance System

19
National Immunization Survey
The National Immunization Survey (NIS) is conducted by the National Center for Immunizations and Respiratory Diseases (NCIRD) and the National Center for Health Statistics (NCHS). The NIS, begun in 1994 to monitor childhood immunization coverage, is a telephone survey that is followed by a mailed survey. In addition to immunization information, the survey has contained questions on initiation and duration of breastfeeding since 2001.
Breastfeeding has been described as “the first defense against obesity” (20). Among breastfeeding’s many documented benefits, numerous studies have pointed to an association between breastfeeding and a lower risk of overweight and obesity in children and adolescents (21,22), although the necessary duration of breastfeeding and its protective effect have not been determined. The CDC suggests that 15% to 20% of childhood obesity could be prevented through breastfeeding (20). The American Academy of Pediatricians recommends exclusive breastfeeding for the first six months of an infant’s life, and supports continued breastfeeding, while introducing appropriate foods, for the first year (23).
West Virginia has had a traditionally low rate of breastfeeding. According to the Breastfeeding Report Card 2010 issued by the CDC, West Virginia ranked 49th among the 50 states and District of Columbia in the percentage of infants born in 2007 who were ever breastfed or fed breast milk (Fig. 32). The state rate was 53.0%, compared with a national average of 75.0%. Rates for the other states and the District of Columbia are found in Appendix G.
Alaska
California
Idaho
Oregon
Washington
Montana
Wyoming
Utah
Co lorado
ArizonaNew Mexico
Texas
Oklahoma
Kansas
Nebraska
South Dakot a
North Dakota Minnesota
Wisconsin
Iowa
Il lino isOhio
Ind iana
Kentucky
WVVirginia
N. Carolina
Geo rgia
Florida
AlabamaMS
Missouri
Arkansas
LA
Nevada
Hawaii
Michigan
PennsylvaniaNJ
New York CTMA
VT
NH
Maine
Tennessee
MDDE
RI
DC
S. Caro lina
Fig. 32Percentage of Children Ever Breastfed by State
Children Born In 2007
Source: Nationa l Immunization Survey
50%‐59.9%
60%‐69.9%
70%‐74.9%
75%‐79.9%
80% or More

20
Figure 33 shows the percentage of infants born in 2007 who were ever breastfed, breastfed at six months, and breastfed at 12 months for both West Virginia and the United States. Only 12.5% of state infants were still being breastfed at one year, compared with a national average of 22.4%. The state rate of ever breastfeeding increased between 2000 and 2007, from 39.0% in 2000 to 53.0% in 2007, a 41.5% increase (Fig. 34). The national rate increased from 70.9% to 75.0% over the same time period, a 5.8% increase.
75
43
22.4
53
25.9
12.5
Ever breastfed
Breastfed at 6 months
Breastfed at 12 months
0 10 20 30 40 50 60 70 80
Percentage
West Virginia United States
*Provisional data. Final data available August 2011.Source: CDC National Immunization Survey
Fig. 33. Percentage of Infants Who Were Ever Breastfed,Breastfed at 6 Months, and Breastfed at 12 Months
West Virginia and United States, 2007 Births*
70.9 71
.671
.4 72.6 73
.1 74.1 74 75
39
51.6
44.7
56.3 58
.9
54.3
58.5
53
2000 2001 2002 2003 2004 2005 2006 2007*30
40
50
60
70
80
Per
cent
age
West Virginia United States
*Provisional data. Final data available August 2011.Source: CDC National Immunization Survey
Fig. 34. Percentage of Infants Ever Breastfed by Year of Birth West VIrginia and United States, 2000-2007

21
National Survey of Children’s Health
The National Survey of Children’s Health (NSCH), sponsored by the Maternal and Child Health Bureau of the U.S. Department of Health and Human Services, is conducted every four years and was begun in 20039. The survey is designed to provide information on a broad range of topics about the health and welfare of children under the age of 18 and includes questions on overweight and obesity among young children and adolescents. Figure 35 shows the distribution of the four weight categories among children ages 10 through 1710 in 2007 for the state and the nation. At that time, children in West Virginia were slightly more likely to be overweight or obese than those nationwide.
Income and Health Care Coverage. When family income was examined, NSCH data revealed that 47.4% of West Virginia children ages 10‐17 living in families with incomes of less than 100% of the federal poverty level (FPL) were either overweight or obese, compared with 44.8% in the United States. Among families with incomes of greater than 400% FPL, 27.4% of state children were overweight or obese, compared with 22.2% of their counterparts nationwide. Forty‐four percent (43.5%) of children covered by public insurance in the state were overweight or obese, similar to 43.2% in the nation as a whole. In families with private insurance coverage, 31.0% of the children in West Virginia were overweight or obese, compared with 27.3% nationwide. Physical Activity. Parents of children ages six through 17 were asked about the number of days per week their child was engaged in vigorous physical activity11. According to NSCH data, children in West
9 Results from the 2011 survey will be available in 2012. 10 Based on the parent’s recollection. Comparisons with NHANES physical measurements showed that parents typically overestimate height and underestimate weight of children younger than 10 years (31). Data on younger children were not included in the survey results for this category for this reason. 11 The CDC recommends that children and adolescents should do 60 minutes (one hour) of physical activity every day (19).
5.2
63.2
15.3 16.4
4.5
60
16.718.9
Underweight Healthy weight Overweight Obese0
10
20
30
40
50
60
70
Per
cent
age
West Virginia United States
*Underweight (<5th percentile); healthy weight (5th- 84th percentile); overweight (85th-94th percentile); obesity (>= 95th percentile)Source: National Survey of Children's Health
Fig. 35. Prevalence (%) of Children Aged 10-17 by WeightCategory* Based on BMI for Age
West Virginia and United States, 2007

22
Virginia were more likely to participate in physical activity on every day of the week than were children nationwide (Fig. 36). However, they were also more likely to spend more than one hour on weekdays watching TV or playing video games than their national counterparts (Fig. 37).
10.3
25.4
34.4
29.9
8
24.5
34.3 33.2
0 days 1-3 days 4-6 days Every day0
10
20
30
40P
erce
ntag
e
West Virginia United States
*Child exercised, played a sport, or participated in physical activity for at least 20 minutes that made him/her sweat and breathe hardSource: National Survey of Children's Health
Fig. 36. Prevalence (%) of Children Aged 6-17 by Number of DaysPer Week Spent Exercising* (Parental Reporting)
West Virginia and United States, 2007
5.8
44.139.3
10.8
2.6
39.6
46.6
11.1
None 1 hour or less >1 hour but <4 hours 4 hours or more0
10
20
30
40
50
60
Perc
enta
ge o
f Chi
ldre
n
West Virginia United States
Source: Natonal Survey of Children's Health
Fig. 37. Time Spent Watching TV or Videos or Playing VideoGames on an Average Weekday by Children Aged 6-17
West Virginia and United States, 2007

23
West Virginia Healthy Lifestyles Act Evaluations
The “Healthy Lifestyles Act” (House Bill 2816) was passed in 2005 to address obesity and weight‐related problems found among the state’s students. The Act’s components include student BMI and fitness assessments, guidelines for health education instruction, and policy direction for physical education. A multi‐agency team from the West Virginia University Health Sciences Center, the West Virginia Office of Healthy Schools, and the West Virginia Office of Healthy Lifestyles, supported by the Robert Wood Johnson Foundation, has completed two annual evaluations of the impact of the Act on the state’s schools. Data from these two evaluations are presented below.
BMI assessments were obtained for West Virginia students in kindergarten, second grade, and fifth grade12. The prevalence of obesity among these students from Year One (2007‐2008) and Year Two (2008‐2009) of data collection are shown in Figure 38. Little change in the rate of obesity was seen among kindergarten students; there was a slight decrease noted among second graders and a slight increase among fifth graders. As part of the evaluations, parents of students in kindergarten and grades 2, 4, 5, 7, and 9 and students in grades 5, 7, and 9 were interviewed about diet and participation in physical activities. Each year, a total of 1,500 parents (250 parents/grade) and 420 students (140 students/grade) were interviewed. In Year One, 67% of parents reported being “not at all” concerned about their child’s weight, compared with 73% of parents in Year Two. Among students, 48% were “not at all” concerned about their weight in Year One; 56% were not concerned about their weight in Year Two. Other comparisons between Year One and Year Two on nutrition included: ● a decrease in soda drinking and eating fast food among students from Year One to Year Two, and ● an increase in drinking milk and eating five or more servings of fruits and vegetables on the day before the interview.
12 In the Year One evaluation (2007‐2008), 23% of schools lacked the resources to implement BMI assessments; by Year Two (2008‐2009), this was reduced to 17% of schools.
18.5
22.1
29.6
18.6
24.2
27.7
Kindergarten Second Grade Fifth Grade0
10
20
30
40
Per
cent
age
of S
tude
nts
2007-08 2008-09
*BMI equal to or greater than 95th percentile based on 2000 CDC growth charts
Fig. 38. Prevalence (%) of Obesity* among Kindergarten,Second Grade, and Fifth Grade Students
WV Healthy Lifestyles Act Evaluations, 2007-08 and 2008-09

24
Boys remained more likely than girls to report that they met the CDC guidelines13 for at least 60 minutes of daily exercise, 30.0% in Year One and 26.9% in Year Two. Twenty‐two percent of girls reported daily activity in both years (Fig. 39).
Forty‐two percent (42.2%) of parents
of boys reported daily activity by their sons in Year One, 36.0% in Year Two (Fig. 40). Twenty‐nine percent (28.9%) of parents of girls reported daily activity by their daughters in Year Two, compared with 35.3% in Year One. Parental knowledge of the health risks associated with childhood and adolescent obesity for the two school years is displayed in Figure 41. As illustrated by the graph, parents interviewed in Year One were generally more likely to be aware of the risks associated with obesity in childhood than those in Year Two.
13 The CDC recommends that children and adolescents should do 60 minutes (one hour) of physical activity every day (19).
14
17
31
56
74
76
21
22
32
54
76
80
Asthma
High Cholesterol
Hypertension
Heart Disease
Diabetes
Adult Overweight
0 20 40 60 80 100
Percentage of Parents
2007-08 2008-09
Fig. 41. Prevalence (%) of Parents Who Were Aware of Health Risks Associated with Childhood and Adolescent Obesity
WV Healthy Lifestyles Act Evaluations, 2007-08 and 2008-09
26.9
22.2
30
22.3
Boys Girls0
10
20
30
40
Per
cent
age
of S
tude
nts
2007-08 2008-09
*CDC guidelines recommend 60 minutes or more of physical activity every day
Fig. 39. Prevalence (%) of Students Self-ReportingDaily Physical Activity* by Gender
WV Healthy Lifestyles Act Evaluations, 2007-08 and 2008-09
36
28.9
42.4
35.3
Sons Daughters0
10
20
30
40
50P
erce
ntag
e of
Par
ents
2007-08 2008-09
*CDC guidelines recommend 60 minutes or more of physical activity every day
Fig. 40. Prevalence (%) of Parents ReportingDaily Physical Activity* by Their Children
WV Healthy Lifestyles Act Evaluations, 2007-08 and 2008-09

25
Youth Risk Behavior Surveillance System The Youth Risk Behavior Surveillance System (YRBSS), established by the CDC, has been collecting data since 1991 to monitor six categories of health behaviors, including nutrition and physical activity, among the nation’s youth and young adults. The YRBSS includes a national school‐based survey conducted by the CDC every two years in grades 9 through 12, as well as additional state and local school‐based surveys. West Virginia has participated in the YRBSS since 1993. Figure 42 compares the rates of overweight and obesity among high school students in West Virginia and the United States by gender in 2009. Little difference in overweight status was noted. Among students classified as obese, however, a marked difference was seen between West Virginia’s boys and their national counterparts. At 20.3%, male high school students in the state had the second highest prevalence of obesity among the 42 states surveyed by the YRBSS in 2009. (See Appendix H for obesity rates for all participating states.) A comparison of obesity rates among West Virginia students by gender from 1999 to 2009 is presented in Figure 43. The greatest gap between male and female high school students was reported in 2009. Although nationally boys were more likely to be obese than girls in 2009 (Fig. 42), the difference in West Virginia was much greater.
0
5
10
15
20
25
Perc
enta
ge
*>=95th percentile for BMI by age and sexSource: Youth Risk Behavior Surveillance System
Fig. 43. Prevalence (%) of Obesity* among High School StudentsBy Gender and Year
West Virginia, 1999-2009
Boys
Girls
1999 2001 2003 2005 2007 2009
18.3 19.5 19.2 17.6 20.3
8.1 7.4 9.8 11.7 7.7
N/A
N/A
14.6
8.6
15.8
7.7
14.6 15.2
13.1
20.3
Overweight* Obese**0
5
10
15
20
25
Perc
enta
ge
WV Boys US Boys WV Girls US Girls
*>=85th percentile but <95th percentile for BMI by age and sex**>=95th percentile for BMI by age and sexSource: Youth Risk Behavior Surveillance System
Fig. 42. Prevalence (%) of Overweight and ObesityAmong High School Students by Gender
West Virginia and United States, 2009
26
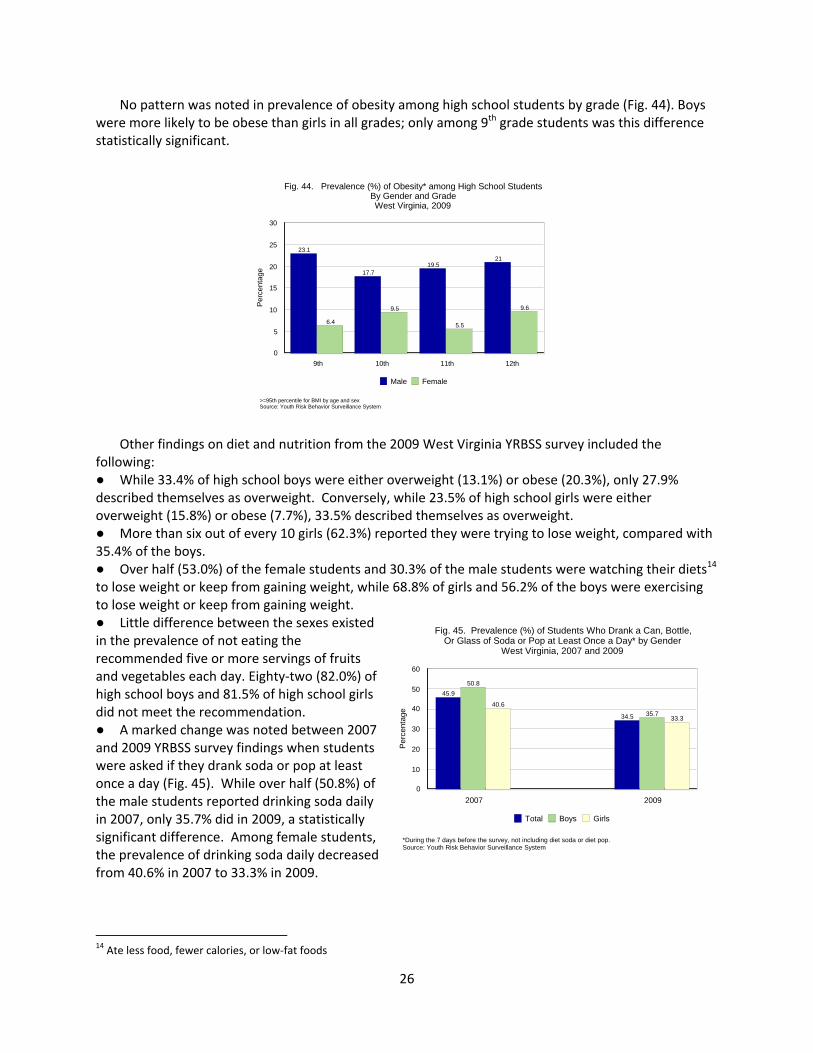
No pattern was noted in prevalence of obesity among high school students by grade (Fig. 44). Boys were more likely to be obese than girls in all grades; only among 9th grade students was this difference statistically significant. Other findings on diet and nutrition from the 2009 West Virginia YRBSS survey included the following: ● While 33.4% of high school boys were either overweight (13.1%) or obese (20.3%), only 27.9% described themselves as overweight. Conversely, while 23.5% of high school girls were either overweight (15.8%) or obese (7.7%), 33.5% described themselves as overweight. ● More than six out of every 10 girls (62.3%) reported they were trying to lose weight, compared with 35.4% of the boys. ● Over half (53.0%) of the female students and 30.3% of the male students were watching their diets14 to lose weight or keep from gaining weight, while 68.8% of girls and 56.2% of the boys were exercising to lose weight or keep from gaining weight. ● Little difference between the sexes existed in the prevalence of not eating the recommended five or more servings of fruits and vegetables each day. Eighty‐two (82.0%) of high school boys and 81.5% of high school girls did not meet the recommendation. ● A marked change was noted between 2007 and 2009 YRBSS survey findings when students were asked if they drank soda or pop at least once a day (Fig. 45). While over half (50.8%) of the male students reported drinking soda daily in 2007, only 35.7% did in 2009, a statistically significant difference. Among female students, the prevalence of drinking soda daily decreased from 40.6% in 2007 to 33.3% in 2009.
14 Ate less food, fewer calories, or low‐fat foods
6.4
9.5
5.5
9.6
23.1
17.719.5
21
9th 10th 11th 12th0
5
10
15
20
25
30
Perc
enta
ge
Male Female
>=95th percentile for BMI by age and sexSource: Youth Risk Behavior Surveillance System
Fig. 44. Prevalence (%) of Obesity* among High School StudentsBy Gender and GradeWest Virginia, 2009
40.6
33.3
50.8
35.7
45.9
34.5
2007 20090
10
20
30
40
50
60
Perc
enta
ge
Total Boys Girls
*During the 7 days before the survey, not including diet soda or diet pop.Source: Youth Risk Behavior Surveillance System
Fig. 45. Prevalence (%) of Students Who Drank a Can, Bottle,Or Glass of Soda or Pop at Least Once a Day* by Gender
West Virginia, 2007 and 2009

27
According to 2009 YRBSS data, 41.8% of high school students in West Virginia reported being physically active15 at least 60 minutes on five or more days, compared to the YRBSS median of 44.0%. As shown in Figure 46, little difference was noted among girls in the state and nation, while state boys were slightly less likely to exercise five or more days than their national counterparts. Physical inactivity16 among students in the state has decreased since 2005, from 24.3% to 17.3% in 2009 (Fig. 47). The rate of decrease in physical inactivity has been faster in the state than in the nation.
The 2009 West Virginia YRBSS survey also provided the following information on physical activity among the state’s high school students: ● Over two‐thirds (67.4%) of high school students did not attend physical education classes in an average week, 75.0% of girls and 60.5% of boys. ● Nearly one‐third (31.5%) of students watched television for three or more hours per day on an average school day, 30.9% of girls and 31.9% of boys. ● One‐fourth of all students (24.1%) used computers for non‐school‐related purposes such as playing video or computer games on an average school day. Boys were more likely (26.9%) to report computer use than girls (21.2%).
15 Doing any kind of physical activity that increased their heart rate and made them breathe hard some of the time during the seven days before the survey. The CDC recommends that children and adolescents should do 60 minutes (one hour) or more of physical activity every day (19). 16 Did not participate in physical activity on any day during the seven days before the survey
44
52.6
35.1
41.8
48.3
35
Total Boys Girls0
10
20
30
40
50
60
Perc
enta
ge
West Virginia United States
*Doing any kind of physical activity that increased their heart rate and made them breathe hardsome of the time during the 7 days before the surveySource: Youth Risk Behavior Surveillance System
Fig. 46. Prevalence (%) of High School Students Who WerePhysically Active at Least 60 Minutes/Day on 5 or More Days*
West Virginia and United States, 2009
25 24.923.1
24.3
16.8 17.3
2005 2007 20090
5
10
15
20
25
30
Perc
enta
geWest Virginia United States
*Not doing any kind of physical activity that increased their heart rate and made them breathe hardduring the 7 days before the surveySource: Youth Risk Behavior Surveillance System
Fig. 47. Prevalence (%) of Physical Inactivity*Among High School Students
West Virginia and United States, 2005-2009

28
References
1. American Heritage Dictionary. Second College Edition. Boston: Houghton Mifflin Company, 1985. 2. World Health Organization. Obesity and overweight. Fact Sheet No. 311. Updated March 2011. Online: http://www.who.int/mediacentre/factsheets/fs311/en/index.html. 3. Ogden CL, Carroll MD, McDowell MA, and Flegal KM. Obesity among adults in the United States—No statistically significant change since 2003‐2004. NCHS Data Brief No. 1. National Center for Health Statistics, Centers for Disease Control and Prevention, 2007. 4. United Health Foundation, the American Public Health Association, and Partnership for Prevention. The future costs of obesity: National and state estimates of the impact of obesity on direct health care expenses. Online: www.americashealthrankings/2009/spotlight.aspx. 5. Thoenen EG and Wright JG. Obesity: Facts, Figures, Guidelines. Office of Epidemiology and Health Promotion, Bureau for Public Health, West Virginia Department of Health and Human Resources. Charleston, WV: 2002. 6. Flegal KM, Graubard BI, Williamson DF, and Gail MH. Cause‐specific excess deaths associated with underweight, overweight, and obesity. JAMA 2007;298(17):2028‐2037. 7. Cawley J and Meyerhoefer C. The medical care costs of obesity: An instrumental variables approach. NBER Working Paper No. 16467. National Bureau of Economic Research, 2010. 8. Finkelstein EA, Trogdon JG, Cohen JW, and Dietz W. Annual medical spending attributable to obesity: Payer‐ and service‐specific estimates. Health Aff 2009;28(5):w822‐w831. 9. Narayan KMV, Boyle JP, Thompson TJ, et al. Lifetime risk for diabetes mellitus in the United States. JAMA 2003;290(14):1884‐1890. 10. Flaherman V and Rutherford GW. A meta‐analysis of the effect of high weight on asthma. Arch Dis Child 2006;91(4):334‐339. 11. Bibbins‐Domingo K, Coxson P, Pletcher MJ, et al. Adolescent overweight and future adult coronary heart disease. N Engl J Med 2007;357(23):2371‐2379. 12. Bowman SA, Gortmaker SL, Ebbeling CB, et al. Effects of fast‐food consumption on energy intake and diet quality among children in a national household survey. Pediatrics 2004;113(1):112‐118. 13. Childhood obesity: Costs, treatment patterns, disparities in care, and prevalent medical conditions. Thomson Medstat Research Brief, 2006. Online: http://www.medsat.com/pdfs/childhood_obesity.pdf. 14. Trasande L, Liu Y, Fryer G, and Weitzman M. Effects of childhood obesity on hospital care and costs, 1999‐2005. Health Aff 2009;28(4):w751‐w760. 15. Ogden CL, Flegal KM, Carroll MD, et al. Prevalence and trends in overweight among US children and adolescents, 1999‐2000. JAMA 2002;288(14):1728‐1732. 16. Ogden CL, Carroll MD, Curtin LR, Lamb MM, and Flegal KM. Prevalence of high body mass index in US children and adolescents, 2007‐2008. JAMA 2010;303(3):242‐249. 17. United Health Foundation. Prevalence of obesity: 2018. America’s Health Rankings. Online: http://www.americashealthrankings.org/2009/Obesity/PPO.aspx. 18. United Health Foundation. The American profile: Weight gained over the last 20 years. America’s Health Rankings. Online: http://www.americashealthrankings.org/spotlight.aspx. 19. U.S. Department of Health and Human Services. Centers for Disease Control and Prevention. Physical Activity Guidelines for Americans. Online: http://www.health.gov/paguidelines/factsheetprof.aspx. 20. Heinig MJ, Ishii KD, and Banuelos J. Breastfeeding: The First Defense Against Obesity. California WIC Association and the UC Davis Human Lactation Center. Sacramento, CA: 2006. 21. Gillman MW, Rifas‐Shiman SL, Camargo CA, et al. Risk of overweight among adolescents who were breastfed as infants. JAMA 2001;285(19):2461‐2467.

29
22. Arenz S, Ruckerl R., Koletzko B, and von Kries R. Breast‐feeding and childhood obesity – a systematic review. Int J Obesity 2004;28:1247‐1256. 23. American Academy of Pediatricians. Press release: AAP releases revised breastfeeding recommendations, 2005. Online: http://www.aap.org/advocacy/releases/feb05breastfeeding.htm.

30
Appendix A: Links to the Data Sources
Several data sources were used in the preparation of this report: the Behavioral Risk Factor Surveillance System (BRFSS), the Youth Risk Behavior Surveillance System (YRBSS), the Pediatric Nutrition Surveillance System (PedNSS), the National Immunization Survey (NIS), the National Survey of Children’s Health (NSCH), and West Virginia Healthy Lifestyles Act Year One and Year Two Evaluations. The links to these sources are listed below. BRFSS: http://www.cdc.gov/brfss YRBSS: http://apps.nccd.cdc.gov/yrbss PedNSS: http://www.cdc.gov/pednss
NIS: http://www.cdc.gov/nchs/nis.htm
NSCH: http://www.cdc.gov/nchs/slaits/nsch.htm
Healthy Lifestyles Act Evaluations: http://www.hsc.wvu.edu/som/hrc/ECOCWV/WVH2816.aspx

31
Appendix B Prevalence (%) of Overweight and Obesity among Adults by State/Territory
United States BRFSS, 2009 State/Territory Neither Overweight nor
Obese (BMI <25)
Overweight BMI 25.0‐29.9
Obese BMI 30.0 or greater
Nationwide States, DC, and Terr.
35.9
36.2
27.2
Nationwide States, DC
36.0
36.2
26.9
Alabama Alaska Arizona Arkansas California Colorado Connecticut Delaware District of Columbia Florida Georgia Guam Hawaii Idaho Illinois Indiana Iowa Kansas Kentucky Louisiana Maine Maryland Massachusetts Michigan Minnesota Mississippi Missouri Montana Nebraska Nevada New Hampshire New Jersey New Mexico New York North Carolina North Dakota Ohio Oklahoma Oregon Pennsylvania Puerto Rico Rhode Island South Carolina South Dakota Tennessee Texas Utah Vermont
31.8 36.7 35.8 33.4 38.7 44.3 41.0 36.3 48.2 36.6 34.7 38.9 42.2 38.7 35.5 34.8 32.8 35.4 32.9 32.4 35.8 37.1 42.5 34.4 36.8 29.7 34.4 37.9 35.2 37.0 37.2 38.1 38.2 39.9 34.6 33.8 33.3 32.6 39.3 36.0 34.8 38.4 34.2 32.9 31.0 33.2 42.0 41.8
36.6 37.9 38.3 35.1 35.8 36.7 38.0 36.1 31.6 36.9 37.6 34.4 34.9 36.2 37.1 35.2 38.7 35.8 34.7 33.7 37.8 36.1 35.7 35.3 37.9 34.9 35.0 38.4 36.8 36.6 36.5 38.0 36.2 35.6 35.3 37.8 37.0 35.4 37.0 36.0 37.7 36.7 35.8 36.9 36.1 37.3 34.0 34.8
31.6 25.4 25.9 31.5 25.5 19.0 21.0 27.6 20.1 26.5 27.7 26.8 22.9 25.1 27.4 30.0 28.5 28.8 32.4 33.9 26.4 26.8 21.8 30.3 25.4 35.4 30.6 23.7 28.1 26.4 26.3 23.9 25.6 24.6 30.1 28.4 29.8 32.0 23.6 28.1 27.5 24.9 30.1 30.3 32.9 29.5 24.0 23.4
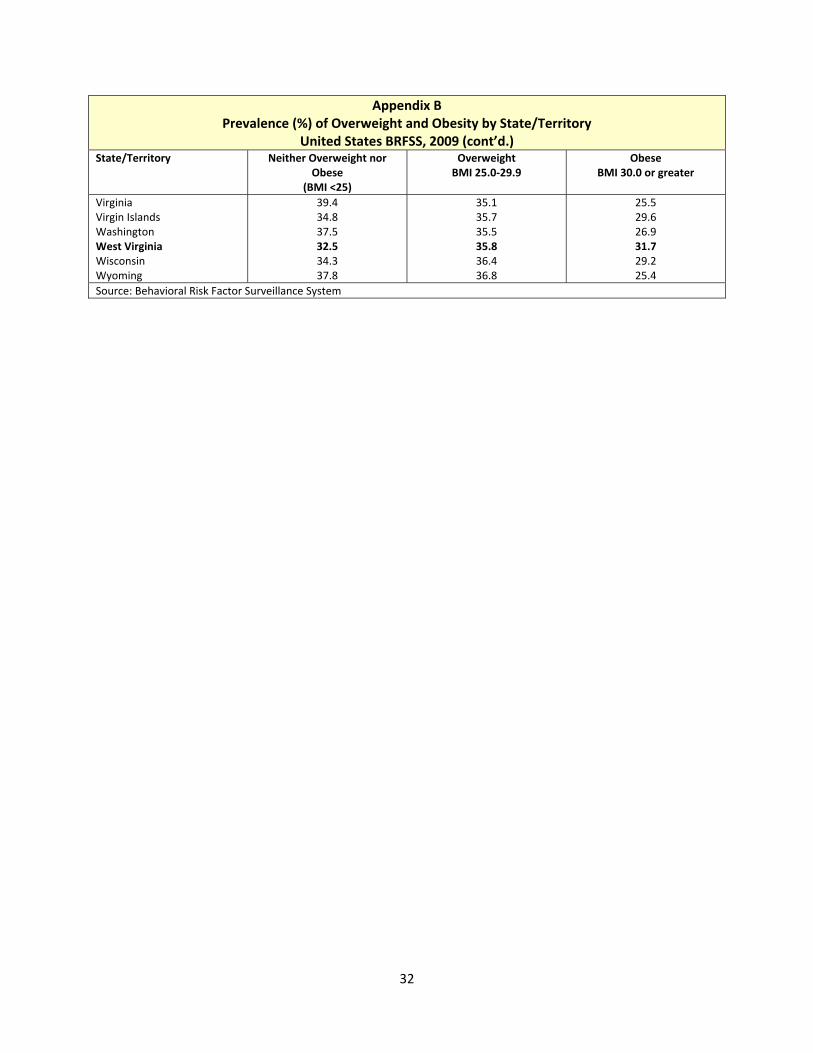
32
Appendix B Prevalence (%) of Overweight and Obesity by State/Territory
United States BRFSS, 2009 (cont’d.) State/Territory Neither Overweight nor
Obese (BMI <25)
Overweight BMI 25.0‐29.9
Obese BMI 30.0 or greater
Virginia Virgin Islands Washington West Virginia Wisconsin Wyoming
39.4 34.8 37.5 32.5 34.3 37.8
35.1 35.7 35.5 35.8 36.4 36.8
25.5 29.6 26.9 31.7 29.2 25.4
Source: Behavioral Risk Factor Surveillance System

33
Appendix C Prevalence (%) of Obesity (BMI 30+) among Adults by County/Region*
West Virginia BRFSS, 1999‐2003 and 2004‐2008 County/Region 1999‐2003 2004‐2008
Berkeley Brooke Cabell Fayette Hancock Harrison Jefferson Kanawha Logan McDowell Marion Marshall Mason Mercer Mingo Monongalia Ohio Putnam Raleigh Randolph Upshur Wayne Wood Wyoming Boone, Lincoln Greenbrier, Summers, Monroe Braxton, Nicholas, Webster Hardy, Pendleton, Pocahontas Calhoun, Clay, Gilmer, Roane Jackson, Wirt Doddridge, Lewis, Ritchie Pleasants, Tyler, Wetzel Barbour, Taylor Preston, Tucker Grant, Mineral Hampshire, Morgan WV Average
29.224.7 23.2 26.6 24.8 25.9 27.1 26.7 35.7 31.0 24.4 24.4 28.5 21.0 29.1 22.3 21.6 25.0 27.3 25.3 22.6 27.5 22.1 22.4
31.1 22.6 27.1 20.7 24.4 27.7 25.2 22.9 27.0 30.5 24.9 24.2
25.7
30.3 34.4 28.4 30.9 32.1 28.9 26.3 28.3 40.3 36.1 27.2 27.8 35.9 25.6 37.0 27.9 26.4 27.4 28.0 22.7 34.6 37.4 29.6 32.8
37.4 29.9 31.0 30.0 32.8 32.5 30.8 33.5 30.3 27.6 30.5 29.4
30.3 *In order to provide risk factor data on a substate level, county BRFSS data were combined into five‐year aggregates. For the prevalence data presented in this report, 24 counties had aggregated sample sizes large enough to yield individual prevalence calculations. Samples from the 31 counties that had sample sizes too small to stand alone were combined with samples from other less‐populated, contiguous counties into 12 groupings, or multicounty regions. A single prevalence was then calculated for each grouping; this rate was then used as the prevalence for each county within that grouping. Source: Behavioral Risk Factor Surveillance System

34
Appendix D Prevalence (%) of Weight Categories by Year
West Virginia BRFSS, 1989‐2008 (3‐Year Moving Averages) Year Underweight
BMI <18.5 Healthy WeightBMI 18.5‐24.9
OverweightBMI 25.0‐29.9
ObeseBMI 30+
1989 1990 1991 1992 1993 1994 1995 1996 1997 1998 1999 2000 2001 2002 2003 2004 2005 2006 2007 2008
3.5 3.5 3.2 3.2 3.0 2.9 2.9 2.7 2.8 2.6 2.5 2.2 2.3 2.2 2.1 1.9 1.7 1.6 1.5 1.9
50.449.2 46.7 44.4 43.2 42.6 42.0 41.1 40.5 38.7 37.8 36.2 35.6 35.0 34.7 34.3 32.8 31.6 30.5 30.0
32.632.7 34.2 35.6 36.6 36.9 36.7 36.6 35.3 35.7 35.7 37.3 36.8 36.0 35.5 35.1 35.7 36.2 36.9 36.8
13.514.6 15.9 16.8 17.2 17.7 18.4 19.6 21.4 23.0 23.9 24.3 25.3 26.8 27.6 28.6 29.8 30.6 31.1 31.3
Average Annual Change (%)
‐3.0 ‐2.7 +0.7 +4.6
Source: Behavioral Risk Factor Surveillance System

35
Appendix E Prevalence (%) of Morbid Obesity (BMI 40+) by Gender
West Virginia BRFSS, 1989‐2008 (3‐Year Moving Averages) Year Total Men Women1989 1990 1991 1992 1993 1994 1995 1996 1997 1998 1999 2000 2001 2002 2003 2004 2005 2006 2007 2008
0.81.2 1.3 1.2 1.4 1.6 1.9 1.8 2.3 2.6 2.9 2.8 3.0 3.4 3.6 3.9 4.1 4.4 4.6 4.9
0.50.7 0.8 0.8 1.0 1.1 1.3 1.2 1.8 2.0 2.2 2.1 2.5 3.0 2.9 3.1 3.1 3.5 3.4 3.9
1.11.6 1.7 1.6 1.7 2.1 2.5 2.4 2.8 3.1 3.4 3.5 3.5 3.8 4.2 4.6 5.2 5.2 5.7 5.8
Average Annual Change (%) +10.5 +12.8
+9.6
Source: Behavioral Risk Factor Surveillance System

36
Appendix F Prevalence (%) of Obesity* among Low‐Income** Children Ages 2 through 4
By County West Virginia, 2000 and 2009
County 2000 2009 County 2000 2009Barbour Berkeley Boone Braxton Brooke Cabell Calhoun Clay Doddridge Fayette Gilmer Grant Greenbrier Hampshire Hancock Hardy Harrison Jackson Jefferson Kanawha Lewis Lincoln Logan McDowell Marion Marshall Mason Mercer Mineral Mingo
7.5 8.6 12.3 11.2 10.8
11.0 11.8 12.9 *** 13.1
10.0 7.0 9.1 11.9 11.5
12.4 13.6 12.9 12.3 9.6
10.5 6.3 16.7 15.1 10.3
5.2 8.6 11.0 12.6 17.9
15.012.0 14.7 20.6 17.9
15.1 18.6 14.7 *** 10.8
*** 10.2 15.3 7.7 9.4
16.2 15.5 12.9 12.9 13.4
15.6 10.3 18.4 13.3 5.2
15.2 22.0 14.0 12.1 19.9
MonongaliaMonroe Morgan Nicholas Ohio Pendleton Pleasants Pocahontas Preston Putnam Raleigh Randolph Ritchie Roane Summers Taylor Tucker Tyler Upshur Wayne Webster Wetzel Wirt Wood Wyoming WV Total
14.2 6.7 5.4 13.2 14.4
12.0 10.0 12.0 9.2 7.1
11.8 15.6 12.7 12.6 10.4
6.7 *** N/A 8.8 10.9
14.1 9.3 *** 13.0 16.0
11.5
12.312.0 9.7 14.9 15.9
*** *** *** 6.7 9.7
12.1 14.4 10.6 20.3 12.0
8.1 16.0 N/A 11.1 10.2
10.2 15.8 *** 12.6 20.2
13.4
*Equal to or greater than 95th percentile BMI‐for‐age based on the 2000 CDC growth charts **As defined by WIC participation ***Not calculated if < 100 records are available Source: Pediatric Nutrition Surveillance System

37
Appendix G Prevalence (%) of Ever Breastfed, Breastfed at 6 Months, and Breastfed at 12 Months by State
Infants Born in 2007 State Ever Breastfed Breastfed at 6 Months Breastfed at 12 MonthsU.S. Average 75.0 43.0 22.4Alabama Alaska Arizona Arkansas California Colorado Connecticut Delaware District of Columbia Florida Georgia Hawaii Idaho Illinois Indiana Iowa Kansas Kentucky Louisiana Maine Maryland Massachusetts Michigan Minnesota Mississippi Missouri Montana Nebraska Nevada New Hampshire New Jersey New Mexico New York North Carolina North Dakota Ohio Oklahoma Oregon Pennsylvania Rhode Island South Carolina South Dakota Tennessee Texas Utah Vermont Virginia
64.683.3 78.8 61.3 86.6 88.7 71.0 71.5 65.4 73.4 64.8 87.5 88.9 70.2 70.5 74.4 79.6 58.7 56.6 75.2 73.4 77.6 70.1 81.9 52.5 72.6 88.5 75.5 82.3 78.6 72.1 82.5 81.4 73.5 73.2 64.8 65.0 86.5 63.8 70.8 63.8 76.9 65.4 75.8 89.8 86.2 77.3
30.057.1 49.6 27.5 53.8 57.7 49.3 43.2 44.1 38.0 33.5 60.4 53.2 36.0 37.8 42.3 47.4 29.6 20.2 48.2 45.5 50.1 38.6 51.7 22.5 38.2 55.4 47.0 43.2 50.0 42.3 49.0 47.4 35.9 41.2 37.5 27.4 62.2 36.2 45.1 29.6 48.5 29.8 43.6 58.3 58.4 42.8
15.932.7 25.3 12.6 31.4 29.3 21.7 20.3 23.7 17.3 17.9 33.1 30.8 16.4 16.9 19.2 20.2 13.1 9.8 27.6 17.9 23.3 22.9 26.6 8.0 19.4 34.8 23.9 20.8 25.9 19.8 24.8 24.9 19.4 20.7 20.3 12.2 39.6 18.5 22.7 12.0 22.7 17.2 21.8 35.4 39.7 23.9

38
Appendix G
Prevalence (%) of Ever Breastfed, Breastfed at 6 Months, and Breastfed at 12 Months by State Infants Born in 2007 (Cont’d.)
State Ever Breastfed Breastfed at 6 Months Breastfed at 12 MonthsWashington West Virginia Wisconsin Wyoming
87.953.0 76.3 78.2
59.925.9 48.1 52.5
33.412.5 23.5 29.0
Source: CDC National Immunization Survey. Provisional 2007 data.

39
Appendix H Prevalence (%) of Obesity* among High School Students by Selected States and Gender
United States YRBSS, 2009 State Total Male FemaleNational Median 12.3 15.2 8.6Alabama Alaska Arizona Arkansas Colorado Connecticut Delaware Florida Georgia Hawaii Idaho Illinois Indiana Kansas Kentucky Louisiana Maine Maryland Massachusetts Michigan Mississippi Missouri Montana Nevada New Hampshire New Jersey New Mexico New York North Carolina North Dakota Oklahoma Pennsylvania Rhode Island South Carolina South Dakota Tennessee Texas Utah Vermont West Virginia Wisconsin Wyoming
13.511.8 13.1 14.4 7.1 10.4 13.7 10.3 12.4 14.5 8.8 11.9 12.8 12.4 17.6 14.7 12.5 12.2 10.9 11.9 18.3 14.4 10.4 11.0 12.4 10.3 13.5 11.0 13.4 11.0 14.1 11.8 10.4 16.7 9.6 15.8 13.6 6.4 12.2 14.2 9.3 9.8
17.013.5 16.9 18.5 8.6 13.8 15.3 13.2 14.3 17.0 12.3 14.7 15.7 15.0 20.5 18.1 16.7 15.5 14.3 15.7 20.0 18.3 13.1 15.1 16.4 13.8 18.3 14.6 16.8 14.6 14.7 13.5 12.4 18.9 13.1 18.6 15.9 8.3 16.1 20.3 11.7 11.1
9.910.0 8.9 10.1 5.4 6.7 11.8 7.3 10.5 11.7 4.9 9.0 9.7 9.5 14.4 11.3 8.0 8.8 7.2 8.0 16.6 10.5 7.5 6.7 7.7 6.7 8.5 7.4 10.1 7.2 13.6 10.1 8.2 14.4 6.0 13.0 11.0 4.4 8.1 7.7 6.8 8.4
*Students who were equal to or greater than 95th percentile for BMI by age and sex based on 2000 CDC growth charts Source: Youth Risk Behavior Surveillance System