o vi, - international council for the exploration of the sea doccuments/1980/c/1980_c10.pdfduring...
TRANSCRIPT
,ThiG paper not to be citedwithout prior reference tothe authors
C.M.1980!C:10Hydrography Committee
•
Some results on the energy transfer from
the wind to the water during BOSEX 77
by
T. G. Jensen and G. Kullenberg
Institute of Physical Oceanography, University of Copenhagen
Haraldsgade 6, 2200 Copenhagen N .• Denmark
Abstract
During BOSEX 77 a sharp drop of the temperature as well as considerable deepening of the mixed. layer was observed during the passageof a storm. These observations together with current meter data andwind data are used to study the efficiency of the mechanical mixing induced by the wind relative to the totally available wind energy at about10 m above the sea surface.
Problem statement
Vertical mixing in the sea is generally very weak due to the dominating stable stratification (see e. g. Kullenberg 1974). For the surfacelayer the mechanical energy input from the wind, direct1y or via thewaves, is often crucial for generating vertical mixing during the warmseasonD. It has been established that only a small fraction of the energyinput from the wind is consumed for vertical mixing (c. g. Turner 19S9:Denman and Miyake 1973; Kullenberg 1976). This is also in agreementwith laboratory experiments ( e. g. Turner 1973). It 5eems reasonable toexpect that the strongest wind action occurs during storms and passagesof meteorological fronts. The purpose of this note in to investigate theefficiency of wind-generated mixing during the passage of a storm usingobservations obtained during the Baltic Open Sea Experiment in September 1977, referred to as BOSEX 77. The vertical mixing during weakwind conditions was also investigated during BOSEX 77 by means of dyediffusion experiments. Thus conditions under fairly extreme situationscan be compared.
Theoretical background
In the mixed layer below the wave zone horizontal homogeneity ofthe fluctuating fields may be assumed, implying that the mechanicalenergy equation can be writtcn in the form
o EI2
I EI2 ~ bV + ~
>-t ( ) +...Q.. ( w I ( ..E.. + -2 )) + W I V I • g + ev 2 OZ Po OZ Po
o ( 1)
Here ±EI2
is the fluctuating kinetic energy per unH mass, w ' , p' andthc pI fluctuating parts of the vertical velocity, presnurc and density,respectively, Po is the mean dennity,v - is the horizontal vclocity vectorwith thc fluctuating part VI, g is acceleration of gravity and e is the

2.
rate of encrgy dissipation per unit mass. Absorption of solar radiationhas becn ncglccted.
Thc sccond term is the kinetic energy flux caused by vertical divergence, the third term gives thc production of turbulent cncrgy by interactions between the mean shear and the fluctuating velocity fields, andthe fourth term gives the change of potential encrgy. Using thc K-theoryapproximation this term may be written in the form
o'w'g •po
= ~ K ~ = K N2
Po dz(la)
where N is the Brunt-Vaisäla frequency.Similarly the production term may be written in thc form
where Km is the turbulent momcntum transfer coefficient, and ur, Uare the fluctuating and mcan velocities, respectively, in the x-dircction,assuming mean motion in this direction only.
Thc time required for redistribution of turbulent kinctic energy inthc mixed layer is sma11 comparcd to thc time over which the energyinput from thc wind changes, implying that a steady state may be considcred.
Niiler (1975) suggestcd that away from boundarics a balance existbetween thc divcrgcnce, thc buoyancy and the dissipation term. However,at the base of the mixed layer Some production of turbulent energy willtake place duc to thc shcar there. A balance which in often assumed isbetween the production, buoyancy and dissipation tenus, for instanceanalyoed by Townsend (1958) in the atmospheric boundary layer.
Deepening of the mixed layer in the stably Gtratified case occursthrough entrainment of fluid from the lowcr layer into the mixed layerdue to well developcd turbulence in the upper layer (see e. g. Phillips1977, Turner 1973). The entrainment process appcara to bc dominatingduring high (storm) wind speedo. By means of a simple energy argument (e.g. Turner 1973) one finds that
•
•
dUu·w'-- =dz
2K • (dU)
m dz(2b)
u = c . ue ;>[
Ri _1;>[
(3)
where U c and u are the entrainment and friction velocities, reopectively, Ri in ov<frall Richardson number and c a constant. Kato andPhillips () 9S9) found c ~ 2.5 [rom laboratory experiments. Thc rate ofdeepening of the mixed layer varies with time, in thc early stage beingproportional to t 1/2 , after about one inertial period decreasing to t 1/3 •These regimes have been found theoretically and to some extend confirm-·cd experimentally (Kraus and Turner 1967, Pollard, Rhines and Thompson1973, de Scoeke and Rhines 1976, Kundu 1980). MOlJt models, however,has as initial conditions a fluid at rest with a constant olope densityprofile and a wcll-defined onset time of the wind stress or stirring,which also is treated as constant. In the sea these conditions are nevermet, and mostly the initial conditions are not even known.
It is clearly of interest to analyse individual otorm cases in orderto obtain more Held information on the cntrainment process and theefficiency of otrong winds to generate vertical mixing in stably stratifiedconditiono. Here we study the change of potential enerey relative to

3 .
the mechanical energy available in the wind field at about 10m abovethe sea surface. The rate of work per unit area by the wind stress atthe 10m level is written in the form
The energy input per unit time and area from the wind can be expressed as
H.ere W 10 is tl~e wind speed, 'Ta the wind stre 55, Cd the drag coeffiClent Pa the density of the air, k the windfactor, and k 1 a numericalconstant.
The potential energy per unit area of the water column is defined as
•o
E pot = g f ( P - P ) (z + D)dz
-D
(S)
•
where p is the mean reference density, and D the water depth. Thevalue of E pot is negative in stable conditions and zero for the totallymixed water column. The change of potential energy and the work bythe wind over aperiod of time T are found by integration of (6) and(4), respectively, and the ratio Rl becomes
~ _~o~(t1) - P(t1)] (z+D)dz -~ JO~(t2) - p(t2)] (z+D)dz _
R1 =-._-, -- '~':a l~-C-d-W~ () -~t .-..-.--.----------..--.- -
1
(7)

4.
Thc aim in to determine this ratio from the observationn.The local flux Richardnon number Rf in defined as the ratio
between the potential energy change generated by thc mechanicalmixing and the total turbulent energy available, i. c.
Rf 2 =K (dU)
m dz
KK' Ri
m(8)
•
•
where E T is the total turbulent cnergy avaiable and Ri in the gradiantRichardson number. This formulation assumes that the only productionof turbulence occurs through the interactions bctween thc mean shearand the fluctuating veloeitie s. In the pre sent case we mayas sume thatthe cnergy input from thc wind E is the source of turbulent energy sothat E =ET . Taking the mean of t::. E pot and E t ovcr some time period and assuming that the wind factor R is constant over this periodwe find
where Rfc is the critical flux Richardson numbcr, i. d. the maximumvalue of Ri.
Data and re sults
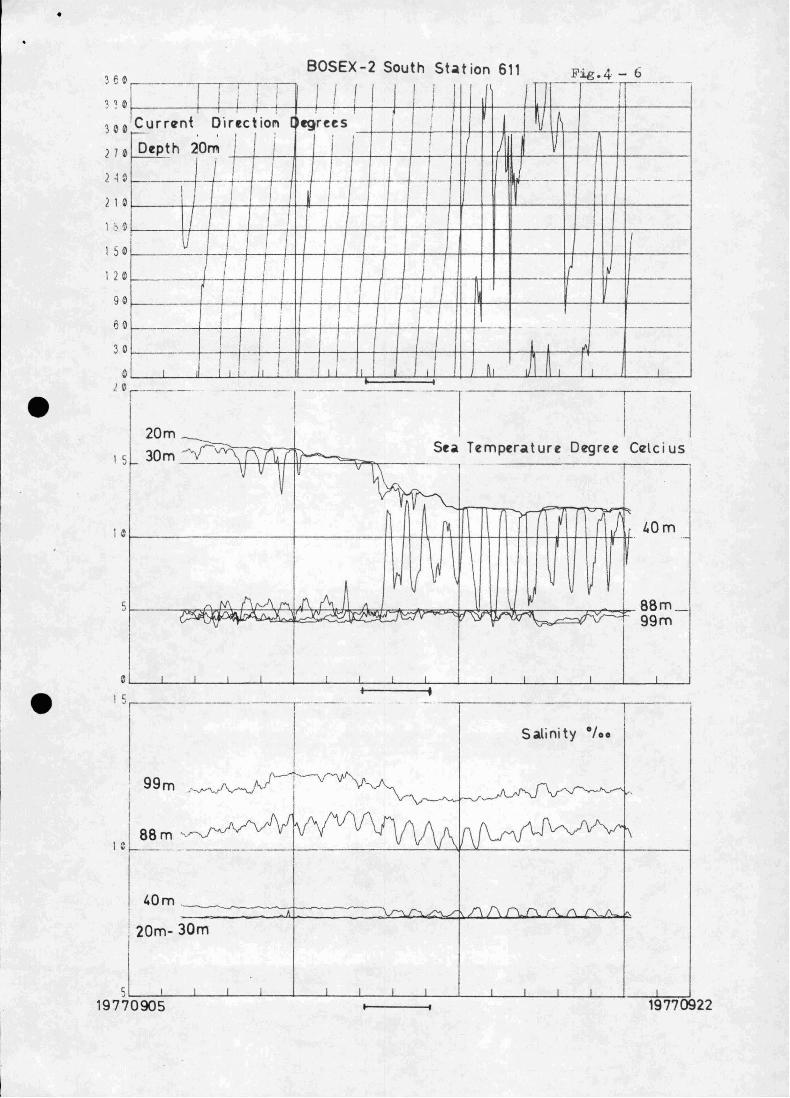
During BOSEX 77 three Danish current meter stations wereoperated over thc period 7 to 19 September (Table 1) which will beused for the present study. The time period analysed here is from2 a. m. on 12 September to 2 a. m. on 14 September during whicha storm passed thc area (Table 2). The current speeds at 20, 30 and40 m nominal dcpths of station 611 are shown in Figs. 1 - 3, with adirection re cord in Fig. 4. The recording interval was 10 minutes.
The temperature re cord (Fig. 5) shows a relatively rapid decrease of temperature in the upper layer and a rise in thc intermediate layer, demonstrating the combined cffect of atmosphcric_cooling,c~trainment and diffusion in the water. Realtime temperature wa:: u::;cdin the calculations. However, horizontal advection changed thc salinityHeld with the inertial period (Fig. S) especially in the lower layer. Forthis reason the mean salinity during the period was uscd in the calculations. The change in potential energy was calculated over differentperiods T, ranging from 8 to 48 hours. Thc wind observations fromR!V Alkor were used (Table 2) and, separately, the wind speeds observed by R!V Poscidon. These were considerably higher than thosefrom R!V Alkor, implying an increase of E 10 by a factor of 2.5. Thevalues of the ratio R 1 based on the Alkor wind data are shown inFig. 7 for different integration periods , and using Pa = 1.25 kg . m- 3
and Cd = (0.75 + 0.067 W10)' Using wind data from Poseidon the valuesof R 1 are reduced by a factor of 2. 5.

•
•
5.
Discussion of results
The absolute values of R 1 (Fig. 7) should be taken with muchprecaution. Beside s the uncertainty regarding the wind speed, discussed above, errors in defining the layers may causc an error inthc calculated energy change, espccially for small integration periodsT. Howcvcr, the variation of R 1 with time (per iod of integration T)is similar at the 3 stations and should bc real. The temperature records show a maximum rate of decrease of tempcrature in the upperlayer for thc period 8 - 12 hours ofter thc start of thc storm. Considering that the inertial pcriod is about 14 hours this might indicatethe time when the ratc of entrainmcnt decreascs as prcdicted by various thcorctical models, c.g. dc Szockc and Rhincs (1976).
The mcthod of using progressivcly longer pcriods of integration(or averaging) will tend to dccrcase thc fluctuations of R 1. Alternatively a fixcd period may be used (Fig.8), where 12 hours integration timewas uscd throughout. Thc maximum again comc s out for all threestations at approximately thc same time as beforc. 3
Thc average values are 2.5, 3.3 and 4.5, all timcs 10- , forstations 610,611,612, respcctivcly, whercas the othcr method gave thcmean values, 2.2, 3.4 and 3.2 . 10- 3 , rcspectively. It is noticedthat thc long time values, 3S to 48 hours, which are the most reliable, show a relatively small scattcr (Figs. 7 and 8).
Kundu (1980) found a variation with time of R 1 ' the maximumvaluc being 2.0 . 10-3 , for larger times decrcasing to a constantvalue of 1.25 . 10-3 . This yields a ratio of ma.~imum to mean of 1.6In the prcscnt case this ratio is 1.4 - 1,8 for the first method ofintcgration and 1. 7 - 2.4 for thc second. -3
. Other rcported values of R1 are in the range (0.8 - 2.9)· 10 ,based On laboratory experiments as weIl as Held studie s (Kraus andTurner 1967, Kato and Phillips 1969 j Denrrtan and Miyake 1973,Kullenberg 1976).
The present R 1 value s show a similar time behaviour as foundby Kundu (1980). Thc response of the sea seems in the present caseto be somewhat slower than in the model caSe studicd by Kundu. Thiscould, however, be duc to thc difficulty in dcfining thc onset time ofthc stonn, and could also be rclated to thc differcncc in initial conditions bctwecn model and rcality.
Finally the valuc of the critical flux Richardson numbcr bascdon the relation Rfc = Ri/k is found to be in the range 0.09 - O. 18 ,using 1c=2.5· 10-2 and thc range of mean values of Rl . This rangefor Rfc agrces quite weIl with what has bcen repo:::ted in the literature(c.g. Turner 1973, Bo Pcdcrsen 1980).
Acknowledgements
Financial support from the Danish Envi:::onmcntal ProtectionAgency through the use of R/V Martin Knudsen is acknowlcdgcd asweIl as good cooperation with thc crew of thc ship.

----------1
6.
References
Denr.'1an, K. L. and M. Miyake, 1973. Upper layer modification atocean station Papa: Observations and simulations. J. Phys.Oceanog., 3(2), p. 185-196.
Kato, H. and O. M. Phillips, 1969. On the penetration of a turbulentlayer into stratified fluid. J. Fluid Mech., 37, p. 643-655.
Kraus, E. B. and J.5. Turner, 1967. A one-dimensional model afthe seasonal thermoc1ine, Part H. Tellus 19, p. 98-105.
Krauss, W., 1978. Inertial waves and mixing in the thermoc1ine(BOSEX - Results). Proceedings at the XI Conference ofBaltic Oceanographers, paper No. 56, p.709-728.
•Kullenberg, G.E.B., 1974. An experimental and theoretical investi
gation of the turbulent diffusion in the upper layer of the sea.Rep. 25, Inst. Phys. Oceanog. University of Copenhagen, 272 pp .
Kullenberg, G.E.B., 1976. On vertical mixing and the energy transferfrom the wind to the water. Tellus. 28(2), p. 159-165.
Kundu, P. K., 1980. A numerical investigation of Mixed-LayerDynamies. J. Phys. Oceanog., 10(2), p. 220-236.
Niiler, P.P., 1975. Deepening of the wind-mixed layer. J.Mar.Res.33, p. 405-422.
Pedersen, Flemming Bo, 1980. A Monograph on turbulent entrainmentand friction in two-layer stratified flow. Sero Paper 25, ISVA,Technical University of Denmark, 2800 Lyngby.
Phillips, O. M., 1977, The dynamics of the upper ocean, 2nd ed.Cambridge University Press, 336 pp.
stratified atmos-
Pollard, R.T., P.B. Rhines and R.O.R.Y. Thompson, 1973, Thedeepening of the wind-mixed layer. Geophy::;. Fluid Dyn. 3, p. 381-404.
x)
Townsend, A.A., 1958. Turbulent flow in a stablyphere. J.Fluid Mech. 3(4), p. 361-372.•
Turner, J. 5., 1969. A note on wind m.:bdng at the seasonal thermocline. Deep-Sea Res. 16, supp!., p.297-300.
Turner, J. S., 1973. Buoyancy effects in fluids. Cambridge UniversityPress, 366 pp.
x)dc Szoeke, R.A. and P.B. Rhines, 1976. Asymptotic regimes inmixed-layer decpcning. J.Mar.Res., 34(1), p. 111-116.

Table 1 Aanderaa current meter measurements during BaSEX 77.
78610
,I ,!i , ; Mean Depths ; I
~hation no.) Latitude! Longitude I of Current I Depth 1
1' Period. 01' opera- :
i ! i meters (m) I (m) hon .--------t-----.------~.-- ...,....-....---.....-..~.....-~ .......-....._- ......_..."._--.__.....r---_.._-t--..- ..._.~_ .......~,._---- -t,;
II 77C906/1 0.1 Oam- II 770920/ 2.00p.m. ~
I!
...-.-----... ..._...._...,....... ..._._...... _..._ .......__.....__._._,...._.._ ._......._.."...,_".._ ...._._.........__...".._..__~..L_....__.. _.."..__._._ .__..._ ......... ...._...•
611
612
i
i1.1 Op.m. - !j 17, 27, 37, 109 i 770906/
! 85 96 ; 770920/ 2.00p.m.1
; ,~
i!I
II,I 22, 33, 106 770906/3.40p.m.-\i 12,! 80, 92 770919/12.00 ;
Table 2 Wind conditions during BasEX 77* The windspeed was given in Beaufort scale** From Krauss 1978.
Time R/V "ALKOR" *direction m/s
.. ,,- ,._ , - ,,~,..,.'_ ,' - .. , ,..-..-' -'"
R/V " PO SEIIDN" *~
......._-_:!'(~--_._-_._ ......770912/ 4.00 am smv 6.5
8.00 am S~V 12.59.00 am
12.00 1v 194.00p.m. NNlV 15.5
• 6."Op.m •8.00p.m. N 19
7709 13/ 0.00 NW 12.54.00 am Nlrl 12.58.~0 am Ntv 14
12.00 Ntv 144.00p.m. mv 148.00p.m. Nlv 12·5
I 770914/ 0.00 N~v 12.5!II
1126302824
20
16
15

BOSEX - 2 South Station 611
Current Speed ern/sec. FiC.l - 3
'---I
; 0 .---+--------f'I,.-------..;- ------ - ---J !601-- -+- t-t- -+-_~Pth: 20. rn.~
i I~ 01-----------~--_+_+_--r__--------1 IJ" I II-----++--++---+---t----tt-\:--::-+-----l i
~ ,,~---I-_+_JL..+iH_++_-tt+-AA---++_...,._+---!:...t___1f-+-j+_-------_+---
101------t-l:-------+--------+-I~i__!\i--+-____Pr_+---1
19770922
!--~II
I I
Depth: 40 m
Depth: 30 m
-----r---------.,----------,-----,
---------1- --I
I
f---------t---------t-- ---
•::160
50
40
Je
20
10
"•Hr--10
60
50
4 "
30
20
10
~
19770905
•
Fig.4 - 6
Salinity 0/00
BOSEX-2 South St.tion 611
II I-i
1 I I I I i11
...... --·--··r----··-- _.
I i f J ICurr~nt Dirrc t io~ [ rgrees r I 'li ~ II
t--- , ;1 I V
---
Drpth 20m )j
-._>---- --Y
- .- -- - ---
I iV
,
II r I~
i 11
~-
i ! if
I I- - - - - _. -
I I I JlI
I 1, L ! I I i I nl L I L I
~._-- --------1-- I I
I20m
30m ""'vv,"\ (\ {11 ( - Sr. Temprrature Degrrr Clllcius
- V V ~ IV
"~~--
~ ~"'). -r
~I ) J,,r L.Om,
~1/- .-
.I\A~ A
IN V~ \ I.JV V
r\ M t\rJ\,...... w 88m_(/-' '\.\Io'~" Y. vv -J.' 7' ""!f 'v:::;::] v '(7\: Y.XT '\r -----..1 v 99m-c.J"IJ 'l""
I I I 1 I I I I I I I I I
I
199m
15
"1 c"r-!--
88m1" _. --+ --"--*---"-- 1---__1
,"
1 H;
150
1 2"
90
3 ~ "
300
2 7 0
2H
2 1"

o : Stat ion 610 ; V : Station 612.
'l
V
)(
0 0
x 0 xx 0 0 0
)(: Station 611 ;
)(
o
l(
Inhgration time in hours.
Fig.7
o
o
x
v 0
0
0x
)(
x x Vx x
0
0
V
00
12 16 20 24 28 32 36 40 44 48 52Hours aHa onset of stormIntegration time 12 hours.
Fig. 8
4 8 12 16 20 24 28 32 36 40 44 48
-----------------------
7
6
5
t..
3
2
2
3
o
5
8
o
6
-2
-1
-3R I ·10
•
•