o corruption sa y no t
TRANSCRIPT

SAY NO TO C
ORRUPTION
F C C L
Company Information
Directors' Review
Auditor's Report to the Members
Review of Interim Financial Information
Condensed Interim Balance Sheet
Condensed Interim Profit and Loss Account (Un-Audited)
Condensed Interim Statement of Comprehensive Income (Un-Audited)
Condensed Interim Cash Flow Statement (Un-Audited)
Condensed Interim Statement of Changes in Equity (Un-Audited)
Notes to the Condensed Interim Financial Information (Un-Audited)
2
3
5
6
12
11
Contents1
AUJIAUJIAUJICEMENTCEMENTCEMENT
Half Yearly Report 2016-17
YMK
10
9
8

Half Yearly Report 2016-17
F C C L2
Company�Information
Board of Directors Lt Gen Khalid Nawaz Khan (Retd),HI(M),Sitara- -Esar
Chairman Board of Directors of FCCL
Lt Gen Sardar Mahmood Ali Khan
(Retd),HI(M)
Chief Executive / Managing Director
Mr. Qaiser Javed
Director
Dr. Nadeem Inayat
Director
Maj Gen Tahir Ashraf Khan (Retd),HI(M)
Director
Maj Gen Muhammad Farooq Iqbal (Retd),HI(M)
Director
Brig Raashid Wali Janjua (Retd),SI(M) Director
Brig Asmat Ullah Khan Niazi (Retd),SI(M) Executive Director (Plant)
Mr. Pervez Inam Independent Director
Mr. Jawaid Iqbal Independent Director
Company Secretary Brig Ch Zafar Iqbal (Retd)
Fauji Tower ,Block III, 68 Tipu Road, Chaklala, Rawalpindi
Tel: (051) 9280075
Fax: (051) 9280416
E-mail: [email protected]
Auditors M/s KPMG Taseer Hadi & Co,
Chartered Accountants
6th
Floor, State Life Building No. 5
Jinnah Avenue, Blue Area, P.O. Box 1323
Islamabad
Pakistan
Tel:051-282-3558
Fax: (051) 2822671
Chief Financial Officer
Mr. Omer Ashraf
Tel: (051) 5500157
E-mail: [email protected]
Legal Advisors
M/s ORR Dignam & Co, Advocates
3-A Street No 32,F-8/1 Islamabad
Tel:
(051-2260517-8
Fax: (051) 2260653
Shares Registrar
M/s Corplink (Pvt) Limited
Wings Arcade, 1-K, Commercial,
Model Town, Lahore
Tel: +092-042-35916714-19 & 35839182
Email: [email protected]@yahoo.com
Fax: +092-042-35869037
Factory
Near Village Jhang Bahtar, Tehsil Fateh Jang
District Attock
Tel: 0572 -538047-48 & 0572-
2538138
Fax: 0572-538025
Registered Office
Fauji Cement Company Limited
Fauji Tower, Block III,68 Tipu Road, Chaklala, Rawalpindi
Tel: 051-9280081-83, 051-5763321-24, 051-5500159,
Fax: 051E-mail: [email protected]
-9280416
E-mail: [email protected]
Marketing and Sales DepartmentIst Floor, Aslam Plaza, 60 AdamjeeRoad, Saddar, Rawalpindi-PakistanTel: (051) 5523836,Tel: (051) 5528960,Tel: (051) 5528963-64, Fax: (051) 5528965-66
K
Company Website http://[email protected]

F C C L3
Directors'�Review
1. The Board of Directors is pleased to present its review report along with the Condensed Interim Financial Information of the Company for the Half Year
st ended 31 December 2016.
2. Industry Overview.� Cement industry achieved a growth of 8.7% during six months of current financial year with volumetric sales of 19.81 Million Tons as compared to 18.22 Million Tons during the same period last year. Local sales volume of the industry during six months of current financial year registered a growth of 11% with volumetric sales of 16.89 Million Tons as compared to 15.21 Million Tons in same period last year. Whereas export sales registered a decline of 3.5% with volumetric sales of 2.91 Million Tons as compared to 3.02 Million Tons in same period of last year.
3. Company Overview. Overall sales volume of the Company increased by 5% during the six months of current financial year with volumetric sales of 1.45 Million Tons as compared to 1.38 million tons during the same period last year. Capacity Utilization achieved by the Company is 84% as compared to 80% in the same period last year. Local sales volume of the Company during six months of this financial year registered a growth of 13% with volumetric sales of 1.35 Million Tons as compared to 1.20 million tons in same period last year. Export sales registered a decline of 47% with volumetric sales of 0.096 Million Tons as compared to 0.18 Million Tons in same period of last year.
4. Comparison of Key Financial Results. Key Financial Result for the period stended 31 December 2016 with same period of last year are tabulated below:-
Half Yearly Report 2016-17
Six Month Particulars
2016-17
2015-16 Sales Revenue
10,187,143
9,950,378
Gross Profit
2,318,274
4,577,210
Profit Before tax
1,856,384
3,861,270
Net Profit after tax
1,302,952
2,776,711
Earnings Per Share(Basic)
0.94
2.09
Earnings Per Share(Diluted) 0.94 2.01
*Rs. in thousand except EPS
5. Business Performance.� The production statistics of the Company for the six st months ended 31 December 2016 as compared to same period last year are
as under:-
Particulars Six Months Six Months Change
2016-17
(Tons)
2015-16 (Tons)
Cement Production
1,433,774
1,371,106
4.57%
Cement Dispatches 1,448,690 1,377,805 5.14%

F C C L4
Directors'�ReviewHalf Yearly Report 2016-17
6.� Financial Performance
a. During the period under review, overall sales revenue of the Company increased by 2.38%. The increase is mainly attributable to increased dispatches.
b. Company achieved a gross profit rate of 23% for the period under review as compared to 46% achieved during same period last year. Sharp decline is due to procurement of costly clinker from other cement manufacturers as the production Line - II is still under Rehabilitation after the incident on
thMay 29 2016. Therefore, Net Profit ratio of the Company remained at 13% during the period under review as compared to 28% in the same period last year.
7.� Future outlook. Based on the growth in domestic sales, it is anticipated that ndthe demand of cement in the market will remain stable during 2 Half of current
Financial Year especially due to higher off take in summers. However, exports to Afghanistan will continue to remain under pressure.
�
8.� The main focus of the Company is on timely completion of Rehabilitation Works and start up of Line - II as soon as possible. It is expected to be fully operational
stin 1 quarter of FY 2017-18. Further, contracts for set-up of WHRPP on Line - I / Wartsila Power Plant have been executed and work is progressing satisfactorily.
9.� Acknowledgement.� Directors appreciate all stakeholders i.e. Company's Workers, Staff and Executives for their devotion and hard work.
RawalpindiDated 15 February 2017
Lt Gen Khalid Nawaz Khan (Retd), HI(M), Sitara-i-EsarChairman Board of Directors of FCCL
CK
0
200
400
600
800
1000
1200
1400
1600
CementProduction
CementDespatches
1,434
1,449
1,371
1,378
2016-17
2015-16
(Tones ‘000)

F C C L5
Auditor's��Report�to�the�MembersReview�of�Interim�Financial�Information Half Yearly Report 2016-17
Introduction
We have reviewed the accompanying condensed interim balance sheet of Fauji Cement Company Limited (“the Company”) as at 31 December 2016, and the related condensed interim profit and loss account, condensed interim statement of comprehensive income, condensed interim cash flow statement, condensed interim statement of changes in equity and notes to the accounts for the six months period then ended (the interim financial information). Management is responsible for the preparation and presentation of this interim financial information in accordance with approved accounting standards as applicable in Pakistan for interim financial reporting. Our responsibility is to express a conclusion on this interim financial information based on our review.
Scope of Review
We conducted our review in accordance with International Standard on Review Engagements 2410, "Review of Interim Financial Information Performed by the Independent Auditor of the Entity." A review of interim financial information consists of making inquiries, primarily of persons responsible for financial and accounting matters, and applying analytical and other review procedures. A review is substantially less in scope than an audit conducted in accordance with International Standards on Auditing and consequently does not enable us to obtain assurance that we would become aware of all significant matters that might be identified in an audit. Accordingly, we do not express an audit opinion.
Conclusion
Based on our review, nothing has come to our attention that causes us to believe that the accompanying interim financial information is not prepared, in all material respects, in accordance with approved accounting standards as applicable in Pakistan for Interim Financial Reporting.
Other matters
The figures for the three months period ended 31 December 2016, in the condensed interim profit and loss account and condensed interim statement of comprehensive income have not been reviewed and we do not express a conclusion on them.
IslamabadDate: 15 February 2017
KPMG Taseer Hadi & Co.�Chartered Accountants Engagement Partner: Riaz Pesnani

F C C LCondensed�Interim�Balance�Sheet�as�at�31�December��2016
Chief Executive
6
Half Yearly Report 2016-17
Un-Audited Audited
31 December 2016 30 June 2016
Note Rupees'000 Rupees'000
SHARE CAPITAL AND RESERVES
Share capital 4 13,798,150 13,798,150
Reserves
4,567,005
4,629,705
18,365,155
18,427,855
NON -
CURRENT LIABILITIES
Long term financing
5
1,382,079
1,486,178
Deferred liabilities
4,302,748
4,482,438
5,684,827
5,968,616
CURRENT LIABILITIES
Trade and other payables
1,953,618
1,968,031
Markup accrued
61,498
76,265
Short term borrowings
6
788,825
78,037
Current portion of long term financing
5
1,420,899
2,525,955
Provision for taxation-net
410,785
312,893
4,635,625
4,961,181
28,685,607
29,357,652
CONTINGENCIES AND COMMITMENTS
7
The annexed notes from 1 to 16 form an integral part of this condensed interim financial information.

Director
7F C C L
Condensed�Interim�Balance�Sheet�as�at�31�December��2016
Half Yearly Report 2016-17
Un-Audited Audited
31 December 2016 30 June 2016
Note Rupees'000 Rupees'000
NON - CURRENT ASSETS
Property, plant and equipment 8 21,573,448 21,701,250
Long term deposits and prepayments 118,479 156,733
21,691,927
21,857,983
CURRENT ASSETS
Stores, spares and loose tools
2,226,928
2,177,367
Stock in trade
1,894,528
540,588
Trade debts -
considered good
1,207,638
569,101
Advances
141,216
218,947
Trade deposits, short term prepayments and
balance with statutory authority
222,079
16,593
Interest accrued
326
4,447
Other receivables
9
433,630
982,562
Short term investments
405,811
1,324,485
Cash and bank balances
10
461,524
1,665,579
6,993,680
7,499,669
28,685,607
29,357,652

F C C L8
DirectorChief Executive
Condensed�Interim�Profit�and�Loss�Account�(Un-Audited)For�the�Six�Months�Period�Ended�31�December��2016 Half Yearly Report 2016-17
The annexed notes from 1 to 16 form an integral part of this condensed interim financial information.
Three Months Ended
Six Months Ended
Note 31 December 2016
31 December 2015
31 December 2016
31 December 2015
Rupees'000
Rupees'000
Rupees'000
Rupees'000
Turnover-net
5,795,574
5,569,281
10,187,143
9,950,378
Cost of sales
11 (4,524,216)
(2,870,647)
(7,868,869)
(5,373,168)
Gross profit
1,271,358
2,698,634
2,318,274
4,577,210
Distribution cost
(41,332)
(57,753)
(75,421)
(94,453)
Administrative expenses
(89,377)
(80,387)
(167,138)
(150,294)
Other operating expenses
(75,719)
(171,969)
(136,966)
(284,697)
Finance cost
(71,541)
(121,834)
(149,254)
(319,824)
Other income
12
31,788
64,701
66,889
133,328
Profit before taxation
1,025,177
2,331,392
1,856,384
3,861,270
-
Current
(475,405)
(638,027)
(736,349)
(1,104,662)
-
Deferred
144,267
(19,290)
182,917
20,103
Taxation
(331,138)
(657,317)
(553,432)
(1,084,559)
Profit for the period
694,039
1,674,075
1,302,952
2,776,711
Earnings per share -
Basic (Rupees)
0.50
1.26
0.94
2.09
Earnings per share -
Diluted (Rupees)
0.50
1.21
0.94
2.01

F C C L9
DirectorChief Executive
Condensed�Interim�Statement�of�Comprehensive�Income(Un�-�Audited)�For�the�Six��Months�Period�Ended�31�December��2016 Half Yearly Report 2016-17
The annexed notes from 1 to 16 form an integral part of this condensed interim financial information.
Three Months Ended Six Months Ended
31 December 2016
31 December 2015
31 December 2016
31 December 2015
Rupees'000 Rupees'000
Rupees'000 Rupees'000
Profit for the period
694,039
1,674,075
1,302,952
2,776,711
Other comprehensive income for the period
-
-
-
-
Total comprehensive income for the period
694,039
1,674,075
1,302,952
2,776,711

F C C L10
DirectorChief Executive
Condensed�Interim��Cash�Flow�Statement�(Un�-�Audited)For�the�Six��Months�Period�Ended�31�December�2016
Half Yearly Report 2016-17
31 December 2016 31 December 2015
Rupees'000 Rupees'000
Cash flows from operating activities
Profit before tax 1,856,384 3,861,270
Adjustments for:
Depreciation 663,320 682,894
Provision for compensated absences 24,068 29,426
Workers' (Profit) Participation Fund including interest
and Workers' Welfare Fund 141,723 284,756
Finance cost (excluding interest on WPPF) 144,497 319,582
Gain on disposal of property, plant and equipment (2,302) (1,050)
Interest income including interest on long term advance (14,188) (68,122)
957,118 1,247,486
Decrease / (increase) in working capital 2,813,502
5,108,756
Stores, spares and loose tools (49,561) 310,521
Stock in trade (1,353,940) (9,702)
Trade debts (638,537) (259,270)
Advances
77,731
(12,150)
Trade deposits, short term prepayments and balance with statutory authority
(205,486)
(14,210)
Other receivables
(3,068)
3,483
Trade and other payables
49,877
(62,567)
(2,122,984)
(43,895)
Cash generated from operations
690,518
5,064,861
Compensated absences paid
(7,753)
(1,851)
Payment to Workers' (Profit) Participation Fund including interest
(425,175)
(15,162)
Income tax paid
(638,457)
(778,056)
Net cash (used in) / generated from operating activities
(380,867)
4,269,792
Cash flows from investing activities
Additions to property, plant and equipment
(535,801)
(60,683)
Proceeds from disposal of property, plant and equipment
2,585
1,164
Insurance claim received
552,000
-
Short term investments encashment / additions
918,674
(1,212,665)
Interest received on bank deposits
18,309
68,057
Net cash generated from / (used in) investing activities
955,767
(1,204,127)
Cash flows from financing activities
Repayment of long term financing
(1,210,293)
(1,326,343)
Dividend paid on preference shares
-
(240,785)
Dividend paid on ordinary shares
(1,173,745)
(1,932,689)
Finance cost paid
(105,705)
(193,379)
Net cash used in financing activities
(2,489,743)
(3,693,196) Decrease in cash and cash equivalents
(1,914,843)
(627,531)
Cash and cash equivalents at beginning of the period
1,587,542
2,290,845
Cash and cash equivalents at end of the period
(327,301)
1,663,314
Cash and cash equivalents comprise of the following:
Cash and bank balances
461,524
1,929,932
Short term borrowings -
secured
(788,825)
(266,618)
(327,301)
1,663,314
The annexed notes from 1 to 16 form an integral part of this condensed interim financial information.

F C C L11
Dir
ect
or
Ch
ief
Exe
cuti
ve
Condensed�Interim�Statement�of�Change�in�Equity�(Un�-�Audited)�For�the�Six�Months�Period�Ended�31�December�2016
Half Yearly Report 2016-17
S
ha
re c
ap
ita
l
Ca
pit
al
res
erv
e
R
ev
en
ue
re
se
rve
To
tal
O
rdin
ary
Pre
fere
nc
e
D
isc
ou
nt
on
is
su
e o
f s
ha
res
H
ed
gin
g
res
erv
e
R
up
ee
s'0
00
Ba
lan
ce
at
30
Ju
ne
20
15
13
,311
,15
8
48
6,9
92
(1,3
64
,38
5)
(7
2,8
95
)
5,0
58
,11
4
1
7,4
18
,98
4
To
tal
co
mp
reh
en
siv
e i
nc
om
e f
or
the
pe
rio
d
Pro
fit f
or
the
pe
rio
d
-
-
-
-
2
,77
6,7
11
2
,77
6,7
11
Oth
er
com
pre
he
nsi
ve in
com
e
-
-
-
-
-
-
Tota
l co
mp
reh
en
sive
inco
me
-
-
-
-
2
,77
6,7
11
2
,77
6,7
11
Tra
nsfe
r d
urin
g t
he
pe
rio
d
-
-
-
3
0,5
71
-
30
,57
1
Tra
ns
ac
tio
n w
ith
ow
ne
rs o
f th
e C
om
pa
ny
Dis
trib
uti
on
Fin
al d
ivid
en
d 2
01
5:
Rs
1.5
0 p
er
sha
re
-
-
-
-
(1,9
96
,67
4)
(1
,99
6,6
74
)
Ba
lan
ce
at
31
De
ce
mb
er
20
15
1
3,3
11,1
58
48
6,9
92
(1,3
64
,38
5)
(4
2,3
24
)
5,8
38
,15
1
1
8,2
29
,59
2
Ba
lan
ce
at
30
Ju
ne
20
16
13
,79
8,1
50
-
(1,3
64
,38
5)
(1
9,8
74
)
6,0
13
,96
4
1
8,4
27
,85
5
To
tal
co
mp
reh
en
siv
e i
nc
om
e f
or
the
pe
rio
d
Pro
fit f
or
the
pe
rio
d
-
-
-
-
1
,30
2,9
52
1,3
02
,95
2
Oth
er
co
mp
reh
en
siv
e in
co
me
-
-
-
-
-
-
Tota
l co
mp
reh
en
sive
inco
me
fo
r th
e p
erio
d
-
-
-
-
1
,30
2,9
52
1,3
02
,95
2
Tra
nsfe
r d
urin
g t
he
pe
rio
d
-
-
-
1
4,1
63
-
14
,16
3
Tra
ns
ac
tio
n w
ith
ow
ne
rs o
f th
e C
om
pa
ny
Dis
trib
uti
on
Fin
al d
ivid
en
d 2
01
6:
Rs
1.0
0 p
er
sha
re
-
-
-
-
(1,3
79
,81
5)
(1
,37
9,8
15
)
Ba
lan
ce
at
31
De
ce
mb
er
20
16
1
3,7
98
,15
0
-
(1,3
64
,38
5)
(5
,711
)
5,9
37
,10
1
1
8,3
65
,15
5
Un
-ap
pro
pri
ated
pro
fit

F C C L12
1. STATUS AND NATURE OF BUSINESS
1.1 Fauji Cement Company Limited ("the Company") is a Public Limited Company incorporated in Pakistan on 23 November 1992 under the Companies Ordinance, 1984 and commenced its business with effect from 22 May 1993. The shares of the Company are quoted on Pakistan Stock Exchange. The principal activity of the Company is manufacturing and sale of Ordinary Portland Cement. The Company's registered office is situated at Fauji Towers, Block-III, 68-Tipu Road, Rawalpindi.
1.2 The Company is in the process of setting up a new Waste Heat Recovery Power Project with gross output of 7.63 Mega Watt on Line-I and Wartsila Power Plant. For this, the Company has entered into an agreement with M/s Sinoma for supply of Power Plant.
2. BASIS OF PREPARATION AND STATEMENT OF COMPLIANCE
This Condensed Interim Financial Information of the Company for the six months period ended 31 December 2016 has been prepared in accordance with the requirements of International Accounting Standard 34 - "Interim Financial Reporting" and provisions of and directives issued under the Companies Ordinance, 1984. In case where requirements differ, the provisions of or directives issued under the Companies Ordinance, 1984 have been followed. The disclosures in the condensed interim financial information do not include the information reported for full audited annual financial statements and should therefore be read in conjunction with the audited annual financial statements for the year ended 30 June 2016. Comparative balance sheet is extracted from audited annual financial statements as of 30 June 2016 whereas comparative profit and loss account, statement of comprehensive income, cash flow statement and statement of changes in equity are stated from un-audited condensed interim financial information for the six months period ended 31 December 2015.
This condensed interim financial information is un-audited and is being submitted to the members as required under Section 245 of the Companies Ordinance, 1984 and the listing regulations of Pakistan Stock Exchange.
3. SIGNIFICANT ACCOUNTING POLICIES AND ESTIMATES
3.1 The accounting policies, significant judgments made in the application of accounting policies, key sources of estimations, the methods of computation adopted in preparation of this Condensed Interim Financial Information and financial Risk Management Policy are the same as those applied in preparation of audited annual financial statements for the year ended 30 June 2016.
The following standards, amendments and interpretations of approved accounting standards will be effective for accounting periods beginning on or after 1 January 2017 and are not expected to have any significant effect on condensed interim unconsolidated financial information of the Company:
Notes�to�the�Condensed�Interim�Financial�Information�(Un-Audited)For�the�Six�Months�Period�Ended�31�December��2016 Half Yearly Report 2016-17
- Amendments to IAS 7 'Statement of Cash Flows ' (effective 01 January 2017) - Amendments to IAS 12 'Income Taxes ' (effective 01 January 2017) - Amendments to IFRS 2 – 'Share-based Payment' (effective 01 January 2018) - Amendments to IAS 40 'Investment Property ' (effective 01 January 2018)
Amendments to following standards as annual improvements cycle of 2016-17: - Amendments to IFRS 12 ‘Disclosure of Interests in Other Entity’ - Amendments to IAS 28 ‘Investments in Associates and Joint Ventures’ - IFRIC 22 ‘Foreign Currency Transactions and Advance Consideration The above amendments are not likely to have an impact on the Company’s financial information.

F C C L13
4. SHARE CAPITAL
There is no change in authorised and issued, subscribed and paid up share capital of the Company from 30 June 2016. However the Company is in process of enhancing the limit of authorised share capital to Rs. 15,000 million from existing limit of Rs. 14,513 million.
Notes�to�the�Condensed�Interim�Financial�Information�(Un-Audited)For�the�Six�Months�Period�Ended�31�December��2016
Half Yearly Report 2016-17
5.1.1The markup rates, facility limits, securities offered for the term finance facilities are the same as disclosed in the annual audited financial statements of the Company for the year ended 30 June 2016.
6 SHORT TERM BORROWINGS (SECURED) - CONVENTIONAL BANKS
The Company has short term running finance facility limits to the tune of Rs. 2,200 million (30 June 2016: Rs. 1,775 million) from banking companies. These facilities are secured against first pari passu charge by way of hypothecation over the present and future assets of the Company (excluding land and building) retaining 25% margin. The markup rates are the same as disclosed in the annual audited financial statements of the Company for the year ended 30 June 2016.
7. CONTINGENCIES AND COMMITMENTS
7.1 Contingencies
There is no change in the contingent liabilities as reported in the financial statements for the year ended 30 June 2016.
7.2 Commitments
7.2.1The Company has opened letters of credit for the import of spare parts and coal valuing Rs. 958 million (30 June 2016: Rs. 147 million).
7.2.2The Company has capital commitments of Rs. 722 million (30 June 2016: Rs. 248 million).
Un-Audited Audited
Note 31 December 2016
30 June 2016
5. LONG TERM FINANCING - SECURED Rupees'000Rupees'000
- From banking companies (conventional banks)
Term finance facilities including syndicated term finance
5.1
2,802,978
4,012,133
facilities -
secured
Less: Current portion shown under current liabilities
(1,420,899)
(2,525,955)
1,382,079
1,486,178
5.1
Movement in this account during the period/year is as follows:
Opening balance
4,012,133
6,525,097
Repayments during the period / year
(1,210,293)
(2,612,928)
Exchange loss on revaluation and transaction cost adjustment
5.1.1 1,138 99,964
Closing balance
2,802,978
4,012,133
F C C L14
Notes�to�the�Condensed�Interim�Financial�Information�(Un-Audited)For�the�Six��Months�Period�Ended�31�December�2016 Half Yearly Report 2016-17
Un-Audited Audited
Note 31 December 2016
30 June 2016
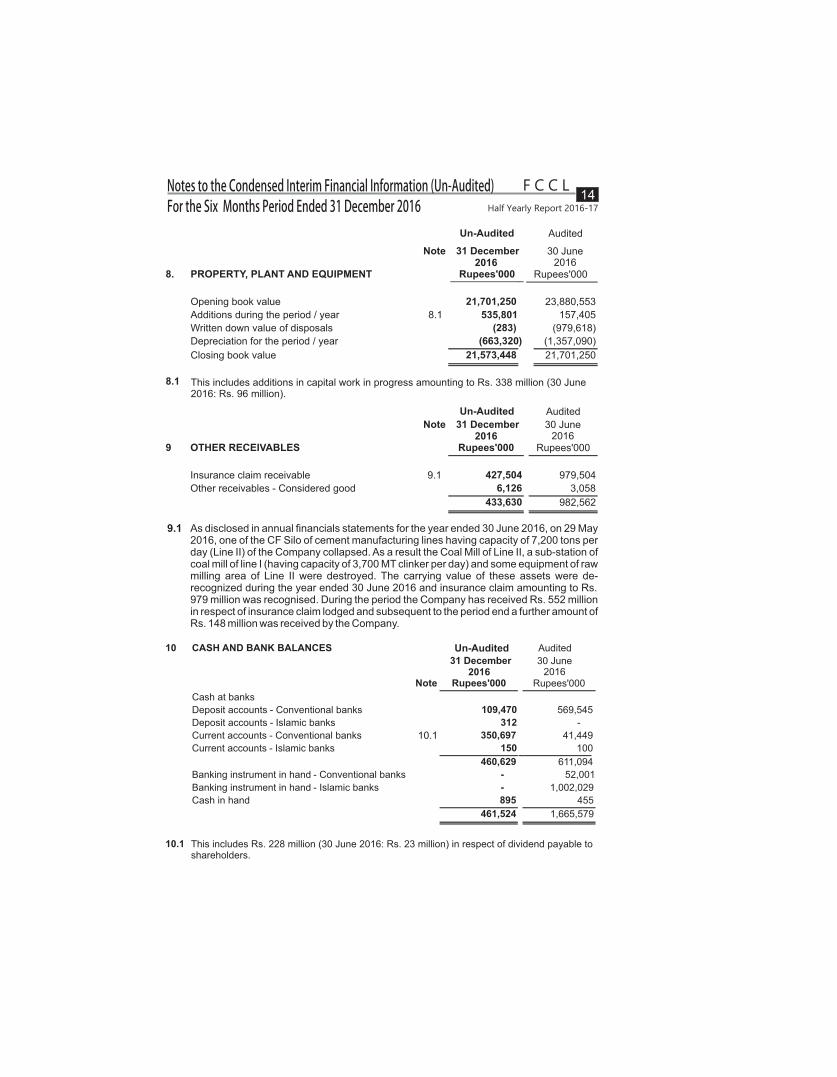
8. PROPERTY, PLANT AND EQUIPMENT Rupees'000 Rupees'000
Opening book value 21,701,250
535,801 23,880,553
Additions during the period / year 157,405 8.1
Written down value of disposals
(283)
(979,618)
Depreciation for the period / year
(663,320)
(1,357,090)
Closing book value
21,573,448
21,701,250
8.1
Un-Audited
Un-Audited
Audited
Note
31 December
2016
30 June
2016 9 OTHER RECEIVABLES
Rupees'000
Rupees'000
Insurance claim receivable
9.1
10.1
427,504
979,504
Other receivables - Considered good 6,126
3,058
433,630 982,562
This includes additions in capital work in progress amounting to Rs. 338 million (30 June 2016: Rs. 96 million).
9.1 As disclosed in annual financials statements for the year ended 30 June 2016, on 29 May 2016, one of the CF Silo of cement manufacturing lines having capacity of 7,200 tons per day (Line II) of the Company collapsed. As a result the Coal Mill of Line II, a sub-station of coal mill of line I (having capacity of 3,700 MT clinker per day) and some equipment of raw milling area of Line II were destroyed. The carrying value of these assets were de-recognized during the year ended 30 June 2016 and insurance claim amounting to Rs. 979 million was recognised. During the period the Company has received Rs. 552 million in respect of insurance claim lodged and subsequent to the period end a further amount of Rs. 148 million was received by the Company.
10 CASH AND BANK BALANCES Audited
31 December 2016
30 June 2016
Note Rupees'000 Rupees'000 Cash at banks Deposit accounts -
Conventional banks
109,470
569,545
Deposit accounts -
Islamic banks
312
-
Current accounts -
Conventional banks
350,697
41,449
Current accounts -
Islamic banks
150
100
460,629
611,094
Banking instrument in hand -
Conventional banks
-
52,001 Banking instrument in hand -
Islamic banks
-
1,002,029
Cash in hand
895
455
461,524
1,665,579
10.1 This includes Rs. 228 million (30 June 2016: Rs. 23 million) in respect of dividend payable toshareholders.

F C C L15
Notes�to�the�Condensed�Interim�Financial�Information�(Un-Audited)For�the�Six�Months�Period�Ended�31�December�2016 Half Yearly Report 2016-17
11.1 This represents the clinker purchased by the Company from the market in order to retain its market share which has lowered the margins during this period. This was necessitated after the accident on 29 May 2016 due to which Line-II is still under rehabilitation.
Three Months Ended Six Months Ended
31 December 2016
31 December
2015
31 December 2016
31 December
2015
Note
Rupees'000
Rupees'000
Rupees'000
Rupees'000
11
COST OF SALES
Raw material consumed
145,195
255,283
275,419
481,649
Packing material consumed
233,585
258,990
414,910
475,130
Stores and spares consumed
6,220
8,701
13,519
17,375
Salaries, wages and benefits
283,020
277,658
524,647
522,777
Rent, rates and taxes
6,712
5,929
11,527
10,781
Insurance
20,321
25,082
40,543
50,212
Fuel consumed
417,196
1,054,353
939,603
1,939,066
Power consumed
493,013
429,162
809,257
950,294
Depreciation
326,785
337,389
653,430
674,511
Repairs and maintenance
100,508
131,449
166,546
233,299
Technical assistance
8,342
10,239
8,469
10,319
Printing and stationery
1,621
625
2,357
1,074
Traveling and conveyance
5,752
3,464
10,590
7,662
Vehicle running and maintenance expenses
4,722
6,288
9,385
12,260
Other directly attributable expenses
4,904
7,628
8,893
12,148
Clinker purchased
11.1
2,415,314
-
5,274,288
-
4,473,210
2,812,240
9,163,383
5,398,557
Add:
Opening
work-in-process
1,570,140
645,003
251,313
607,869
Less:
Closing work-in-process
(1,545,036)
(675,189)
(1,545,036)
(675,189)
Cost of goods manufactured
4,498,314
2,782,054
7,869,660
5,331,237
Add:
Opening finished goods
190,721
182,182
164,028
135,520
Less:
Closing finished goods
(164,140)
(93,589)
(164,140)
(93,589)
Less:
Own consumption capitalized
(679)
-
(679)
-
4,524,216
2,870,647
7,868,869
5,373,168

F C C L16
Notes�to�the�Condensed�Interim�Financial�Information�(Un-Audited)For�the�Six�Months�Period�Ended�31�December�2016 Half Yearly Report 2016-17
12
OTHER INCOME
Income from financial assets
Income from deposits, advances and investments
-
Conventional Banks
4,797
26,153
7,910
68,122
-
Islamic Banks
1,710
-
6,278
-
6,507
26,153
14,188
68,122
-
Conventional funds
11,081
25,092
26,462
43,573
-
Islamic funds
1,178
-
2,611
-
12,259 25,092 29,073 43,573
Income from non financial assets
Gain on disposal of property, plant and equipment 569 12,957 2,302 1,050
Other income 12,453 499 21,326 20,583
31,788 64,701 66,889 133,328
Three Months Ended Six Months Ended
31 December 2016
31 December 2015
31 December 2016
31 December 2015
Note Rupees'000 Rupees'000 Rupees'000 Rupees'000
Gain on re-measurement of investments classified as fair value through profit or loss-held for trading

F C C L17
Notes�to�the�Condensed�Interim�Financial�Information�(Un-Audited)For�the�Six�Months�Period�Ended�31�December�2016 Half Yearly Report 2016-17
13 RELATED PARTY TRANSACTIONS AND BALANCES
There is no change in relationship with related parties during the period. Significant transactions with related parties are as follows:
Six Months Ended
31 December 2016
31 December 2015
Rupees'000
Rupees'000
Transactions and balances with associated undertakings/companies due to common directorship
-
Sale of cement
7,813
2,679
-
Preference dividend paid
-
240,785
-
Payment for use of medical facilities
571
102
-
Donation paid
500
500
-
Payment on account
of clearance of shipments
17
100
-
Payment of rent and utilities
6,144
5,532
-
Dividend paid on ordinary shares
543,650
939,302
-
Dividend payable on ordinary shares
131,250
-
-
Investment made in Askari Investment Management Limited (AIML)
-
200,000
-
Investment matured in AIML
206,388
-
-
Unrealized gain from investment at AIML
-
4,893
-
Balance at AIML-Mutual Fund
-
202,017
- Payment for purchase of Clinker
352,064
-
Employees funds
- Payments made into Employees' Provident Fund
20,819
16,262
Others
- Director's Fee 1,510 1,050
- Remuneration including benefits and perquisites to Chief Executive 10,511
9,444
- Remuneration including benefits and perquisites to key management personnelThis Represents balance as at 30 June 2016.
44,134
45,548
14 FAIR VALUE OF FINANCIAL INSTRUMENTS
Fair value is the amount for which an asset could be exchanged, or liability settled, between knowledgeable willing parties in an arm's length transaction. Consequently, differences can arise between carrying values and fair value estimates. Underlying the definition of fair value is the presumption that the Company is a going concern without any intention or requirement to curtail materially the scale of its operations or to undertake a transaction on adverse terms.
The fair value of financial assets and liabilities traded in active markets i.e. listed equity shares are based on the quoted market prices at the close of trading on the period end date. The quoted market prices used for financial assets held by the Company is current bid price. A financial instrument is regarded as quoted in an active market if quoted prices
*
*
*

F C C L18
Notes�to�the�Condensed�Interim�Financial�Information�(Un-Audited)For�the�Six�Months�Period�Ended�31�December�2016 Half Yearly Report 2016-17
are readily and regularly available from an exchange, dealer, broker, industry group, pricing service, or regulatory agency, and those prices represent actual and regularly occurring market transactions on an arm’s length basis.
IFRS 13, 'Fair Value Measurements' requires the Company to classify fair value measurements using a fair value hierarchy that reflects the significance of the inputs used in making the measurements. The fair value hierarchy has the following levels:
-Quoted prices (unadjusted) in active markets for identical assets or Liabilities (level 1).
-Inputs other than quoted prices included within level 1 that are observable for the asset or liability, either directly (that is, as prices) or indirectly (that is, derived from prices) (level 2).
-Inputs for the asset or liability that are not based on observable market data (that is, unobservable inputs) (level 3).
14.1 The following table shows the carrying amounts and fair values of financial assets and financial liabilities, including their levels in the fair value hierarchy.
Carrying amount Fair value
On-balance sheet financial
Note Fair value Loans and Other Total Level 1 Level 2 Level 3 Total
instruments
through
receivables
financial
profit & loss
liabilities
31 December 2016
Rupees '000
Financial assets measured
at fair value
Short term investments
405,811
-
-
405,811
405,811
-
-
405,811
Financial assets not
measured at fair value
14.1.1
Long term deposits
-
86,601
-
86,601
-
-
-
-
Trade debts - considered good
-
1,207,638
-
1,207,638
-
-
-
-
Advances
900
-
900
-
-
-
-
Trade deposits
-
10,132
-
10,132
-
-
-
-
Interest accrued
-
326
-
326
-
-
-
-
Other receivables
-
433,630
-
433,630
-
-
-
-
Cash and bank balances
-
461,524
-
461,524
-
-
-
-
-
2,200,751
-
2,200,751
-
-
-
-
Financial liabilities not
measured at fair value
14.1.1
Long term financing
-
1,382,079
-
1,382,079
-
-
-
-
Trade and other payables
14.1.2
-
1,519,914
-
1,519,914
-
-
-
-
Markup accrued
-
61,498
-
61,498
-
-
-
-
Short term borrowings
-
788,825
-
788,825
-
-
-
-
Current portion of long term
financing
-
1,420,899
-
1,420,899
-
-
-
-
-
5,173,215
-
5,173,215
-
-
-
-

F C C L19
Notes�to�the�Condensed�Interim�Financial�Information�(Un-Audited)For�the�Six�Months�Period�Ended�31�December�2016 Half Yearly Report 2016-17
Carrying amount
Fair value
30 June 2016 Note Fair value
Loans and
Other
Total
Level 1
Level 2
Level 3 Total
through
receivables
financial
profit & loss
liabilities
Rupees '000
Financial assets not
measured at fair value
14.1.1
Long term deposits
-
86,601
-
86,601
-
-
-
-
Trade debts -
net of provision
-
540,588
-
540,588
-
-
-
-
Advances -
900
-
900
-
-
-
-
Deposits -
9,224
-
9,224
-
-
-
-
Interest accrued
-
4,447
-
4,447
-
-
-
-
Other receivables
-
982,562
-
982,562
-
-
-
-
Cash and bank balances
-
1,665,579
-
1,665,579
-
-
-
-
-
3,289,901
-
3,289,901
-
-
-
-
Financial liabilities not
14.1.1
measured at fair value
Long term financing
-
1,486,178
-
1,486,178
-
-
-
-
Trade and other payables
14.1.2
-
1,052,900
-
1,052,900
-
-
-
-
Markup accrued
-
76,265
-
76,265
-
-
-
-
Short term borrowings
-
78,037
-
78,037
-
-
-
-
Current portion of long term
financing
-
2,525,955
-
2,525,955
-
-
-
-
-
5,219,335
-
5,219,335
-
-
-
-
14.1.1 The Company has not disclosed the fair values for these financial assets and financial liabilities, as these are either short term in nature or repriced periodically. Therefore, their carrying amounts are reasonable approximation of fair value.
14.1.2 It excludes advances from customers, provision for Workers Profit Participation Fund, provision for Workers' Welfare Fund, federal excise duty, and sales tax payable (net) .
15 DATE OF AUTHORIZATION FOR ISSUE
This condensed interim financial information was authorized for issue by the Board of Directors of the Company in their meeting held on 15 February 2017
16 GENERAL
Figures have been rounded off to the nearest thousand of rupees unless otherwise stated.
DirectorChief Executive
�������������� �
��������������� �
����������� �
30 June 2016
Financial assets measure at
fair value
Short term investment
1,324,485
-
-
1,324,485
1,324,485
-
-
1,324,485