nzdep2006 index of deprivation - otago.ac.nz · relative versus absolute deprivation 17 ......
TRANSCRIPT

Department of Public Health, University of Otago, Wellington
NZDep2006 Index of Deprivation (August 2007)
1
NZDep2006 Index of Deprivation Clare Salmond, Peter Crampton, June Atkinson
August 2007
Department of Public Health
University of Otago, Wellington
Address: PO Box 7343, Wellington, New Zealand
Phone: 04 385 5541 (ext. 6040)
Email: [email protected]

Department of Public Health, University of Otago, Wellington
NZDep2006 Index of Deprivation (August 2007)
2
The authors
Clare Salmond (BSc (Hons); MSc) retired from her position as a Senior Lecturer in
Biostatistics in the Department of Public Health at the University of Otago,
Wellington in 2004, but has maintained her active association with the NZDep
project. Clare has thirty-five years experience working as a biostatistician at the
Wellington Hospital Epidemiology Unit and at the University of Otago (in both
Dunedin and Wellington). She has published extensively in the epidemiology
and medical research literature.
Peter Crampton (MB ChB; PhD; MPH; FAFPHM; MRNZCGP) is Professor of Public
Health in the Department of Public Health at the University of Otago,
Wellington. Peter is a specialist in public health medicine. His research is focused
on social indicators and social epidemiology, health care policy, and primary
health care organisation and funding. He teaches undergraduate and postgraduate
courses related to public health, health systems and health services management.
June Atkinson (NZC Statistics) is a SAS expert. She is currently the data manager
for the Health Inequalities Research Programme in the Department of Public
Health, University of Otago, Wellington.
Department of Public Health, University of Otago, Wellington
NZDep2006 Index of Deprivation (August 2007)
3
Contents
THE AUTHORS 2
LIST OF TABLES 6
LIST OF FIGURES 6
ACKNOWLEDGEMENTS 7
ETHICS AND CONFIDENTIALITY 7
EXECUTIVE SUMMARY 8
INTRODUCTION 10
Methodological papers 10
NZDep research reports and user manuals 11
Research papers, chapters and reports illustrating applications of NZDep 12
Atlases 14
AIM 15
PURPOSE OF INDEXES 15
CAUTIONS 16
THE INDICATOR BECOMES THE REALITY 16
AREA VERSUS INDIVIDUAL MEASURES 17
RELATIVE VERSUS ABSOLUTE DEPRIVATION 17
APPARENT SIMPLICITY 17
LONGITUDINAL COMPARISONS 18
CONSTRUCTING THE INDEX 19
OVERVIEW 19
DATA SOURCES 19
DEFINING SMALL AREAS 20
CHOICE OF VARIABLES FOR INCLUSION IN NZDEP2006 21
Means tested benefit status 22
Department of Public Health, University of Otago, Wellington
NZDep2006 Index of Deprivation (August 2007)
4
Household income 23
Possible new candidate variables available in the 2006 census 24
CREATING THE INDEX 25
VALIDATION 26
RESULTS 27
DEFINING SMALL AREAS 27
NZDEP2006 SCORES 28
Comparison of NZDep2006 scores and NZDep2001 scores 29
THE NZDEP2006 INDEX OF DEPRIVATION 30
Variation within communities 32
STANDARDISATION 34
VALIDATION 34
GLOSSARY OF TERMS AND ABBREVIATIONS 36
APPENDIX ONE: SOURCE POPULATIONS 38
INDIVIDUAL FORM DATA 38
DWELLING FORM DATA 38
WHY DO WE USE TWO DIFFERENT SOURCE POPULATIONS? 39
APPENDIX TWO: DESCRIPTION OF VARIABLES USED IN NZDEP 40
1. ACCESS TO TELEPHONE 40
2. UNEMPLOYED 40
3. SINGLE PARENT FAMILIES 40
4. NO QUALIFICATIONS 41
5. DWELLINGS NOT OWNER OCCUPIED 42
6. ACCESS TO CAR 42
7. OCCUPANCY 42
APPENDIX THREE: STANDARDISATION 44
AGE AND SEX 44
INDIRECT STANDARDISATION 44
ETHNICITY 46
APPENDIX FOUR: METHODOLOGICAL ISSUES 47
Department of Public Health, University of Otago, Wellington
NZDep2006 Index of Deprivation (August 2007)
5
EQUIVALISATION 47
STRUCTURAL ZEROS 47
NOT SPECIFIED 48
APPENDIX FIVE: LONGITUDINAL ANALYSES 49
INTRODUCTION 49
COMPARING AREAS OVER TIME 50
COMPARING RELATIONSHIPS WITH DEPRIVATION OVER TIME 56
REFERENCES 58

Department of Public Health, University of Otago, Wellington
NZDep2006 Index of Deprivation (August 2007)
6
List of tables
Table 1: Variables included in NZDep2006 21
Table 2: Jensen equivalised household income (abbreviated) 24
Table 3: Distribution of population in NZDep2006 agglomerated small
areas 27
Table 4: Number of meshblocks per NZDep2006 small area 28
Table 5: Weights on the first principal components for 2006 and 2001 29
Table 6: Crowding index (number of bedrooms over or under those
required by the Canadian National Occupancy Standard) 43
Table 7: Comparison of NZDep96, NZDep2001, and NZDep2006
distributions 53
List of figures
Figure 1: Distribution of NZDep2006 scores, with the NZDep2006 decile
scale superimposed 32
Figure 2: Variation in NZDep2006 profiles 33
Figure 3: Comparing deprivation deciles over time using hypothetical
outcome data 57

Department of Public Health, University of Otago, Wellington
NZDep2006 Index of Deprivation (August 2007)
7
Acknowledgements
The original NZDep91 project, on which NZDep96, NZDep2001, and
NZDep2006 are based, was carried out at the Health Services Research Centre
and was funded by the Health Research Council of New Zealand. We are grateful
to the Health Services Research Centre for supporting this work originally, and to
the Ministry of Health for supporting the production of both NZDep2001 and
NZDep2006. Equally important has been the tremendous support that Statistics
New Zealand has provided.
While the contents of this report have benefited considerably from the assistance
of colleagues, the responsibility for this report remains solely with the authors.
Ethics and confidentiality
Ethical approval for the original NZDep91 project was obtained in May 1995
from the Central Regional Health Authority Wellington Ethics Committee.
Access to the data used in this study was provided by Statistics New Zealand
under conditions designed to give effect to the security and confidentiality
provisions of the Statistics Act 1975. The results presented in this study are the
work of the authors, not Statistics New Zealand.
Department of Public Health, University of Otago, Wellington
NZDep2006 Index of Deprivation (August 2007)
8
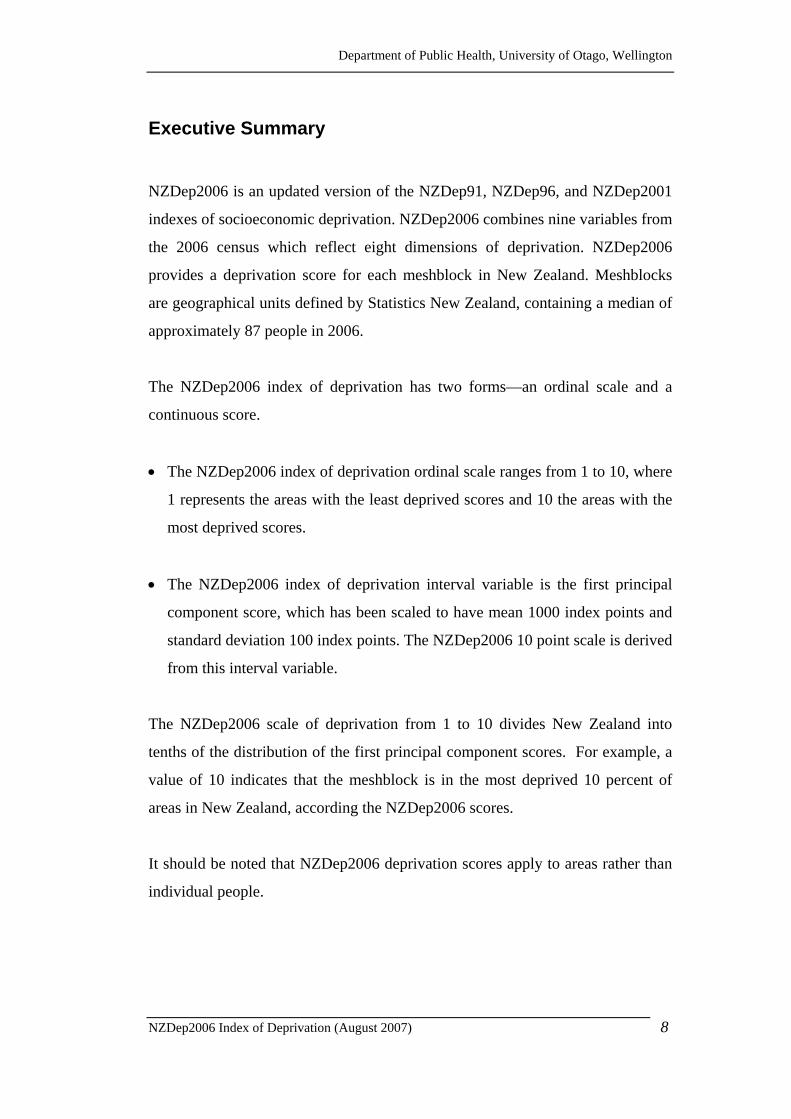
Executive Summary
NZDep2006 is an updated version of the NZDep91, NZDep96, and NZDep2001
indexes of socioeconomic deprivation. NZDep2006 combines nine variables from
the 2006 census which reflect eight dimensions of deprivation. NZDep2006
provides a deprivation score for each meshblock in New Zealand. Meshblocks
are geographical units defined by Statistics New Zealand, containing a median of
approximately 87 people in 2006.
The NZDep2006 index of deprivation has two forms—an ordinal scale and a
continuous score.
• The NZDep2006 index of deprivation ordinal scale ranges from 1 to 10, where
1 represents the areas with the least deprived scores and 10 the areas with the
most deprived scores.
• The NZDep2006 index of deprivation interval variable is the first principal
component score, which has been scaled to have mean 1000 index points and
standard deviation 100 index points. The NZDep2006 10 point scale is derived
from this interval variable.
The NZDep2006 scale of deprivation from 1 to 10 divides New Zealand into
tenths of the distribution of the first principal component scores. For example, a
value of 10 indicates that the meshblock is in the most deprived 10 percent of
areas in New Zealand, according the NZDep2006 scores.
It should be noted that NZDep2006 deprivation scores apply to areas rather than
individual people.

Department of Public Health, University of Otago, Wellington
NZDep2006 Index of Deprivation (August 2007)
9
NZDep2006 combines the following census data (calculated as proportions for
each small area):
Dimension of deprivation Variable description (in order of decreasing weight)
Income People aged 18-64 receiving a means tested benefit
Income People living in equivalised* households with income below
an income threshold
Owned home
Support
Employment
People not living in own home
People aged <65 living in a single parent family
People aged 18-64 unemployed
Qualifications People aged 18-64 without any qualifications
Living space People living in equivalised* households below a bedroom
occupancy threshold
Communication People with no access to a telephone
Transport People with no access to a car
*Equivalisation: methods used to control for household composition.
Department of Public Health, University of Otago, Wellington
NZDep2006 Index of Deprivation (August 2007)
10
Introduction
This report describes the development of NZDep2006. The methods used in the
creation of NZDep2006 are based on very similar methods used in the creation of
NZDep91, NZDep96, and NZDep2001 which are described in detail in Research
Report No.5 NZDep91 Index of Deprivation (Crampton et al, 1997), Research
Report No.8: NZDep96 Index of Deprivation (Salmond et al, 1998), and
NZDep2001 Index of Deprivation (Salmond & Crampton, 2002).
Minor changes only have been made to the methods used for NZDep2006. These
changes are a result of changed income categories and means-tested benefit
categories in the Census form. A description and explanation of changes is given
in the methods section. Work on NZDep2006 was largely carried out at the
Statistics New Zealand Data Laboratory.
An overview of the theory and conceptualisation of socioeconomic deprivation
can be found in the following two sources:
1. Salmond, C., King, P., Crampton, P. and Waldegrave, C. (2006). NZiDep:
A New Zealand index of socioeconomic deprivation for individuals, Social
Science & Medicine, 62, 1474-1485.
2. Crampton, P., Salmond, C., Kirkpatrick, R., Scarborough, R. and Skelly,
C. (2000). Degrees of Deprivation in New Zealand: An atlas of
socioeconomic difference, Auckland, David Bateman Ltd.
Further information regarding NZDep and its various uses may be obtained in the
following books, papers and reports.
Methodological papers
Department of Public Health, University of Otago, Wellington
NZDep2006 Index of Deprivation (August 2007)
11
1. Crampton, P., Salmond, C. and Sutton, F. (1997), NZDep91: a new index
of deprivation, Social Policy Journal of New Zealand, 9, 186-193.
2. Crampton, P., Salmond, C. and Sutton, F. (1997), The NZDep91 index of
deprivation, in Crampton, P. and Howden-Chapman, P. (eds.), Socioeconomic
Inequalities and Health - Proceedings of the Socioeconomic Inequalities and
Health Conference, Wellington, December 9-10, 1996, Wellington, Institute
of Policy Studies, Victoria University of Wellington.
3. Salmond, C., Crampton, P. and Sutton, F. (1998), NZDep91: a new index
of deprivation, Australian and New Zealand Journal of Public Health, 22, 95-
97.
4. Crampton, P. and Davis, P. (1998), Measuring deprivation and
socioeconomic status: why and how, The New Zealand Public Health Report,
5, 81-84.
5. Salmond, C. and Crampton, P. (2001), NZDep96 - What does it measure?
Social Policy Journal of New Zealand, 17, 82-100.
6. Salmond, C. and Crampton, P. (2002), Heterogeneity of deprivation within
very small areas, Journal of Epidemiology and Community Health, 56, 669-
670.
NZDep research reports and user manuals
1. Crampton, P., Salmond, C. and Sutton, F. (1997), NZDep91 Index of
Deprivation Instruction Book, Wellington, Health Services Research Centre.
Department of Public Health, University of Otago, Wellington
NZDep2006 Index of Deprivation (August 2007)
12
2. Crampton, P., Salmond, C. and Sutton, F. (1997), NZDep91 Index of
Deprivation Look Up Directory, Wellington, Health Services Research
Centre.
3. Crampton, P., Salmond, C. and Sutton, F. (1997), Research Report No 5:
NZDep91 Index of Deprivation, Wellington, Health Services Research
Centre.
4. Salmond, C., Crampton, P. and Sutton, F. (1998), NZDep96 Index of
Deprivation Instruction Book, Wellington, Health Services Research Centre.
5. Salmond, C., Crampton, P. and Sutton, F. (1998), NZDep96 Index of
Deprivation Look Up Directory, Wellington, Health Services Research
Centre.
6. Salmond, C., Crampton, P. and Sutton, F. (1998), Research Report No 8,
NZDep96 Index of Deprivation, Wellington, Health Services Research
Centre.
7. Salmond, C. and Crampton, P. (2002), NZDep2001 Index of Deprivation,
Wellington, Department of Public Health, Wellington School of Medicine
and Health Sciences. http://www.moh.govt.nz/moh.nsf/pagesmh/3357?Open
8. Salmond, C. and Crampton, P. (2002), NZDep2001 Users Manual.
Wellington, Department of Public Health, Wellington School of Medicine
and Health Sciences.
Research papers, chapters and reports illustrating applications of NZDep
1. Salmond, C., Crampton, P., Hales, S., Lewis, S. and Pearce, N. (1999),
'Asthma prevalence and deprivation: a small area analysis', Journal of
Epidemiology and Community Health, 53, 476-480.
Department of Public Health, University of Otago, Wellington
NZDep2006 Index of Deprivation (August 2007)
13
2. Crampton, P., Salmond, C., Woodward, A. and Reid, P. (2000),
'Socioeconomic deprivation and ethnicity are both important for anti-tobacco
health promotion', Health Education and Behaviour, 27, 317-327.
3. Mitchell, E., Stewart, A., Crampton, P. and Salmond, C. (2000),
'Deprivation and sudden infant death syndrome', Social Science and
Medicine, 51, 147-150.
4. Salmond, C. and Crampton, P. (2000), 'Deprivation and Health', in
Howden-Chapman, P. and Tobias, M. (eds.), Social Inequalities in Health:
New Zealand 1999, Wellington, Ministry of Health.
5. Crampton, P. and Salmond, C. (2000), 'Socioeconomic deprivation and
hospitalisation rates in New Zealand', Australasian Epidemiologist, 7, 20-24.
6. Love, T. and Crampton, P. (2001), 'Deprivation profiles in Wellington IPA
practices.' New Zealand Family Physician, 28, 327-332.
7. Tobias, M., Salmond, C., Crampton, P., Chan, M., Marmot, M. and Reid,
P. (2001), Life Expectancy and Small Area Deprivation in New Zealand.
Public Health Intelligence Occasional Bulletin No 6., Wellington, Ministry of
Health.
8. Abas, M., Vanderpyl, J., Robinson, E. and Crampton, P. (2003), 'More
deprived areas need a greater number of psychiatric beds', Australian and
New Zealand Journal of Psychiatry, 37, 437-444.
9. McFadden, K., McConnell, D., Salmond, C., Crampton, P. and Fraser, J.
(2004), 'Socioeconomic deprivation and the incidence of cervical cancer in
New Zealand: 1988-1998', New Zealand Medical Journal, 117, 1206.
Department of Public Health, University of Otago, Wellington
NZDep2006 Index of Deprivation (August 2007)
14
10. Abas, M., Vanderpyl, J., Robinson, E., Leprou, T. and Crampton, P.
(2006), 'Socio-economic deprivation and duration of hospital stay in severe
mental disorder', British Journal of Psychiatry, 188, 581-582.
11. HURA Research Alliance, McLeod, D., Cormack, D., Love, T., Salmond,
C., Robson, B., Dowell, A., Howard, M., Crampton, P. and Ramage, S.
(2006), 'Ethnicity, socioeconomic deprivation and consultation rates in New
Zealand general practice', Journal of Health Services Research & Policy, 11,
141-149.
Atlases
1. Crampton, P., Salmond, C., Kirkpatrick, R., Scarborough, R. and Skelly,
C. (2000), Degrees of Deprivation in New Zealand: An atlas of
socioeconomic difference, Auckland, David Bateman Ltd.
2. Crampton, P., Salmond, C. and Kirkpatrick, R. (2004), Degrees of
Deprivation in New Zealand: An atlas of socioeconomic difference. 2nd
Edition, Auckland, David Bateman Ltd.
Department of Public Health, University of Otago, Wellington
NZDep2006 Index of Deprivation (August 2007)
15
Aim
The aim of the NZDep research programme is to develop small area indexes of
socioeconomic deprivation for New Zealand.
Purpose of indexes
NZDep91, NZDep96, NZDep2001 and NZDep2006 have been developed with
three principal purposes in mind: resource allocation, research, and advocacy.
1. Indexes of deprivation have application in funding formulas. For example,
indexes of deprivation are used in capitation funding formulas for primary
health care services, the population-based funding formula for District Health
Boards, and in funding formulas for social services in other sectors.
2. Indexes of deprivation have application in research in a variety of settings
such as health and other social services. For example, in the health sector,
many researchers use small area indexes to describe the relationship between
socioeconomic deprivation and health outcomes; increasing levels of
deprivation are associated with higher mortality rates, and higher rates of
many diseases.
3. Indexes of deprivation are used by community groups and community-based
service providers to describe the populations they serve, and to advocate for
extra resources for community-based services.

Department of Public Health, University of Otago, Wellington
NZDep2006 Index of Deprivation (August 2007)
16
Cautions
A number of potential problems arise in using measures of socioeconomic
position. The following are of particular importance for NZDep.
The indicator becomes the reality
The problem of confusing the indicator with the underlying phenomenon is
discussed by Carr-Hill and Chalmers-Dixon (2002):
A common problem is to confuse the index with the phenomenon it purports to measure
and, as a result, forget that an index is only a proxy or partial measure. (emphasis
added)
This common problem is referred to as reification. It is crucial that users of any
measure of socioeconomic position recognise this problem and scrutinise both the
theoretical basis for, and the construction of, the specific index. Carr-Hill and
Chalmers-Dixon (2002) give the following UK-based example:
The tendency is not unknown with measures of deprivation where it is more common to
use phrases such as the ten most deprived local authorities, rather than "the authorities
with the top ten scores on the DETR2000 index".
Users of NZDep indexes should refer to 'areas that have the most deprived
NZDep scores' rather than 'the most deprived areas'.
Department of Public Health, University of Otago, Wellington
NZDep2006 Index of Deprivation (August 2007)
17
Area versus individual measures
Please note that NZDep is a small-area measure of deprivation. Caution must be
used if the index is applied to individuals. This issue is discussed in greater detail
in NZDep - What does in measure? (Salmond & Crampton, 2001), in
Heterogeneity of deprivation within very small areas (Salmond & Crampton,
2002a), and in NZiDep: A New Zealand index of socioeconomic deprivation for
individuals (Salmond et al, 2006).
Relative versus absolute deprivation
A view is sometimes expressed, in reference to NZDep, that 'it is disgraceful that
still 10% of areas are most deprived'. Please note that 10% of areas will always
fall into the most deprived decile of NZDep scores—NZDep is designed to
measure relative socioeconomic deprivation, not absolute socioeconomic
deprivation.
Apparent simplicity
The NZDep scales (from 1 to 10) have been constructed so that they can be
readily used in a variety of contexts. They are easily presented graphically. This
simplicity should not be allowed to obscure the underlying complexity of
construction, the limitation of components available from the Census, and the
underlying theoretical assumptions (discussed in Degrees of Deprivation in New
Zealand: An atlas of socioeconomic difference. 2nd Edition (Crampton et al.,
2004)).
Department of Public Health, University of Otago, Wellington
NZDep2006 Index of Deprivation (August 2007)
18
Longitudinal comparisons
Difficulties arise in making comparisons between different NZDep indexes (i.e.
NZDep91, NZDep96, NZDep2001, and NZDep2006). These difficulties are
discussed in detail in Appendix five.

Department of Public Health, University of Otago, Wellington
NZDep2006 Index of Deprivation (August 2007)
19
Constructing the index
Overview
Creation of a small area index of deprivation requires:
1. a source of data;
2. a definition for the small area;
3. choice of, and definitions for, the variables included in the index;
4. a method for using the variables to create the index; and
5. internal and external validation of the index.
Data sources
NZDep2006 was created from data from the 2006 Census of Population and
Dwellings. The variables included in NZDep2006 are all age and sex
standardised proportions of people in a small area with an attribute.
Information was maximised by obtaining files from two sources:
1) all individual census forms of persons usually resident in New Zealand whose
meshblock of usual residence can be ascribed, whether present in their usual
residence on census night or not (4.03 million); and
2) dwelling forms from private dwellings (3.89 million records); that is one
record for each person usually resident in a private dwelling.
More details concerning the source populations are given in Appendix one.

Department of Public Health, University of Otago, Wellington
NZDep2006 Index of Deprivation (August 2007)
20
Defining small areas
The NZDep small areas used to create the base index of deprivation are unique to
the deprivation project (NZDep2006 small areas). The building blocks for these
small areas are standard Statistics New Zealand meshblocks. Where necessary,
meshblocks have been agglomerated to create NZDep2006 small areas with a
population of at least 100 persons usually resident, where possible.
Agglomeration occurred only within primary sampling unit (PSU) boundaries so
that the resulting small areas were geographically connected. (PSUs are areas
used internally by Statistics New Zealand for their labour force and other
surveys.) It should be noted that connectivity does not necessarily imply
consecutively numbered meshblocks. In general, the NZDep2006 small areas
consist of one or two meshblocks. Details of the agglomeration are included in
Appendix five (Comparing areas over time, section 2a).
In addition to the desire to have at least 100 persons in each NZDep2006 small
area, it was important to check that individual proportions in an area did not have
very small denominators because of small numbers of individuals in particular
age groups, perhaps compounded by missing data. We therefore identified those
NZDep2006 small areas with any proportion denominator less than 20. These
proportions occurred in exactly 100 small areas. The agglomeration steps were
therefore repeated, further agglomerating these small areas up to their respective
primary sampling unit boundaries (where possible). The final number of
NZDep2006 small areas was 23,786. Ultimately, the values for 22 NZDep2006
small areas, involving 40 meshblocks, have been withheld from the index
because two or more of the nine denominators were less than 20 and the index
value was considered unreliable.
The following meshblocks have had their deprivation values withheld:
0172807 0173806 0340500 0364601 0780408 0952022 1104900 1179606 1204924
1204925 1239300 1254505 1867008 1869800 1875001 1883804 2003505 2004101

Department of Public Health, University of Otago, Wellington
NZDep2006 Index of Deprivation (August 2007)
21
2216200 2343701 2416402 3138801 3138802 3174400 3174500 3174600 3174700
3174800 3174900 3175000 3175100 3175200 3175300 3175400 3175500 3175700
3175801 3175802 3175803 3175900
Choice of variables for inclusion in NZDep2006
The NZDep2006 index of deprivation reflects eight dimensions of material and
social deprivation. These dimensions reflect lacks of income, employment,
communication, transport, support, qualifications, owned home and living space.
A list of the variables used in NZDep2006 is given in Table 1.
Table 1: Variables included in NZDep2006
Variable (proportions in small areas) in order of decreasing weight in the index
People aged 18 - 64 receiving a means tested benefit
People living in equivalised* households with income below an income threshold
People not living in own home
People aged < 65 living in a single parent family
People aged 18 - 64 unemployed
People aged 18 - 64 without any qualifications
People living in equivalised* households below a bedroom occupancy threshold
People with no access to a telephone
People with no access to a car
*Equivalisation: methods used to control for household composition.
Two variables used in NZDep2006 have been slightly modified as a result of
changed definitions or categories in the Census (means tested benefit status and
household income). A description of these changes is given below. For
convenience, a short description of the unchanged variables (access to a
telephone, access to a car, unemployment, single parent family, no qualifications,
occupancy, and dwellings not owner occupied) has been extracted from Research
Report No. 5 (Crampton et al., 1997b) or NZDep2001 Index of Deprivation
(Salmond & Crampton, 2002b) and placed in Appendix two.
Department of Public Health, University of Otago, Wellington
NZDep2006 Index of Deprivation (August 2007)
22
The age-limit in the definition of four of the variables used in NZDep2006 has
also been slightly modified. The upper boundary is now 65 years, instead of 60
years as used previously, reflecting the current age at which a guaranteed
retirement income is available to all.
Means tested benefit status
This variable is obtained for those people aged 18 to 64. The means tested
benefits included in the definition of this variable changed as a result of changes
to the question in the 2006 census. Means tested benefits included in the
NZDep2006 version of this variable are: Sickness Benefit; Domestic Purposes
Benefit; and Invalid’s Benefit.
Most, but not all, government benefits are income-tested to some extent (personal
communication, Ministry of Social Development, March 2002; re-confirmed
2006). Family Support is not listed in the 2006 Census because it is a tax benefit
rather than a cash payment.
The New Zealand Superannuation or Veterans Pension category is not included
in the NZDep means-tested benefit variable because New Zealand
Superannuation is not income tested (apart for the relatively small number of
people on Superannuation who have an ‘underage’ spouse), it does not reflect
standard of living in the way the other means tested benefits do, and its strong
correlation with age would influence results unduly. In 2001, only about 7000
people were on Veterans Pensions and the number is unlikely to have increased
in 2006.
The proportion of people on the Unemployment Benefit is not used, even though
it is an income tested benefit, because unemployment is picked up in the
unemployment variable.

Department of Public Health, University of Otago, Wellington
NZDep2006 Index of Deprivation (August 2007)
23
The Student Allowance Benefit is income tested, but is not included in the
means-tested benefit variable because it was considered that the majority of
people on this benefit were probably not disadvantaged or socioeconomically
deprived in the same way as those on the other means tested benefits.
The final group of benefits – Other government benefits, government income
support payments, war pensions, or paid parental leave – presents a new problem
in 2006. The war pensions benefit is not income tested but applies to a relatively
small number of people. In 2001 this was 23,000 and it is likely to be similar in
2006. The government benefit of paid parental leave was introduced in 2002 with
about 19,000 employed women receiving parental leave in the first year of its
operation (NZ Herald, 09 March 2004, quoting the Prime Minister).
The errors likely to be introduced by including income from the ‘other’ benefits
group into the means-tested benefit variable would be much the same as would be
produced by excluding them. Since we do not wish to label people ‘deprived’
unnecessarily we excluded the ‘other’ benefits group from the list of means-
tested benefits used in the production of NZDep2006.
Household income
The setting of the household equivalised income threshold was based on two
principles:
1. the proportion of the population identified as being socioeconomically
deprived by the threshold should be broadly consistent with the other
variables in the index (i.e., the threshold should be neither too inclusive nor
too restrictive);
2. the threshold should be broadly consistent with other measures of income
poverty.

Department of Public Health, University of Otago, Wellington
NZDep2006 Index of Deprivation (August 2007)
As with previous versions of NZDep, the poverty-line work of Stephens and
Waldegrave was used as a guide for setting the NZDep2006 household
equivalised income threshold. In 2003/2004, using a threshold of 60% of the
median equivalised disposable household income, 19.4% of the population were
below the poverty line (which equates to 20.9% of households) (personal
communication, Bob Stephens, June 2007, New Zealand Poverty Measurement
Project data set). The equivalent proportion of the population below the poverty
line in 1998 was 14.7% (Stephens and Waldegrave, 2001). The household
equivalised income threshold was set as close as possible to 15% of people in
NZDep2001 and this continues in NZDep2006. Table 2 gives an abbreviated
distribution of equivalised income.
Table 2: Jensen equivalised household income (abbreviated)
Equivalised-income* Cumulative percent of
people
under 13,232 5.00
.. to 18,988 10.00
.. to 19,673 12.00 Deprived
to 21,898 14.00
to 23,797 14.96
23,805 15.06
2006 threshold cuts off 14.96
percent of people with household
income information
.. to 24,387 16.00
.. to 25,398 20.00 Not deprived
to 33,888 30.00
etc. etc.
* Note that because the source information is in income bands, there are only a limited number of values for 'equivalised' income.
Possible new candidate variables available in the 2006 census
The 2006 Census was examined in detail for possible new candidate variables for
NZDep2006. To be considered for inclusion in the index, variables needed to be
consistent with the theoretical approach adopted for NZDep (see Research Report
24
Department of Public Health, University of Otago, Wellington
NZDep2006 Index of Deprivation (August 2007)
25
Number 5 (Crampton (1997b)). Only one potential variable was identified—
access to the Internet.
Access to the Internet is becoming very common and it was necessary to check
whether a variable ‘no access to the Internet’ could be explored for the index of
deprivation. Over a third of the population (36.1 percent) does not have access to
the Internet, suggesting that to label them ‘deprived’ may be a misnomer at this
time. Certainly, ‘lack of access to the Internet’ does not have the same
deprivation connotations as unemployment or being in receipt of a means-tested
benefit. On the other hand, the 5.8 percent of the population without access to
either a land-line telephone or a mobile phone are more likely to be deprived.
Creating the index
Principal components analysis was used, as previously, to create the index.
Principal components analysis is a multivariate method that identifies linear
combinations of variables that progressively account for the overall variation in
the data. The first principal component accounts for the most variation, the
second accounts for as much of the remaining variation as possible, and so on.
Further information is contained in Research Report Number 5 (Crampton et al.,
1997b).
NZDep2006 is the first principal component of nine variables. Each variable is a
proportion of persons in a small area. The index was created, as before, using
standardised proportions, where each small area proportion was standardised in
eight age/sex groups (0-17, 18-39, 40-64, 65 and over, for each sex) to the New
Zealand population structure. Proportions were calculated both standardised and
unstandardised as a way of checking the effect of standardisation. A description
of the standardisation process used in creating NZDep2006 is given in Appendix
three.

Department of Public Health, University of Otago, Wellington
NZDep2006 Index of Deprivation (August 2007)
26
Technical difficulties, encountered occasionally when an NZDep2006 small area
had no one in certain age/sex groups, were overcome, as before, by defining such
proportions to be zero. The explanation given in Research Report No. 5 is
repeated in Appendix four (Structural zeros). Other technical difficulties
involving 'not specified' codes were treated as before and are also described in
Appendix four (Not specified).
Validation
Validation for the earlier indexes is discussed in Research Reports No. 5 and No.
8 (Crampton et al., 1997b; Salmond et al., 1998c).
As in 1996, we were able to validate the NZDep2006 index against individual
smoking data contained in the 2006 census.
Department of Public Health, University of Otago, Wellington
NZDep2006 Index of Deprivation (August 2007)
27
Results
Defining small areas
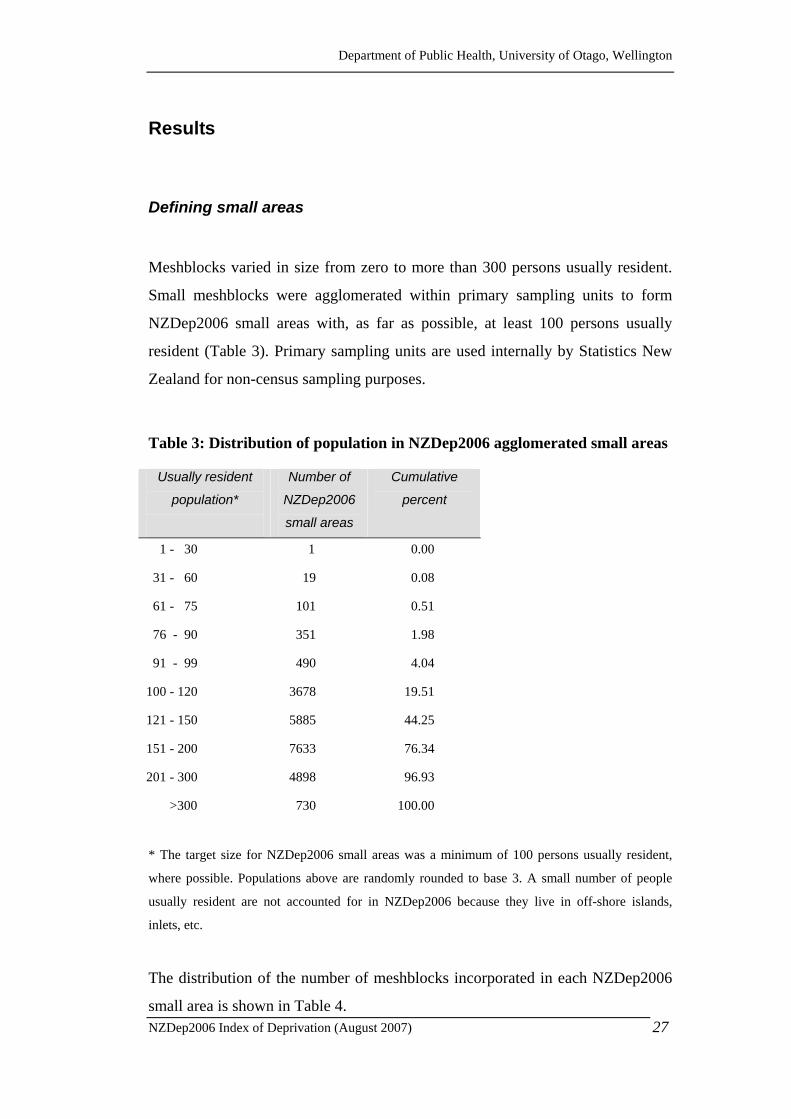
Meshblocks varied in size from zero to more than 300 persons usually resident.
Small meshblocks were agglomerated within primary sampling units to form
NZDep2006 small areas with, as far as possible, at least 100 persons usually
resident (Table 3). Primary sampling units are used internally by Statistics New
Zealand for non-census sampling purposes.
Table 3: Distribution of population in NZDep2006 agglomerated small areas
Usually resident
population*
Number of
NZDep2006
small areas
Cumulative
percent
1 - 30 1 0.00
31 - 60 19 0.08
61 - 75 101 0.51
76 - 90 351 1.98
91 - 99 490 4.04
100 - 120 3678 19.51
121 - 150 5885 44.25
151 - 200 7633 76.34
201 - 300 4898 96.93
>300 730 100.00
* The target size for NZDep2006 small areas was a minimum of 100 persons usually resident,
where possible. Populations above are randomly rounded to base 3. A small number of people
usually resident are not accounted for in NZDep2006 because they live in off-shore islands,
inlets, etc.
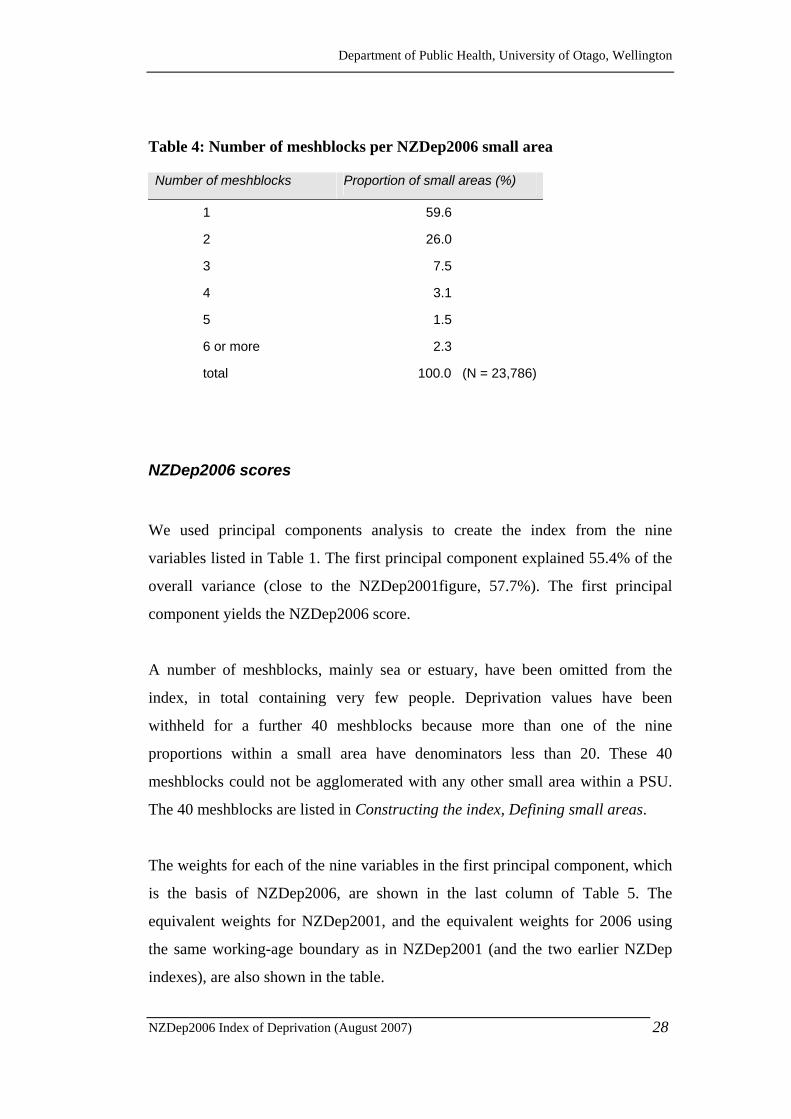
The distribution of the number of meshblocks incorporated in each NZDep2006
small area is shown in Table 4.
Department of Public Health, University of Otago, Wellington
NZDep2006 Index of Deprivation (August 2007)
28
Table 4: Number of meshblocks per NZDep2006 small area
Number of meshblocks Proportion of small areas (%)
1 59.6
2 26.0
3 7.5
4 3.1
5 1.5
6 or more 2.3
total 100.0 (N = 23,786)
NZDep2006 scores
We used principal components analysis to create the index from the nine
variables listed in Table 1. The first principal component explained 55.4% of the
overall variance (close to the NZDep2001figure, 57.7%). The first principal
component yields the NZDep2006 score.
A number of meshblocks, mainly sea or estuary, have been omitted from the
index, in total containing very few people. Deprivation values have been
withheld for a further 40 meshblocks because more than one of the nine
proportions within a small area have denominators less than 20. These 40
meshblocks could not be agglomerated with any other small area within a PSU.
The 40 meshblocks are listed in Constructing the index, Defining small areas.
The weights for each of the nine variables in the first principal component, which
is the basis of NZDep2006, are shown in the last column of Table 5. The
equivalent weights for NZDep2001, and the equivalent weights for 2006 using
the same working-age boundary as in NZDep2001 (and the two earlier NZDep
indexes), are also shown in the table.
Department of Public Health, University of Otago, Wellington
NZDep2006 Index of Deprivation (August 2007)
29
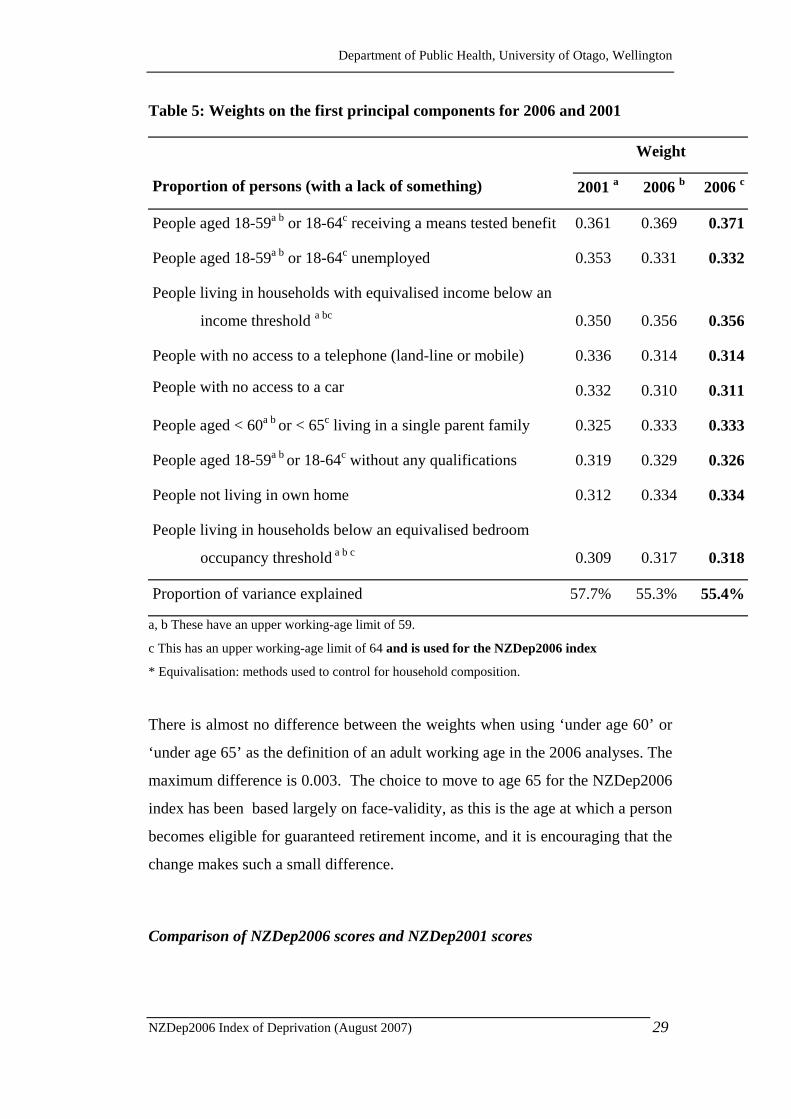
Table 5: Weights on the first principal components for 2006 and 2001
Weight
Proportion of persons (with a lack of something) 2001 a 2006 b 2006 c
People aged 18-59a b or 18-64c receiving a means tested benefit 0.361 0.369 0.371
People aged 18-59a b or 18-64c unemployed 0.353 0.331 0.332
People living in households with equivalised income below an
income threshold a bc 0.350 0.356 0.356
People with no access to a telephone (land-line or mobile) 0.336 0.314 0.314
People with no access to a car 0.332 0.310 0.311
People aged < 60a b or < 65c living in a single parent family 0.325 0.333 0.333
People aged 18-59a b or 18-64c without any qualifications 0.319 0.329 0.326
People not living in own home 0.312 0.334 0.334
People living in households below an equivalised bedroom
occupancy threshold a b c 0.309 0.317 0.318
Proportion of variance explained 57.7% 55.3% 55.4%
a, b These have an upper working-age limit of 59.
c This has an upper working-age limit of 64 and is used for the NZDep2006 index
* Equivalisation: methods used to control for household composition.
There is almost no difference between the weights when using ‘under age 60’ or
‘under age 65’ as the definition of an adult working age in the 2006 analyses. The
maximum difference is 0.003. The choice to move to age 65 for the NZDep2006
index has been based largely on face-validity, as this is the age at which a person
becomes eligible for guaranteed retirement income, and it is encouraging that the
change makes such a small difference.
Comparison of NZDep2006 scores and NZDep2001 scores
Department of Public Health, University of Otago, Wellington
NZDep2006 Index of Deprivation (August 2007)
30
The table above shows that the maximum difference between the weights in the
2001 analysis and the weights in the 2006 analysis which also used the age of 60
as the working-age threshold, is fairly small – 0.022. It is shared by four variables
– proportions unemployed, no phone access, no car, and rented home.
Part of the small differences observed may be a result of differing levels of
missing information.
Part, of course, is likely to be due to changing social circumstances. For example,
the slight decrease in importance of the unemployment variable may be a
reflection of the much lower levels of unemployment in 2006 compared to 2001;
and that in the telephone variable may be due to the increasing availability and
use of mobile phones.
The means-tested benefit variable remains the most important of the deprivation
indicators. The slight increase in importance in 2006 may be due, in part at least,
to a ‘purification’ of the variable. In 2001, it was biased by the inclusion of a
relatively small number of people in receipt of a non-means-tested benefit
(described under Means tested benefits). In 2006, these people have been
excluded (as have a relatively small number of people in receipt of one of two
other means-tested benefits, since they could not be separately identified). Thus
the 2006 means-tested benefit variable is still biased but, importantly, its
components are all deprivation-related.
The NZDep2006 Index of deprivation
An NZDep2006 scale of deprivation has been produced from the distribution of
the NZDep2006 scores. This scale from 1 to 10 divides New Zealand into tenths
of the distribution of the first principal component scores, where, for example, a
value of 10 indicates that the area is in the most deprived 10% of NZDep2006
small areas in New Zealand.
Department of Public Health, University of Otago, Wellington
NZDep2006 Index of Deprivation (August 2007)
31
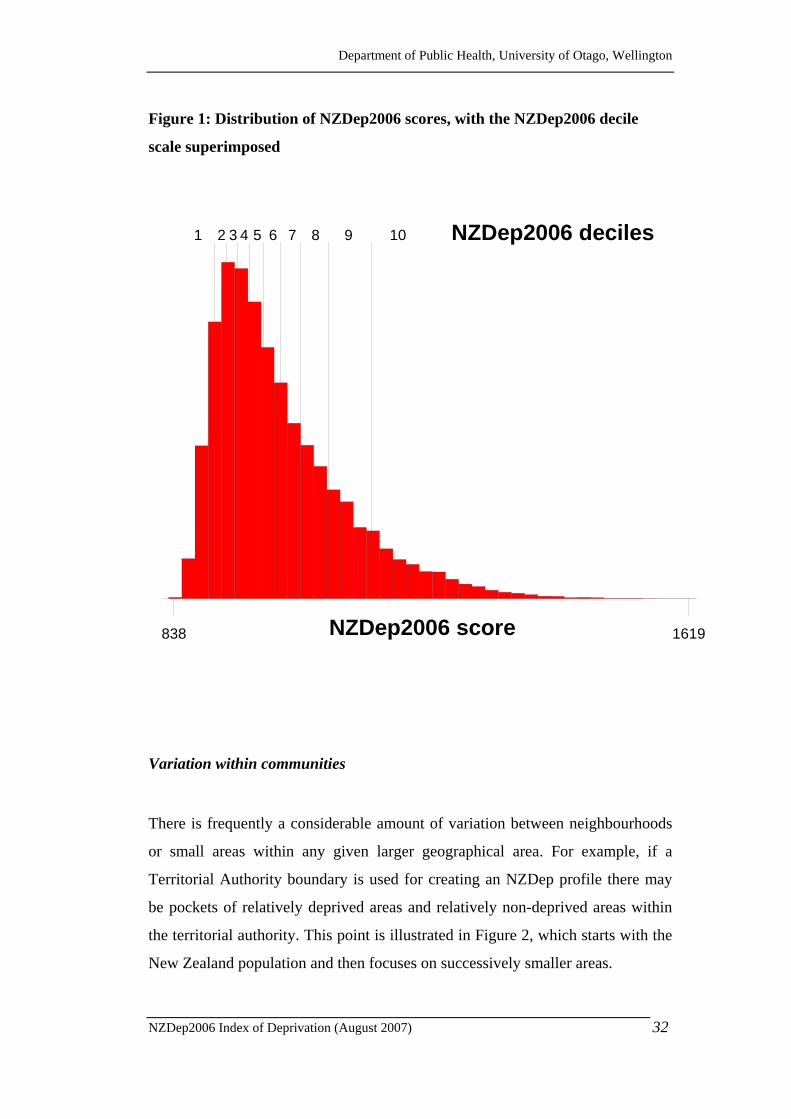
Figure 1 shows the relationship between the NZDep2006 scores and the
NZDep2006 scale from 1 to 10. The skewed distribution illustrates clearly that
NZDep2006 reflects a continuum from 'least deprivation' to 'most deprivation',
rather than from 'affluence' to 'deprivation'. This was intended, as all the variables
in NZDep2006 reflect a lack of something.
Note that the decile cut-points of the NZDep2006 scale are not equally spaced, so
that, for example, the difference between deciles 2 and 5 is not huge, unlike the
difference between deciles 7 and 10. Other scales can be created from the
NZDep2006 scores. For example, fortieths have been used to explore national
five-year mortality rates, and quintiles have been used to explore National Health
Survey data. The choice of division for the scale should be made bearing in mind
the skewed nature of the distribution of the underlying NZDep2006 scores.
Divisions based on unequal sub-sample sizes should be used with caution, as the
precision of any resulting statistics will vary by division category.
Department of Public Health, University of Otago, Wellington
NZDep2006 Index of Deprivation (August 2007)
Figure 1: Distribution of NZDep2006 scores, with the NZDep2006 decile
scale superimposed
838 1619NZDep2006 score
1 2 3 4 5 6 7 8 9 10 NZDep2006 deciles
Variation within communities
There is frequently a considerable amount of variation between neighbourhoods
or small areas within any given larger geographical area. For example, if a
Territorial Authority boundary is used for creating an NZDep profile there may
be pockets of relatively deprived areas and relatively non-deprived areas within
the territorial authority. This point is illustrated in Figure 2, which starts with the
New Zealand population and then focuses on successively smaller areas.
32

Department of Public Health, University of Otago, Wellington
NZDep2006 Index of Deprivation (August 2007)
As can be seen in the New Zealand profile at the top of the figure, there are
approximately equal numbers of people in each NZDep2006 category. They are
not exactly equal because the index is created from a distribution based on small
areas, not on people. When three Territorial Authorities in the Auckland area are
compared, marked differences in their NZDep2006 profiles are observed. Again,
when two different census Area Units from Manakau City are compared, there
are clear differences in their NZDep2006 profiles.
Figure 2: Variation in NZDep2006 profiles
New Zealand
Area Units
Territorial Authorities
Auckland Manukau North Shore
Papatoetoe West Howick Central
33

Department of Public Health, University of Otago, Wellington
NZDep2006 Index of Deprivation (August 2007)
34
Standardisation
Standardisation of the input variables made a small but appreciable difference to
the overall performance of the index. An illustration of the difference is provided
for NZDep96 in Research Report No 8 (Salmond et al., 1998c). Further details
about the standardisation procedure are contained in Appendix three.
Validation
The objective of validation is to confirm the usefulness of the indices. Validation
asks the question: do the indices accurately measure what they purport to
measure, levels of socioeconomic deprivation in small areas? Validation of the
index, in the absence of a gold standard, has consisted of checking for construct
validity and criterion validity.
Construct validity seeks agreement between a theoretical concept, socioeconomic
deprivation in this instance, and the measuring device. We explored construct
validity at the time of the development of NZDep91 with investigations of
technical aspects of the index and exploration of scores in sentinel areas
(Crampton et al., 1997b).
Criterion validity checks how well the measure predicts other variables known to
be associated with the underlying construct, socioeconomic deprivation? The first
two NZDep indexes (NZDep91 and NZDep96) were validated against a number
of health outcome and health behaviour variables (Crampton et al 1997b;
Salmond et al 1998c). In the 2006 Census there is a further opportunity to
validate the NZDep index of deprivation by using the smoking information
provided by adults aged 15 years and over.
There is good evidence in the literature that smoking patterns are strongly
correlated with socioeconomic status (Wilson et al., 2006). Therefore, if

Department of Public Health, University of Otago, Wellington
NZDep2006 Index of Deprivation (August 2007)
35
NZDep2006 is a good indicator of area deprivation, we would expect the
proportions of regular smokers to increase across the deprivation deciles from
least deprived to most deprived. They do.
The percentage of smokers was calculated using only those individuals who
provided information on their census forms. Nationally, this percentage of regular
smokers in the least deprived ten percent of small areas (NZDep2006 decile 1) is
11 percent. This rises through 14, 15, 17, 19, 21, 23, 26, and 29 percent in deciles
2 to 9 respectively, and reaches 36 percent in the most deprived ten percent of
small areas (NZDep2006 decile 10).
This strong validation is in line with the 1996 validation of the smoking
information contained in the 1996 Census (Research report No 8 (Salmond &
Crampton, 1998)). The relationship between area deprivation and smoking
behaviour among various age groups, both sexes, and across ethnic groups was
explored in detail in Salmond & Crampton Deprivation and Health (Salmond &
Crampton, 2000) and in Socioeconomic deprivation and ethnicity are both
important for anti-tobacco health promotion (Crampton et al., 2000b).

Department of Public Health, University of Otago, Wellington
NZDep2006 Index of Deprivation (August 2007)
36
Glossary of terms and abbreviations
Agglomeration Combining areas that are geographically connected.
CAU Census Area Units are administrative areas defined by Statistics
New Zealand. They are also called Area Units.
Deprivation Deprivation is a state of observable and demonstrable
disadvantage relative to the local community or the wider society
or nation to which an individual, family or group belongs
(Townsend, 1987).
Townsend (1987) distinguishes between material and social
deprivation. Material refers to material apparatus, goods,
services, resources, amenities and physical environment and
location of life. Social refers to the roles, relationships,
functions, customs, rights and responsibilities of membership of
society and its subgroups.
Meshblock Meshblocks are the smallest administrative areas used by
Statistics New Zealand. Meshblocks had a median population of
approximately 87 persons in 2006.
NZDep2006 scale A ten category ordinal scale from 1 (assigned to the 10% of
NZDep2006 small areas with the least deprived NZDep2006
scores) to 10 (assigned to the 10% of NZDep2006 small areas
with the most deprived NZDep2006 scores). (Note the wording
to avoid 'reification'—see Cautions, The indicator becomes the
reality.)
NZDep2006 score
The value for a small area is the score for the area on the first

Department of Public Health, University of Otago, Wellington
NZDep2006 Index of Deprivation (August 2007)
37
principal component. The distribution has mean 1000 and
standard deviation 100. The distribution is skewed.
Ordinal scale
A measurement scale having a natural ordering, such as ‘most’ to
‘least’ deprived.
Principal
components
analysis
Principal components analysis is a method of multivariate
analysis that is used to find a few combinations of variables,
called components, that adequately explain the overall observed
variation, and thus reduce the complexity of the data (Kirkwood,
1988).
PSU Primary Sampling Units are small areas defined by Statistics
New Zealand to be approximately 60 households.
SAS SAS refers here to a statistical software suite used in the
production of NZDep2006. The suite is a product of SAS
Institute.
SNZ Statistics New Zealand
Socioeconomic
position Socioeconomic position is a descriptive term for a person’s
position in society, which may be expressed on an ordinal scale
using criteria such as income, educational level obtained,
occupation, value of dwelling place, deprivation of area of
residence, etc.
TA Territorial Authorities are larger administrative areas defined by
Statistics New Zealand.

Department of Public Health, University of Otago, Wellington
NZDep2006 Index of Deprivation (August 2007)
38
Appendix one: Source populations
Data for NZDep are extracted from either individual forms or dwelling forms of
the Census.
Individual form data
Eligible people are those usually resident in New Zealand, even if they are
temporarily absent from their usual residence, but are elsewhere in New Zealand.
Such 'visitors' will have on their individual forms two meshblock identifiers, 1)
meshblock of residence on census night, and 2) meshblock of usual residence.
Using the meshblock of usual residence as the identifier ensures that the entire
usually resident population of New Zealand is included in the calculation of the
following three variables: qualifications, unemployment, and income support.
Dwelling form data
Eligible people are all those living in private dwellings. This excludes people
permanently or temporarily living in hospitals, nursing homes, prisons, retirement
homes, welfare education or relief institutions, defence establishments, hotels,
motels, guest houses, boarding houses, motor camps, construction camps, youth
camps, staff quarters (eg nursing home, seasonal fruit pickers), vessels (except
the navy), communes, marae, and others. Data for people living in non-private
dwellings are not necessarily relevant; for example, housing tenure and
occupancy are not salient characteristics for people in retirement homes. Also
excluded are visitors to private dwellings.
In 2006 there were 6,963 non-private dwellings (Quickstats About Housing,
www.stats.govt.nz). Their residents account for the difference between
Department of Public Health, University of Otago, Wellington
NZDep2006 Index of Deprivation (August 2007)
39
denominators based on the usually resident population from the Census and
denominators based on NZDep developmental source files.
The six dwelling form variables are: household income, crowding, telephone,
vehicle, tenure and family type. The denominators for the proportions using these
variables are all those people living in private dwellings.
Why do we use two different source populations?
The rationale for choosing the source populations was to maximise the amount of
information incorporated into NZDep. Another option would have been to
develop the index restricting both individual form data and dwelling form data to
the usually resident population in private dwellings. This approach would have
omitted information (related to the three non-dwelling variables) from individual
forms from people living in non-private dwellings.
The denominator for rate calculations using NZDep could appropriately be the
usually resident population, or the usually resident population in private
dwellings. We recommend the former; in practice there will be very little
difference.

Department of Public Health, University of Otago, Wellington
NZDep2006 Index of Deprivation (August 2007)
40
Appendix two: Description of variables used in NZDep
Nine deprivation-related variables have been used to create NZDep2006. Two
have already been described under Constructing the index (means tested benefit
status, and household income). The other seven variables are described below.
1. Access to telephone
This question was included for the first time in the 1996 Census of Population
and Dwellings. The access to telephone variable is consistent with the theory of
deprivation, and was included in the principal components analysis, and
subsequently in NZDep96. For NZDep2001 and NZDep2006 mobile phones
were included and the definition of the variable is the proportion of people
without access to either a land-line telephone or a mobile phone in their dwelling
(private dwellings residents only).
2. Unemployed
In the 2006 Census, taken on 7 March, unemployment is defined for all people
aged 15 years and over who, during the week ended 5 March 2006, were without
a paid job, were available for work and: had actively sought work in the past four
weeks (ended 5 March 2006); or had a new job to start within the next four
weeks. For NZDep2006, the unemployed variable refers only to the 18 to 64 year
age group.
3. Single parent families
The following are abbreviated versions of Statistics New Zealand definitions:

Department of Public Health, University of Otago, Wellington
NZDep2006 Index of Deprivation (August 2007)
41
• a family consists of a couple (legal or de facto marriage) with or without
children, or one parent with children (i.e., a brother and a sister is not a
family);
• a household is a group of people who live together whether related or not; and
• a dwelling is the physical structure occupied by a household.
If a three-generation family lives in a dwelling, Statistics New Zealand creates
two families, but each person is only counted once.
Therefore:
• there may be more than one family per household (and therefore per
dwelling); and
• the sum of occupants of households equals the sum of all people in families
and all people not in families.
Our definition of the proportion of single parent families variable is: people less
than 65 in a single parent family with dependent children as a proportion of all
people under 65.
The denominator includes everyone aged under 65 years (i.e. those considered to
be at risk of being in a single parent family). This variable is restricted to those
aged under 65 years in order to avoid inflation of the denominator by large
numbers of elderly people who are less likely to be in a single parent family.
4. No qualifications
The no qualifications variable refers only to the 18 to 64 year age group. No
qualification indicates that no qualification has been obtained from a completed
course of at least three months of full time study.
Department of Public Health, University of Otago, Wellington
NZDep2006 Index of Deprivation (August 2007)
42
5. Dwellings not owner occupied
The housing tenure variable is: proportion of people in dwellings not owner
occupied. Two categories of 'dwelling not owned by usual resident(s)' were used
to capture not owner occupied. The third category, 'dwelling not owned by usual
resident, who do not make rent payments', was treated as not specified since it
was not possible to determine whether this represents an advantage or a
disadvantage (for example, both a farm labourer and a multinational company
executive could have accommodation provided rent free). In 2006, three further
categories involving housing provided by Trusts were introduced as answer
options on the census form. For the purposes of NZDep it was considered that
people living in such Trust accommodation are not deprived.
6. Access to car
This variable measures the proportion of people (children and adults) with no
access to a car. Access to transport (cars) has relevance to children as well as
adults.
7. Occupancy
Occupancy describes the relationship between housing space available and
persons usually resident in the house. For deprivation purposes, the extreme of an
occupancy scale is used. It is usually called overcrowding.
NZDep91 and NZDep96 used a crowding definition consistent with an OECD
standard formula for occupancy. The crowding threshold used was: any
household with greater than one person-equivalent per bedroom. A person-
equivalent was defined following Morrison (1994): children aged 10 and over are
equivalent to one adult; children aged under 10 are equivalent to half an adult.

Department of Public Health, University of Otago, Wellington
NZDep2006 Index of Deprivation (August 2007)
For NZDep2001 the Canadian National Occupancy Standard formula for
calculating occupancy was used. This formula was considered to be a more
precise way of capturing occupancy than the previously used OECD formula.
The Canadian National Occupancy Standard sets the bedroom requirements of a
household according to the following composition criteria (Statistics New
Zealand, 1998, p.79):
• there should be no more than two people per bedroom;
• parents or couples share a bedroom;
• children under five years, either of the same or the opposite sex, may
reasonably share a bedroom;
• children under 18 years of the same sex may reasonably share a bedroom;
• a child aged five to 17 years should not share a bedroom with one under five
of the opposite sex;
• single adults 18 years and over and any unpaired children require a separate
bedroom.
We have continued to use this definition in 2006. The data for 2006 are shown in
Table 6.
Table 6: Crowding index (number of bedrooms over or under those required
by the Canadian National Occupancy Standard) 'Spare' bedrooms Percent Cumulative Percent
(people)
-11 to - 3 1.28 1.28
- 2 2.23 3.51 Deprived
- 1 6.92 10.43
................................................................................................. 2001 and 2006 cut off
0 25.14 35.57
+ 1 33.38 68.94 Not deprived
+ 2 23.40 92.34
+3 to +13 7.66 100.00
43

Department of Public Health, University of Otago, Wellington
NZDep2006 Index of Deprivation (August 2007)
44
Appendix three: Standardisation
Age and sex
All variables are related to age and sex to some extent. Therefore it was
important to standardise for both age and sex, and compare the standardised
indexes with non-age/sex standardised indexes. The resulting comparisons
allowed investigation of the effect of age/sex standardisation on the ranking of
small areas.
The options available for controlling for age and sex confounding were: age/sex
standardisation; stratification; and, restriction. Age/sex standardisation was used
with each variable.
Age/sex standardisation in five year age bands was not possible because of the
problem of small numbers (small areas of about 100-200 people will not allow
full age/sex standardisation). Therefore indirect standardisation was carried out
using four age bands: 0-17; 18-39; 40-64; 65+. The youngest age group, 0-17,
reflects non-voting status and, in general, dependency. The oldest age group, 65
and over, reflects 2006 entitlement to state retirement income, and vulnerability
to changing living arrangements, income levels, employment status, and health
status. The remaining adults have been split into two groups of roughly equal
size: 18-39 and 40-64.
Indirect standardisation
The purpose of standardisation is to remove the effects of age and sex, as far as
possible, from our deprivation variables within each small area. Indirect
standardisation of proportions was used, with the New Zealand population as the
standard population. Indirect standardisation for age and sex was chosen due to
Department of Public Health, University of Otago, Wellington
NZDep2006 Index of Deprivation (August 2007)
the small denominators in each small area observation (see Borman (1992) for
further discussion of indirect standardisation).
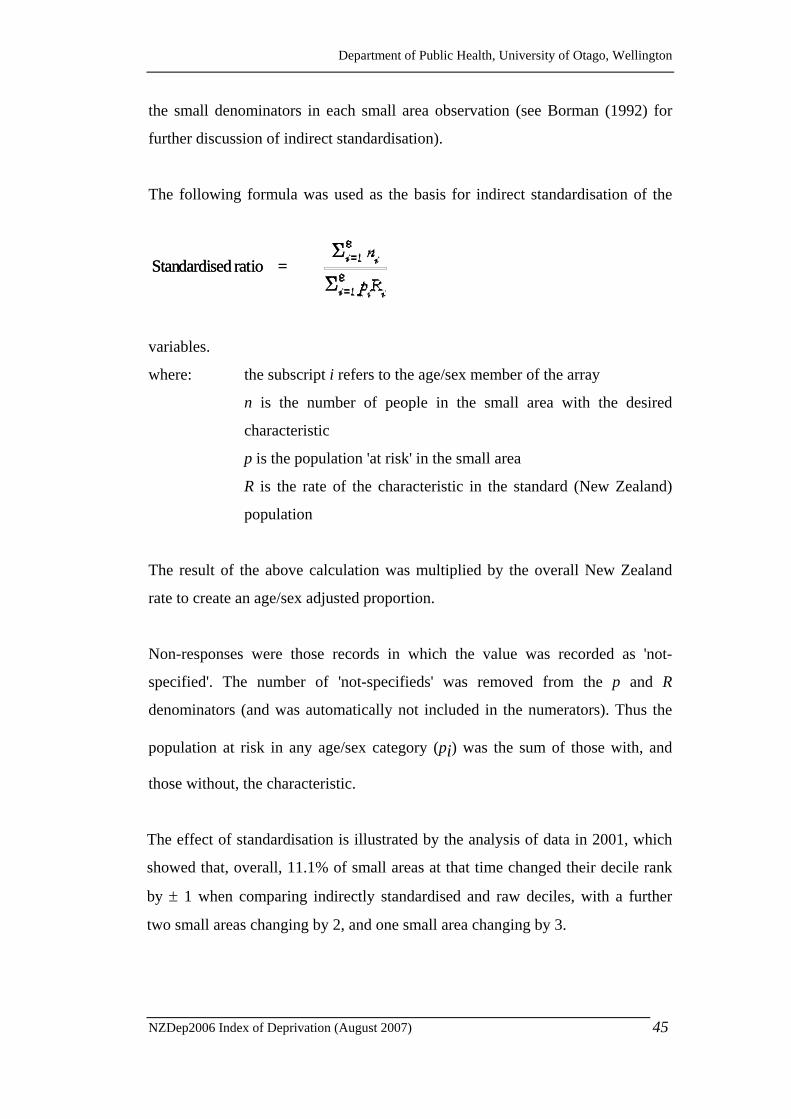
The following formula was used as the basis for indirect standardisation of the
variables.
Standardised ratio = Standardised ratio =
where: the subscript i refers to the age/sex member of the array
n is the number of people in the small area with the desired
characteristic
p is the population 'at risk' in the small area
R is the rate of the characteristic in the standard (New Zealand)
population
The result of the above calculation was multiplied by the overall New Zealand
rate to create an age/sex adjusted proportion.
Non-responses were those records in which the value was recorded as 'not-
specified'. The number of 'not-specifieds' was removed from the p and R
denominators (and was automatically not included in the numerators). Thus the
population at risk in any age/sex category (pi) was the sum of those with, and
those without, the characteristic.
The effect of standardisation is illustrated by the analysis of data in 2001, which
showed that, overall, 11.1% of small areas at that time changed their decile rank
by ± 1 when comparing indirectly standardised and raw deciles, with a further
two small areas changing by 2, and one small area changing by 3.
45
Department of Public Health, University of Otago, Wellington
NZDep2006 Index of Deprivation (August 2007)
46
Ethnicity
Ideally proportions should have been standardised by ethnicity (European, Maori,
Pacific Island, other) as well as by age and sex. However, small numbers per
ethnic group in NZDep small areas preclude standardising for this variable on top
of age and sex. This is of no concern in funding formula applications since they
treat ethnicity explicitly along with age and sex.
Department of Public Health, University of Otago, Wellington
NZDep2006 Index of Deprivation (August 2007)
47
Appendix four: Methodological issues
Equivalisation
Equivalence scales are “measures of the relative incomes needed by different
types of families to attain the same material standard of living” (Whiteford,
1983). Equivalised household income was used for calculating the income
variable so that, for example, the standard of living of a household consisting of a
single person with an income of $40,000 could be compared to that of a
household consisting of two adults and six children on an income of $40,000.
The revised Jensen scale was chosen for use in the equivalised measures of
income (Jensen, 1978; Jensen, 1988). A two adult family is used (arbitrarily) as
the 'reference household' (expenditure = 1.0), and figures are given for different
family configurations (up to six children). Hence, for example, to obtain an
equivalent standard of living as a two adult family, a family comprised of two
adults and two children would require 1.41 times the income of the two adult
family.
Structural zeros
The research considered the implications of meshblocks with no one in certain
age/sex groups.
Taking a meshblock with no one aged 65 or over in it as an example then
proportions of those aged 65 or over with certain characteristics are
mathematically not defined. In a SAS programme the proportion would be given
a missing value. This, in turn, means that no principal component score could be
calculated for this meshblock.
Department of Public Health, University of Otago, Wellington
NZDep2006 Index of Deprivation (August 2007)
48
Conceptually, if there is no one in a meshblock aged 65 or over then the
meshblock is not deprived from the point of view of, say, elderly people with no
access to a telephone in their dwelling. Thus the proportion in the meshblock
deprived in this way was defined to be zero. This allowed the meshblock to be
allocated a meaningful principal component score.
Not specified
'Not specified' refers to census questions for which there was no response.
Values for 'not specified' were not included in denominators for the input
variables for the principal components analysis.
A simple modelling exercise carried out for the 1991 Census dataset indicated
that there would be little to choose between including the 'not-specifieds' and
excluding them. The bias when 'not-specifieds' are included is always negative,
whereas the sign of the bias can vary when the 'not-specifieds' are left out.
Department of Public Health, University of Otago, Wellington
NZDep2006 Index of Deprivation (August 2007)
49
Appendix five: Longitudinal analyses
Introduction
The NZDep2006 index of deprivation is the fourth census-based NZDep index to
be produced (the earlier ones were NZDep91, NZDep96 and NZDep2001). The
first two were created one year apart in calendar time, and the second, NZDep96,
was improved in two ways. First, we dropped two variables for theoretical
reasons. Second we were able to include another deprivation variable into
NZDep96 from a new question in the 1996 Census relating to whether people had
access to a telephone or not. These changes—from ten variables in the 1991
version to nine variables in the 1996 version, eight of which were common to
both indexes—mean that these indexes should be compared with caution. There
are, in addition, technical reasons to be cautious (see below).
There are fewer obvious differences between the 1996 and 2001 versions of
NZDep, or between the 2001 and 2006 versions. We are aware that many
researchers would like to use the index to inform longitudinal studies. We can
distinguish two types of longitudinal study—those comparing areas over time,
and those looking for changes in the relationship between deprivation and some
other variable (e.g. mortality) over time.
Our conclusions are that:

Department of Public Health, University of Otago, Wellington
NZDep2006 Index of Deprivation (August 2007)
50
1. COMPARISONS OF AREAS as small as single meshblocks across
time may not be meaningful. Comparisons of areas at a higher
aggregation, such as Territorial Authorities, or Area Units,
should be reasonable, although we advise caution in
interpreting small changes over time as being practically
meaningful. See Comparing areas over time below.
2. Comparing RELATIONSHIPS between deprivation and another
variable, over time, is reasonable. See Comparing relationships
with deprivation over time below.
Note that each NZDep index of relative deprivation (NZDep91, NZDep96,
NZDep2001 and NZDep2006) divides the country into 10, where the highest
value indicates the 10% of NZDep[year] small areas with the most deprived
NZDep[year] scores. It is important to remember that by definition 10% of small
areas will always fall into the most deprived group—irrespective of the absolute
deprivation in those areas at that time, or the overall wealth of the country.
Comparing areas over time
Meshblocks can change deprivation values between any two censuses for both
substantive and technical reasons.
Department of Public Health, University of Otago, Wellington
NZDep2006 Index of Deprivation (August 2007)
51
1. Substantive reasons
a) The local neighbourhood has changed in population size and/or
characteristics through housing development—such as new subdivisions,
or inner-city apartments created in disused office or warehouse space, or
housing demolition.
b) The local neighbourhood has changed in characteristics through changes
in house ownership.
These changes may give rise to either or both of two consequences:
a) the usually resident population size in the meshblock changes somewhat
and the meshblock boundary remains unchanged; and/or
b) the usually resident population size increases substantially and Statistics
New Zealand splits the original meshblock into two (or more) new
meshblocks. In this case the original seven-digit meshblock number is
discontinued and new ones are created with the same first five digits.
Thus the original meshblock number would end with the two digits ‘00’.
If necessary, it is then split into (say) two meshblocks with the same first
five digits and the endings ‘01’ and ’02’, while the ‘00’ number is
discontinued. If, later, the ‘02’ meshblock needs to be split, the ‘02’
number is discontinued and (if it is again split in two) the numbers ’03’
and ‘04’ are used.
These substantive changes can thus give rise to new meshblocks that are not
readily comparable to old ones as well as to meshblocks that have
‘legitimately’ changed NZDep values through changes in population
composition.

Department of Public Health, University of Otago, Wellington
NZDep2006 Index of Deprivation (August 2007)
52
2. Technical reasons
a) Small area definitions are not always identical from one Census to the
next.
Small areas are defined on the basis of the current usually resident
population count, where meshblocks with usually resident populations
under 100 are agglomerated (pooled) within Statistics New Zealand’s
internal Primary Sampling Unit (PSU) boundaries, if this is possible.
PSUs usually contain one or two meshblocks, but may contain more
(often with very small population counts).
Our agglomeration algorithm creates small areas by pooling small
meshblocks, if necessary, as they increase in population count, until the
pooled group contains at least 100 people, if that is possible. On a second
pass, working from smallest to largest small area, any remaining too-
small areas are agglomerated with the next smallest area(s), again if this is
possible within the PSU boundary. The resulting census-time-specific
small-areas thus have the least number of constituent meshblocks
consistent with the dual requirements of at least 100 people usually
resident and boundaries within a single PSU. The result (in 2006) is over
23,000 small areas constructed from over 40,000 meshblocks.
Thus the agglomeration procedure applied to different censuses inevitably
changes the composition of some of the small-areas as a result of changes
in the size of the New Zealand population and changes in the occupiers of
individual homes.
The NZDep index is created from proportions created for each small-area.
Changed small-area boundaries may give rise to somewhat different
constituent populations from which proportions are derived. This may
result in changes in the final NZDep value for the constituent meshblocks
for the small-area (which are each given the small-area NZDep value).
Department of Public Health, University of Otago, Wellington
NZDep2006 Index of Deprivation (August 2007)
53
Such a change, therefore, may have more to do with the boundary
changes for the small-area than any changed circumstances among the
residents.
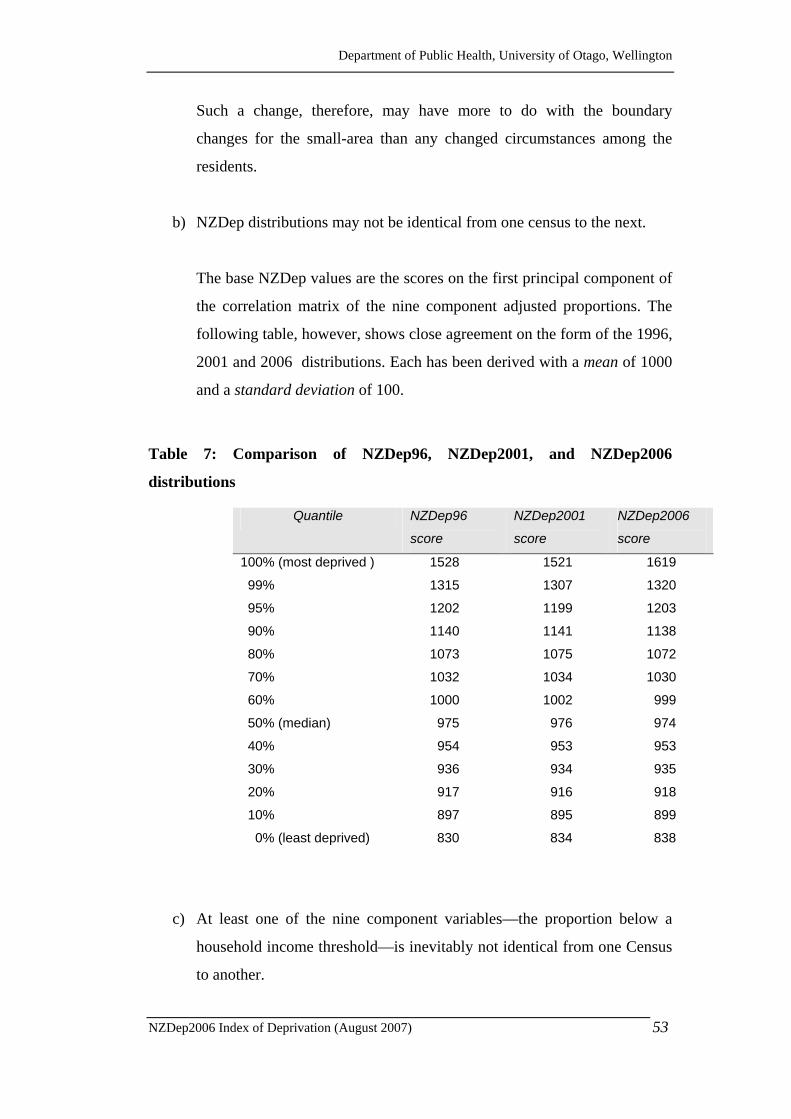
b) NZDep distributions may not be identical from one census to the next.
The base NZDep values are the scores on the first principal component of
the correlation matrix of the nine component adjusted proportions. The
following table, however, shows close agreement on the form of the 1996,
2001 and 2006 distributions. Each has been derived with a mean of 1000
and a standard deviation of 100.
Table 7: Comparison of NZDep96, NZDep2001, and NZDep2006
distributions
Quantile NZDep96
score
NZDep2001
score
NZDep2006
score
100% (most deprived ) 1528 1521 1619
99% 1315 1307 1320
95% 1202 1199 1203
90% 1140 1141 1138
80% 1073 1075 1072
70% 1032 1034 1030
60% 1000 1002 999
50% (median) 975 976 974
40% 954 953 953
30% 936 934 935
20% 917 916 918
10% 897 895 899
0% (least deprived) 830 834 838
c) At least one of the nine component variables—the proportion below a
household income threshold—is inevitably not identical from one Census
to another.

Department of Public Health, University of Otago, Wellington
NZDep2006 Index of Deprivation (August 2007)
54
Changes to the income categories in Census forms, due to changes in
dollar values, give rise to changes in the household income variable, as
this assumes the mid-point of the category as the income for the purpose
of adding up incomes over family members (except for the last income
bracket where sample survey data are used to estimate the median). This
gives rise to a finite number of possible family incomes, depending on the
number of earners in the family and what each of them is estimated to
earn. In turn, this yields a finite number of equivalised household incomes
(that is, incomes adjusted to take account of the size and composition of
the household). From the distribution of people within these categories we
have to decide which of these finite values will be the threshold below
which we will define a household, or people, to have a ‘low’ equivalised
household income. The threshold of equivalised household income used
in 1996 was 17,100 ‘equivalised dollars’, which cut off 13.9 percent of
households; in 2001 it was 17,700 ‘equivalised dollars’, which cut off
15.0 percent of people. (The change from household to people is due to
the fact that, in 2001, Statistics New Zealand staff provided the
information in the raw data set of individuals, whereas, in 1996, the
information was calculated in the data laboratory and the decision was
made from a household file.) The change between 2001 and 2006 is,
however, slight, as the threshold in 2006 cuts off 14.96% of people.
As a result of the inevitable changed proportions of individuals living in
households below the equivalised income threshold, there has been a
slight difference in information being added to the composite NZDep
index, though this is very small in the last two indexes – and will have
been swamped by changes in the underlying monetary value.
d) One further variable—crowding—was deliberately changed between the
1996 and 2001 censuses, but has remained consistent from 2001 to 2006.
The crowding definition used in the 1996 NZDep calculations was the
OECD definition which counted the number of people in a household and

Department of Public Health, University of Otago, Wellington
NZDep2006 Index of Deprivation (August 2007)
55
the number of bedrooms available to it (see Urlich Cloher & Murphy,
1994). A ratio of more than one 'equivalent' person per bedroom was
defined to be ‘crowded’ for the purposes of establishing the proportion of
people in a small area living in ‘crowded’ accommodation. A person-
equivalent was defined following Morrison (1994): children aged 10
years and over are equivalent to one adult; children aged under 10 years
are equivalent to half an adult.
In the 2001 and 2006 indexes we have improved our indicator of
crowding by using the Canadian definition (Statistics New Zealand, 1998,
p.79) which allows couples and certain small children (on the basis of
their ages and sexes) to share a bedroom (see Occupancy in Appendix
two). This has resulted in a better performance for the indicator in the
principal component analysis. Whereas the OECD-defined variable in
1996 had a weight of 0.228, which was the lowest of all the weights
(range 0.228 – 0.363), the Canadian-defined variable in 2001 had a
weight of 0.309, again the lowest, but in closer alignment with the other
eight coefficients (range 0.312 – 0.361). In 2006, the weight was similar
to 2001 (0.318), and again in close alignment with the other weights
(range 0.311 – 0.371).
As a result of the change in crowding definition, there is a slight
difference in information being added to the composite NZDep96 and
NZDep2001 indexes, but not between the last two indexes, NZDep2001
and NZDep2006.
Despite the above technical changes, it must be remembered that the
purpose of pooling information from nine deprivation-related
characteristics is to describe an underlying, but not directly measurable,
axis identified as ‘area deprivation’. We use the best information
available from each Census to define this axis. By using a reasonable
number (nine or ten) of inter-related and measurable theoretical
deprivation variables in a standard analytic procedure, we have attempted
Department of Public Health, University of Otago, Wellington
NZDep2006 Index of Deprivation (August 2007)
56
to define the same not-directly-measurable axis at each census-time. In
that sense, the several NZDep indexes are comparable.
The index created along the small-area deprivation axis at a particular
time is a relative one, separating one small-area from another relative to
the overall distribution of deprivation at that time. In that sense, the
several NZDep indexes are again comparable. However, not much weight
should be given to a meshblock’s small change in relative position over
time. In practice the small change might easily be one decile point simply
because the change in underlying score, although very small, crosses a
decile boundary. Even changes of two decile points may not indicate a
large change in underlying deprivation score if they are not at the
extremes of the decile distribution (say, if they are within deciles 2, 3, 4,
5, 6, 7 and 8).
As a result of all of the above, we conclude:
COMPARISONS OF AREAS as small as single meshblocks across time
may not be meaningful. Comparisons of areas at a higher
aggregation, such as Territorial Authorities, or Area Units,
should be reasonable, although we advise caution in interpreting
small changes over time as being practically meaningful.
Comparing relationships with deprivation over time
It is reasonable to compare relationships between deprivation deciles and a given
outcome over time, for the same aggregated area, using graphical approaches,
time series regressions, etc. The hypothetical data in the figure below illustrate
how such comparisons might be undertaken graphically. Each of the bars

Department of Public Health, University of Otago, Wellington
NZDep2006 Index of Deprivation (August 2007)
represents people living in areas which are in nationally-defined deprivation
deciles, and the nationally-defined deprivation deciles have a nearly consistent
meaning, on a relative scale, regardless of time.
Figure 3: Comparing deprivation deciles over time using hypothetical
outcome data
0
5
10
15
20
25
1 2 3 4 5 6 7 8 9 10
NZDep decile
NZDep91
NZDep96
NZDep2001
NZDep2006
We conclude:
Comparing RELATIONSHIPS between deprivation and another
variable, over time, is reasonable.
57
Department of Public Health, University of Otago, Wellington
NZDep2006 Index of Deprivation (August 2007)
58
References
Abas, M., Vanderpyl, J., Robinson, E. and Crampton, P. (2003), 'More
deprived areas need a greater number of psychiatric beds', Australian and
New Zealand Journal of Psychiatry, 37, 437-444.
Abas, M., Vanderpyl, J., Robinson, E., Leprou, T. and Crampton, P. (2006),
'Socio-economic deprivation and duration of hospital stay in severe
mental disorder', British Journal of Psychiatry, 188, 581-582.
Borman, B. (1992), The Standardisation of Rates, Wellington, Department of
Health.
Carr-Hill, R. and Chalmers-Dixon, P. (2002), 'A review of methods for
monitoring and measuring social inequality, deprivation, and health
inequality' (June 2002 Edition),
www.sepho.org.uk/HealthInequalities/carrhill/empty.htm
Crampton, P., Salmond, C. and Sutton, F. (1997a), 'NZDep91: a new index of
deprivation', Social Policy Journal of New Zealand, 9, 186-193.
Crampton, P., Salmond, C. and Sutton, F. (1997b), Research Report No 5:
NZDep91 Index of Deprivation, Wellington, Health Services Research
Centre.
Crampton, P., Salmond, C. and Sutton, F. (1997c), NZDep91 Index of
Deprivation Instruction Book, Wellington, Health Services Research
Centre.
Crampton, P., Salmond, C. and Sutton, F. (1997d), NZDep91 Index of
Deprivation Look Up Directory, Wellington, Health Services Research
Centre.
Crampton, P., Salmond, C. and Sutton, F. (1997e), The NZDep91 index of
deprivation, in Crampton, P. and Howden-Chapman, P. (eds.),
Socioeconomic Inequalities and Health - Proceedings of the
Socioeconomic Inequalities and Health Conference, Wellington,
December 9-10, 1996, Wellington, Institute of Policy Studies, Victoria
University of Wellington.
Department of Public Health, University of Otago, Wellington
NZDep2006 Index of Deprivation (August 2007)
59
Crampton, P. and Davis, P. (1998), Measuring deprivation and socioeconomic
status: why and how, The New Zealand Public Health Report, 5, 81-84.
Crampton, P., Salmond, C., Kirkpatrick, R., Scarborough, R. and Skelly, C.
(2000a), Degrees of Deprivation in New Zealand: An atlas of
socioeconomic difference, Auckland, David Bateman Ltd.
Crampton, P., Salmond, C., Woodward, A. and Reid, P. (2000b),
'Socioeconomic deprivation and ethnicity are both important for anti-
tobacco health promotion', Health Education and Behaviour, 27, 317-327.
Crampton, P. and Salmond, C. (2000c), 'Socioeconomic deprivation and
hospitalisation rates in New Zealand', Australasian Epidemiologist, 7, 20-
24.
Crampton, P., Salmond, C. and Kirkpatrick, R. (2004), Degrees of
Deprivation in New Zealand: An atlas of socioeconomic difference. 2nd
Edition, Auckland, David Bateman Ltd.
HURA Research Alliance, McLeod, D., Cormack, D., Love, T., Salmond, C.,
Robson, B., Dowell, A., Howard, M., Crampton, P. and Ramage, S.
(2006), 'Ethnicity, socioeconomic deprivation and consultation rates in
New Zealand general practice', Journal of Health Services Research &
Policy, 11, 141-149.
Inskip, H., Beral, V., Fraser, P. and Haskey, J. (1983), 'Methods for age-
adjustment of rates', Statistics in Medicine, 2, 4, 455-66.
Jensen, J. (1978), Minimum income levels and income equivalence scales,
Wellington, Department of Social Welfare.
Jensen, J. (1988), Income equivalences and the selection of family expenditures
on children, Wellington, Department of Social Welfare.
Love, T. and Crampton, P. (2001), 'Deprivation profiles in Wellington IPA
practices.' New Zealand Family Physician, 28, 327-332.
McFadden, K., McConnell, D., Salmond, C., Crampton, P. and Fraser, J.
(2004), 'Socioeconomic deprivation and the incidence of cervical cancer
in New Zealand: 1988-1998', New Zealand Medical Journal, 117, 1206.
Mitchell, E., Stewart, A., Crampton, P. and Salmond, C. (2000), 'Deprivation
and sudden infant death syndrome', Social Science and Medicine, 51, 147-
150.

Department of Public Health, University of Otago, Wellington
NZDep2006 Index of Deprivation (August 2007)
60
Morrison, P. (1994), 'Housing occupancy and the changing size of households
and dwellings in New Zealand 1951-1991', New Zealand Population
Review, 20, 69-100.
Reinken, J., McLeod, J. and Murphy, T. (1985), Health and Equity,
Wellington, Department of Health.
Salmond, C., Crampton, P. and Sutton, F. (1998a), NZDep96 Index of
Deprivation Instruction Book, Wellington, Health Services Research
Centre.
Salmond, C., Crampton, P. and Sutton, F. (1998b), NZDep96 Index of
Deprivation Look Up Directory, Wellington, Health Services Research
Centre.
Salmond, C., Crampton, P. and Sutton, F. (1998c), Research Report No 8,
NZDep96 Index of Deprivation, Wellington, Health Services Research
Centre.
Salmond, C., Crampton, P. and Sutton, F. (1998d), 'NZDep91: a new index of
deprivation', Australian and New Zealand Journal of Public Health, 22,
95-97.
Salmond, C., Crampton, P., Hales, S., Lewis, S. and Pearce, N. (1999),
'Asthma prevalence and deprivation: a small area analysis', Journal of
Epidemiology and Community Health, 53, 476-480.
Salmond, C. and Crampton, P. (2000), Deprivation and Health, in Howden-
Chapman, P. and Tobias, M. (eds.), Social Inequalities in Health: New
Zealand 1999, Wellington, Ministry of Health.
Salmond, C. and Crampton, P. (2001), NZDep96 - What does it measure?,
Social Policy Journal of New Zealand, 17, 82-100.
Salmond, C. and Crampton, P. (2002a), 'Heterogeneity of deprivation within
very small areas', Journal of Epidemiology and Community Health, 56,
669-670.
Salmond, C. and Crampton, P. (2002b), NZDep2001 Index of Deprivation,
Wellington, Department of Public Health, Wellington School of Medicine
and Health Sciences.
Salmond, C. and Crampton, P. (2002c), NZDep2001 Users Manual.
Wellington, Ministry of Health.

Department of Public Health, University of Otago, Wellington
NZDep2006 Index of Deprivation (August 2007)
61
Salmond, C., King, P., Crampton, P. and Waldegrave, C. (2006), 'NZiDep: A
New Zealand index of socioeconomic deprivation for individuals', Social
Science & Medicine, 62, 1474-1485.
Statistics New Zealand (1998), New Zealand Now: Housing, Wellington,
Statistics New Zealand.
Stephens, R. and Waldegrave, C. (2001), 'The effectiveness of the transfer and
tax system in reducing poverty in 1998', Social Policy Journal of New
Zealand, 16, 76-107.
Tobias, M., Salmond, C., Crampton, P., Chan, M., Marmot, M. and Reid, P.
(2001), Life Expectancy and Small Area Deprivation in New Zealand.
Public Health Intelligence Occasional Bulletin No 6., Wellington,
Ministry of Health.
Townsend, P. (1987), 'Deprivation', Journal of Social Policy, 16, 125-146.
Urlich Cloher, D. and Murphy, L. (1994), 'Maori housing needs (Northland)'.
Whiteford, P. (1983), 'A family's needs: equivalence scales and social security',
Social Security Journal, December, 54-61.
Wilson N, Blakely T, Tobias M. (2006), 'What potential has tobacco control for
reducing health inequalities? The New Zealand situation.' International
Journal for Equity in Health, 5,14.