nyserda cleaner greener communities / climate smart
TRANSCRIPT

NYSERDACleaner Greener Communities / Climate Smart CommunitiesRegional Level GHG Reporting Template
Instructions
Please use this template to report summary regional GHG inventories to NYSERDA as part of your final deliverables for the regional GHG inventory. Fill it out and rename the sheet "REDC_NAME.CGC Final GHG Inventory.2010.xlxs".
In this template there are two tabs, "Emissions by Source" and the "Roll Up Report". Emissions by Source shows all direct and indirect emissions sources considered by the GHG Working Group for inclusion in the inventory, and the Roll Up Report reflects the consensus decision for which sources are to be included when totaling the regions GHG inventory into a single number . The final submission should the two tabs for the REDC in total, and two additional tabs for each county separately. For county tab names, please rename "REDC" to the name of the county.
We understand each region will have its own custom way of managing data and calculations so please cut and paste summary results from from your own data sheets into this template. Although you may create dynamic links to this template from your analysis sheets when filling it out, please submit this template without these links.
Protocol Compliance Statements. In the REDC level tabs only, please fill in Columns P through R, and indicate if your methods adhered to methods in Column O that summarize NY GHG Working Group consensus decisions with "Rec" standing for the recommended methods and "Alt" standing for an acceptable alternative methods. Its not required that all methods adhere to the recommended or alternate methods, but please indicate any deviations, justifications, findings, or recommendations you have for additional methods to consider. It may help you to select Columns O-P and choose the "wrap text" format to help you read the methods.
Please Fill in the Summary Table on the Cover Sheet tab to the right at the conclusion of filling out there data sheets. You may dynamically link these numbers to the other sheets in this template.
Color Coding- in general a Green cell requires a value or entry, a while cell is optional.

Reporting Region North Country
REDC Emissions Summary, by County
Roll Up Numbers, MTCDE (MT CO2e) Population
MTCO2e per capita
Clinton 1,179,287 82,128 14.36 Essex 868,508 39,370 22.06 Franklin 604,809 51,599 11.72 Hamilton 178,906 4,836 36.99 Jefferson 1,537,205 116,229 13.23 Lewis 606,948 27,087 22.41 St. Lawrence 1,747,699 111,944 15.61 REDC in Total (w/out aircraft) 6,723,362 433,193 15.52 REDC in Total (w/out aircraft) 6,723,362 433,193 15.52 REDC in Total (w/ aircraft) 6,734,758 433,193 15.55

REDC / County Name North Country
Color CodeREQUIRED, though some data may be zero or considered to small to countOPTIONALDO NOT Report Data in these cells
Scope 1 Scope 2 Scope 3 Biogenic Metric Unit ValueBuilt Environment Residential Energy Consumption
NC Electricity Consumption Electricity / Steam 325,724 Yes Consumption MMBTU 4,896,765 NC Direct Residental Fuel Consumption Natural Gas 290,410 Yes Consumption MMBTU 5,471,996 NC Direct Residental Fuel Consumption Propane / LPG 103,286 Yes Consumption MMBTU 1,428,293 NC Direct Residental Fuel Consumption Distillate Fuel Oil (#1, #2, Kerosene) 432,290 Yes Consumption MMBTU 5,825,306 NC Direct Residental Fuel Consumption Wood 16,477 323,887 Yes Consumption MMBTU 8,347,161
Commercial Energy Consumption
NC Electricity Consumption Electricity / Steam 178,964 Yes Consumption MMBTU 2,690,450 NC Commercial Direct Fuel Consumption Natural Gas 204,913 Yes Consumption MMBTU 3,861,032
NC Commercial Direct Fuel Consumption Propane / LPG 40,396 Yes Consumption MMBTU 638,891
NC Commercial Direct Fuel Consumption Distillate Fuel Oil (#1, #2, Kerosene) 395,820 Yes Consumption MMBTU 5,333,853
NC Commercial Direct Fuel Consumption Residual Fuel Oil (#4 and #6) Yes Consumption MMBTU
NC Commercial Direct Fuel Consumption Coal 357 Yes Consumption MMBTU 3,478
NC Commercial Direct Fuel Consumption Wood 6,474 307,647 Yes Consumption MMBTU 3,279,824 Industrial Energy Consumption
NC Electricity Consumption Electricity / Steam 269,206 Yes Consumption MMBTU 4,047,096
NC Industrial Title V Consumption Natural Gas 186,750 Yes Consumption MMBTU 3,518,810
NC Industrial Title V Consumption Propane / LPG 1,701 Yes Consumption MMBTU 26,909
NC Industrial Title V Consumption Distillate Fuel Oil (#1, #2, Kerosene) 1,285 Yes Consumption MMBTU 17,318
NC Industrial Title V Consumption Residual Fuel Oil (#4 and #6) 262,255 Yes Consumption MMBTU 3,480,538
NC Industrial Title V Consumption Coal Yes Consumption MMBTU
NC Industrial Title V Consumption Wood 1,928 91,613 Yes Consumption MMBTU 976,685 Energy Generation and Supply Energy Generation and Supply
NC Elec Generation GHG Analysis Coal and Coke 106,709 No Consumption MMBTU 1,111,229
NC Elec Generation GHG Analysis Natural Gas 214,993 No Consumption MMBTU 4,050,971 NC Elec Generation GHG Analysis Distillate Fuel Oil (#1, #2 and #4) 954 No Consumption MMBTU 12,861
NC Elec Generation GHG Analysis Residual Fuel Oil (#4 and #6) 81,846 No Consumption MMBTU 1,086,225
NC Elec Generation GHG Analysis Wood / Biomass 7,106 337,659 No Consumption MMBTU 3,599,772
NC Elec Generation GHG Analysis MSW and landfill emissions 223 44,300 No MSW Combusted MMBTU 850,779
DRAFT Reporting Template CGC. Emissions in MTCDERolled Up?
Related GHG Metrics / Activity Data
REDC Emissions By Source and SectorYear: 2010

NC Elec Generation GHG Analysis Other 2,978 33,859
NC Elec Generation GHG Analysis Electricity T/D Losses 45,041 Yes Losses MMBTU 677,117
NC Elec Generation GHG Analysis and NC Direct Fuel Consumption Natural Gas T/D Losses 126,913 Yes Losses MMBTU
NC Electricity Consumption Use of SF6 in the Utility Industry 10,359 Yes Consumption MMBTUIndustrial Processes Industrial ProcessesNot Reported Cement Production YesNC Industrial Sources Iron and Steel Production YesNC Industrial Sources Ferroalloy Production YesNot Reported Aluminum Production 234,165 YesNot Reported Paper and Pulp 33,205 YesNot Reported Limestone Use YesNot Reported Soda Ash Use YesNot Reported Semi-Conductor Manufacturing YesNot Reported Glass Production YesNot Reported Chemical Manufacturing YesProduct Use (Ozone Depleting Substances) Product Use (Ozone Depleting Substances)
NC Industrial Sources All Refrigerants- except SF6 99,181 Yes

Transportation Energy On-road
NC Emission Summary - Onroad Motor Gasoline (E-10) 1,545,164 112,144 Yes Consumption MMBTU 23,564,075
NC Emission Summary - Onroad Diesel 421,448 Yes Consumption MMBTU 5,679,245
Not Reported Ethanol (E-85) No Consumption MMBTU
Not Reported Biodiesel No Consumption MMBTU
Not Reported Electricity Consumption No Consumption MMBTURail
NC Emission Summary - Rail Diesel 71,649 Yes Consumption MMBTU 965,503
NC Emission Summary - Rail Electricity Consumption Yes Consumption MMBTUMarine
NC Emission Summary -Com Marine Gasoline Yes Consumption MMBTU
NC Emission Summary -Com Marine Distillate Fuels 28,744 Yes Consumption MMBTU 387,332
NC Emission Summary -Com Marine Residual Fuels 27,070 Yes Consumption MMBTU 359,267 Air
NC Emission Summary-Aircraft All Fuels (Jet and Aviation Gasoline) 11,396 No Consumption MMBTU 157,352 Non-road Mobile
NC Emission Summary-Nonroad All Fuels (Diesel and Gasoline) 566,620 Yes Consumption MMBTU 7,930,171 Waste Management Solid Waste Management
NC Waste Landfill Methane and Combustion 120,749 97,305 Yes - ONLY Scope 3 MSW+CD Generated Tonnes 318,273
Not Reported MSW incineration (non grid connected) Yes MSW+CD Processed Tonnes 394,956 Sewage Treatment MSW Sent for Incineration Tonnes
NC Waste water Central WWTPs and Septic Systems 40,000 Yes MSW incinerated in Boundary TonnesAgriculture LivestockGHG_NC_Agriculture Enteric Fermentation 519,547 YesGHG_NC_Agriculture Manure management 107,207 Yes
Crop Production and Soil ManagementGHG_NC_Agriculture Use of Fertilizer 31,506 YesNot Reported Crop Residue Incineration NoLand Use and ForestryGHG_NC_Forest Urban Forest Annual Reserve 189,177 No
GHG_NC_Forest Forest Carbon Reserve (TOTAL) 1,098,222,727 No
Grand Totals Gross Totals 5,807,122 818,935 97,305 6,723,362 Total with Aircraft (as reported in NC Sustainability Plan) 5,818,518 818,935 97,305 - 6,734,758 Net Totals

Summary of Protocol Decisions for Required Tier II Source (Green Box Sources) "Rec" - recommended, "Alt" means acceptable alternativeYes No Brief Description of Method and Issues
(Rec) - Utility Supplied Data, (Alt 1) - extrapolation from partial set, (Alt 2) EIA allocation based HDD and Housing Unit Size XActual electricity sales data is provided by National Grid, NYSEG, and municipal utilities.
(Rec) - Utility Supplied Data, (Alt 1) - extrapolation from partial set, (Alt 2) EIA allocation based HDD and Housing Unit Size X As stated(Rec) Allocated EIA SEDS residential state consumption to counties based on Home Heating Fuel, HDD, and Housing Unit Size As stated(Rec) Allocated EIA SEDS residential state consumption to counties based on Home Heating Fuel, HDD, and Housing Unit Size As stated(Rec) Allocated EIA SEDS residential state consumption to counties based on Home Heating Fuel, HDD, and Housing Unit Size
(Rec) - Utility Supplied Data, (Alt 1) - extrapolation from partial set, (Alt 2) EIA allocation based on Fuel Oil Recommended method. XActual electricity sales data is provided by National Grid, NYSEG, and municipal utilities.
(Rec) - Utility Supplied Data, (Alt 1) - extrapolation from partial set, (Alt 2) EIA allocation based on Fuel Oil Recommended method. X As stated(Rec) Allocated EIA SEDS commercial state consumption to counties based on Home Heating Fuel, HDD, employment and Commercial Square Footage. (Alt) Allocation based on Home Heating, HDD, and Employment only. X As stated(Rec) Allocated EIA SEDS commercial state consumption to counties based on Home Heating Fuel, HDD, employment and Commercial Square Footage. (Alt) Allocation based on Home Heating, HDD, and Employment only. X As stated(Rec) Allocated EIA SEDS commercial state consumption to counties based on Home Heating Fuel, HDD, employment and Commercial Square Footage. (Alt) Allocation based on Home Heating, HDD, and Employment only. X As stated(Rec) Allocated EIA SEDS commercial state consumption to counties based on Home Heating Fuel, HDD, employment and Commercial Square Footage. (Alt) Allocation based on Home Heating, HDD, and Employment only. X As stated(Rec) Allocated EIA SEDS commercial state consumption to counties based on Home Heating Fuel, HDD, employment and Commercial Square Footage. (Alt) Allocation based on Home Heating, HDD, and Employment only. X As stated
(Rec) - Utility Supplied Data, (Alt 1) - extrapolation from partial set, (Alt 2) allocate SEDS EIA data based allocated by industrial employment XActual electricity sales data is provided by National Grid, NYSEG, and municipal utilities.
(Rec) - Pie Slice Method. (1) Allocate directly all Title 5 / MMR reporting industrial facilities to the counties / municipalities. (2) compute total statewide industrial fuel use for all Title 5 / EPA MMR reporting facilities and subtract that from the EIA SEDS reported fuel use for the industrial sector (3) allocate the balance from step 2 to counties by industrial employment for manufacturing. The balance is assumed to represent smaller industry that does not report under Title 5 regulations. X(Rec) - Pie Slice Method. (1) Allocate directly all Title 5 / MMR reporting industrial facilities to the counties / municipalities. (2) compute total statewide industrial fuel use for all Title 5 / EPA MMR reporting facilities and subtract that from the EIA SEDS reported fuel use for the industrial sector (3) allocate the balance from step 2 to counties by industrial employment for manufacturing. The balance is assumed to represent smaller industry that does not report under Title 5 regulations. X(Rec) - Pie Slice Method. (1) Allocate directly all Title 5 / MMR reporting industrial facilities to the counties / municipalities. (2) compute total statewide industrial fuel use for all Title 5 / EPA MMR reporting facilities and subtract that from the EIA SEDS reported fuel use for the industrial sector (3) allocate the balance from step 2 to counties by industrial employment for manufacturing. The balance is assumed to represent smaller industry that does not report under Title 5 regulations. X(Rec) - Pie Slice Method. (1) Allocate directly all Title 5 / MMR reporting industrial facilities to the counties / municipalities. (2) compute total statewide industrial fuel use for all Title 5 / EPA MMR reporting facilities and subtract that from the EIA SEDS reported fuel use for the industrial sector (3) allocate the balance from step 2 to counties by industrial employment for manufacturing. The balance is assumed to represent smaller industry that does not report under Title 5 regulations. X(Rec) - Pie Slice Method. (1) Allocate directly all Title 5 / MMR reporting industrial facilities to the counties / municipalities. (2) compute total statewide industrial fuel use for all Title 5 / EPA MMR reporting facilities and subtract that from the EIA SEDS reported fuel use for the industrial sector (3) allocate the balance from step 2 to counties by industrial employment for manufacturing. The balance is assumed to represent smaller industry that does not report under Title 5 regulations. X(Rec) - Pie Slice Method. (1) Allocate directly all Title 5 / MMR reporting industrial facilities to the counties / municipalities. (2) compute total statewide industrial fuel use for all Title 5 / EPA MMR reporting facilities and subtract that from the EIA SEDS reported fuel use for the industrial sector (3) allocate the balance from step 2 to counties by industrial employment for manufacturing. The balance is assumed to represent smaller industry that does not report under Title 5 regulations. X
(Rec) - Direct Allocation from Title 5, MMR, or EIA 923 Database. All Grid Connected Power Generators with Nameplate capacity of 1 MW or greater shall be reported. For overlap, prioritize EIA 923 Database. X EIA 923 database used(Rec) - Direct Allocation from Title 5, MMR, or EIA 923 Database. All Grid Connected Power Generators with Nameplate capacity of 1 MW or greater shall be reported. For overlap, prioritize EIA 923 Database. X EIA 923 database used
X EIA 923 database used(Rec) - Direct Allocation from Title 5, MMR, or EIA 923 Database. All Grid Connected Power Generators with Nameplate capacity of 1 MW or greater shall be reported. For overlap, prioritize EIA 923 Database. X EIA 923 database used
(Rec) - Direct Allocation from Title 5, MMR, or EIA 923 Database. All Grid Connected Power Generators with Nameplate capacity of 1 MW or greater shall be reported. Wood CO2 emissions reported optionally as biogenic CO2, Ch4 and N2 Emissions required to be reported to Scope 1 X EIA 923 database used
(Rec) - Direct Allocation from Title 5, MMR, or EIA 923 Database. All Grid Connected Power Generators with Nameplate capacity of 1 MW or greater shall be reported. MSW CO2 emissions split as 44% reported as Scope 1 as part of non-biogenic (plastics etc), and 56% can be reported as option biogenic based data for 2005 on http://www.eia.gov/cneaf/solar.renewables/page/mswaste/msw_report.html. All Ch4 and N2O shall be reported under required Scope 1. X EIA 923 database used
Protocol Compliance ReportAdherence
Direct energy use as reported for Title 5 industrial facilities only, additional allocation based on statewide emissions by industrial employees is not representative of the region, therefore not included
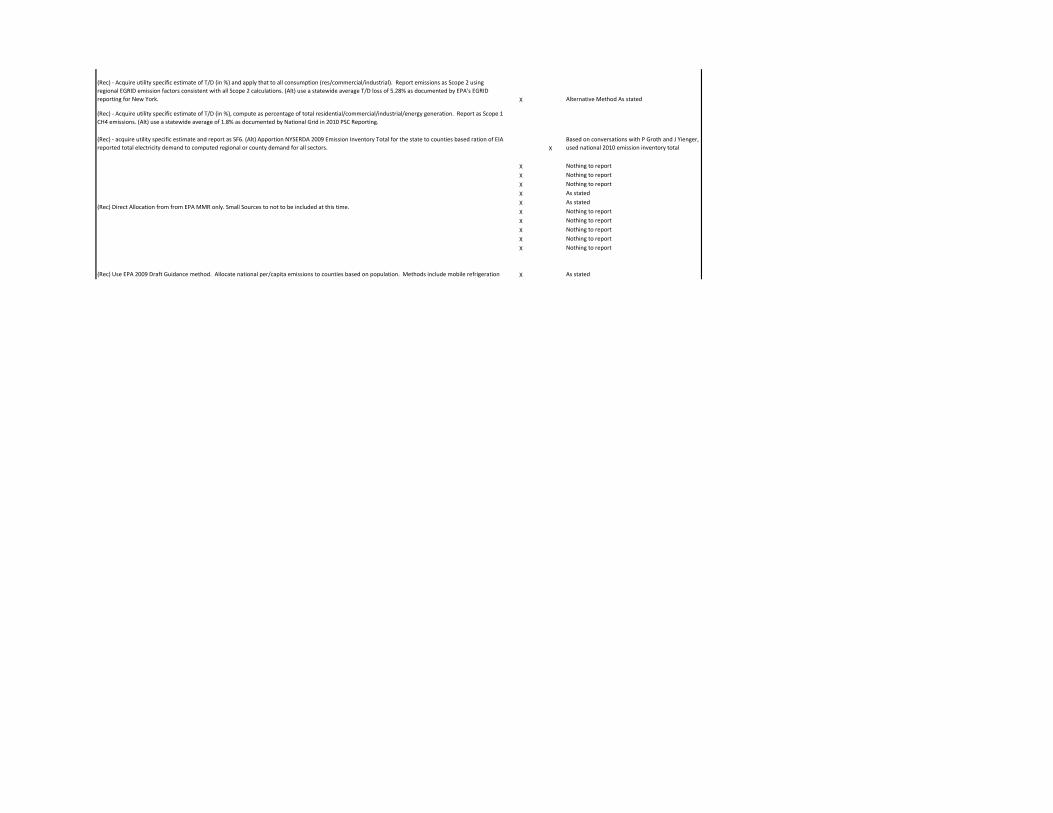
(Rec) - Acquire utility specific estimate of T/D (in %) and apply that to all consumption (res/commercial/industrial). Report emissions as Scope 2 using regional EGRID emission factors consistent with all Scope 2 calculations. (Alt) use a statewide average T/D loss of 5.28% as documented by EPA's EGRID reporting for New York. X Alternative Method As stated
(Rec) - Acquire utility specific estimate of T/D (in %), compute as percentage of total residential/commercial/industrial/energy generation. Report as Scope 1 CH4 emissions. (Alt) use a statewide average of 1.8% as documented by National Grid in 2010 PSC Reporting.
(Rec) - acquire utility specific estimate and report as SF6. (Alt) Apportion NYSERDA 2009 Emission Inventory Total for the state to counties based ration of EIA reported total electricity demand to computed regional or county demand for all sectors. X
Based on conversations with P Groth and J Yienger, used national 2010 emission inventory total
X Nothing to reportX Nothing to reportX Nothing to reportX As statedX As statedX Nothing to reportX Nothing to reportX Nothing to reportX Nothing to reportX Nothing to report
(Rec) Use EPA 2009 Draft Guidance method. Allocate national per/capita emissions to counties based on population. Methods include mobile refrigeration X As stated
(Rec) Direct Allocation from from EPA MMR only. Small Sources to not to be included at this time.

(Rec) Use MPO-provided VMT data local to your region, supplemented by DOT provided data (on Wiggio). Use regional-specific data on fleet profile and national fleet fuel economy data (on Wiggio) to estimate county-level GHG emissions. (Alt) Use EPA MOVES GHG module customized for your region- appropriate if you are running this model. Assume on-road fuel is 10% ethanol and report this fraction as Optional biogenic emissions. X As stated(Rec) Use MPO-provided VMT data local to your region, supplemented by DOT provided data (on Wiggio). Use regional-specific data on fleet profile and national fleet fuel economy data (on Wiggio) to estimate county-level GHG emissions. (Alt) Use EPA MOVES GHG module customized for your region- appropriate if you are running this model. Assume on-road fuel is 10% ethanol and report this fraction as Optional biogenic emissions on the ethanol line item. X As statedOptional- Include regional E-85 consumption if you have it, and debit against your gasoline estimate create using VMT. Allocate 15% as gasoline to be reported as Scope 1, and 85% as ethanol to be reported as optional biogenic. X Not availableOptional- Include regional biodiesel consumption if you have it, and debit against your diesel estimate create using VMT. Because biodiesel blends change, allocate option biogenic component on this line item only, and retain the diesel fraction on the diesel line item. X Not availableToday this will be zero, but as NYSERDA pushes to electrify on-road transportation we will want to report here, debiting against electricity consumption in the other sectors as appropriate. X Not available
Freight and Passenger. (Rec) Use direct provider fuel consumption data allocated spatially to location of routes (Alt) Use Nyserda 2002 estimates of Diesel consumption by county directly. X As stated
Passenger and Commuter (Rec) Use direct provider electricity consumption data allocated spatially to location of routes (Alt) None identified. X Not applicable
XAs stated, except recreational boating included in non-road data
XAs stated, except recreational boating included in non-road data
XAs stated, except recreational boating included in non-road data
Optional Scope 1- Estimate Landing and Take off Cycle emissions using a dispersion model such as EDMS, or with related data from the NYSDEC for the 2007 state emission inventory. Optional Scope 3, use FAA statistics on departure miles from regional airport, allocate jet fuel use to it, then allocate to counties by fraction of population served X
Scope 1 option, using EDMS. Total added to roll up totals discussed within Sustainability Plan
Rec - USE NYSDEC 2007 NONROAD data from the state emission inventory (data on Wiggio) for all categories except small marine. X As stated, but includes recreational marine
This is fugitive CH4 emissions from landfills. There are two required Scopes. Scope 1 - Estimate of actual emissions in regional boundary. (rec) use MMR or Title 5 (annual landfill reporting) data directly for facilities (data on Wiggio). For recently closed landfills or for areas without reported data, use a First Order Decay model to estimate emissions. Scope 3- emissions footprint attributed to current waste generation regardless of where it is treated. (rec) Estimate county level MSW and C/D waste generation and apply a representative FOD model with prevailing CH4 captures rates forward-casted 50 years to estimate the footprint. X
Actual 2010 treatment emissions reported, allocated to counties in region based on average tonnage per capita
Rec - for any MSW incinerated that does not generate grid connected power, compute emissions. MSW CO2 emissions split. 44% shall be reported as Scope 1 as part of non-biogenic (plastics etc), and 56% can be reported as option biogenic based data for 2005 on http://www.eia.gov/cneaf/solar.renewables/page/mswaste/msw_report.html. All Ch4 and N2O shall be reported under required Scope 1 X
Not reported, no non-grid incinerators reported in DEC data.
Determine population covered by WWTPs. (Rec)- Use the ICLEI Local Government Operations Protocol and apply to all facilities in the region. (Alt) use methods as described in the EPA 2009 Draft GHG guidance to translate populations served into emissions using default data. Determine population covered by Septic Systems, and apply the default emissions / capita as described in the ICLEI Local Government Operations Protocol. X
Based on conversations with P. Groth and J. Yienger, used State Inventory Tool and regional population, allocated to county by population
X As statedX As stated
X As statedX None reported
X As stated
XTotal reported for information, change is not relevant to WG discussions
Sum Totals in columns for all EXCEPT ANY FORESTRY SINKS. Totals in the Scope 1 column can be a considered a physical roll up of emissions that occur in boundary, and is analogous to reporting that is done for state and federal GHG inventories, and for air quality management.
Value above MINUS and reported optional forestry sinks.
Rec - USE NYSDEC 2007 data from the state emission inventory for the small and pleasure craft categories reported by county (data on Wiggio). For commercial distillate and bunkers, No consensus method identified- please document methods used.
(Rec) Methods as described in the EPA 2009 guidance and executed in the EPA's State Inventory Tool. Use locally resolved fertilizer, crop, and livestock population from either the 2007 Ag census or the US NASS system to get county-level data and make calculations for each county.
Optional Source and Sink. Use methods described in the EPA 2009 Guidance. Use local forest inventory data, or use the US Forest Services online inventory tool for forests. For carbon stock factors use the National Council for Air and Stream Improvement’s Carbon On-Line Estimator.(NCASI 2008) Use the
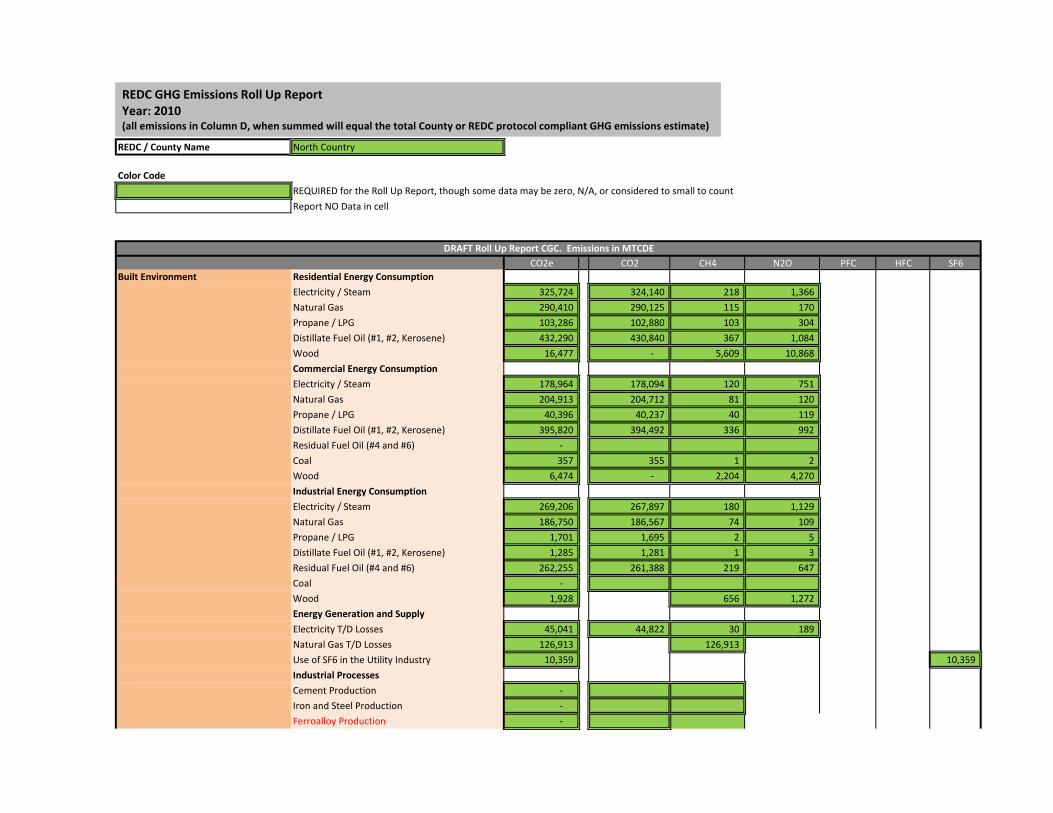
REDC / County Name North Country
Color CodeREQUIRED for the Roll Up Report, though some data may be zero, N/A, or considered to small to countReport NO Data in cell
CO2e CO2 CH4 N2O PFC HFC SF6Built Environment Residential Energy Consumption
Electricity / Steam 325,724 324,140 218 1,366 Natural Gas 290,410 290,125 115 170 Propane / LPG 103,286 102,880 103 304 Distillate Fuel Oil (#1, #2, Kerosene) 432,290 430,840 367 1,084 Wood 16,477 - 5,609 10,868 Commercial Energy ConsumptionElectricity / Steam 178,964 178,094 120 751 Natural Gas 204,913 204,712 81 120 Propane / LPG 40,396 40,237 40 119 Distillate Fuel Oil (#1, #2, Kerosene) 395,820 394,492 336 992 Residual Fuel Oil (#4 and #6) - Coal 357 355 1 2 Wood 6,474 - 2,204 4,270 Industrial Energy ConsumptionElectricity / Steam 269,206 267,897 180 1,129 Natural Gas 186,750 186,567 74 109 Propane / LPG 1,701 1,695 2 5 Distillate Fuel Oil (#1, #2, Kerosene) 1,285 1,281 1 3 Residual Fuel Oil (#4 and #6) 262,255 261,388 219 647 Coal - Wood 1,928 656 1,272 Energy Generation and SupplyElectricity T/D Losses 45,041 44,822 30 189 Natural Gas T/D Losses 126,913 126,913 Use of SF6 in the Utility Industry 10,359 10,359 Industrial ProcessesCement Production - Iron and Steel Production - Ferroalloy Production -
DRAFT Roll Up Report CGC. Emissions in MTCDE
REDC GHG Emissions Roll Up ReportYear: 2010 (all emissions in Column D, when summed will equal the total County or REDC protocol compliant GHG emissions estimate)

Aluminum Production 234,165 211,169 - - 22,996 Paper and Pulp 33,205 Limestone Use - Soda Ash Use - Semi-Conductor Manufacturing - Chemical Manufacturing - Product Use (ODS Substitutes) - All Refrigerants- except utility SF6 99,181 99,181
Transportation Energy On-road: ALL(Total not ethanol)Motor Gasoline (E-10) 1,545,164 1,539,705 4,078 1,381 Diesel 421,448 420,037 1,053 358 Ethanol - Biodiesel - RailDiesel 71,649 71,409 180 61 Electricity Consumption - MarineGasoline - Distillate 28,744 28,647 72 24 Residual Fuel Oil 27,070 26,981 67 23 Off-road MobileAll Fuels (Diesel and Gasoline) 566,620 564,649 1,472 499
Waste Management Solid Waste ManagementLandfill Methane and Combustion 97,305 134 97,170 0 MSW incineration (non grid connected) - Sewage TreatmentCentral WWTPs and Septic Systems 40,000 30,000 10,000
Agriculture LivestockEnteric Fementation 519,547 519,547 Manure management 107,207 88,631 18,577 Crop Production and Soil ManagementUse of Fertilizer 31,506 31,506 Crop Residue Incineration -
Grand Totals 6,723,362 5,592,254 879,538 85,828 22,996 99,181 10,359

REDC / County Name Clinton
Color CodeREQUIRED, though some data may be zero or considered to small to countOPTIONALDO NOT Report Data in these cells
Scope 1 Scope 2 Scope 3 Biogenic Metric Unit ValueBuilt Environment Residential Energy ConsumptionNC Electricity Consumption Electricity / Steam 100,623 Yes Consumption MMBTU 1,512,719 NC Direct Residental Fuel Consumption Natural Gas 22,614 Yes Consumption MMBTU 426,109 NC Direct Residental Fuel Consumption Propane / LPG 7,618 Yes Consumption MMBTU 120,481 NC Direct Residental Fuel Consumption Distillate Fuel Oil (#1, #2, Kerosene) 89,386 Yes Consumption MMBTU 1,204,518 NC Direct Residental Fuel Consumption Wood 2,101 99,826 Yes Consumption MMBTU 1,064,247
Commercial Energy ConsumptionNC Electricity Consumption Electricity / Steam 78,426 Yes Consumption MMBTU 1,179,013 NC Commercial Direct Fuel Consumption Natural Gas 15,344 Yes Consumption MMBTU 289,112 NC Commercial Direct Fuel Consumption Propane / LPG 2,505 Yes Consumption MMBTU 39,622 NC Commercial Direct Fuel Consumption Distillate Fuel Oil (#1, #2, Kerosene) 72,207 Yes Consumption MMBTU 973,021 NC Commercial Direct Fuel Consumption Residual Fuel Oil (#4 and #6) Yes Consumption MMBTUNC Commercial Direct Fuel Consumption Coal 64 Yes Consumption MMBTU 619 NC Commercial Direct Fuel Consumption Wood 600 28,523 Yes Consumption MMBTU 304,083
Industrial Energy Consumption
NC Electricity Consumption Electricity / Steam 68,006 Yes Consumption MMBTU 1,022,364
NC Industrial Title V Consumption Natural Gas 33,400 Yes Consumption MMBTU 629,340 NC Industrial Title V Consumption Propane / LPG - Yes Consumption MMBTU - NC Industrial Title V Consumption Distillate Fuel Oil (#1, #2, Kerosene) 608 Yes Consumption MMBTU 8,197 NC Industrial Title V Consumption Residual Fuel Oil (#4 and #6) - Yes Consumption MMBTU - NC Industrial Title V Consumption Coal Yes Consumption MMBTUNC Industrial Title V Consumption Wood - - Yes Consumption MMBTU - Energy Generation and Supply Energy Generation and SupplyNC Elec Generation GHG Analysis Coal and Coke - No Consumption MMBTU - NC Elec Generation GHG Analysis Natural Gas 203,889 No Consumption MMBTU 3,841,742 NC Elec Generation GHG Analysis Distillate Fuel Oil (#1, #2 and #4) - No Consumption MMBTU - NC Elec Generation GHG Analysis Residual Fuel Oil (#4 and #6) - No Consumption MMBTU - NC Elec Generation GHG Analysis Wood / Biomass - - No Consumption MMBTU - NC Elec Generation GHG Analysis MSW and landfill emissions 116 23,068 No MSW Combusted MMBTU 443,027 NC Elec Generation GHG Analysis Other - - NC Elec Generation GHG Analysis Electricity T/D Losses 14,379 Yes Losses MMBTU 216,160
NC Elec Generation GHG Analysis and NC Direct Fuel Consumption Natural Gas T/D Losses 39,376 Yes Losses MMBTUNC Electricity Consumption Use of SF6 in the Utility Industry 3,307 Yes Consumption MMBTUIndustrial Processes Industrial ProcessesNot Reported Cement Production YesNC Industrial Sources Iron and Steel Production YesNC Industrial Sources Ferroalloy Production YesNot Reported Aluminum Production YesNot Reported Paper and Pulp YesNot Reported Limestone Use YesNot Reported Soda Ash Use YesNot Reported Semi-Conductor Manufacturing YesNot Reported Glass Production YesNot Reported Chemical Manufacturing YesProduct Use (Ozone Depleting Substances) Product Use (Ozone Depleting Substances)NC Industrial Sources All Refrigerants- except SF6 18,804 Yes
DRAFT Reporting Template CGC. Emissions in MTCDERolled Up?
Related GHG Metrics / Activity Data
REDC Emissions By Source and SectorYear: 2010

Transportation Energy On-roadNC Emission Summary - Onroad Motor Gasoline (E-10) 315,834 22,922 Yes Consumption MMBTU 4,816,540 NC Emission Summary - Onroad Diesel 96,124 Yes Consumption MMBTU 1,295,316 Not Reported Ethanol (E-85) No Consumption MMBTUNot Reported Biodiesel No Consumption MMBTUNot Reported Electricity Consumption No Consumption MMBTU
RailNC Emission Summary - Rail Diesel 6,776 Yes Consumption MMBTU 91,303 NC Emission Summary - Rail Electricity Consumption Yes Consumption MMBTU
MarineNC Emission Summary -Com Marine Gasoline Yes Consumption MMBTUNC Emission Summary -Com Marine Distillate Fuels - Yes Consumption MMBTU - NC Emission Summary -Com Marine Residual Fuels - Yes Consumption MMBTU -
AirNC Emission Summary-Aircraft All Fuels (Jet and Aviation Gasoline) 2,566 No Consumption MMBTU 35,933
Non-road MobileNC Emission Summary-Nonroad All Fuels (Diesel and Gasoline) 69,477 Yes Consumption MMBTU 974,219 Waste Management Solid Waste ManagementNC Waste Landfill Methane and Combustion 120,749 19,963 Yes - ONLY Scope 3 MSW+CD Generated Tonnes 65,296 Not Reported MSW incineration (non grid connected) Yes MSW+CD Processed Tonnes 153,644
Sewage Treatment MSW Sent for Incineration TonnesNC Waste water Central WWTPs and Septic Systems 9,717 Yes MSW incinerated in Boundary TonnesAgriculture LivestockGHG_NC_Agriculture Enteric Fermentation 72,623 YesGHG_NC_Agriculture Manure management 15,609 Yes
Crop Production and Soil ManagementGHG_NC_Agriculture Use of Fertilizer 3,796 YesNot Reported Crop Residue Incineration NoLand Use and ForestryGHG_NC_Forest Urban Forest Annual Reserve 44,191 NoGHG_NC_Forest Forest Carbon Reserve (TOTAL) 87,724,751 No
Grand Totals Gross Totals 897,890 261,434 19,963 1,179,287 Total with Aircraft (as reported in NC Sustainability Plan) 900,456 261,434 19,963 - 1,181,853 Net Totals

REDC / County Name Clinton
Color CodeREQUIRED for the Roll Up Report, though some data may be zero, N/A, or considered to small to countReport NO Data in cell
CO2e CO2 CH4 N2O PFC HFC SF6Built Environment Residential Energy Consumption
Electricity / Steam 100,623 100,134 67 422 Natural Gas 22,614 22,592 9 13 Propane / LPG 7,618 7,588 8 22 Distillate Fuel Oil (#1, #2, Kerosene) 89,386 89,086 76 224 Wood 2,101 - 715 1,386 Commercial Energy ConsumptionElectricity / Steam 78,426 78,044 52 329 Natural Gas 15,344 15,329 6 9 Propane / LPG 2,505 2,495 2 7 Distillate Fuel Oil (#1, #2, Kerosene) 72,207 71,965 61 181 Residual Fuel Oil (#4 and #6) - Coal 64 63 0 0 Wood 600 - 204 396 Industrial Energy ConsumptionElectricity / Steam 68,006 67,675 45 285 Natural Gas 33,400 33,368 13 20 Propane / LPG - - - - Distillate Fuel Oil (#1, #2, Kerosene) 608 606 1 2 Residual Fuel Oil (#4 and #6) - - - - Coal - Wood - - - Energy Generation and SupplyElectricity T/D Losses 14,379 14,309 10 60 Natural Gas T/D Losses 39,376 39,376 Use of SF6 in the Utility Industry 3,307 3,307 Industrial ProcessesCement Production - Iron and Steel Production - Ferroalloy Production -
DRAFT Roll Up Report CGC. Emissions in MTCDE
REDC GHG Emissions Roll Up ReportYear: 2010 (all emissions in Column D, when summed will equal the total County or REDC protocol compliant GHG emissions estimate)

Aluminum Production - - - - - Paper and Pulp - Limestone Use - Soda Ash Use - Semi-Conductor Manufacturing - Chemical Manufacturing - Product Use (ODS Substitutes) - All Refrigerants- except utility SF6 18,804 18,804
Transportation Energy On-road: ALL(Total not ethanol)Motor Gasoline (E-10) 315,834 314,718 834 282 Diesel 96,124 95,802 241 82 Ethanol - Biodiesel - RailDiesel 6,776 6,753 17 6 Electricity Consumption - MarineGasoline - Distillate - - - - Residual Fuel Oil - - - - Off-road MobileAll Fuels (Diesel and Gasoline) 69,477 69,236 180 61
Waste Management Solid Waste ManagementLandfill Methane and Combustion 19,963 28 19,935 0 MSW incineration (non grid connected) - Sewage TreatmentCentral WWTPs and Septic Systems 9,717 7,288 2,429
Agriculture LivestockEnteric Fementation 72,623 72,623 Manure management 15,609 12,881 2,728 Crop Production and Soil ManagementUse of Fertilizer 3,796 3,796 Crop Residue Incineration -
Grand Totals 1,179,287 989,791 154,644 12,741 - 18,804 3,307

REDC / County Name Essex
Color CodeREQUIRED, though some data may be zero or considered to small to countOPTIONALDO NOT Report Data in these cells
Scope 1 Scope 2 Scope 3 Biogenic Metric Unit ValueBuilt Environment Residential Energy ConsumptionNC Electricity Consumption Electricity / Steam 27,992 Yes Consumption MMBTU 420,818 NC Direct Residental Fuel Consumption Natural Gas 9,661 Yes Consumption MMBTU 182,028 NC Direct Residental Fuel Consumption Propane / LPG 13,738 Yes Consumption MMBTU 12,040 NC Direct Residental Fuel Consumption Distillate Fuel Oil (#1, #2, Kerosene) 61,196 Yes Consumption MMBTU 824,645 NC Direct Residental Fuel Consumption Wood 1,961 93,180 Yes Consumption MMBTU 993,385
Commercial Energy ConsumptionNC Electricity Consumption Electricity / Steam 17,178 Yes Consumption MMBTU 258,250 NC Commercial Direct Fuel Consumption Natural Gas 5,317 Yes Consumption MMBTU 100,186 NC Commercial Direct Fuel Consumption Propane / LPG 3,667 Yes Consumption MMBTU 57,994 NC Commercial Direct Fuel Consumption Distillate Fuel Oil (#1, #2, Kerosene) 40,127 Yes Consumption MMBTU 540,726 NC Commercial Direct Fuel Consumption Residual Fuel Oil (#4 and #6) Yes Consumption MMBTUNC Commercial Direct Fuel Consumption Coal 20 Yes Consumption MMBTU 191 NC Commercial Direct Fuel Consumption Wood 455 21,610 Yes Consumption MMBTU 230,379
Industrial Energy Consumption
NC Electricity Consumption Electricity / Steam 27,869 Yes Consumption MMBTU 418,968
NC Industrial Title V Consumption Natural Gas - Yes Consumption MMBTU - NC Industrial Title V Consumption Propane / LPG 221 Yes Consumption MMBTU 3,492 NC Industrial Title V Consumption Distillate Fuel Oil (#1, #2, Kerosene) 485 Yes Consumption MMBTU 6,538 NC Industrial Title V Consumption Residual Fuel Oil (#4 and #6) 236,076 Yes Consumption MMBTU 3,133,104 NC Industrial Title V Consumption Coal Yes Consumption MMBTUNC Industrial Title V Consumption Wood 1,928 91,613 Yes Consumption MMBTU 976,685 Energy Generation and Supply Energy Generation and SupplyNC Elec Generation GHG Analysis Coal and Coke - No Consumption MMBTU - NC Elec Generation GHG Analysis Natural Gas - No Consumption MMBTU - NC Elec Generation GHG Analysis Distillate Fuel Oil (#1, #2 and #4) 86 No Consumption MMBTU 1,159 NC Elec Generation GHG Analysis Residual Fuel Oil (#4 and #6) 81,846 No Consumption MMBTU 1,086,225 NC Elec Generation GHG Analysis Wood / Biomass 3,100 147,327 No Consumption MMBTU 1,570,652 NC Elec Generation GHG Analysis MSW and landfill emissions - - No MSW Combusted MMBTU - NC Elec Generation GHG Analysis Other - - NC Elec Generation GHG Analysis Electricity T/D Losses 4,251 Yes Losses MMBTU 63,906
NC Elec Generation GHG Analysis and NC Direct Fuel Consumption Natural Gas T/D Losses 2,109 Yes Losses MMBTUNC Electricity Consumption Use of SF6 in the Utility Industry 978 Yes Consumption MMBTUIndustrial Processes Industrial ProcessesNot Reported Cement Production YesNC Industrial Sources Iron and Steel Production YesNC Industrial Sources Ferroalloy Production YesNot Reported Aluminum Production YesNot Reported Paper and Pulp 33,205 YesNot Reported Limestone Use YesNot Reported Soda Ash Use YesNot Reported Semi-Conductor Manufacturing YesNot Reported Glass Production YesNot Reported Chemical Manufacturing YesProduct Use (Ozone Depleting Substances) Product Use (Ozone Depleting Substances)NC Industrial Sources All Refrigerants- except SF6 9,014 Yes
DRAFT Reporting Template CGC. Emissions in MTCDERolled Up?
Related GHG Metrics / Activity Data
REDC Emissions By Source and SectorYear: 2010

Transportation Energy On-roadNC Emission Summary - Onroad Motor Gasoline (E-10) 208,370 15,123 Yes Consumption MMBTU 3,177,685 NC Emission Summary - Onroad Diesel 56,529 Yes Consumption MMBTU 761,748 Not Reported Ethanol (E-85) No Consumption MMBTUNot Reported Biodiesel No Consumption MMBTUNot Reported Electricity Consumption No Consumption MMBTU
RailNC Emission Summary - Rail Diesel 8,281 Yes Consumption MMBTU 111,592 NC Emission Summary - Rail Electricity Consumption Yes Consumption MMBTU
MarineNC Emission Summary -Com Marine Gasoline Yes Consumption MMBTUNC Emission Summary -Com Marine Distillate Fuels - Yes Consumption MMBTU - NC Emission Summary -Com Marine Residual Fuels - Yes Consumption MMBTU -
AirNC Emission Summary-Aircraft All Fuels (Jet and Aviation Gasoline) 601 No Consumption MMBTU 6,078
Non-road MobileNC Emission Summary-Nonroad All Fuels (Diesel and Gasoline) 75,405 Yes Consumption MMBTU 1,057,070 Waste Management Solid Waste ManagementNC Waste Landfill Methane and Combustion 32,066 6,866 Yes - ONLY Scope 3 MSW+CD Generated Tonnes 22,458 Not Reported MSW incineration (non grid connected) Yes MSW+CD Processed Tonnes -
Sewage Treatment MSW Sent for Incineration TonnesNC Waste water Central WWTPs and Septic Systems 4,206 Yes MSW incinerated in Boundary TonnesAgriculture LivestockGHG_NC_Agriculture Enteric Fermentation 8,834 YesGHG_NC_Agriculture Manure management 1,572 Yes
Crop Production and Soil ManagementGHG_NC_Agriculture Use of Fertilizer 1,000 YesNot Reported Crop Residue Incineration NoLand Use and ForestryGHG_NC_Forest Urban Forest Annual Reserve 15,548 NoGHG_NC_Forest Forest Carbon Reserve (TOTAL) 196,171,820 No
Grand Totals Gross Totals 784,352 77,290 6,866 868,508 Total with Aircraft (as reported in NC Sustainability Plan) 784,952 77,290 6,866 - 869,109 Net Totals

REDC / County Name Essex
Color CodeREQUIRED for the Roll Up Report, though some data may be zero, N/A, or considered to small to countReport NO Data in cell
CO2e CO2 CH4 N2O PFC HFC SF6Built Environment Residential Energy Consumption
Electricity / Steam 27,992 27,856 19 117 Natural Gas 9,661 9,651 4 6 Propane / LPG 13,738 13,684 14 40 Distillate Fuel Oil (#1, #2, Kerosene) 61,196 60,991 52 153 Wood 1,961 - 668 1,293 Commercial Energy ConsumptionElectricity / Steam 17,178 17,095 11 72 Natural Gas 5,317 5,312 2 3 Propane / LPG 3,667 3,652 4 11 Distillate Fuel Oil (#1, #2, Kerosene) 40,127 39,992 34 101 Residual Fuel Oil (#4 and #6) - Coal 20 20 0 0 Wood 455 - 155 300 Industrial Energy ConsumptionElectricity / Steam 27,869 27,734 19 117 Natural Gas - - - - Propane / LPG 221 220 0 1 Distillate Fuel Oil (#1, #2, Kerosene) 485 483 0 1 Residual Fuel Oil (#4 and #6) 236,076 235,296 197 583 Coal - Wood 1,928 656 1,272 Energy Generation and SupplyElectricity T/D Losses 4,251 4,230 3 18 Natural Gas T/D Losses 2,109 2,109 Use of SF6 in the Utility Industry 978 978 Industrial ProcessesCement Production - Iron and Steel Production - Ferroalloy Production -
DRAFT Roll Up Report CGC. Emissions in MTCDE
REDC GHG Emissions Roll Up ReportYear: 2010 (all emissions in Column D, when summed will equal the total County or REDC protocol compliant GHG emissions estimate)
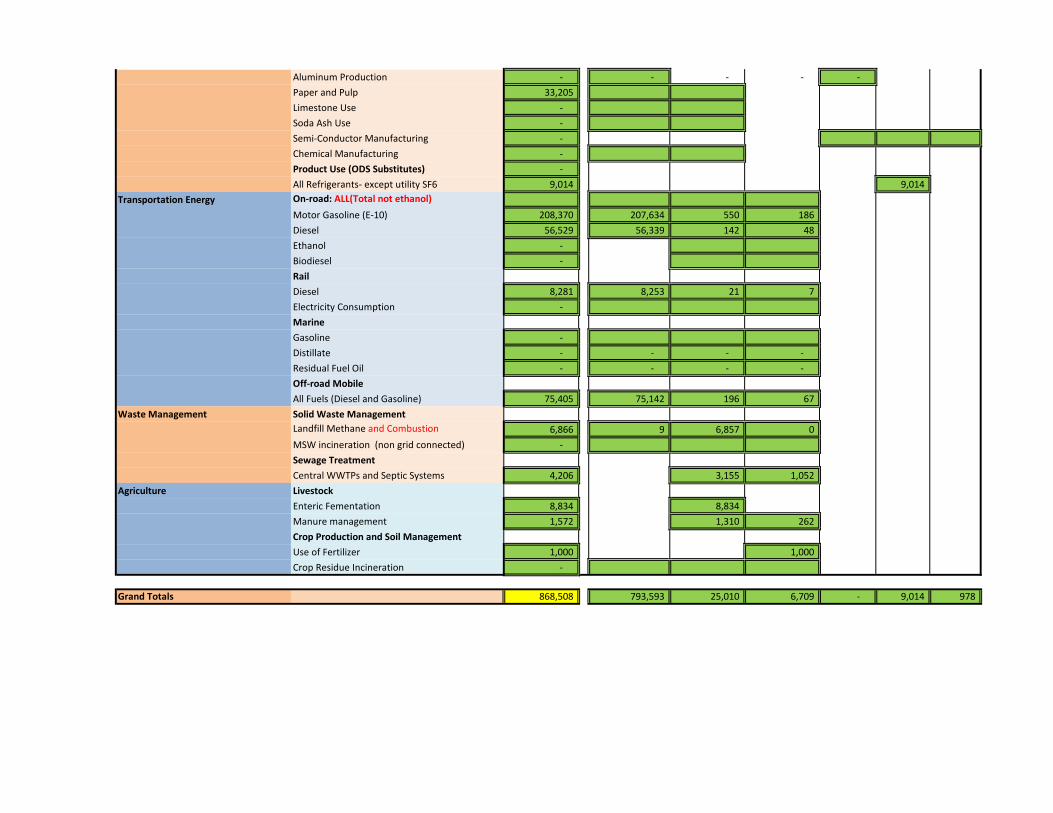
Aluminum Production - - - - - Paper and Pulp 33,205 Limestone Use - Soda Ash Use - Semi-Conductor Manufacturing - Chemical Manufacturing - Product Use (ODS Substitutes) - All Refrigerants- except utility SF6 9,014 9,014
Transportation Energy On-road: ALL(Total not ethanol)Motor Gasoline (E-10) 208,370 207,634 550 186 Diesel 56,529 56,339 142 48 Ethanol - Biodiesel - RailDiesel 8,281 8,253 21 7 Electricity Consumption - MarineGasoline - Distillate - - - - Residual Fuel Oil - - - - Off-road MobileAll Fuels (Diesel and Gasoline) 75,405 75,142 196 67
Waste Management Solid Waste ManagementLandfill Methane and Combustion 6,866 9 6,857 0 MSW incineration (non grid connected) - Sewage TreatmentCentral WWTPs and Septic Systems 4,206 3,155 1,052
Agriculture LivestockEnteric Fementation 8,834 8,834 Manure management 1,572 1,310 262 Crop Production and Soil ManagementUse of Fertilizer 1,000 1,000 Crop Residue Incineration -
Grand Totals 868,508 793,593 25,010 6,709 - 9,014 978

REDC / County Name Franklin
Color CodeREQUIRED, though some data may be zero or considered to small to countOPTIONALDO NOT Report Data in these cells
Scope 1 Scope 2 Scope 3 Biogenic Metric Unit ValueBuilt Environment Residential Energy ConsumptionNC Electricity Consumption Electricity / Steam 29,753 Yes Consumption MMBTU 447,284 NC Direct Residental Fuel Consumption Natural Gas 10,188 Yes Consumption MMBTU 191,958 NC Direct Residental Fuel Consumption Propane / LPG 10,108 Yes Consumption MMBTU 159,856 NC Direct Residental Fuel Consumption Distillate Fuel Oil (#1, #2, Kerosene) 84,036 Yes Consumption MMBTU 1,132,428 NC Direct Residental Fuel Consumption Wood 2,114 100,435 Yes Consumption MMBTU 1,070,733
Commercial Energy ConsumptionNC Electricity Consumption Electricity / Steam 13,252 Yes Consumption MMBTU 199,221 NC Commercial Direct Fuel Consumption Natural Gas 5,585 Yes Consumption MMBTU 105,229 NC Commercial Direct Fuel Consumption Propane / LPG 2,686 Yes Consumption MMBTU 42,474 NC Commercial Direct Fuel Consumption Distillate Fuel Oil (#1, #2, Kerosene) 54,848 Yes Consumption MMBTU 739,101 NC Commercial Direct Fuel Consumption Residual Fuel Oil (#4 and #6) Yes Consumption MMBTUNC Commercial Direct Fuel Consumption Coal 110 Yes Consumption MMBTU 1,066 NC Commercial Direct Fuel Consumption Wood 488 23,186 Yes Consumption MMBTU 247,181
Industrial Energy Consumption
NC Electricity Consumption Electricity / Steam 20,741 Yes Consumption MMBTU 311,813
NC Industrial Title V Consumption Natural Gas - Yes Consumption MMBTU - NC Industrial Title V Consumption Propane / LPG - Yes Consumption MMBTU - NC Industrial Title V Consumption Distillate Fuel Oil (#1, #2, Kerosene) - Yes Consumption MMBTU - NC Industrial Title V Consumption Residual Fuel Oil (#4 and #6) - Yes Consumption MMBTU - NC Industrial Title V Consumption Coal Yes Consumption MMBTUNC Industrial Title V Consumption Wood - - Yes Consumption MMBTU - Energy Generation and Supply Energy Generation and SupplyNC Elec Generation GHG Analysis Coal and Coke - No Consumption MMBTU - NC Elec Generation GHG Analysis Natural Gas - No Consumption MMBTU - NC Elec Generation GHG Analysis Distillate Fuel Oil (#1, #2 and #4) - No Consumption MMBTU - NC Elec Generation GHG Analysis Residual Fuel Oil (#4 and #6) - No Consumption MMBTU - NC Elec Generation GHG Analysis Wood / Biomass 4,005 190,331 No Consumption MMBTU 2,029,120 NC Elec Generation GHG Analysis MSW and landfill emissions - - No MSW Combusted MMBTU - NC Elec Generation GHG Analysis Other - - NC Elec Generation GHG Analysis Electricity T/D Losses 3,710 Yes Losses MMBTU 55,774
NC Elec Generation GHG Analysis and NC Direct Fuel Consumption Natural Gas T/D Losses 2,221 Yes Losses MMBTUNC Electricity Consumption Use of SF6 in the Utility Industry 853 Yes Consumption MMBTUIndustrial Processes Industrial ProcessesNot Reported Cement Production YesNC Industrial Sources Iron and Steel Production YesNC Industrial Sources Ferroalloy Production YesNot Reported Aluminum Production YesNot Reported Paper and Pulp YesNot Reported Limestone Use YesNot Reported Soda Ash Use YesNot Reported Semi-Conductor Manufacturing YesNot Reported Glass Production YesNot Reported Chemical Manufacturing YesProduct Use (Ozone Depleting Substances) Product Use (Ozone Depleting Substances)NC Industrial Sources All Refrigerants- except SF6 11,814 Yes
DRAFT Reporting Template CGC. Emissions in MTCDERolled Up?
Related GHG Metrics / Activity Data
REDC Emissions By Source and SectorYear: 2010

Transportation Energy On-roadNC Emission Summary - Onroad Motor Gasoline (E-10) 162,809 11,816 Yes Consumption MMBTU 2,482,864 NC Emission Summary - Onroad Diesel 37,507 Yes Consumption MMBTU 505,430 Not Reported Ethanol (E-85) No Consumption MMBTUNot Reported Biodiesel No Consumption MMBTUNot Reported Electricity Consumption No Consumption MMBTU
RailNC Emission Summary - Rail Diesel 3,343 Yes Consumption MMBTU 45,052 NC Emission Summary - Rail Electricity Consumption Yes Consumption MMBTU
MarineNC Emission Summary -Com Marine Gasoline Yes Consumption MMBTUNC Emission Summary -Com Marine Distillate Fuels 1,672 Yes Consumption MMBTU 22,527 NC Emission Summary -Com Marine Residual Fuels - Yes Consumption MMBTU -
AirNC Emission Summary-Aircraft All Fuels (Jet and Aviation Gasoline) 356 No Consumption MMBTU 5,013
Non-road MobileNC Emission Summary-Nonroad All Fuels (Diesel and Gasoline) 51,725 Yes Consumption MMBTU 722,521 Waste Management Solid Waste ManagementNC Waste Landfill Methane and Combustion - 11,064 Yes - ONLY Scope 3 MSW+CD Generated Tonnes 36,191 Not Reported MSW incineration (non grid connected) Yes MSW+CD Processed Tonnes 49,181
Sewage Treatment MSW Sent for Incineration TonnesNC Waste water Central WWTPs and Septic Systems 3,425 Yes MSW incinerated in Boundary TonnesAgriculture LivestockGHG_NC_Agriculture Enteric Fermentation 64,166 YesGHG_NC_Agriculture Manure management 12,985 Yes
Crop Production and Soil ManagementGHG_NC_Agriculture Use of Fertilizer 3,608 YesNot Reported Crop Residue Incineration NoLand Use and ForestryGHG_NC_Forest Urban Forest Annual Reserve 24,981 NoGHG_NC_Forest Forest Carbon Reserve (TOTAL) 157,855,694 No
Grand Totals Gross Totals 526,289 67,456 11,064 604,809 Total with Aircraft (as reported in NC Sustainability Plan) 526,645 67,456 11,064 - 605,165 Net Totals

REDC / County Name Franklin
Color CodeREQUIRED for the Roll Up Report, though some data may be zero, N/A, or considered to small to countReport NO Data in cell
CO2e CO2 CH4 N2O PFC HFC SF6Built Environment Residential Energy Consumption
Electricity / Steam 29,753 29,608 20 125 Natural Gas 10,188 10,178 4 6 Propane / LPG 10,108 10,068 10 30 Distillate Fuel Oil (#1, #2, Kerosene) 84,036 83,754 71 211 Wood 2,114 - 720 1,394 Commercial Energy ConsumptionElectricity / Steam 13,252 13,187 9 56 Natural Gas 5,585 5,579 2 3 Propane / LPG 2,686 2,675 3 8 Distillate Fuel Oil (#1, #2, Kerosene) 54,848 54,664 47 137 Residual Fuel Oil (#4 and #6) - Coal 110 109 0 1 Wood 488 - 166 322 Industrial Energy ConsumptionElectricity / Steam 20,741 20,640 14 87 Natural Gas - - - - Propane / LPG - - - - Distillate Fuel Oil (#1, #2, Kerosene) - - - - Residual Fuel Oil (#4 and #6) - - - - Coal - Wood - - - Energy Generation and SupplyElectricity T/D Losses 3,710 3,692 2 16 Natural Gas T/D Losses 2,221 2,221 Use of SF6 in the Utility Industry 853 853 Industrial ProcessesCement Production - Iron and Steel Production - Ferroalloy Production -
DRAFT Roll Up Report CGC. Emissions in MTCDE
REDC GHG Emissions Roll Up ReportYear: 2010 (all emissions in Column D, when summed will equal the total County or REDC protocol compliant GHG emissions estimate)

Aluminum Production - - - - - Paper and Pulp - Limestone Use - Soda Ash Use - Semi-Conductor Manufacturing - Chemical Manufacturing - Product Use (ODS Substitutes) - All Refrigerants- except utility SF6 11,814 11,814
Transportation Energy On-road: ALL(Total not ethanol)Motor Gasoline (E-10) 162,809 162,233 430 146 Diesel 37,507 37,382 94 32 Ethanol - Biodiesel - RailDiesel 3,343 3,332 8 3 Electricity Consumption - MarineGasoline - Distillate 1,672 1,666 4 1 Residual Fuel Oil - - - - Off-road MobileAll Fuels (Diesel and Gasoline) 51,725 51,545 134 45
Waste Management Solid Waste ManagementLandfill Methane and Combustion 11,064 15 11,049 0 MSW incineration (non grid connected) - Sewage TreatmentCentral WWTPs and Septic Systems 3,425 2,569 856
Agriculture LivestockEnteric Fementation 64,166 64,166 Manure management 12,985 10,745 2,240 Crop Production and Soil ManagementUse of Fertilizer 3,608 3,608 Crop Residue Incineration -
Grand Totals 604,809 490,328 92,488 9,326 - 11,814 853

REDC / County Name Hamilton
Color CodeREQUIRED, though some data may be zero or considered to small to countOPTIONALDO NOT Report Data in these cells
Scope 1 Scope 2 Scope 3 Biogenic Metric Unit ValueBuilt Environment Residential Energy ConsumptionNC Electricity Consumption Electricity / Steam 6,406 Yes Consumption MMBTU 96,304 NC Direct Residental Fuel Consumption Natural Gas 925 Yes Consumption MMBTU 17,434 NC Direct Residental Fuel Consumption Propane / LPG 3,893 Yes Consumption MMBTU 61,564 NC Direct Residental Fuel Consumption Distillate Fuel Oil (#1, #2, Kerosene) 8,845 Yes Consumption MMBTU 119,195 NC Direct Residental Fuel Consumption Wood 433 20,577 Yes Consumption MMBTU 219,375
Commercial Energy ConsumptionNC Electricity Consumption Electricity / Steam 3,360 Yes Consumption MMBTU 50,516 NC Commercial Direct Fuel Consumption Natural Gas 452 Yes Consumption MMBTU 8,513 NC Commercial Direct Fuel Consumption Propane / LPG 921 Yes Consumption MMBTU 14,570 NC Commercial Direct Fuel Consumption Distillate Fuel Oil (#1, #2, Kerosene) 5,142 Yes Consumption MMBTU 69,292 NC Commercial Direct Fuel Consumption Residual Fuel Oil (#4 and #6) Yes Consumption MMBTUNC Commercial Direct Fuel Consumption Coal - Yes Consumption MMBTU - NC Commercial Direct Fuel Consumption Wood 89 4,231 Yes Consumption MMBTU 45,108
Industrial Energy Consumption
NC Electricity Consumption Electricity / Steam 565 Yes Consumption MMBTU 8,488
NC Industrial Title V Consumption Natural Gas - Yes Consumption MMBTU - NC Industrial Title V Consumption Propane / LPG - Yes Consumption MMBTU - NC Industrial Title V Consumption Distillate Fuel Oil (#1, #2, Kerosene) - Yes Consumption MMBTU - NC Industrial Title V Consumption Residual Fuel Oil (#4 and #6) - Yes Consumption MMBTU - NC Industrial Title V Consumption Coal Yes Consumption MMBTUNC Industrial Title V Consumption Wood - - Yes Consumption MMBTU - Energy Generation and Supply Energy Generation and SupplyNC Elec Generation GHG Analysis Coal and Coke - No Consumption MMBTU - NC Elec Generation GHG Analysis Natural Gas - No Consumption MMBTU - NC Elec Generation GHG Analysis Distillate Fuel Oil (#1, #2 and #4) - No Consumption MMBTU - NC Elec Generation GHG Analysis Residual Fuel Oil (#4 and #6) - No Consumption MMBTU - NC Elec Generation GHG Analysis Wood / Biomass - - No Consumption MMBTU - NC Elec Generation GHG Analysis MSW and landfill emissions - - No MSW Combusted MMBTU - NC Elec Generation GHG Analysis Other - - NC Elec Generation GHG Analysis Electricity T/D Losses 601 Yes Losses MMBTU 9,039
NC Elec Generation GHG Analysis and NC Direct Fuel Consumption Natural Gas T/D Losses 194 Yes Losses MMBTUNC Electricity Consumption Use of SF6 in the Utility Industry 138 Yes Consumption MMBTUIndustrial Processes Industrial ProcessesNot Reported Cement Production YesNC Industrial Sources Iron and Steel Production YesNC Industrial Sources Ferroalloy Production YesNot Reported Aluminum Production YesNot Reported Paper and Pulp YesNot Reported Limestone Use YesNot Reported Soda Ash Use YesNot Reported Semi-Conductor Manufacturing YesNot Reported Glass Production YesNot Reported Chemical Manufacturing YesProduct Use (Ozone Depleting Substances) Product Use (Ozone Depleting Substances)NC Industrial Sources All Refrigerants- except SF6 1,107 Yes
DRAFT Reporting Template CGC. Emissions in MTCDERolled Up?
Related GHG Metrics / Activity Data
REDC Emissions By Source and SectorYear: 2010
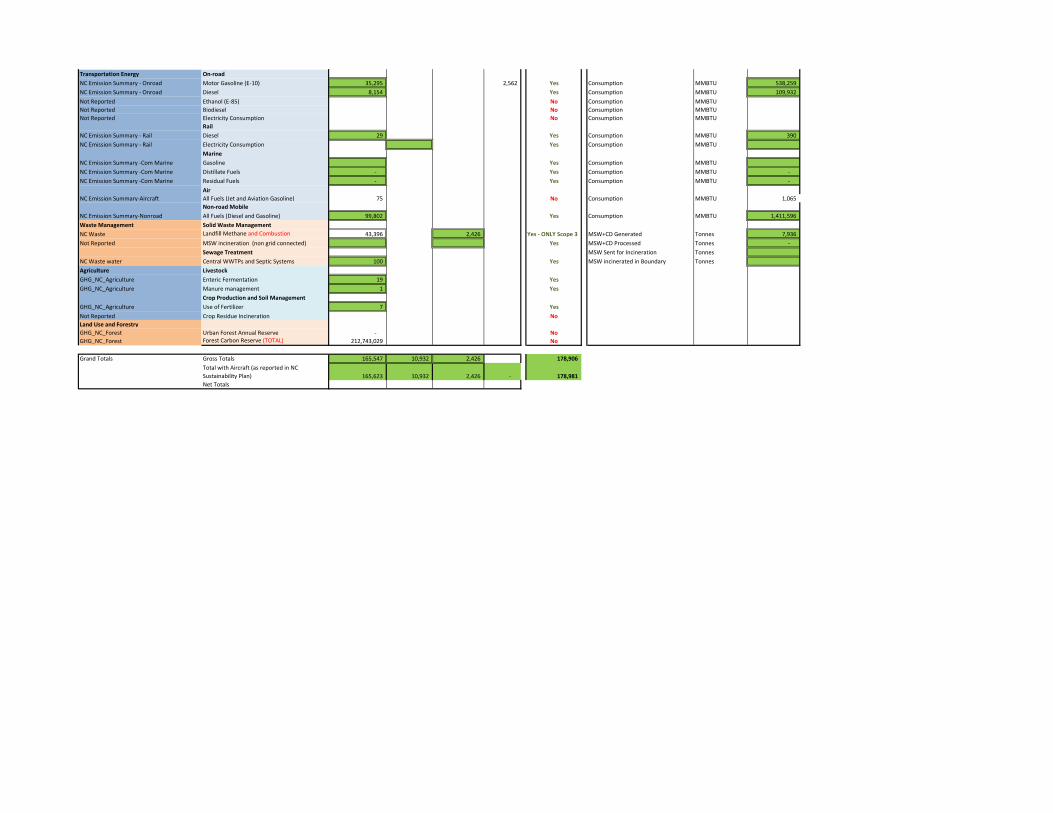
Transportation Energy On-roadNC Emission Summary - Onroad Motor Gasoline (E-10) 35,295 2,562 Yes Consumption MMBTU 538,259 NC Emission Summary - Onroad Diesel 8,154 Yes Consumption MMBTU 109,932 Not Reported Ethanol (E-85) No Consumption MMBTUNot Reported Biodiesel No Consumption MMBTUNot Reported Electricity Consumption No Consumption MMBTU
RailNC Emission Summary - Rail Diesel 29 Yes Consumption MMBTU 390 NC Emission Summary - Rail Electricity Consumption Yes Consumption MMBTU
MarineNC Emission Summary -Com Marine Gasoline Yes Consumption MMBTUNC Emission Summary -Com Marine Distillate Fuels - Yes Consumption MMBTU - NC Emission Summary -Com Marine Residual Fuels - Yes Consumption MMBTU -
AirNC Emission Summary-Aircraft All Fuels (Jet and Aviation Gasoline) 75 No Consumption MMBTU 1,065
Non-road MobileNC Emission Summary-Nonroad All Fuels (Diesel and Gasoline) 99,802 Yes Consumption MMBTU 1,411,596 Waste Management Solid Waste ManagementNC Waste Landfill Methane and Combustion 43,396 2,426 Yes - ONLY Scope 3 MSW+CD Generated Tonnes 7,936 Not Reported MSW incineration (non grid connected) Yes MSW+CD Processed Tonnes -
Sewage Treatment MSW Sent for Incineration TonnesNC Waste water Central WWTPs and Septic Systems 100 Yes MSW incinerated in Boundary TonnesAgriculture LivestockGHG_NC_Agriculture Enteric Fermentation 19 YesGHG_NC_Agriculture Manure management 1 Yes
Crop Production and Soil ManagementGHG_NC_Agriculture Use of Fertilizer 7 YesNot Reported Crop Residue Incineration NoLand Use and ForestryGHG_NC_Forest Urban Forest Annual Reserve - NoGHG_NC_Forest Forest Carbon Reserve (TOTAL) 212,743,029 No
Grand Totals Gross Totals 165,547 10,932 2,426 178,906 Total with Aircraft (as reported in NC Sustainability Plan) 165,623 10,932 2,426 - 178,981 Net Totals

REDC / County Name Hamilton
Color CodeREQUIRED for the Roll Up Report, though some data may be zero, N/A, or considered to small to countReport NO Data in cell
CO2e CO2 CH4 N2O PFC HFC SF6Built Environment Residential Energy Consumption
Electricity / Steam 6,406 6,375 4 27 Natural Gas 925 924 0 1 Propane / LPG 3,893 3,877 4 11 Distillate Fuel Oil (#1, #2, Kerosene) 8,845 8,816 8 22 Wood 433 - 147 286 Commercial Energy ConsumptionElectricity / Steam 3,360 3,344 2 14 Natural Gas 452 451 0 0 Propane / LPG 921 918 1 3 Distillate Fuel Oil (#1, #2, Kerosene) 5,142 5,125 4 13 Residual Fuel Oil (#4 and #6) - Coal - - - - Wood 89 - 30 59 Industrial Energy ConsumptionElectricity / Steam 565 562 0 2 Natural Gas - - - - Propane / LPG - - - - Distillate Fuel Oil (#1, #2, Kerosene) - - - - Residual Fuel Oil (#4 and #6) - - - - Coal - Wood - - - Energy Generation and SupplyElectricity T/D Losses 601 598 0 3 Natural Gas T/D Losses 194 194 Use of SF6 in the Utility Industry 138 138 Industrial ProcessesCement Production - Iron and Steel Production - Ferroalloy Production -
DRAFT Roll Up Report CGC. Emissions in MTCDE
REDC GHG Emissions Roll Up ReportYear: 2010 (all emissions in Column D, when summed will equal the total County or REDC protocol compliant GHG emissions estimate)

Aluminum Production - - - - - Paper and Pulp - Limestone Use - Soda Ash Use - Semi-Conductor Manufacturing - Chemical Manufacturing - Product Use (ODS Substitutes) - All Refrigerants- except utility SF6 1,107 1,107
Transportation Energy On-road: ALL(Total not ethanol)Motor Gasoline (E-10) 35,295 35,170 93 32 Diesel 8,154 8,131 17 7 Ethanol - Biodiesel - RailDiesel 29 29 0 0 Electricity Consumption - MarineGasoline - Distillate - - - - Residual Fuel Oil - - - - Off-road MobileAll Fuels (Diesel and Gasoline) 99,802 99,450 263 89
Waste Management Solid Waste ManagementLandfill Methane and Combustion 2,426 3 2,423 0 MSW incineration (non grid connected) - Sewage TreatmentCentral WWTPs and Septic Systems 100 75 25
Agriculture LivestockEnteric Fementation 19 19 Manure management 1 1 0 Crop Production and Soil ManagementUse of Fertilizer 7 7 Crop Residue Incineration -
Grand Totals 178,906 173,774 3,287 600 - 1,107 138
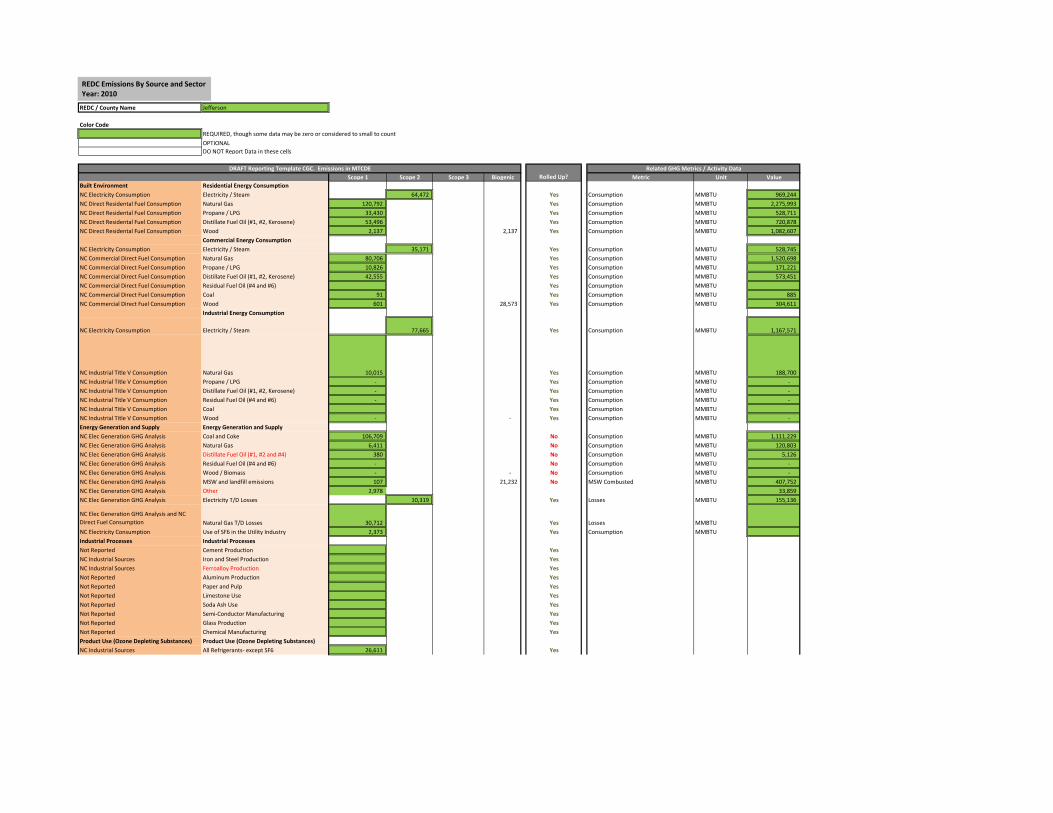
REDC / County Name Jefferson
Color CodeREQUIRED, though some data may be zero or considered to small to countOPTIONALDO NOT Report Data in these cells
Scope 1 Scope 2 Scope 3 Biogenic Metric Unit ValueBuilt Environment Residential Energy ConsumptionNC Electricity Consumption Electricity / Steam 64,472 Yes Consumption MMBTU 969,244 NC Direct Residental Fuel Consumption Natural Gas 120,792 Yes Consumption MMBTU 2,275,993 NC Direct Residental Fuel Consumption Propane / LPG 33,430 Yes Consumption MMBTU 528,711 NC Direct Residental Fuel Consumption Distillate Fuel Oil (#1, #2, Kerosene) 53,496 Yes Consumption MMBTU 720,878 NC Direct Residental Fuel Consumption Wood 2,137 2,137 Yes Consumption MMBTU 1,082,607
Commercial Energy ConsumptionNC Electricity Consumption Electricity / Steam 35,171 Yes Consumption MMBTU 528,745 NC Commercial Direct Fuel Consumption Natural Gas 80,706 Yes Consumption MMBTU 1,520,698 NC Commercial Direct Fuel Consumption Propane / LPG 10,826 Yes Consumption MMBTU 171,221 NC Commercial Direct Fuel Consumption Distillate Fuel Oil (#1, #2, Kerosene) 42,555 Yes Consumption MMBTU 573,451 NC Commercial Direct Fuel Consumption Residual Fuel Oil (#4 and #6) Yes Consumption MMBTUNC Commercial Direct Fuel Consumption Coal 91 Yes Consumption MMBTU 885 NC Commercial Direct Fuel Consumption Wood 601 28,573 Yes Consumption MMBTU 304,611
Industrial Energy Consumption
NC Electricity Consumption Electricity / Steam 77,665 Yes Consumption MMBTU 1,167,571
NC Industrial Title V Consumption Natural Gas 10,015 Yes Consumption MMBTU 188,700 NC Industrial Title V Consumption Propane / LPG - Yes Consumption MMBTU - NC Industrial Title V Consumption Distillate Fuel Oil (#1, #2, Kerosene) - Yes Consumption MMBTU - NC Industrial Title V Consumption Residual Fuel Oil (#4 and #6) - Yes Consumption MMBTU - NC Industrial Title V Consumption Coal Yes Consumption MMBTUNC Industrial Title V Consumption Wood - - Yes Consumption MMBTU - Energy Generation and Supply Energy Generation and SupplyNC Elec Generation GHG Analysis Coal and Coke 106,709 No Consumption MMBTU 1,111,229 NC Elec Generation GHG Analysis Natural Gas 6,411 No Consumption MMBTU 120,803 NC Elec Generation GHG Analysis Distillate Fuel Oil (#1, #2 and #4) 380 No Consumption MMBTU 5,126 NC Elec Generation GHG Analysis Residual Fuel Oil (#4 and #6) - No Consumption MMBTU - NC Elec Generation GHG Analysis Wood / Biomass - - No Consumption MMBTU - NC Elec Generation GHG Analysis MSW and landfill emissions 107 21,232 No MSW Combusted MMBTU 407,752 NC Elec Generation GHG Analysis Other 2,978 33,859 NC Elec Generation GHG Analysis Electricity T/D Losses 10,319 Yes Losses MMBTU 155,136
NC Elec Generation GHG Analysis and NC Direct Fuel Consumption Natural Gas T/D Losses 30,712 Yes Losses MMBTUNC Electricity Consumption Use of SF6 in the Utility Industry 2,373 Yes Consumption MMBTUIndustrial Processes Industrial ProcessesNot Reported Cement Production YesNC Industrial Sources Iron and Steel Production YesNC Industrial Sources Ferroalloy Production YesNot Reported Aluminum Production YesNot Reported Paper and Pulp YesNot Reported Limestone Use YesNot Reported Soda Ash Use YesNot Reported Semi-Conductor Manufacturing YesNot Reported Glass Production YesNot Reported Chemical Manufacturing YesProduct Use (Ozone Depleting Substances) Product Use (Ozone Depleting Substances)NC Industrial Sources All Refrigerants- except SF6 26,611 Yes
DRAFT Reporting Template CGC. Emissions in MTCDERolled Up?
Related GHG Metrics / Activity Data
REDC Emissions By Source and SectorYear: 2010

Transportation Energy On-roadNC Emission Summary - Onroad Motor Gasoline (E-10) 418,440 30,369 Yes Consumption MMBTU 6,381,302 NC Emission Summary - Onroad Diesel 129,875 Yes Consumption MMBTU 1,750,127 Not Reported Ethanol (E-85) No Consumption MMBTUNot Reported Biodiesel No Consumption MMBTUNot Reported Electricity Consumption No Consumption MMBTU
RailNC Emission Summary - Rail Diesel 22,068 Yes Consumption MMBTU 297,383 NC Emission Summary - Rail Electricity Consumption Yes Consumption MMBTU
MarineNC Emission Summary -Com Marine Gasoline Yes Consumption MMBTUNC Emission Summary -Com Marine Distillate Fuels 15,673 Yes Consumption MMBTU 211,203 NC Emission Summary -Com Marine Residual Fuels 15,672 Yes Consumption MMBTU 207,997
AirNC Emission Summary-Aircraft All Fuels (Jet and Aviation Gasoline) 7,107 No Consumption MMBTU 99,548
Non-road MobileNC Emission Summary-Nonroad All Fuels (Diesel and Gasoline) 128,777 Yes Consumption MMBTU 1,792,552 Waste Management Solid Waste ManagementNC Waste Landfill Methane and Combustion - 30,721 Yes - ONLY Scope 3 MSW+CD Generated Tonnes 100,486 Not Reported MSW incineration (non grid connected) Yes MSW+CD Processed Tonnes 192,131
Sewage Treatment MSW Sent for Incineration TonnesNC Waste water Central WWTPs and Septic Systems 11,379 Yes MSW incinerated in Boundary TonnesAgriculture LivestockGHG_NC_Agriculture Enteric Fermentation 127,471 YesGHG_NC_Agriculture Manure management 26,132 Yes
Crop Production and Soil ManagementGHG_NC_Agriculture Use of Fertilizer 9,022 YesNot Reported Crop Residue Incineration NoLand Use and ForestryGHG_NC_Forest Urban Forest Annual Reserve 61,989 NoGHG_NC_Forest Forest Carbon Reserve (TOTAL) 73,072,453 No
Grand Totals Gross Totals 1,318,856 187,628 30,721 1,537,205 Total with Aircraft (as reported in NC Sustainability Plan) 1,325,962 187,628 30,721 - 1,544,312 Net Totals

REDC / County Name Jefferson
Color CodeREQUIRED for the Roll Up Report, though some data may be zero, N/A, or considered to small to countReport NO Data in cell
CO2e CO2 CH4 N2O PFC HFC SF6Built Environment Residential Energy Consumption
Electricity / Steam 64,472 64,159 43 270 Natural Gas 120,792 120,673 48 71 Propane / LPG 33,430 33,298 33 98 Distillate Fuel Oil (#1, #2, Kerosene) 53,496 53,316 45 134 Wood 2,137 - 728 1,410 Commercial Energy ConsumptionElectricity / Steam 35,171 35,000 24 148 Natural Gas 80,706 80,627 32 47 Propane / LPG 10,826 10,783 11 32 Distillate Fuel Oil (#1, #2, Kerosene) 42,555 42,412 36 107 Residual Fuel Oil (#4 and #6) - Coal 91 90 0 0 Wood 601 - 205 397 Industrial Energy ConsumptionElectricity / Steam 77,665 77,287 52 326 Natural Gas 10,015 10,005 4 6 Propane / LPG - - - - Distillate Fuel Oil (#1, #2, Kerosene) - - - - Residual Fuel Oil (#4 and #6) - - - - Coal - Wood - - - Energy Generation and SupplyElectricity T/D Losses 10,319 10,269 7 43 Natural Gas T/D Losses 30,712 30,712 Use of SF6 in the Utility Industry 2,373 2,373 Industrial ProcessesCement Production - Iron and Steel Production - Ferroalloy Production -
DRAFT Roll Up Report CGC. Emissions in MTCDE
REDC GHG Emissions Roll Up ReportYear: 2010 (all emissions in Column D, when summed will equal the total County or REDC protocol compliant GHG emissions estimate)

Aluminum Production - - - - - Paper and Pulp - Limestone Use - Soda Ash Use - Semi-Conductor Manufacturing - Chemical Manufacturing - Product Use (ODS Substitutes) - All Refrigerants- except utility SF6 26,611 26,611
Transportation Energy On-road: ALL(Total not ethanol)Motor Gasoline (E-10) 418,440 416,962 1,104 374 Diesel 129,875 129,439 326 110 Ethanol - Biodiesel - RailDiesel 22,068 21,994 55 19 Electricity Consumption - MarineGasoline - Distillate 15,673 15,621 39 13 Residual Fuel Oil 15,672 15,621 39 13 Off-road MobileAll Fuels (Diesel and Gasoline) 128,777 128,332 333 113
Waste Management Solid Waste ManagementLandfill Methane and Combustion 30,721 42 30,679 0 MSW incineration (non grid connected) - Sewage TreatmentCentral WWTPs and Septic Systems 11,379 8,534 2,845
Agriculture LivestockEnteric Fementation 127,471 127,471 Manure management 26,132 21,610 4,522 Crop Production and Soil ManagementUse of Fertilizer 9,022 9,022 Crop Residue Incineration -
Grand Totals 1,537,205 1,265,932 222,169 20,119 - 26,611 2,373

REDC / County Name Lewis
Color CodeREQUIRED, though some data may be zero or considered to small to countOPTIONALDO NOT Report Data in these cells
Scope 1 Scope 2 Scope 3 Biogenic Metric Unit ValueBuilt Environment Residential Energy ConsumptionNC Electricity Consumption Electricity / Steam 18,048 Yes Consumption MMBTU 271,318 NC Direct Residental Fuel Consumption Natural Gas 8,806 Yes Consumption MMBTU 165,927 NC Direct Residental Fuel Consumption Propane / LPG 10,329 Yes Consumption MMBTU 163,366 NC Direct Residental Fuel Consumption Distillate Fuel Oil (#1, #2, Kerosene) 35,941 Yes Consumption MMBTU 484,316 NC Direct Residental Fuel Consumption Wood 2,829 2,829 Yes Consumption MMBTU 1,433,067
Commercial Energy ConsumptionNC Electricity Consumption Electricity / Steam 5,608 Yes Consumption MMBTU 84,312 NC Commercial Direct Fuel Consumption Natural Gas 21,467 Yes Consumption MMBTU 404,479 NC Commercial Direct Fuel Consumption Propane / LPG 12,205 Yes Consumption MMBTU 193,022 NC Commercial Direct Fuel Consumption Distillate Fuel Oil (#1, #2, Kerosene) 104,310 Yes Consumption MMBTU 1,405,626 NC Commercial Direct Fuel Consumption Residual Fuel Oil (#4 and #6) Yes Consumption MMBTUNC Commercial Direct Fuel Consumption Coal 52 Yes Consumption MMBTU 503 NC Commercial Direct Fuel Consumption Wood 2,904 137,991 Yes Consumption MMBTU 1,471,120
Industrial Energy Consumption
NC Electricity Consumption Electricity / Steam 15,627 Yes Consumption MMBTU 234,927
NC Industrial Title V Consumption Natural Gas 47,556 Yes Consumption MMBTU 896,059 NC Industrial Title V Consumption Propane / LPG 1,405 Yes Consumption MMBTU 22,224 NC Industrial Title V Consumption Distillate Fuel Oil (#1, #2, Kerosene) 173 Yes Consumption MMBTU 2,327 NC Industrial Title V Consumption Residual Fuel Oil (#4 and #6) 15 Yes Consumption MMBTU 200 NC Industrial Title V Consumption Coal Yes Consumption MMBTUNC Industrial Title V Consumption Wood - - Yes Consumption MMBTU - Energy Generation and Supply Energy Generation and SupplyNC Elec Generation GHG Analysis Coal and Coke - No Consumption MMBTU - NC Elec Generation GHG Analysis Natural Gas 1,697 No Consumption MMBTU 31,974 NC Elec Generation GHG Analysis Distillate Fuel Oil (#1, #2 and #4) 462 No Consumption MMBTU 6,222 NC Elec Generation GHG Analysis Residual Fuel Oil (#4 and #6) - No Consumption MMBTU - NC Elec Generation GHG Analysis Wood / Biomass - - No Consumption MMBTU - NC Elec Generation GHG Analysis MSW and landfill emissions - - No MSW Combusted MMBTU - NC Elec Generation GHG Analysis Other - - NC Elec Generation GHG Analysis Electricity T/D Losses 2,286 Yes Losses MMBTU 34,370
NC Elec Generation GHG Analysis and NC Direct Fuel Consumption Natural Gas T/D Losses 11,148 Yes Losses MMBTUNC Electricity Consumption Use of SF6 in the Utility Industry 526 Yes Consumption MMBTUIndustrial Processes Industrial ProcessesNot Reported Cement Production YesNC Industrial Sources Iron and Steel Production YesNC Industrial Sources Ferroalloy Production YesNot Reported Aluminum Production YesNot Reported Paper and Pulp YesNot Reported Limestone Use YesNot Reported Soda Ash Use YesNot Reported Semi-Conductor Manufacturing YesNot Reported Glass Production YesNot Reported Chemical Manufacturing YesProduct Use (Ozone Depleting Substances) Product Use (Ozone Depleting Substances)NC Industrial Sources All Refrigerants- except SF6 6,202 Yes
DRAFT Reporting Template CGC. Emissions in MTCDERolled Up?
Related GHG Metrics / Activity Data
REDC Emissions By Source and SectorYear: 2010

Transportation Energy On-roadNC Emission Summary - Onroad Motor Gasoline (E-10) 94,918 6,889 Yes Consumption MMBTU 1,447,513 NC Emission Summary - Onroad Diesel 22,257 Yes Consumption MMBTU 299,927 Not Reported Ethanol (E-85) No Consumption MMBTUNot Reported Biodiesel No Consumption MMBTUNot Reported Electricity Consumption No Consumption MMBTU
RailNC Emission Summary - Rail Diesel 663 Yes Consumption MMBTU 8,935 NC Emission Summary - Rail Electricity Consumption Yes Consumption MMBTU
MarineNC Emission Summary -Com Marine Gasoline Yes Consumption MMBTUNC Emission Summary -Com Marine Distillate Fuels - Yes Consumption MMBTU - NC Emission Summary -Com Marine Residual Fuels - Yes Consumption MMBTU -
AirNC Emission Summary-Aircraft All Fuels (Jet and Aviation Gasoline) 145 No Consumption MMBTU 2,041
Non-road MobileNC Emission Summary-Nonroad All Fuels (Diesel and Gasoline) 40,967 Yes Consumption MMBTU 570,662 Waste Management Solid Waste ManagementNC Waste Landfill Methane and Combustion 45,286 5,039 Yes - ONLY Scope 3 MSW+CD Generated Tonnes 16,483 Not Reported MSW incineration (non grid connected) Yes MSW+CD Processed Tonnes -
Sewage Treatment MSW Sent for Incineration TonnesNC Waste water Central WWTPs and Septic Systems 707 Yes MSW incinerated in Boundary TonnesAgriculture LivestockGHG_NC_Agriculture Enteric Fermentation 106,645 YesGHG_NC_Agriculture Manure management 23,249 Yes
Crop Production and Soil ManagementGHG_NC_Agriculture Use of Fertilizer 5,068 YesNot Reported Crop Residue Incineration NoLand Use and ForestryGHG_NC_Forest Urban Forest Annual Reserve 2,858 NoGHG_NC_Forest Forest Carbon Reserve (TOTAL) 121,776,510 No
Grand Totals Gross Totals 560,340 41,569 5,039 606,948 Total with Aircraft (as reported in NC Sustainability Plan) 560,484 41,569 5,039 - 607,093 Net Totals

REDC / County Name Lewis
Color CodeREQUIRED for the Roll Up Report, though some data may be zero, N/A, or considered to small to countReport NO Data in cell
CO2e CO2 CH4 N2O PFC HFC SF6Built Environment Residential Energy Consumption
Electricity / Steam 18,048 17,960 12 76 Natural Gas 8,806 8,797 3 5 Propane / LPG 10,329 10,289 10 30 Distillate Fuel Oil (#1, #2, Kerosene) 35,941 35,820 31 90 Wood 2,829 - 963 1,866 Commercial Energy ConsumptionElectricity / Steam 5,608 5,581 4 24 Natural Gas 21,467 21,446 8 13 Propane / LPG 12,205 12,157 12 36 Distillate Fuel Oil (#1, #2, Kerosene) 104,310 103,960 89 261 Residual Fuel Oil (#4 and #6) - Coal 52 51 0 0 Wood 2,904 - 989 1,915 Industrial Energy ConsumptionElectricity / Steam 15,627 15,551 10 66 Natural Gas 47,556 47,509 19 28 Propane / LPG 1,405 1,400 1 4 Distillate Fuel Oil (#1, #2, Kerosene) 173 172 0 0 Residual Fuel Oil (#4 and #6) 15 15 0 0 Coal - Wood - - - Energy Generation and SupplyElectricity T/D Losses 2,286 2,275 2 10 Natural Gas T/D Losses 11,148 11,148 Use of SF6 in the Utility Industry 526 526 Industrial ProcessesCement Production - Iron and Steel Production - Ferroalloy Production -
DRAFT Roll Up Report CGC. Emissions in MTCDE
REDC GHG Emissions Roll Up ReportYear: 2010 (all emissions in Column D, when summed will equal the total County or REDC protocol compliant GHG emissions estimate)

Aluminum Production - - - - - Paper and Pulp - Limestone Use - Soda Ash Use - Semi-Conductor Manufacturing - Chemical Manufacturing - Product Use (ODS Substitutes) - All Refrigerants- except utility SF6 6,202 6,202
Transportation Energy On-road: ALL(Total not ethanol)Motor Gasoline (E-10) 94,918 94,582 251 85 Diesel 22,257 22,183 56 19 Ethanol - Biodiesel - RailDiesel 663 661 2 1 Electricity Consumption - MarineGasoline - Distillate - - - - Residual Fuel Oil - - - - Off-road MobileAll Fuels (Diesel and Gasoline) 40,967 40,825 106 36
Waste Management Solid Waste ManagementLandfill Methane and Combustion 5,039 7 5,032 0 MSW incineration (non grid connected) - Sewage TreatmentCentral WWTPs and Septic Systems 707 530 177
Agriculture LivestockEnteric Fementation 106,645 106,645 Manure management 23,249 19,171 4,078 Crop Production and Soil ManagementUse of Fertilizer 5,068 5,068 Crop Residue Incineration -
Grand Totals 606,948 441,240 145,094 13,887 - 6,202 526

REDC / County Name St Lawrence
Color CodeREQUIRED, though some data may be zero or considered to small to countOPTIONALDO NOT Report Data in these cells
Scope 1 Scope 2 Scope 3 Biogenic Metric Unit ValueBuilt Environment Residential Energy ConsumptionNC Electricity Consumption Electricity / Steam 78,430 Yes Consumption MMBTU 1,179,076 NC Direct Residental Fuel Consumption Natural Gas 117,424 Yes Consumption MMBTU 2,212,546 NC Direct Residental Fuel Consumption Propane / LPG 24,171 Yes Consumption MMBTU 382,275 NC Direct Residental Fuel Consumption Distillate Fuel Oil (#1, #2, Kerosene) 99,390 Yes Consumption MMBTU 1,339,327 NC Direct Residental Fuel Consumption Wood 4,903 4,903 Yes Consumption MMBTU 2,483,746
Commercial Energy ConsumptionNC Electricity Consumption Electricity / Steam 25,968 Yes Consumption MMBTU 390,393 NC Commercial Direct Fuel Consumption Natural Gas 76,042 Yes Consumption MMBTU 1,432,815 NC Commercial Direct Fuel Consumption Propane / LPG 7,587 Yes Consumption MMBTU 119,988 NC Commercial Direct Fuel Consumption Distillate Fuel Oil (#1, #2, Kerosene) 76,631 Yes Consumption MMBTU 1,032,636 NC Commercial Direct Fuel Consumption Residual Fuel Oil (#4 and #6) Yes Consumption MMBTUNC Commercial Direct Fuel Consumption Coal 22 Yes Consumption MMBTU 213 NC Commercial Direct Fuel Consumption Wood 1,337 63,535 Yes Consumption MMBTU 677,342
Industrial Energy Consumption
NC Electricity Consumption Electricity / Steam 58,733 Yes Consumption MMBTU 882,965
NC Industrial Title V Consumption Natural Gas 95,780 Yes Consumption MMBTU 1,804,711 NC Industrial Title V Consumption Propane / LPG 75 Yes Consumption MMBTU 1,193 NC Industrial Title V Consumption Distillate Fuel Oil (#1, #2, Kerosene) 19 Yes Consumption MMBTU 257 NC Industrial Title V Consumption Residual Fuel Oil (#4 and #6) 26,164 Yes Consumption MMBTU 347,235 NC Industrial Title V Consumption Coal Yes Consumption MMBTUNC Industrial Title V Consumption Wood - - Yes Consumption MMBTU - Energy Generation and Supply Energy Generation and SupplyNC Elec Generation GHG Analysis Coal and Coke - No Consumption MMBTU - NC Elec Generation GHG Analysis Natural Gas 2,996 No Consumption MMBTU 56,452 NC Elec Generation GHG Analysis Distillate Fuel Oil (#1, #2 and #4) 26 No Consumption MMBTU 354 NC Elec Generation GHG Analysis Residual Fuel Oil (#4 and #6) - No Consumption MMBTU - NC Elec Generation GHG Analysis Wood / Biomass - - No Consumption MMBTU - NC Elec Generation GHG Analysis MSW and landfill emissions - - No MSW Combusted MMBTU - NC Elec Generation GHG Analysis Other - - NC Elec Generation GHG Analysis Electricity T/D Losses 9,494 Yes Losses MMBTU 142,732
NC Elec Generation GHG Analysis and NC Direct Fuel Consumption Natural Gas T/D Losses 41,154 Yes Losses MMBTUNC Electricity Consumption Use of SF6 in the Utility Industry 2,184 Yes Consumption MMBTUIndustrial Processes Industrial ProcessesNot Reported Cement Production YesNC Industrial Sources Iron and Steel Production YesNC Industrial Sources Ferroalloy Production YesNot Reported Aluminum Production 234,165 YesNot Reported Paper and Pulp YesNot Reported Limestone Use YesNot Reported Soda Ash Use YesNot Reported Semi-Conductor Manufacturing YesNot Reported Glass Production YesNot Reported Chemical Manufacturing YesProduct Use (Ozone Depleting Substances) Product Use (Ozone Depleting Substances)NC Industrial Sources All Refrigerants- except SF6 25,630 Yes
DRAFT Reporting Template CGC. Emissions in MTCDERolled Up?
Related GHG Metrics / Activity Data
REDC Emissions By Source and SectorYear: 2010

Transportation Energy On-roadNC Emission Summary - Onroad Motor Gasoline (E-10) 309,498 22,463 Yes Consumption MMBTU 4,719,912 NC Emission Summary - Onroad Diesel 71,001 Yes Consumption MMBTU 956,767 Not Reported Ethanol (E-85) No Consumption MMBTUNot Reported Biodiesel No Consumption MMBTUNot Reported Electricity Consumption No Consumption MMBTU
RailNC Emission Summary - Rail Diesel 30,489 Yes Consumption MMBTU 410,849 NC Emission Summary - Rail Electricity Consumption Yes Consumption MMBTU
MarineNC Emission Summary -Com Marine Gasoline Yes Consumption MMBTUNC Emission Summary -Com Marine Distillate Fuels 11,399 Yes Consumption MMBTU 153,602 NC Emission Summary -Com Marine Residual Fuels 11,398 Yes Consumption MMBTU 151,270
AirNC Emission Summary-Aircraft All Fuels (Jet and Aviation Gasoline) 547 No Consumption MMBTU 7,675
Non-road MobileNC Emission Summary-Nonroad All Fuels (Diesel and Gasoline) 100,466 Yes Consumption MMBTU 1,401,551 Waste Management Solid Waste ManagementNC Waste Landfill Methane and Combustion - 21,225 Yes - ONLY Scope 3 MSW+CD Generated Tonnes 69,423 Not Reported MSW incineration (non grid connected) Yes MSW+CD Processed Tonnes -
Sewage Treatment MSW Sent for Incineration TonnesNC Waste water Central WWTPs and Septic Systems 10,465 Yes MSW incinerated in Boundary TonnesAgriculture LivestockGHG_NC_Agriculture Enteric Fermentation 139,790 YesGHG_NC_Agriculture Manure management 27,660 Yes
Crop Production and Soil ManagementGHG_NC_Agriculture Use of Fertilizer 9,006 YesNot Reported Crop Residue Incineration NoLand Use and ForestryGHG_NC_Forest Urban Forest Annual Reserve 39,610 NoGHG_NC_Forest Forest Carbon Reserve (TOTAL) 248,878,471 No
Grand Totals Gross Totals 1,553,849 172,626 21,225 1,747,699 Total with Aircraft (as reported in NC Sustainability Plan) 1,554,396 172,626 21,225 - 1,748,246 Net Totals

REDC / County Name St Lawrence
Color CodeREQUIRED for the Roll Up Report, though some data may be zero, N/A, or considered to small to countReport NO Data in cell
CO2e CO2 CH4 N2O PFC HFC SF6Built Environment Residential Energy Consumption
Electricity / Steam 78,430 78,049 52 329 Natural Gas 117,424 117,309 46 69 Propane / LPG 24,171 24,076 24 71 Distillate Fuel Oil (#1, #2, Kerosene) 99,390 99,057 84 249 Wood 4,903 - 1,669 3,234 Commercial Energy ConsumptionElectricity / Steam 25,968 25,842 17 109 Natural Gas 76,042 75,968 30 44 Propane / LPG 7,587 7,557 8 22 Distillate Fuel Oil (#1, #2, Kerosene) 76,631 76,374 65 192 Residual Fuel Oil (#4 and #6) - Coal 22 22 0 0 Wood 1,337 - 455 882 Industrial Energy ConsumptionElectricity / Steam 58,733 58,448 39 246 Natural Gas 95,780 95,686 38 56 Propane / LPG 75 75 0 0 Distillate Fuel Oil (#1, #2, Kerosene) 19 19 0 0 Residual Fuel Oil (#4 and #6) 26,164 26,077 22 65 Coal - Wood - - - Energy Generation and SupplyElectricity T/D Losses 9,494 9,448 6 40 Natural Gas T/D Losses 41,154 41,154 Use of SF6 in the Utility Industry 2,184 2,184 Industrial ProcessesCement Production - Iron and Steel Production - Ferroalloy Production -
DRAFT Roll Up Report CGC. Emissions in MTCDE
REDC GHG Emissions Roll Up ReportYear: 2010 (all emissions in Column D, when summed will equal the total County or REDC protocol compliant GHG emissions estimate)

Aluminum Production 234,165 211,169 - - 22,996 Paper and Pulp - Limestone Use - Soda Ash Use - Semi-Conductor Manufacturing - Chemical Manufacturing - Product Use (ODS Substitutes) - All Refrigerants- except utility SF6 25,630 25,630
Transportation Energy On-road: ALL(Total not ethanol)Motor Gasoline (E-10) 309,498 308,405 817 277 Diesel 71,001 70,762 178 60 Ethanol - Biodiesel - RailDiesel 30,489 30,386 76 26 Electricity Consumption - MarineGasoline - Distillate 11,399 11,360 29 10 Residual Fuel Oil 11,398 11,360 28 10 Off-road MobileAll Fuels (Diesel and Gasoline) 100,466 100,118 260 88
Waste Management Solid Waste ManagementLandfill Methane and Combustion 21,225 29 21,195 0 MSW incineration (non grid connected) - Sewage TreatmentCentral WWTPs and Septic Systems 10,465 7,849 2,616
Agriculture LivestockEnteric Fementation 139,790 139,790 Manure management 27,660 22,914 4,746 Crop Production and Soil ManagementUse of Fertilizer 9,006 9,006 Crop Residue Incineration -
Grand Totals 1,747,699 1,437,596 236,847 22,446 22,996 25,630 2,184

Electricity Consumption GHG Emissions
CO2e (Metric Tons)1
# Households2 Population2 MWh MMBTU3CO2 CH4 N2O Total
New York State4 7,317,755 19,378,102 144,624,000
North Country 164,730 433,193 3,409,822 11,634,312 770,130 518 3,246 773,894
Clinton 31,582 82,128 1,088,539 3,714,096 245,854 165 1,036 247,055
Essex 16,262 39,370 321,816 1,098,037 72,684 49 306 73,039
Franklin 19,054 51,599 280,867 958,318 63,436 43 267 63,746
Hamilton 2,262 4,836 45,519 155,309 10,281 7 43 10,331 Jefferson 43,451 116,229 781,231 2,665,560 176,446 119 744 177,308 Lewis 10,514 27,087 173,082 590,557 39,092 26 165 39,283 St. Lawrence 41,605 111,944 718,767 2,452,435 162,338 109 684 163,132
CO2e (Metric Tons)1
Population MWh MMBTU3 CO2 CH4 N2O TotalNorth Country 433,193 3,409,822 11,634,312 770,130 518 3,246 773,894 Residential 1,435,160 4,896,765 324,140 218 1,366 325,724
Clinton 443,353 1,512,719.34 100,134 67 422 100,623 Essex 123,335 420,818.44 27,856 19 117 27,992 Franklin 131,092 447,284.36 29,608 20 125 29,753 Hamilton 28,225 96,304.45 6,375 4 27 6,406 Jefferson 284,069 969,244.33 64,159 43 270 64,472 Lewis 79,519 271,317.99 17,960 12 76 18,048 St. Lawrence 345,568 1,179,076.44 78,049 52 329 78,430
Commercial5 788,526 2,690,450 178,094 120 751 178,964 Clinton 345,549 1,179,013 78,044 52 329 78,426 Essex 75,689 258,250 17,095 11 72 17,178 Franklin 58,388 199,221 13,187 9 56 13,252 Hamilton 14,806 50,516 3,344 2 14 3,360 Jefferson 154,966 528,745 35,000 24 148 35,171 Lewis 24,710 84,312 5,581 4 24 5,608 St. Lawrence 114,418 390,393 25,842 17 109 25,968
Industrial 1,186,136 4,047,096 267,897 180 1,129 269,206 Clinton 299,638 1,022,364 67,675 45 285 68,006 Essex 122,793 418,968 27,734 19 117 27,869 Franklin 91,387 311,813 20,640 14 87 20,741 Hamilton 2,488 8,488 562 0 2 565 Jefferson 342,195 1,167,571 77,287 52 326 77,665 Lewis 68,853 234,927 15,551 10 66 15,627 St. Lawrence 258,782 882,965 58,448 39 246 58,733
Notes1. CO2e calculated based on regional electricity consumption provided by NYSEG, National Grid, and municiple electricity providers and eGRID 2012 NYUP emission factors.2. 2010 US Census3. 1 MWh = 3.412 MMBtu4. New York State Totals from EIA New York http://www.eia.gov/electricity/state/newyork/5. Commercial totals include commerical and government sectors
Grid Losses from Electricity Consumption GHG Emissions
CO2e (Metric Tons)MWh MMBTU3 CO2 CH4 N2O Total
North Country 198,452 677,117 44,822 30 189 45,041 0.058080963Clinton 63,353 216,160 14,309 10 60 14,379 Essex 18,730 63,906 4,230 3 18 4,251 Franklin 16,346 55,774 3,692 2 16 3,710 Hamilton 2,649 9,039 598 0 3 601 Jefferson 45,468 155,136 10,269 7 43 10,319 Lewis 10,073 34,370 2,275 2 10 2,286 St. Lawrence 41,832 142,732 9,448 6 40 9,494 Total 198,452 677,117 44,822 30 189 45,041
1. CO2e calculated based on regional electricity consumption emissions and eGRID 2012 reported Eastern Grid loss rate of 5.82%
Electrical Transmission and Distribution--SF6 Emissions
CO2e (Metric Tons)1
MWh2 SF63
United States1,2 3,884,000,000 11,800,000 North Country 3,409,822 10,359
Clinto 1,088,539 3,307 Essex 321,816 978 Frank 280,867 853 Hami 45,519 138 Jeffers 781,231 2,373 Lewis 173,082 526 St. La 718,767 2,184
1. CO2e calculated based on ratio of regional and national electricity consumption and reported national SF6 emissions. 2. U.S.Electricity end use consumption from EIA Annual Review, 2010 http://www.eia.gov/totalenergy/data/annual/showtext.cfm?t=ptb08013. U.S. SF6 emissions from U.S. Greenhouse Gas Inventory Report for 2010:http://www.epa.gov/climatechange/ghgemissions/usinventoryreport.html
Supporting data and calculations are provided in the following E&E Excel Workbook:File Name:NC Electricity Consumption Emissions1_23.xlsxDate:1/23/2013
County
County
Sector
County
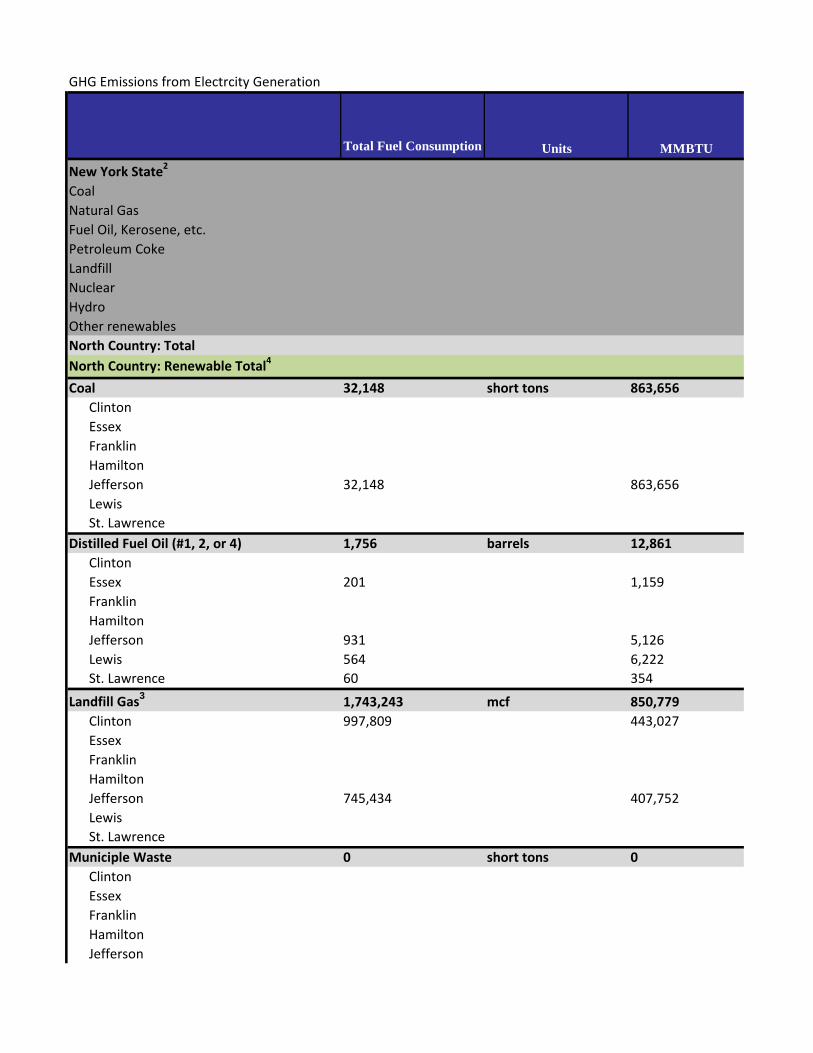
GHG Emissions from Electrcity Generation
Total Fuel Consumption Units MMBTU
New York State2
CoalNatural GasFuel Oil, Kerosene, etc.Petroleum CokeLandfillNuclearHydroOther renewablesNorth Country: TotalNorth Country: Renewable Total4
Coal 32,148 short tons 863,656Clinton Essex FranklinHamiltonJefferson 32,148 863,656Lewis St. Lawrence
Distilled Fuel Oil (#1, 2, or 4) 1,756 barrels 12,861Clinton Essex 201 1,159FranklinHamiltonJefferson 931 5,126Lewis 564 6,222St. Lawrence 60 354
Landfill Gas3 1,743,243 mcf 850,779Clinton 997,809 443,027Essex FranklinHamiltonJefferson 745,434 407,752Lewis St. Lawrence
Municiple Waste 0 short tons 0Clinton Essex FranklinHamiltonJefferson

Lewis St. Lawrence
Natural Gas 4,020,453 mcf 4,050,971Clinton 3,818,200 3,841,742Essex FranklinHamiltonJefferson 121,450 120,803Lewis 24,798 31,974St. Lawrence 56,005 56,452
Petroleum Coke 8,537 short tons 247,573Clinton Essex FranklinHamiltonJefferson 8,537 247,573Lewis St. Lawrence
Tires 1,114 short tons 33,859Clinton Essex FranklinHamiltonJefferson 1,114 33,859Lewis St. Lawrence
Residual Oil 85,735 barrels 1,086,225Clinton Essex 85,735 1,086,225FranklinHamiltonJefferson Lewis St. Lawrence
Hydro4 0 0 84,278,517Clinton 0 2,551,321Essex 0Franklin 0 503,603HamiltonJefferson 0 3,740,740Lewis 0 2,769,329St. Lawrence 0 74,713,524
Wood3,4 312,011 short tons 3,599,772Clinton Essex 90,322 1,570,652Franklin 221,689 2,029,120

HamiltonJefferson Lewis St. Lawrence
Wind4 0 0 13,786,420Clinton 0 5,066,993Essex Franklin 0 1,875,406HamiltonJefferson Lewis 0 6,844,021St. Lawrence
Notes1. CO2e calculated based on regional electricity generation data from 2010 EIA Form 923 reported energy use by *Federal Register / Vol. 74, No. 209 / Friday, October 30, 2009 / Rules and Regulations, Table C-1 and Table C-2, h 2. New York State Totals from EIA New York http://www.eia.gov/electricity/state/newyork/3. CO2 from Wood products, landfill gas and 56%** of municipal waste generators are considered a source of bio **Table B2, "Methodology for Allocating Municipal Solid Waste to Biogenic/Non-Biogenic Energy" http://www.eia4. Renewable sources highlighted in green
GHG Emissions from Natural Gas Electricity Generation Transmission and Distribution Losses1
% T&D Loss Total Natural Gas (mcf) CH4 Losses in mcf
North Country 1.8% 4,020,453 72,368 Clinton 1.8% 3,818,200 68,728 Essex 1.8% - - Franklin 1.8% - - Hamilton 1.8% - - Jefferson 1.8% 121,450 2,186 Lewis 1.8% 24,798 446 St. Lawrence 1.8% 56,005 1,008
Notes1. CO2e from T&D losses calculated based on ratio of estimated % fuel loss and total CO2e estimated from natura
Supporting data and calculations are provided in the following E&E Excel Workbook:File Name:NC Elect Generation GHG Analysis1_21.xlsxDate:1/21/2013

MWh Generated Non-biogenic CO2 CH4 N2O
136,961,654 41,583,758 13,582,766 48,915,545
2,004,975
41,869,535 25,471,697
4,814,548 10,986,526 812,479 5,737 11,403 10,311,641 - 2,419 4,687
61,044 80,665 200 428
61,044 80,665 200 428
720 951 1 2
24 86 0 0
378 379 0 1270 460 0 1
48 26 0 0
78,935 0 57 16640,166 0 30 87
38,769 0 27 80
0 0 0 0
CO2e (Metric Tons)1

421,901 214,782 85 126401,387 203,689 81 119
12,386 6,405 3 42,360 1,695 1 15,768 2,993 1 2
17,768 25,354 16 46
17,768 25,354 16 46
2,467 2,911 23 44
2,467 2,911 23 44
92,051 81,575 68 202
92,051 81,575 68 202
8,638,596 0 0 0261,513 0 0 0
51,620 0 0 0
383,430 0 0 0283,859 0 0 07,658,174 0 0 0
259,923 0 2,419 4,687
129,509 0 1,055 2,045130,414 0 1,364 2,642

1,413,122 0 0 0519,372 0 0 0
192,231 0 0 0
701,519 0 0 0
facility, using fuel type emission factors from EPA's Manditory Reporting Rule(MRR)* http://epa.gov/climatechange/emissions/downloads09/GHG-MRR-FinalRule.pdf
genic emissions, not to be included in GHG emission totals a.gov/cneaf/solar.renewables/page/mswaste/msw_report.html
CH4 Losses in kg Non biogenic Total CO2e
3,242,093 30,882 3,078,996 29,329
- - - - - -
97,937 933 19,997 190 45,162 430
al gas use for electricity generation within the region.
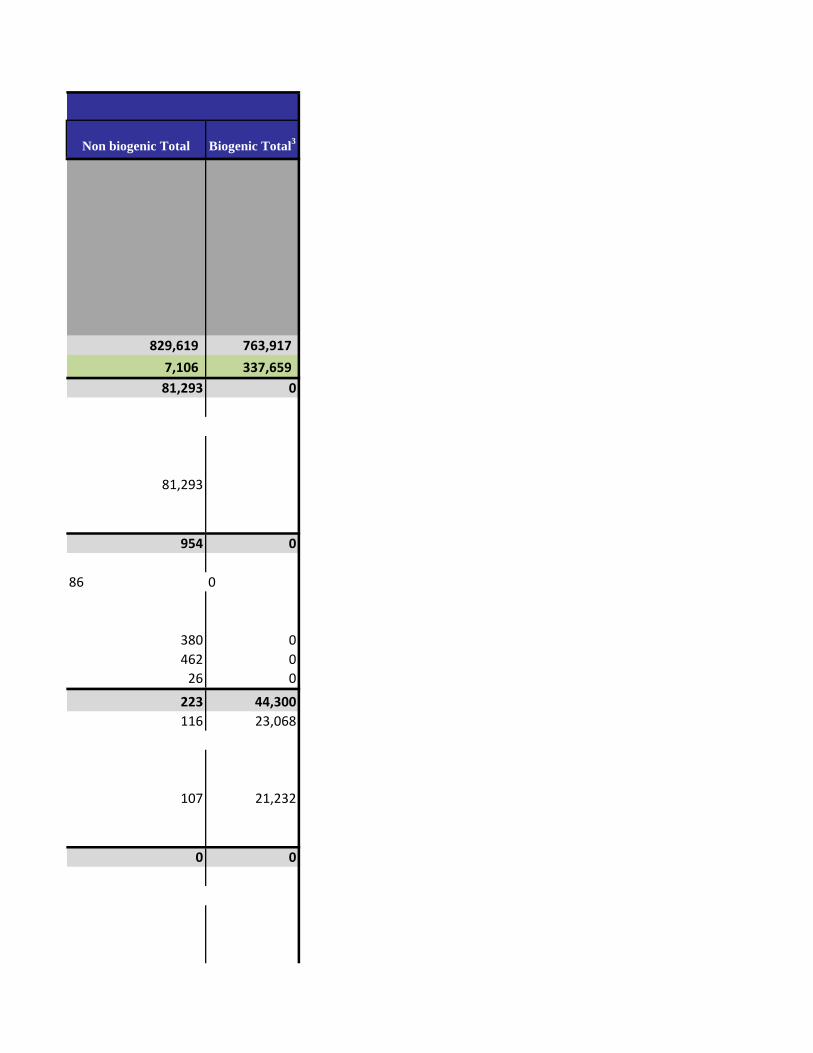
Non biogenic Total Biogenic Total3
829,619 763,917 7,106 337,659 81,293 0
81,293
954 0
86 0
380 0462 0
26 0
223 44,300116 23,068
107 21,232
0 0

214,993 0203,889 0
6,411 01,697 02,996 0
25,416 0
25,416 0
2,978 0
2,978 0
81,846 0
81,846 0
0 00 0
0 0
0 00 00 0
7,106 337,659
3,100 147,3274,005 190,331

0 00 0
0 0
0 0

# Households2 mmBTU2 CO2
New York State 7,317,755 595,650,000 31,788,580 Natural Gas 3,972,785 399,700,000 21,192,094 Bottled, Tank, or LP gas 225,680 22,200,000 1,398,156 Fuel Oil, Kerosene, etc. 2,207,233 124,300,000 9,193,228 Wood 138,599 49,400,000 - Coal 19,542 50,000 5,102 North Country 164,730 21,074,411 824,013
Natural Gas 38,179 5,471,996 290,125 Bottled, Tank, or LP gas 13,405 1,428,293 102,880 Fuel Oil, Kerosene, etc. 64,432 5,825,306 430,840 Wood 20,531 8,347,161 - Coal 556 1,654 169 Clinton 31,582 2,815,653 119,297
Natural Gas 3,137 426,109 22,592 Bottled, Tank, or LP gas 1,083 120,481 7,588 Fuel Oil, Kerosene, etc. 14,956 1,204,518 89,086 Wood 2,995 1,064,247 - Coal 109 298 30
Essex 16,262 2,012,211 84,337 Natural Gas 1,101 182,028 9,651 Bottled, Tank, or LP gas 1,605 12,040 13,684 Fuel Oil, Kerosene, etc. 8,416 824,645 60,991 Wood 2,298 993,385 - Coal 34 114 12
Franklin 19,054 2,555,611 104,065 Natural Gas 1,173 191,958 10,178 Bottled, Tank, or LP gas 1,193 159,856 10,068 Fuel Oil, Kerosene, etc. 11,673 1,132,428 83,754 Wood 2,502 1,070,733 - Coal 193 635 65
Hamilton 2,262 417,569 13,617 Natural Gas 95 17,434 924 Bottled, Tank, or LP gas 409 61,564 3,877 Fuel Oil, Kerosene, etc. 1,095 119,195 8,816 Wood 457 219,375 - Coal - - -
Jefferson 43,451 4,608,622 207,332 Natural Gas 17,892 2,275,993 120,673 Bottled, Tank, or LP gas 5,073 528,711 33,298 Fuel Oil, Kerosene, etc. 9,557 720,878 53,316 Wood 3,253 1,082,607 - Coal 169 433 44
Residential Building Emissions from Stationary Combustion

Lewis 10,514 2,246,743 54,913 Natural Gas 934 165,927 8,797 Bottled, Tank, or LP gas 1,123 163,366 10,289 Fuel Oil, Kerosene, etc. 4,599 484,316 35,820 Wood 3,084 1,433,067 - Coal 19 67 7
St. Lawrence 41,605 6,418,002 240,452 Natural Gas 13,847 2,212,546 117,309 Bottled, Tank, or LP gas 2,920 382,275 24,076 Fuel Oil, Kerosene, etc. 14,136 1,339,327 99,057 Wood 5,942 2,483,746 - Coal 33 107 11
Notes:1. CO2e calculated based on allocation of EIA 2010 Residential Energy use in New York*, using *http://www.eia.gov/state/seds/sep_sum/html/pdf/sum_btu_com.pdf**Federal Register / Vol. 74, No. 209 / Friday, October 30, 2009 / Rules and Regulations, Table C 2. New York State, regional and county residential energy totals allocated based on 2007 - 2010 3. CO2 from Wood products are considered a source of biogenic emissions, not to be included in 4. Renewable sources highlighted in green
GHG Emissions from Residential Natural Gas Use Transmission and Distribution Losse
% T&D LossTotal Natural Gas
(mcf)CH4 Losses in
mcfNorth Country 1.8% 5,322,954 95,813
Clinton 1.8% 414,503 7,461 Essex 1.8% 177,070 3,187 Franklin 1.8% 186,730 3,361 Hamilton 1.8% 16,959 305 Jefferson 1.8% 2,214,001 39,852 Lewis 1.8% 161,408 2,905 St. Lawrence 1.8% 2,152,283 38,741
Notes1. CO2e from T&D losses calculated based on ratio of estimated % fuel loss and total residentia Supporting data and calculations are provided in the following E&E Excel Workbook:File Name:NC Residential Direct Energy Sources 1_21_13.xlsxDate:1/21/2013

CH4 N2O Total Biogenic Total3
50,832 103,983 31,943,395 4,633,720 8,394 12,391 21,212,878 1,399 4,129 1,403,684 7,831 23,120 9,224,179
33,197 64,319 97,516 4,633,720 12 25 5,138
6,194 12,426 842,634 323,887 115 170 290,410 103 304 103,286 367 1,084 432,290
5,609 10,868 16,477 323,887 0 1 170
808 1,645 121,750 99,826 9 13 22,614 8 22 7,618
76 224 89,386 715 1,386 2,101 99,826
0 0 31 737 1,493 86,567 93,180
4 6 9,661 14 40 13,738 52 153 61,196
668 1,293 1,961 93,180 0 0 12
805 1,641 106,510 100,435 4 6 10,188
10 30 10,108 71 211 84,036
720 1,394 2,114 100,435 0 0 65
159 320 14,096 20,577 0 1 925 4 11 3,893 8 22 8,845
147 286 433 20,577 - - - 854 1,713 209,899 2,137
48 71 120,792 33 98 33,430 45 134 53,496
728 1,410 2,137 2,137 0 0 44
CO2e (Metric Tons)1

1,007 1,991 57,912 2,829 3 5 8,806
10 30 10,329 31 90 35,941
963 1,866 2,829 2,829 0 0 7
1,824 3,623 245,899 4,903 46 69 117,424 24 71 24,171 84 249 99,390
1,669 3,234 4,903 4,903 0 0 11
g fuel type emission factors from EPA's Manditory Reporting Rule(MRR)**
C-1 and Table C-2, http://epa.gov/climatechange/emissions/downloads09/GHG-MRR-FinalRule.pdf ACS data for type of residence and heating fuel type, 2010 US Census data used for total occupied units n GHG emission totals
es1
CH4 Losses in lbs Total CO2e4,292,429.83 40,887
334,255.12 3,184 142,789.10 1,360 150,578.87 1,434
13,676.08 130 1,785,370.63 17,006
130,159.36 1,240 1,735,600.68 16,532
al natural gas use within the region.


s, and HDD determined based on NOAA New York State climate divisions. fuel use by structure size determ


mined though EPA study provided to GHG Inventory Protocol group.

Workers2 Sq Footage2 mmBTU1 CO2
New York State 6,618,037 6,018,827,593 431,800,000 24,923,838 Natural Gas 4,005,538 3,519,948,423 294,100,000 15,593,182 Bottled, Tank, or LP gas 227,624 183,398,128 6,600,000 415,668 Fuel Oil, Kerosene, etc. 2,225,226 2,200,987,287 120,400,000 8,904,784 Wood 139,846 97,326,344 10,600,000 - Coal 19,802 17,167,411 100,000 10,204 North Country 108,030 145,008,454 13,117,078 639,796
Natural Gas 30,547 36,060,409 3,861,032 204,712 Bottled, Tank, or LP gas 10,486 14,567,392 638,891 40,237 Fuel Oil, Kerosene, etc. 51,115 67,771,688 5,333,853 394,492 Wood 15,412 26,088,771 3,279,824 - Coal 470 520,194 3,478 355 Clinton 19,324 20,033,513 1,606,457 89,852
Natural Gas 2,721 2,820,920 289,112 15,329 Bottled, Tank, or LP gas 939 973,512 39,622 2,495 Fuel Oil, Kerosene, etc. 12,971 13,448,046 973,021 71,965 Wood 2,598 2,693,232 304,083 - Coal 94 97,804 619 63
Essex 10,233 10,956,865 929,477 48,976 Natural Gas 837 896,552 100,186 5,312 Bottled, Tank, or LP gas 1,221 1,306,894 57,994 3,652 Fuel Oil, Kerosene, etc. 6,401 6,854,261 540,726 39,992 Wood 1,748 1,871,420 230,379 - Coal 26 27,737 191 20
Franklin 14,920 13,113,734 1,135,051 63,027 Natural Gas 1,046 919,495 105,229 5,579 Bottled, Tank, or LP gas 1,063 934,595 42,474 2,675 Fuel Oil, Kerosene, etc. 10,408 9,148,063 739,101 54,664 Wood 2,231 1,960,583 247,181 - Coal 172 150,997 1,066 109
Hamilton 1,348 1,523,110 137,483 6,494 Natural Gas 62 70,351 8,513 451 Bottled, Tank, or LP gas 268 303,215 14,570 918 Fuel Oil, Kerosene, etc. 718 811,153 69,292 5,125 Wood 299 338,391 45,108 - Coal - - - -
Jefferson 133,914 Natural Gas 15,343 15,490,389 1,520,698 80,627 Bottled, Tank, or LP gas 4,350 4,391,995 171,221 10,783 Fuel Oil, Kerosene, etc. 8,195 8,274,249 573,451 42,412 Wood 2,790 11,036,031 304,611 - Coal 145 146,120 885 90
Commercial Energy Use Emissions

Lewis 4,454 29,254,356 3,474,750 137,613 Natural Gas 426 3,342,746 404,479 21,446 Bottled, Tank, or LP gas 512 4,016,973 193,022 12,157 Fuel Oil, Kerosene, etc. 2,099 16,454,687 1,405,626 103,960 Wood 1,408 5,372,527 1,471,120 - Coal 9 67,423 503 51
St. Lawrence 26,929 30,788,092 3,262,994 159,920 Natural Gas 10,111 12,519,954 1,432,815 75,968 Bottled, Tank, or LP gas 2,132 2,640,208 119,988 7,557 Fuel Oil, Kerosene, etc. 10,322 12,781,229 1,032,636 76,374 Wood 4,339 2,816,587 677,342 - Coal 24 30,113 213 22
Notes:1. CO2e calculated based on allocation of EIA 2010 Commercial Energy use in New York*, using fuel type emis *http://www.eia.gov/state/seds/sep_sum/html/pdf/sum_btu_com.pdf**Federal Register / Vol. 74, No. 209 / Friday, October 30, 2009 / Rules and Regulations, Table C-1 and Table 2. New York State, regional and county commercial energy totals allocated based on NYS 2010 Department of 3. CO2 from Wood products are considered a source of biogenic emissions, not to be included in GHG emissio
GHG Emissions from Natural Gas Use Transmission and Distribution Losses1
% T&D LossTotal Natural
Gas (mcf)CH4 Losses in
mcf CH4 Losses in lbsNatural Gas T&D Losses 1.8% 3,755,867.97 67,606 3,028,731.93
Clinton 1.8% 281,237.82 5,062 226,790.17 Essex 1.8% 97,456.83 1,754 78,589.19 Franklin 1.8% 102,363.16 1,843 82,545.65 Hamilton 1.8% 8,280.82 149 6,677.65 Jefferson 1.8% 1,479,278.14 26,627 1,192,889.89 Lewis 1.8% 393,462.50 7,082 317,288.16 St. Lawrence 1.8% 1,393,788.72 25,088 1,123,951.22
Notes1. CO2e from T&D losses calculated based on ratio of estimated % fuel loss and total residential natural gas u
Supporting data and calculations are provided in the following E&E Excel Workbook:File Name:NC Commercial Energy Emissions 1-21-2013Date:1/21/2013

CH4 N2O TotalBiogenic
Total3
21,323 46,590 24,991,751 6,176 9,117 15,608,475
416 1,228 417,311 7,585 22,394 8,934,764 7,123 13,801 20,924 994,280
23 50 10,277 2,662 5,503 647,961 307,647
81 120 204,913 40 119 40,396
336 992 395,820 2,204 4,270 6,474 307,647
1 2 357 274 594 90,720 28,523
6 9 15,344 2 7 2,505
61 181 72,207 204 396 600 28,523
0 0 64 195 415 49,585 21,610
2 3 5,317 4 11 3,667
34 101 40,127 155 300 455 21,610
0 0 20 218 471 63,716 23,186
2 3 5,585 3 8 2,686
47 137 54,848 166 322 488 23,186
0 1 110 36 75 6,604 4,231
0 0 452 1 3 921 4 13 5,142
30 59 89 4,231 - - - 284 583 134,780 28,573
32 47 80,706 11 32 10,826 36 107 42,555
205 397 601 28,573 0 0 91
CO2e (Metric Tons)1
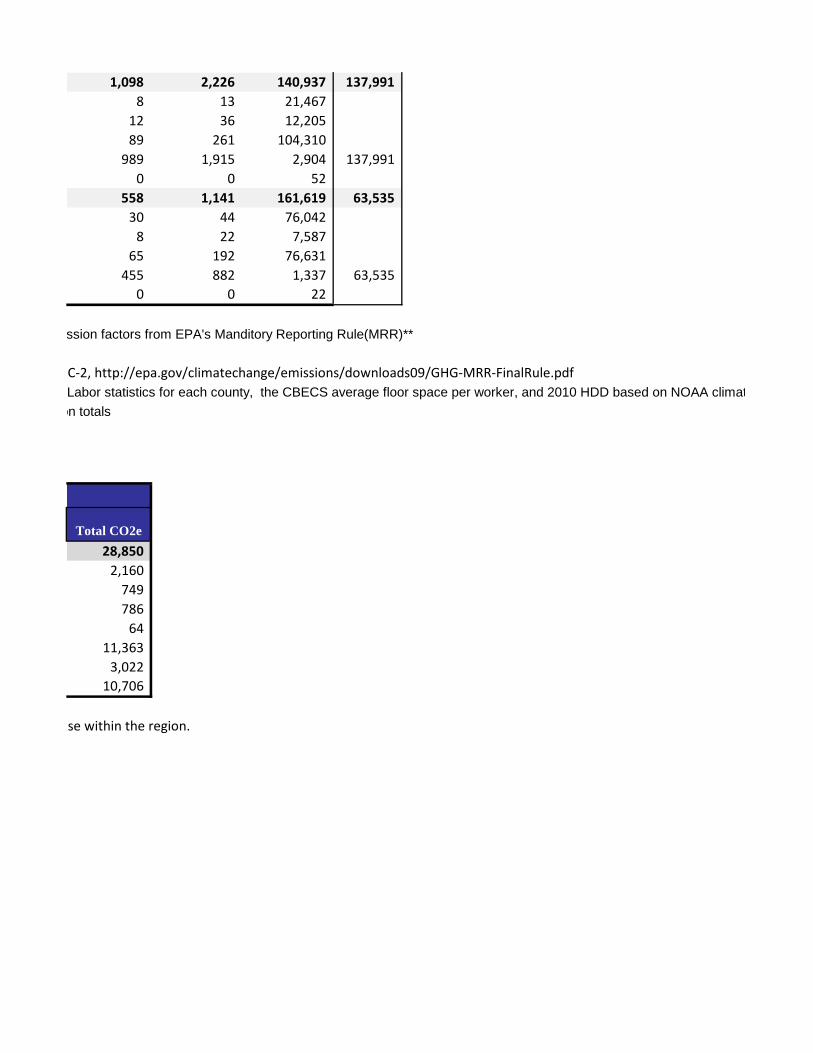
1,098 2,226 140,937 137,991 8 13 21,467
12 36 12,205 89 261 104,310
989 1,915 2,904 137,991 0 0 52
558 1,141 161,619 63,535 30 44 76,042
8 22 7,587 65 192 76,631
455 882 1,337 63,535 0 0 22
ssion factors from EPA's Manditory Reporting Rule(MRR)**
C-2, http://epa.gov/climatechange/emissions/downloads09/GHG-MRR-FinalRule.pdf Labor statistics for each county, the CBECS average floor space per worker, and 2010 HDD based on NOAA climat on totals
Total CO2e28,850
2,160 749 786
64 11,363
3,022 10,706
se within the region.


te divisionsconsumption and generation

mmBTU2 CO2 CH4
New York State 142,674,216 8,707,842 14,208 Natural Gas 100,184,192 5,311,766 2,104 LPG 381,677 24,038 24 Distillate Fuel Oil (#1, #2, Kerosene) 2,866,662 211,235 181
Heating Oil #1 1,103,236 80,812 70 Heating Oil #2 1,763,426 130,423 111
Residual Fuel Oil (#4 and #6) 14,565,792 1,093,813 918 Heating Oil #4 1,300,971 97,625 82 Heating Oil #6 13,264,821 996,188 836
Coal 12,699,950 1,193,241 2,934 Bituminous Coal 11,911,597 1,112,543 2,752 Anthracite Coal 169,701 17,571 39 Coke 618,652 63,127 143
Wood4 2,342,544 - 1,574 MSW5 9,633,400 873,749 6,474 Solid Other Liquid OtherNorth Country 8,020,260 450,931 952
Natural Gas 3,518,810 186,567 74 LPG 26,909 1,695 2 Distillate Fuel Oil (#1, #2, Kerosene) 17,318 1,281 1
Heating Oil #1 493 36 0 Heating Oil #2 16,826 1,244 1
Residual Fuel Oil (#4 and #6) 3,480,538 261,388 219 Heating Oil #4 - - - Heating Oil #6 3,480,538 261,388 219
Coal - - - Bituminous Coal - - - Anthracite Coal - - - Coke - - -
Wood 976,685 - 656 MSW - - - Solid Other Liquid Other
Clinton 637,537 33,974 14 Natural Gas 629,340 33,368 13 LPG - - - Distillate Fuel Oil (#1, #2, Kerosene) 8,197 606 1
Heating Oil #1 - - - Heating Oil #2 8,197 606 1
Residual Fuel Oil (#4 and #6) - - - Heating Oil #4 - - -
Industrial Energy Use EmissionsCO2

Heating Oil #6 - - - Coal - - -
Bituminous Coal - - - Anthracite Coal - - - Coke - - -
Wood - - - MSW - - - Solid Other Liquid Other
Essex 4,119,819 235,999 854 Natural Gas - - - LPG 3,492 220 0 Distillate Fuel Oil (#1, #2, Kerosene) 6,538 483 0
Heating Oil #1 322 24 0 Heating Oil #2 6,216 460 0
Residual Fuel Oil (#4 and #6) 3,133,104 235,296 197 Heating Oil #4 - - - Heating Oil #6 3,133,104 235,296 197
Coal - - - Bituminous Coal - - - Anthracite Coal - - - Coke - - -
Wood 976,685 - 656 MSW - - - Solid Other Liquid Other
Franklin - - - Natural Gas - - - LPG - - - Distillate Fuel Oil (#1, #2, Kerosene) - - -
Heating Oil #1 - - - Heating Oil #2 - - -
Residual Fuel Oil (#4 and #6) - - - Heating Oil #4 - - - Heating Oil #6 - - -
Coal - - - Bituminous Coal - - - Anthracite Coal - - - Coke - - -
Wood - - - MSW - - - Solid Other Liquid Other
Hamilton - - - Natural Gas - - - LPG - - - Distillate Fuel Oil (#1, #2, Kerosene) - - -

Heating Oil #1 - - - Heating Oil #2 - - -
Residual Fuel Oil (#4 and #6) - - - Heating Oil #4 - - - Heating Oil #6 - - -
Coal - - - Bituminous Coal - - - Anthracite Coal - - - Coke - - -
Wood - - - MSW - - - Solid Other Liquid Other
Jefferson 188,700 10,005 4 Natural Gas 188,700 10,005 4 LPG - - - Distillate Fuel Oil (#1, #2, Kerosene) - - -
Heating Oil #1 - - - Heating Oil #2 - - -
Residual Fuel Oil (#4 and #6) - - - Heating Oil #4 - - - Heating Oil #6 - - -
Coal - - - Bituminous Coal - - - Anthracite Coal - - - Coke - - -
Wood - - - MSW - - - Solid Other Liquid Other
Lewis 920,809 49,096 20 Natural Gas 896,059 47,509 19 LPG 22,224 1,400 1 Distillate Fuel Oil (#1, #2, Kerosene) 2,327 172 0
Heating Oil #1 171 12 0 Heating Oil #2 2,156 159 0
Residual Fuel Oil (#4 and #6) 200 15 0 Heating Oil #4 - - - Heating Oil #6 200 15 0
Coal - - - Bituminous Coal - - - Anthracite Coal - - - Coke - - -
Wood - - - MSW - - - Solid Other Liquid Other

St. Lawrence 2,153,396 121,857 60 Natural Gas 1,804,711 95,686 38 LPG 1,193 75 0 Distillate Fuel Oil (#1, #2, Kerosene) 257 19 0
Heating Oil #1 - - - Heating Oil #2 257 19 0
Residual Fuel Oil (#4 and #6) 347,235 26,077 22 Heating Oil #4 - - - Heating Oil #6 347,235 26,077 22
Coal - - - Bituminous Coal - - - Anthracite Coal - - - Coke - - -
Wood - - - MSW - - - Solid Other Liquid Other
Notes1. CO2e calculated based on regional Title V Air Quality Permitting energy data provided to the CGC G *Federal Register / Vol. 74, No. 209 / Friday, October 30, 2009 / Rules and Regulations, Table C-1 and 2. New York State, regional and county actual energy totals reported for all Title V sources within the a 3. CO2 from Wood products are considered a source of biogenic emissions, not to be included in GHG 4. Renewable sources highlighted in green5. MSW(Municipal Solid Waste) emissions are included in waste calculations
GHG Emissions from Natural Gas Use Transmission and Distribution Losses1
% T&D LossTotal Natural Gas
(mcf)CH4 Losses
in mcfNorth Country 1.8% 3,422,966.93 61,613
Clinton 1.8% 612,198.44 11,020 Essex 1.8% - - Franklin 1.8% - - Hamilton 1.8% - - Jefferson 1.8% 183,560.31 3,304 Lewis 1.8% 871,652.72 15,690 St. Lawrence 1.8% 1,755,555.45 31,600
Notes1. CO2e from T&D losses calculated based on ratio of estimated % fuel loss and total natural gas use
Supporting data and calculations are provided in the following E&E Excel Workbook:File Name:NC Industrial Energy Sources 1-21-13.xlsxDate:1/21/2013

N2O Total Biogenic Total3
28,311 8,750,361 219,731 3,106 5,316,975
71 24,133 533 211,949 205 81,087 328 130,862
2,709 1,097,440 242 97,949
2,467 999,491 6,299 1,202,474 5,908 1,121,203
84 17,694 307 63,577
3,050 4,624 219,731 12,543 892,766
2,036 453,920 91,613 109 186,750
5 1,701 3 1,285 0 36 3 1,249
647 262,255 - - 647 262,255 - - - - - - - -
1,272 1,928 91,613 - -
21 34,009 020 33,400
- - 2 608
- - 2 608
- - - -
2e (Metric Tons)1

- - - - - - - - - - - - - - -
1,856 238,710 91,613 - -
1 221 1 485 0 24 1 461
583 236,076 - - 583 236,076 - - - - - - - -
1,272 1,928 91,613 - -
- - - - - - - - - - - - - - - - - - - - - - - - - - - - - - - -
- - - - - - - - -

- - - - - - - - - - - - - - - - - - - - - - -
6 10,015 - 6 10,015
- - - - - - - - - - - - - - - - - - - - - - - - - - -
32 49,148 - 28 47,556
4 1,405 0 173 0 13 0 160 0 15
- - 0 15
- - - - - - - - - - - - -

121 122,038 - 56 95,780
0 75 0 19
- - 0 19
65 26,164 - - 65 26,164
- - - - - - - - - - - - -
GHG Protocol Working Group from the NYSDEC (August 2012), using fuel type emission factors from EPA's M d Table C-2, http://epa.gov/climatechange/emissions/downloads09/GHG-MRR-FinalRule.pdf
area. Electricity generation and landfill emissions were excluded as they are calculated and counted separately G emission totals
CH4 Losses in lbs Total CO2e
2,760,281 26,293 493,677 4,702
- - - - - -
148,023 1,410 702,901 6,695
1,415,680 13,485
e within the region.


Manditory Reporting Rule(MRR)*
in waste and electric consumption and generation

Industrial GHG Emissions2010 Emissions reported as part of EPA MRR Program
Source Process CO2New York State North Country
Clinton NoneEssex Ticonderoga Mill Pulp and Paper Manufacturing XFranklin NoneHamilton NoneJefferson NoneLewis None
St. Lawrence ALCOA INC MASSENA OPERATIONS Aluminum Production 211,169
St. Lawrence NEWTON FALLS PAPER COMPANY, LLC Pulp and Paper Manufacturing
Notes:1. Emissions from general combustion are not included in sources totals, and have been subtracted from report
Ozone Depleting Substance Substitution EmissionsHFC Emissions
Region Population Total CO2e (Metric Tons)New York State 19,378,102 4,436,697 North Country 433,193 99,181
Clinton 82,128 18,804 Essex 39,370 9,014 Franklin 51,599 11,814 Hamilton 4,836 1,107 Jefferson 116,229 26,611 Lewis 27,087 6,202 St. Lawrence 111,944 25,630
Notes:
Supporting data and calculations are provided in the following E&E Excel Workbook:File Name:NC Industrial Sources_9_28_12.xlsxDate:9/28/2012
1. Emissions from HFC use estimated based on 2010 population ratio and 2007 Reported Statewide HFC emissio Forecasts for the 2009 State Energy Plan, NYSERDA, August 6, 2009)
Region

CH4 N2O CF4 C2F6 CHF3 Total CO2e
267,370
X X 33,205
19,500 3,496 234,165
0
ted totals where appropriate.
ons (New York State Greenhouse Gas Emissions Inventory and
CO2e (Metric Tons)Emissions by Type1

Table 1Greenhouse Gas Emission Inventory Summary
Transportation: On-Road VehiclesNorth Country New York Region
Annual GHG Emissions2 (metric tons CO2e/yr)County CO2 N2O CH4 TotalClinton 865,169,884 433,423 1,086 372 434,881Essex 566,995,335 279,083 699 239 280,021
Franklin 447,518,335 211,421 530 181 212,132Hamilton 97,234,344 45,861 111 39 46,011Jefferson 1,146,056,382 576,745 1,445 495 578,685
Lewis 260,474,281 123,648 310 106 124,064St. Lawrence 851,219,149 401,611 1,006 345 402,962
North County NY Total 4,234,667,708 2,071,792 5,187 1,777 2,078,756Notes:
Emission Type Fuel Type
North Country NY Annual GHG Emissions
(metric tons CO2e/yr)Non-Biogenic Gasoline1 1,545,164
Diesel 421,448Total 1,966,612
Biogenic Ethanol1 112,144TOTAL 2,078,756
Notes:1. Portion of Gasoline E-10.
Annual Fuel Consumption (MMBtu/yr)County Gasoline (E-10) Diesel TotalClinton 4,816,540 1,295,316 6,111,856Essex 3,177,685 761,748 3,939,432
Franklin 2,482,864 505,430 2,988,294
Hamilton 538,259 109,932 648,191Jefferson 6,381,302 1,750,127 8,131,429
Lewis 1,447,513 299,927 1,747,440St. Lawrence 4,719,912 956,767 5,676,679
North Country 23,564,075 5,679,245 29,243,320
Notes:
CO2 N2O CH4 Total
North Country 2,071,792 5,187 1,777 2,078,756 Gasoline 1,539,705 4,078 1,381 1,545,164
Ethanol 112,050 56 38 112,144 Diesel 420,037 1,053 358 421,448
Clinton 433,423 1,086 372 434,881 Gasoline 314,718 834 282 315,834
Ethanol 22,903 11 8 22,922 Diesel 95,802 241 82 96,124
Essex 279,083 699 239 280,021 Gasoline 207,634 550 186 208,370
Ethanol 15,110 8 5 15,123 Diesel 56,339 142 48 56,529
Franklin 211,421 530 181 212,132 Gasoline 162,233 430 146 162,809
Ethanol 11,806 6 4 11,816 Diesel 37,382 94 32 37,507
Hamilton 45,861 111 39 46,011 Gasoline 35,170 93 32 35,295
Ethanol 2,559 1 1 2,562 Diesel 8,131 17 7 8,154
Jefferson 576,745 1,445 495 578,685 Gasoline 416,962 1,104 374 418,440
Ethanol 30,344 15 10 30,369 Diesel 129,439 326 110 129,875
Lewis 123,648 310 106 124,064 Gasoline 94,582 251 85 94,918
Ethanol 6,883 3 2 6,889 Diesel 22,183 56 19 22,257
St Lawrence 401,611 1,006 345 402,962 Gasoline 308,405 817 277 309,498
Ethanol 22,444 11 8 22,463 Diesel 70,762 178 60 71,001
1. Portion of Gasoline E-10.
Supporting data and calculations are provided in the following E&E Excel Workbook:File Name:NC Transportation - Onroad - 2013_1_21.xlsxDate:1/21/2013
fleet fuel economy data.
Fuel TypeNorth Country NY GHG Emissions (metric tons CO2e/yr)
2. NYSDOT regional-specific data on fleet profile and national fleet fuel economy data to estimate GHG emissions. The
Annual Vehicle Miles Travelled1
(VMT)
1. VMT data for each county provided by NYSDOT. 2. NYSDOT regional-specific data on fleet profile and national fleet fuel economy data to estimate county-level GHG emissions.
2. NYSDOT regional-specific data on fleet profile and national fleet fuel economy data to estimate GHG emissions. The distribution of GHG emissions for the components of gasoline E-10 (i.e., gasoline and ethanol) is based on a fraction of 90% gasoline and 10% ethanol.

GHG Emission SummaryTransportation: Railroads
North Country New York Region
Direct GHG Emissions from Diesel Train Engine Systems2
(metric tons CO2e/yr)County CO2 N2O CH4 TotalClinton 661,618 91,303 6,753 17 6 6,776Essex 808,641 111,592 8,253 21 7 8,281
Franklin 326,462 45,052 3,332 8 3 3,343Hamilton 2,825 390 29 0.07 0.02 29Jefferson 2,154,946 297,383 21,994 55 19 22,068
Lewis 64,745 8,935 661 2 0.6 663St. Lawrence 2,977,165 410,849 30,386 76 26 30,489
North Country NY Total 6,996,402 965,503 71,409 180 61 71,649Notes:
Indirect GHG Emissions from Electric Train Systems2
(metric tons CO2e/yr)County CO2 N2O CH4 Total
North Country NY Total 0 - - - -
GHG Emissions from All Train Systems (metric tons CO2e/yr)
County CO2 N2O CH4 TotalClinton 91,303 6,753 17 98,073Essex 111,592 8,253 21 119,867
Franklin 45,052 3,332 8 48,392Hamilton 390 28.84 0.07 419Jefferson 297,383 21,994 55 319,432
Lewis 8,935 661 1.7 9,597St. Lawrence 410,849 30,386 76 441,312
North Country NY Total 965,503 71,409 180 1,037,092
Power/Fuel Type
North Country NY Annual Energy Consumption (MMBtu/yr)
Diesel 965,503Electric 0Total 965,503
Notes:
2. Energy consumption for electrical systems calculated by unit conversion.
Supporting data and calculations are provided in the following E&E Excel Workbook:File Name:NC Transportation - Rail - 2013_1_21.xlsxDate:1/21/2013
Annual Diesel Consumption1
(gal/yr)
1. Diesel consumption based on NYSERDA Study of diesel consumption by rail systems in New York State in 2002. Fuel consumption data allocated spatially to counties by location of rail lines.2. GHG emissions calculated by applying EPA emission factors to diesel consumption.
Annual Electrical
Consumption1
(kW-hr/yr)
1. Energy consumption for diesel systems calculated from diesel consumption based on NYSERDA Study of rail systems in New York State in 2002.
Annual diesel Consuption (MMBtu/yr)

Table 1GHG Emission Summary
Transportation: Commercial Marine VesselsNorth Country New York Region
GHG E CO2
Diesel Clinton 0 0 0Essex 0 0 0
Franklin 163,241 22,527 1,666Hamilton 0 0 0Jefferson2 1,530,456 211,203 15,621
Lewis 0 0 0St. Lawrence2 1,113,059 153,602 11,360
North Country NY Total 2,806,756 387,332 28,647Residual Fuel Oil Clinton 0 0 0
Essex 0 0 0Franklin 0 0 0
Hamilton 0 0 0Jefferson3 1,386,646 207,997 15,621
Lewis 0 0 0St. Lawrence3 1,008,470 151,270 11,360
North Country NY Total 2,395,116 359,267 26,981All Fuel Types Clinton - 0 -
Essex - 0 -Franklin 163,241 22,527 1,666
Hamilton - 0 -Jefferson 2,917,102 419,200 31,241
Lewis - 0 -St. Lawrence 2,121,528 304,873 22,721
North Country NY Total 5,201,871 746,600 55,628Notes:
Fuel TypeAnnual Energy Consumption1
(MMBtu/yr)Diesel 387,332
Residual Fuel Oil 359,267Total 746,600
Notes:1. Annual energy consumption is based on projected fuel consumption.
Fuel Type County
Annual Fuel Consumption1
(gal/yr)
1. Fuel consumption estimated by dividing annual CO2 emissions by corresponding fuel heat value and emission-factor-en
2. CO2 emissions calculated by multiplying EPA estimated annual SO2 emission rate by ratio of CO2 to SO2 emissions for ap 3. N2O and CH4 emissions estimated using using EPA emission factors and fuel consumption estimates.
Annual Fuel Consumption1
(MMBtu/yr)

Supporting data and calculations are provided in the following E&E Excel Workbook:File Name:NC Transportation - Com Marine - 2013_1_21.xlsxDate:1/21/2013

Emissions2,3 (metric tons CO2e/yr)N2O CH4 Total
0 0 00 0 04 1 1,6720 0 0
39 13 15,6730 0 0
29 10 11,39972 24 28,7440 0 00 0 00 0 00 0 0
39 13 15,6720 0 0
28 10 11,39867 23 27,070- - -- - -4 1 1,672- - -
78 26 31,346- - -
57 19 22,797139 47 55,814
nergy.
pplicable fuel.

Table 1Greenhouse Gas Emission Inventory Summary
Transportation: AircraftNorth Country New York Region
Annual Jet Fuel Consumption1
Annual Energy Consumption2 GHG Emissions3,4 (metric tons CO2e/y
County (gal/yr) (MMBtu/yr) CO2 N2O CH4
Clinton 266,172 35,933 2,557 6.7 2.3Essex 45,019 6,078 599 1 0.4
Franklin 37,133 5,013 355 0.9 0.3Hamilton 7,887 1,065 75 0.2 0.07Jefferson 737,396 99,548 7,082 19 6
Lewis 15,116 2,041 144 0.4 0.1St. Lawrence 56,849 7,675 545 1 0.5
North Country NY Total 1,165,572 157,352 11,357 29 10Notes:
Supporting data and calculations are provided in the following E&E Excel Workbook:File Name:MV Transportation - Aircraft - 2013_1_21.xlsxDate:1/21/2013
1. Jet fuel consumption estimated using the FAA's EDMS model with data input of total landing and take off cycles of specific aircraft types at each airport in each county.
2. Annual energy consumption is based on projected fuel consumption as estimated using FAA's EDMS model.3. CO2 emissions estimated using the FAA's EDMS model with data input of total landing and take off cycles of specific aircraft types at each airport in each county.4. N2O and CH4 emissions estimated using using EPA emission factors and jet fuel consumption estimates.

yr)Total2,56660135675
7,107145547
11,396

GHG Emissions SummaryTransportation: Non-Road Equipment
North Country New York Region
GHG Emissions1,2 (metric tons CO2e/yr)County CO2 N2O CH4 TotalClinton 974,219 69,236 180 61 69,477Essex 1,057,070 75,142 196 67 75,405
Franklin 722,521 51,545 134 45 51,725Hamilton 1,411,596 99,450 263 89 99,802Jefferson 1,792,552 128,332 333 113 128,777
Lewis 570,662 40,825 106 36 40,967St. Lawrence 1,401,551 100,118 260 88 100,466
North Country NY Total 7,930,171 564,649 1,472 499 566,620
(scf/yr) (gal/yr) CO2 N2O CH4 TotalCNG 19,857,515 - 1,082 1 0 1,083
Diesel - 19,067,490 194,612 489 166 195,267Gasoline - 40,351,785 354,188 938 318 355,444
LPG - 2,548,596 14,767 44 15 14,825TOTAL - - 564,649 1,472 499 566,620
Fuel Type
North Country NY Annual Energy Consumption1
(MMBtu/yr)CNG 20,414
Diesel 2,631,314Gasoline 5,043,973
LPG 234,471Total 7,930,171
Notes:
Supporting data and calculations are provided in the following E&E Excel Workbook:File Name:NC Transportation - Nonroad - 2013_1_21.xlsxDate:1/21/2013
Energy Consumption (MMBtu/yr)
1. Fuel consumption estimated with reserve application of CO2 emission factors (for fuel) to CO2 emissions.
2. CO2 emissions based on NYSDEC runs of the NONROAD emission model for the state emission inventory for Year 2007. 3. N2O and CH4 emissions based the use of EPA emission factors for N2O and CH4 based on fuel combustion.
1. Annual energy consumption is based on projected fuel consumption calculated from NYSDEC CO2 emission estimates.
Notes:1. CO2 emissions based on NYSDEC runs of the NONROAD emission model for the state emission inventory for Year 2007. 2. N2O and CH4 emissions based the use of EPA emission factors for N2O and CH4 based on fuel combustion. Fuel consumption estimated with reserve application of CO2 emission factors (for fuel) to CO2 emissions.
Fuel TypeAnnual Fuel Consumption1
Notes:
GHG Emissions2,3 (metric tons CO2e/yr)
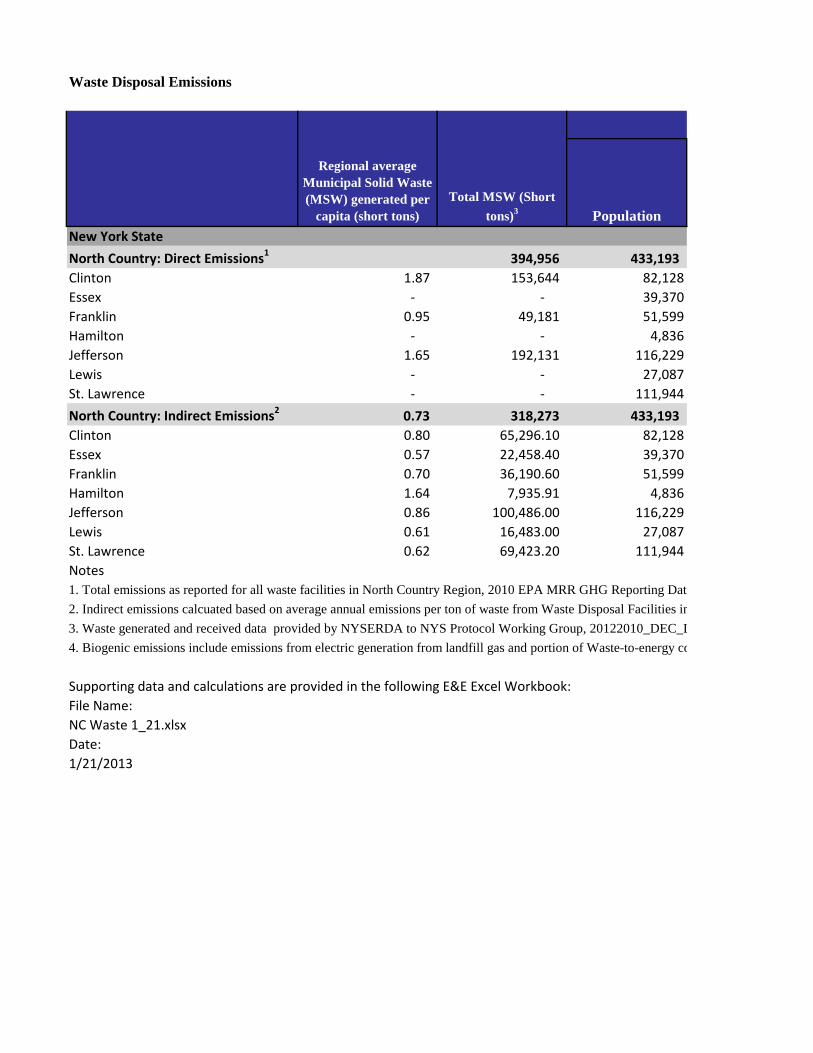
Waste Disposal Emissions
Regional average Municipal Solid Waste (MSW) generated per
capita (short tons)Total MSW (Short
tons)3 PopulationNew York State North Country: Direct Emissions1 394,956 433,193 Clinton 1.87 153,644 82,128Essex - - 39,370Franklin 0.95 49,181 51,599Hamilton - - 4,836Jefferson 1.65 192,131 116,229Lewis - - 27,087St. Lawrence - - 111,944North Country: Indirect Emissions2 0.73 318,273 433,193 Clinton 0.80 65,296.10 82,128Essex 0.57 22,458.40 39,370Franklin 0.70 36,190.60 51,599Hamilton 1.64 7,935.91 4,836Jefferson 0.86 100,486.00 116,229Lewis 0.61 16,483.00 27,087St. Lawrence 0.62 69,423.20 111,944Notes1. Total emissions as reported for all waste facilities in North Country Region, 2010 EPA MRR GHG Reporting Data2. Indirect emissions calcuated based on average annual emissions per ton of waste from Waste Disposal Facilities in 3. Waste generated and received data provided by NYSERDA to NYS Protocol Working Group, 20122010_DEC_L 4. Biogenic emissions include emissions from electric generation from landfill gas and portion of Waste-to-energy co
Supporting data and calculations are provided in the following E&E Excel Workbook:File Name:NC Waste 1_21.xlsxDate:1/21/2013

Nonbiogenic CO2 CH4 N2OTotal non biogenic CO2 biogenic4
166 120,582 0 120,749 0166 120,582 0 120,749 0
40 32,027 0 32,066 00 0 0 0 0
47 43,349 0 43,396 00 0 0 0 0
80 45,206 0 45,286 00 0 0 0 0
134 97,170 0 97,305 - 28 19,935 0 19,963 0
9 6,857 0 6,866 015 11,049 0 11,064 0
3 2,423 0 2,426 042 30,679 0 30,721 0
7 5,032 0 5,039 029 21,195 0 21,225 0
a n the Region, allocated based on reported waste generated by each county Landfill_and_WTE_data.xlsx, summary of DEC reported data ombustion (as reported in EPA MRR GHG Reporting Data)
CO2e (Metric Tons), 20101,2

Wastewater Treatment Facility Emissions
Wastewater volume flow
(MGD)1Number of
Plants1 Population2
New York State2 3,693.65 610 19,378,102 North Country2 87.77 83 433,193 Clinton4 21.321 11 82,128 Essex4 9.230 12 39,370 Franklin4 7.516 6 51,599 Hamilton4 0.220 2 4,836 Jefferson4 24.968 21 116,229 Lewis4 1.552 8 27,087 St. Lawrence4 22.963 23 111,944 Notes1Descriptive Data of Municipal Wastewater Treatment Plants in New York State, NYSDEC, January 20042State and NC Totals calculated using the EPA State Inventory Tool, Wastewater module, for Municiple wate 3State and NC totals reported as calculated by using the EPA State Inventory Tool--may not be exact sum of 4County totals calculated based on ratio of 2004 NC wastewater volumes and EPA State Inventory Tool resul
Supporting data and calculations are provided in the following E&E Excel Workbook:File Name:NC Waste_water9_21.xlsxDate:9/28/2012

CO2 CH4 N2O Total CO2e3
- 1,310,000 580,000 1,900,000 - 30,000 10,000 40,000
7,288 2,429 9,717 3,155 1,052 4,206 2,569 856 3,425
75 25 100 8,534 2,845 11,379
530 177 707 7,849 2,616 10,465
erwater only, using NYS defaults, 2010 population from 2010 US Census. other rows due to rounding.
lts for NC. Significant figures of SIT (million MT, to 100ths) do not provide totals for the smaller population n
CO2e (Metric Tons)2

umbers.

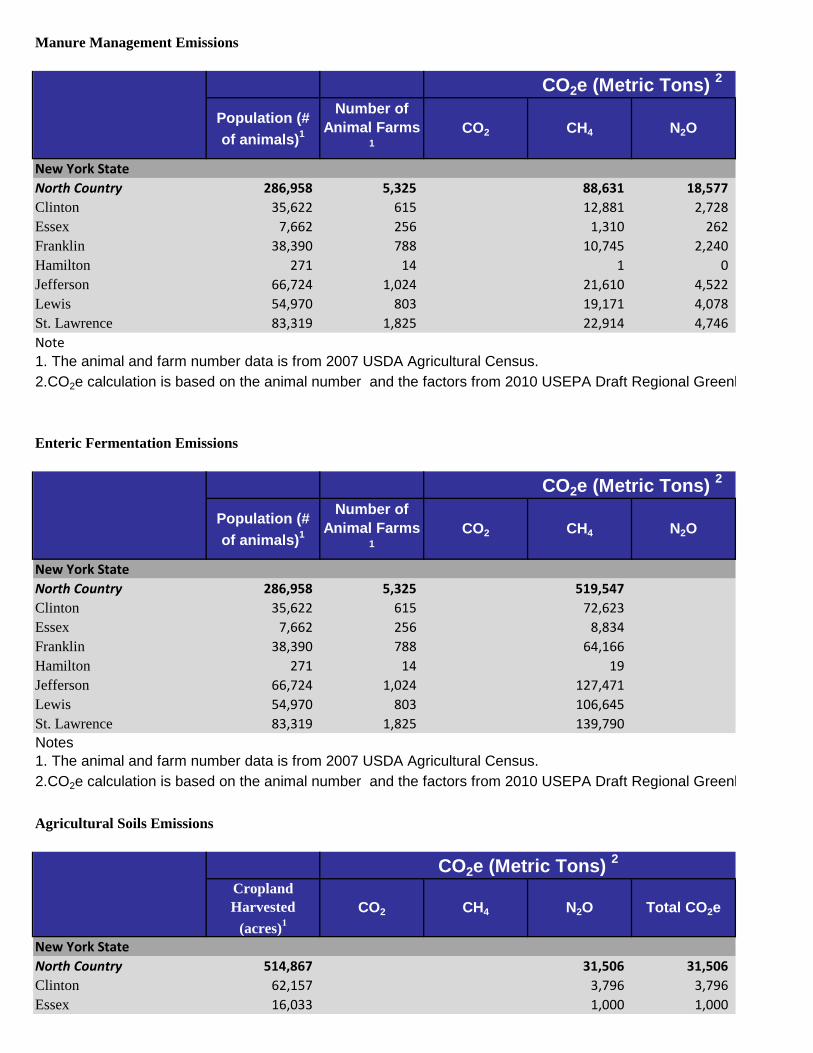
Manure Management Emissions
Population (# of animals)1
Number of Animal Farms
1CO2 CH4 N2O
New York State North Country 286,958 5,325 88,631 18,577 Clinton 35,622 615 12,881 2,728 Essex 7,662 256 1,310 262 Franklin 38,390 788 10,745 2,240 Hamilton 271 14 1 0 Jefferson 66,724 1,024 21,610 4,522 Lewis 54,970 803 19,171 4,078 St. Lawrence 83,319 1,825 22,914 4,746 Note1. The animal and farm number data is from 2007 USDA Agricultural Census.2.CO2e calculation is based on the animal number and the factors from 2010 USEPA Draft Regional Greenh
Enteric Fermentation Emissions
Population (# of animals)1
Number of Animal Farms
1CO2 CH4 N2O
New York State North Country 286,958 5,325 519,547 Clinton 35,622 615 72,623 Essex 7,662 256 8,834 Franklin 38,390 788 64,166 Hamilton 271 14 19 Jefferson 66,724 1,024 127,471 Lewis 54,970 803 106,645 St. Lawrence 83,319 1,825 139,790 Notes1. The animal and farm number data is from 2007 USDA Agricultural Census.2.CO2e calculation is based on the animal number and the factors from 2010 USEPA Draft Regional Greenh
Agricultural Soils Emissions
Cropland Harvested
(acres)1CO2 CH4 N2O Total CO2e
New York State North Country 514,867 31,506 31,506 Clinton 62,157 3,796 3,796 Essex 16,033 1,000 1,000
CO2e (Metric Tons) 2
CO2e (Metric Tons) 2
CO2e (Metric Tons) 2

Franklin 59,079 3,608 3,608 Hamilton 57 7 7 Jefferson 147,726 9,022 9,022 Lewis 82,977 5,068 5,068 St. Lawrence 146,838 9,006 9,006 Notes1. The cropland harvested data for synthetic fertilizer calculation is from 2007 US Agricultural Census. Assum 2.CO2e calculation is from organic fertilizer N2O emission with data sources from NYSDEC7/23/2012 and sy
Supporting data and calculations are provided in the following E&E Excel Workbook:File Name:NC_Agriculture_092012.xlsxDate:9/28/12

Total CO2e
107,207 15,609
1,572 12,985
1 26,132 23,249 27,660
house Gas Inventory Guidance and 2006 IPCC Guidelines for National Greenouse Gas Inventories .
Total CO2e
519,547 72,623
8,834 64,166
19 127,471 106,645 139,790
house Gas Inventory Guidance.

med most of fertilizer are used on harvested cropland. ynthetic fertilizer N2O emission with data sources from 2007 US Agricultural Census and EPA Commerical Fertiliz


zer Purchased (http://water.epa.gov/scitech/swguidance/standards/criteria/nutrients/dataset_commercial.cfm).

Carbon Sequestration in Forests
Forest Land (Acres)1 Forest Land (km2)
Total Carbon Sequestration (metric
tons C)2
Total Carbon Sequestration (metric
tons CO2)New York State North Country 5,895,097 23,857 299,243,250 1,098,222,727 Clinton County 492,561 1,993 23,903,202 87,724,751 Essex County 1,034,865 4,188 53,452,812 196,171,820 Franklin County 882,442 3,571 43,012,451 157,855,694 Hamilton County 1,094,916 4,431 57,968,128 212,743,029 Jefferson County 427,360 1,729 19,910,750 73,072,453 Lewis County 625,369 2,531 33,181,610 121,776,510 St. Lawrence County 1,337,585 5,413 67,814,297 248,878,471
Notes1.The forest land data is from Forest Inventory Data Online (FIDO) FIA Standard Reports, New York Current Area, 2010.2.The total carbon sequestration is calculated based on the carbon stock factor from COLE 1605 (b) Report for New York, July 24, 2012 and the fo
Carbon Sequestration in Urban Forests
Urban Land Area (km2) 1
Tree Canopy Cover (%)2
Total Carbon Sequestration (metric
tons C)3
Total Carbon Sequestration (metric
tons CO2)New York State North Country 51,547 189,177 Clinton County 54 38% 12,041 44,191 Essex County 19 57% 4,236 15,548 Franklin County 31 47% 6,807 24,981 Hamilton County n/a n/a n/a n/aJefferson County 76 29% 16,891 61,989 Lewis County 3 13% 779 2,858 St. Lawrence County 48 27% 10,793 39,610
Notes

1. The urban land area data is from 2000 US Census. 2. The tree canopy cover percentage data is from provided by Eric J. Greenfield, US Department of Agriculture Forest Service, Syracuse, NY on Aug 3. The total carbon sequestration is calculated based on the urban land area, tree canopy coverage and the national average net sequestration ra
Supporting data and calculations are provided in the following E&E Excel Workbook:File Name:NC_Forest_092012.xlsxDate:9/28/12

orest land.

gust 1, 2012. ate.

REDC / County Name North Country
Color CodeREQUIRED, though some data may be zero or considered to small to countOPTIONALDO NOT Report Data in these cells
Scope 1 Scope 2 Scope 3 Biogenic Metric Unit ValueBuilt Environment Residential Energy Consumption
NC Electricity Consumption Electricity / Steam - 325,724 0 - Yes Consumption MMBTU 4,896,765 NC Direct Residental Fuel Consumption Natural Gas 290,410 - 0 - Yes Consumption MMBTU 5,471,996 NC Direct Residental Fuel Consumption Propane / LPG 103,286 - 0 - Yes Consumption MMBTU 1,428,293 NC Direct Residental Fuel Consumption Distillate Fuel Oil (#1, #2, Kerosene) 432,290 - 0 - Yes Consumption MMBTU 5,825,306 NC Direct Residental Fuel Consumption Wood 16,477 - 0 323,887 Yes Consumption MMBTU 8,347,161
Commercial Energy Consumption - - 0 - -
NC Electricity Consumption Electricity / Steam - 178,964 0 - Yes Consumption MMBTU 2,690,450 NC Commercial Direct Fuel Consumption Natural Gas 204,913 - 0 - Yes Consumption MMBTU 3,861,032
NC Commercial Direct Fuel Consumption Propane / LPG 40,396 - 0 - Yes Consumption MMBTU 638,891
NC Commercial Direct Fuel Consumption Distillate Fuel Oil (#1, #2, Kerosene) 395,820 - 0 - Yes Consumption MMBTU 5,333,853
NC Commercial Direct Fuel Consumption Residual Fuel Oil (#4 and #6) - - 0 - Yes Consumption MMBTU -
NC Commercial Direct Fuel Consumption Coal 357 - 0 - Yes Consumption MMBTU 3,478
NC Commercial Direct Fuel Consumption Wood 6,474 - 0 307,647 Yes Consumption MMBTU 3,279,824 Industrial Energy Consumption - - 0 - -
NC Electricity Consumption Electricity / Steam - 269,206 0 - Yes Consumption MMBTU 4,047,096
NC Industrial Title V Consumption Natural Gas 186,750 - 0 - Yes Consumption MMBTU 3,518,810
NC Industrial Title V Consumption Propane / LPG 1,701 - 0 - Yes Consumption MMBTU 26,909
NC Industrial Title V Consumption Distillate Fuel Oil (#1, #2, Kerosene) 1,285 - 0 - Yes Consumption MMBTU 17,318
NC Industrial Title V Consumption Residual Fuel Oil (#4 and #6) 262,255 - 0 - Yes Consumption MMBTU 3,480,538
NC Industrial Title V Consumption Coal - - 0 - Yes Consumption MMBTU -
NC Industrial Title V Consumption Wood 1,928 - 0 91,613 Yes Consumption MMBTU 976,685 Energy Generation and Supply Energy Generation and Supply - - 0 - -
NC Elec Generation GHG Analysis Coal and Coke 106,709 - 0 - No Consumption MMBTU 1,111,229
NC Elec Generation GHG Analysis Natural Gas 214,993 - 0 - No Consumption MMBTU 4,050,971 NC Elec Generation GHG Analysis Distillate Fuel Oil (#1, #2 and #4) 954 - 0 - No Consumption MMBTU 12,861
NC Elec Generation GHG Analysis Residual Fuel Oil (#4 and #6) 81,846 - 0 - No Consumption MMBTU 1,086,225
NC Elec Generation GHG Analysis Wood / Biomass 7,106 - 0 337,659 No Consumption MMBTU 3,599,772
NC Elec Generation GHG Analysis MSW and landfill emissions 223 - 0 44,300 No MSW Combusted MMBTU 850,779
DRAFT Reporting Template CGC. Emissions in MTCDERolled Up?
Related GHG Metrics / Activity Data
REDC Emissions By Source and SectorYear: 2010

NC Elec Generation GHG Analysis Other 2,978 - 0 - 33,859
NC Elec Generation GHG Analysis Electricity T/D Losses - 45,041 0 - Yes Losses MMBTU 677,117
NC Elec Generation GHG Analysis and NC Direct Fuel Consumption Natural Gas T/D Losses 126,913 - 0 - Yes Losses MMBTU -
NC Electricity Consumption Use of SF6 in the Utility Industry 10,359 - 0 - Yes Consumption MMBTU - Industrial Processes Industrial Processes - - 0 - - Not Reported Cement Production - - 0 - Yes - NC Industrial Sources Iron and Steel Production - - 0 - Yes - NC Industrial Sources Ferroalloy Production - - 0 - Yes - Not Reported Aluminum Production 234,165 - 0 - Yes - Not Reported Paper and Pulp 33,205 - 0 - Yes - Not Reported Limestone Use - - 0 - Yes - Not Reported Soda Ash Use - - 0 - Yes - Not Reported Semi-Conductor Manufacturing - - 0 - Yes - Not Reported Glass Production - - 0 - Yes - Not Reported Chemical Manufacturing - - 0 - Yes - Product Use (Ozone Depleting Substances) Product Use (Ozone Depleting Substances) - - 0 - -
NC Industrial Sources All Refrigerants- except SF6 99,181 - 0 - Yes -

Transportation Energy On-road - - 0 - -
NC Emission Summary - Onroad Motor Gasoline (E-10) 1,545,164 - 0 112,144 Yes Consumption MMBTU 23,564,075
NC Emission Summary - Onroad Diesel 421,448 - 0 - Yes Consumption MMBTU 5,679,245
Not Reported Ethanol (E-85) - - 0 - No Consumption MMBTU -
Not Reported Biodiesel - - 0 - No Consumption MMBTU -
Not Reported Electricity Consumption - - 0 - No Consumption MMBTU - Rail - - 0 - -
NC Emission Summary - Rail Diesel 71,649 - 0 - Yes Consumption MMBTU 965,503
NC Emission Summary - Rail Electricity Consumption - - 0 - Yes Consumption MMBTU - Marine - - 0 - -
NC Emission Summary -Com Marine Gasoline - - 0 - Yes Consumption MMBTU -
NC Emission Summary -Com Marine Distillate Fuels 28,744 - 0 - Yes Consumption MMBTU 387,332
NC Emission Summary -Com Marine Residual Fuels 27,070 - 0 - Yes Consumption MMBTU 359,267 Air - - 0 - -
NC Emission Summary-Aircraft All Fuels (Jet and Aviation Gasoline) 11,396 - 0 - No Consumption MMBTU 157,352 Non-road Mobile - - 0 - -
NC Emission Summary-Nonroad All Fuels (Diesel and Gasoline) 566,620 - 0 - Yes Consumption MMBTU 7,930,171 Waste Management Solid Waste Management - - 0 - -
NC Waste Landfill Methane and Combustion 241,497 - 97,305 - Yes - ONLY Scope 3 MSW+CD Generated Tonnes 318,273
Not Reported MSW incineration (non grid connected) - - 0 - Yes MSW+CD Processed Tonnes 394,956 Sewage Treatment - - 0 - MSW Sent for Incineration Tonnes -
NC Waste water Central WWTPs and Septic Systems 40,000 - 0 - Yes MSW incinerated in Boundary Tonnes - Agriculture Livestock - - 0 - GHG_NC_Agriculture Enteric Fermentation 519,547 - 0 - YesGHG_NC_Agriculture Manure management 107,207 - 0 - Yes
Crop Production and Soil Management - - 0 - GHG_NC_Agriculture Use of Fertilizer 31,506 - 0 - YesNot Reported Crop Residue Incineration - - 0 - NoLand Use and Forestry - - 0 - GHG_NC_Forest Urban Forest Annual Reserve 189,177 - 0 - No
GHG_NC_Forest Forest Carbon Reserve (TOTAL) 1,098,222,727 - 0 - No
Grand Totals Gross Totals 5,807,122 818,935 97,305 6,723,362 Total with Aircraft (as reported in NC Sustainability Plan) 5,818,518 818,935 97,305 - 6,734,758 Net Totals

Summary of Protocol Decisions for Required Tier II Source (Green Box Sources) "Rec" - recommended, "Alt" means acceptable alternativeYes No Brief Description of Method and Issues
(Rec) - Utility Supplied Data, (Alt 1) - extrapolation from partial set, (Alt 2) EIA allocation based HDD and Housing Unit Size XActual electricity sales data is provided by National Grid, NYSEG, and municipal utilities.
(Rec) - Utility Supplied Data, (Alt 1) - extrapolation from partial set, (Alt 2) EIA allocation based HDD and Housing Unit Size X As stated(Rec) Allocated EIA SEDS residential state consumption to counties based on Home Heating Fuel, HDD, and Housing Unit Size As stated(Rec) Allocated EIA SEDS residential state consumption to counties based on Home Heating Fuel, HDD, and Housing Unit Size As stated(Rec) Allocated EIA SEDS residential state consumption to counties based on Home Heating Fuel, HDD, and Housing Unit Size
(Rec) - Utility Supplied Data, (Alt 1) - extrapolation from partial set, (Alt 2) EIA allocation based on Fuel Oil Recommended method. XActual electricity sales data is provided by National Grid, NYSEG, and municipal utilities.
(Rec) - Utility Supplied Data, (Alt 1) - extrapolation from partial set, (Alt 2) EIA allocation based on Fuel Oil Recommended method. X As stated(Rec) Allocated EIA SEDS commercial state consumption to counties based on Home Heating Fuel, HDD, employment and Commercial Square Footage. (Alt) Allocation based on Home Heating, HDD, and Employment only. X As stated(Rec) Allocated EIA SEDS commercial state consumption to counties based on Home Heating Fuel, HDD, employment and Commercial Square Footage. (Alt) Allocation based on Home Heating, HDD, and Employment only. X As stated(Rec) Allocated EIA SEDS commercial state consumption to counties based on Home Heating Fuel, HDD, employment and Commercial Square Footage. (Alt) Allocation based on Home Heating, HDD, and Employment only. X As stated(Rec) Allocated EIA SEDS commercial state consumption to counties based on Home Heating Fuel, HDD, employment and Commercial Square Footage. (Alt) Allocation based on Home Heating, HDD, and Employment only. X As stated(Rec) Allocated EIA SEDS commercial state consumption to counties based on Home Heating Fuel, HDD, employment and Commercial Square Footage. (Alt) Allocation based on Home Heating, HDD, and Employment only. X As stated
(Rec) - Utility Supplied Data, (Alt 1) - extrapolation from partial set, (Alt 2) allocate SEDS EIA data based allocated by industrial employment XActual electricity sales data is provided by National Grid, NYSEG, and municipal utilities.
(Rec) - Pie Slice Method. (1) Allocate directly all Title 5 / MMR reporting industrial facilities to the counties / municipalities. (2) compute total statewide industrial fuel use for all Title 5 / EPA MMR reporting facilities and subtract that from the EIA SEDS reported fuel use for the industrial sector (3) allocate the balance from step 2 to counties by industrial employment for manufacturing. The balance is assumed to represent smaller industry that does not report under Title 5 regulations. X(Rec) - Pie Slice Method. (1) Allocate directly all Title 5 / MMR reporting industrial facilities to the counties / municipalities. (2) compute total statewide industrial fuel use for all Title 5 / EPA MMR reporting facilities and subtract that from the EIA SEDS reported fuel use for the industrial sector (3) allocate the balance from step 2 to counties by industrial employment for manufacturing. The balance is assumed to represent smaller industry that does not report under Title 5 regulations. X(Rec) - Pie Slice Method. (1) Allocate directly all Title 5 / MMR reporting industrial facilities to the counties / municipalities. (2) compute total statewide industrial fuel use for all Title 5 / EPA MMR reporting facilities and subtract that from the EIA SEDS reported fuel use for the industrial sector (3) allocate the balance from step 2 to counties by industrial employment for manufacturing. The balance is assumed to represent smaller industry that does not report under Title 5 regulations. X(Rec) - Pie Slice Method. (1) Allocate directly all Title 5 / MMR reporting industrial facilities to the counties / municipalities. (2) compute total statewide industrial fuel use for all Title 5 / EPA MMR reporting facilities and subtract that from the EIA SEDS reported fuel use for the industrial sector (3) allocate the balance from step 2 to counties by industrial employment for manufacturing. The balance is assumed to represent smaller industry that does not report under Title 5 regulations. X(Rec) - Pie Slice Method. (1) Allocate directly all Title 5 / MMR reporting industrial facilities to the counties / municipalities. (2) compute total statewide industrial fuel use for all Title 5 / EPA MMR reporting facilities and subtract that from the EIA SEDS reported fuel use for the industrial sector (3) allocate the balance from step 2 to counties by industrial employment for manufacturing. The balance is assumed to represent smaller industry that does not report under Title 5 regulations. X(Rec) - Pie Slice Method. (1) Allocate directly all Title 5 / MMR reporting industrial facilities to the counties / municipalities. (2) compute total statewide industrial fuel use for all Title 5 / EPA MMR reporting facilities and subtract that from the EIA SEDS reported fuel use for the industrial sector (3) allocate the balance from step 2 to counties by industrial employment for manufacturing. The balance is assumed to represent smaller industry that does not report under Title 5 regulations. X
(Rec) - Direct Allocation from Title 5, MMR, or EIA 923 Database. All Grid Connected Power Generators with Nameplate capacity of 1 MW or greater shall be reported. For overlap, prioritize EIA 923 Database. X EIA 923 database used(Rec) - Direct Allocation from Title 5, MMR, or EIA 923 Database. All Grid Connected Power Generators with Nameplate capacity of 1 MW or greater shall be reported. For overlap, prioritize EIA 923 Database. X EIA 923 database used
X EIA 923 database used(Rec) - Direct Allocation from Title 5, MMR, or EIA 923 Database. All Grid Connected Power Generators with Nameplate capacity of 1 MW or greater shall be reported. For overlap, prioritize EIA 923 Database. X EIA 923 database used
(Rec) - Direct Allocation from Title 5, MMR, or EIA 923 Database. All Grid Connected Power Generators with Nameplate capacity of 1 MW or greater shall be reported. Wood CO2 emissions reported optionally as biogenic CO2, Ch4 and N2 Emissions required to be reported to Scope 1 X EIA 923 database used
(Rec) - Direct Allocation from Title 5, MMR, or EIA 923 Database. All Grid Connected Power Generators with Nameplate capacity of 1 MW or greater shall be reported. MSW CO2 emissions split as 44% reported as Scope 1 as part of non-biogenic (plastics etc), and 56% can be reported as option biogenic based data for 2005 on http://www.eia.gov/cneaf/solar.renewables/page/mswaste/msw_report.html. All Ch4 and N2O shall be reported under required Scope 1. X EIA 923 database used
Protocol Compliance ReportAdherence
Direct energy use as reported for Title 5 industrial facilities only, additional allocation based on statewide emissions by industrial employees is not representative of the region, therefore not included

(Rec) - Acquire utility specific estimate of T/D (in %) and apply that to all consumption (res/commercial/industrial). Report emissions as Scope 2 using regional EGRID emission factors consistent with all Scope 2 calculations. (Alt) use a statewide average T/D loss of 5.28% as documented by EPA's EGRID reporting for New York. X Alternative Method As stated
(Rec) - Acquire utility specific estimate of T/D (in %), compute as percentage of total residential/commercial/industrial/energy generation. Report as Scope 1 CH4 emissions. (Alt) use a statewide average of 1.8% as documented by National Grid in 2010 PSC Reporting.
(Rec) - acquire utility specific estimate and report as SF6. (Alt) Apportion NYSERDA 2009 Emission Inventory Total for the state to counties based ration of EIA reported total electricity demand to computed regional or county demand for all sectors. X
Based on conversations with P Groth and J Yienger, used national 2010 emission inventory total
X Nothing to reportX Nothing to reportX Nothing to reportX As statedX As statedX Nothing to reportX Nothing to reportX Nothing to reportX Nothing to reportX Nothing to report
(Rec) Use EPA 2009 Draft Guidance method. Allocate national per/capita emissions to counties based on population. Methods include mobile refrigeration X As stated
(Rec) Direct Allocation from from EPA MMR only. Small Sources to not to be included at this time.

(Rec) Use MPO-provided VMT data local to your region, supplemented by DOT provided data (on Wiggio). Use regional-specific data on fleet profile and national fleet fuel economy data (on Wiggio) to estimate county-level GHG emissions. (Alt) Use EPA MOVES GHG module customized for your region- appropriate if you are running this model. Assume on-road fuel is 10% ethanol and report this fraction as Optional biogenic emissions. X As stated(Rec) Use MPO-provided VMT data local to your region, supplemented by DOT provided data (on Wiggio). Use regional-specific data on fleet profile and national fleet fuel economy data (on Wiggio) to estimate county-level GHG emissions. (Alt) Use EPA MOVES GHG module customized for your region- appropriate if you are running this model. Assume on-road fuel is 10% ethanol and report this fraction as Optional biogenic emissions on the ethanol line item. X As statedOptional- Include regional E-85 consumption if you have it, and debit against your gasoline estimate create using VMT. Allocate 15% as gasoline to be reported as Scope 1, and 85% as ethanol to be reported as optional biogenic. X Not availableOptional- Include regional biodiesel consumption if you have it, and debit against your diesel estimate create using VMT. Because biodiesel blends change, allocate option biogenic component on this line item only, and retain the diesel fraction on the diesel line item. X Not availableToday this will be zero, but as NYSERDA pushes to electrify on-road transportation we will want to report here, debiting against electricity consumption in the other sectors as appropriate. X Not available
Freight and Passenger. (Rec) Use direct provider fuel consumption data allocated spatially to location of routes (Alt) Use Nyserda 2002 estimates of Diesel consumption by county directly. X As stated
Passenger and Commuter (Rec) Use direct provider electricity consumption data allocated spatially to location of routes (Alt) None identified. X Not applicable
XAs stated, except recreational boating included in non-road data
XAs stated, except recreational boating included in non-road data
XAs stated, except recreational boating included in non-road data
Optional Scope 1- Estimate Landing and Take off Cycle emissions using a dispersion model such as EDMS, or with related data from the NYSDEC for the 2007 state emission inventory. Optional Scope 3, use FAA statistics on departure miles from regional airport, allocate jet fuel use to it, then allocate to counties by fraction of population served X
Scope 1 option, using EDMS. Total added to roll up totals discussed within Sustainability Plan
Rec - USE NYSDEC 2007 NONROAD data from the state emission inventory (data on Wiggio) for all categories except small marine. X As stated, but includes recreational marine
This is fugitive CH4 emissions from landfills. There are two required Scopes. Scope 1 - Estimate of actual emissions in regional boundary. (rec) use MMR or Title 5 (annual landfill reporting) data directly for facilities (data on Wiggio). For recently closed landfills or for areas without reported data, use a First Order Decay model to estimate emissions. Scope 3- emissions footprint attributed to current waste generation regardless of where it is treated. (rec) Estimate county level MSW and C/D waste generation and apply a representative FOD model with prevailing CH4 captures rates forward-casted 50 years to estimate the footprint. X
Actual 2010 treatment emissions reported, allocated to counties in region based on average tonnage per capita
Rec - for any MSW incinerated that does not generate grid connected power, compute emissions. MSW CO2 emissions split. 44% shall be reported as Scope 1 as part of non-biogenic (plastics etc), and 56% can be reported as option biogenic based data for 2005 on http://www.eia.gov/cneaf/solar.renewables/page/mswaste/msw_report.html. All Ch4 and N2O shall be reported under required Scope 1 X
Not reported, no non-grid incinerators reported in DEC data.
Determine population covered by WWTPs. (Rec)- Use the ICLEI Local Government Operations Protocol and apply to all facilities in the region. (Alt) use methods as described in the EPA 2009 Draft GHG guidance to translate populations served into emissions using default data. Determine population covered by Septic Systems, and apply the default emissions / capita as described in the ICLEI Local Government Operations Protocol. X
Based on conversations with P. Groth and J. Yienger, used State Inventory Tool and regional population, allocated to county by population
X As statedX As stated
X As statedX None reported
X As stated
XTotal reported for information, change is not relevant to WG discussions
Sum Totals in columns for all EXCEPT ANY FORESTRY SINKS. Totals in the Scope 1 column can be a considered a physical roll up of emissions that occur in boundary, and is analogous to reporting that is done for state and federal GHG inventories, and for air quality management.
Value above MINUS and reported optional forestry sinks.
Rec - USE NYSDEC 2007 data from the state emission inventory for the small and pleasure craft categories reported by county (data on Wiggio). For commercial distillate and bunkers, No consensus method identified- please document methods used.
(Rec) Methods as described in the EPA 2009 guidance and executed in the EPA's State Inventory Tool. Use locally resolved fertilizer, crop, and livestock population from either the 2007 Ag census or the US NASS system to get county-level data and make calculations for each county.
Optional Source and Sink. Use methods described in the EPA 2009 Guidance. Use local forest inventory data, or use the US Forest Services online inventory tool for forests. For carbon stock factors use the National Council for Air and Stream Improvement’s Carbon On-Line Estimator.(NCASI 2008) Use the

REDC / County Name QAQC
Color CodeREQUIRED for the Roll Up Report, though some data may be zero, N/A, or considered to small to countReport NO Data in cell
CO2e CO2 CH4 N2O PFC HFC SF6Built Environment Residential Energy Consumption
Electricity / Steam 325,724 324,140 218 1,366 - - - Natural Gas 290,410 290,125 115 170 - - - Propane / LPG 103,286 102,880 103 304 - - - Distillate Fuel Oil (#1, #2, Kerosene) 432,290 430,840 367 1,084 - - - Wood 16,477 - 5,609 10,868 - - - Commercial Energy Consumption - - - - - - - Electricity / Steam 178,964 178,094 120 751 - - - Natural Gas 204,913 204,712 81 120 - - - Propane / LPG 40,396 40,237 40 119 - - - Distillate Fuel Oil (#1, #2, Kerosene) 395,820 394,492 336 992 - - - Residual Fuel Oil (#4 and #6) - - - - - - - Coal 357 355 1 2 - - - Wood 6,474 - 2,204 4,270 - - - Industrial Energy Consumption - - - - - - - Electricity / Steam 269,206 267,897 180 1,129 - - - Natural Gas 186,750 186,567 74 109 - - - Propane / LPG 1,701 1,695 2 5 - - - Distillate Fuel Oil (#1, #2, Kerosene) 1,285 1,281 1 3 - - - Residual Fuel Oil (#4 and #6) 262,255 261,388 219 647 - - - Coal - - - - - - - Wood 1,928 - 656 1,272 - - - Energy Generation and Supply - - - - - - - Electricity T/D Losses 45,041 44,822 30 189 - - - Natural Gas T/D Losses 126,913 - 126,913 - - - - Use of SF6 in the Utility Industry 10,359 - - - - - 10,359 Industrial Processes - - - - - - - Cement Production - - - - - - - Iron and Steel Production - - - - - - - Ferroalloy Production - - - - - - -
DRAFT Roll Up Report CGC. Emissions in MTCDE
REDC GHG Emissions Roll Up ReportYear: 2010 (all emissions in Column D, when summed will equal the total County or REDC protocol compliant GHG emissions estimate)

Aluminum Production 234,165 211,169 - - 22,996 - - Paper and Pulp 33,205 - - - - - - Limestone Use - - - - - - - Soda Ash Use - - - - - - - Semi-Conductor Manufacturing - - - - - - - Chemical Manufacturing - - - - - - - Product Use (ODS Substitutes) - - - - - - - All Refrigerants- except utility SF6 99,181 - - - - 99,181 -
Transportation Energy On-road: ALL(Total not ethanol) - - - - - - - Motor Gasoline (E-10) 1,545,164 1,539,705 4,078 1,381 - - - Diesel 421,448 420,037 1,053 358 - - - Ethanol - - - - - - - Biodiesel - - - - - - - Rail - - - - - - - Diesel 71,649 71,409 180 61 - - - Electricity Consumption - - - - - - - Marine - - - - - - - Gasoline - - - - - - - Distillate 28,744 28,647 72 24 - - - Residual Fuel Oil 27,070 26,981 67 23 - - - Off-road Mobile - - - - - - - All Fuels (Diesel and Gasoline) 566,620 564,649 1,472 499 - - -
Waste Management Solid Waste Management - - - - - - - Landfill Methane and Combustion 97,305 134 97,170 0 - - - MSW incineration (non grid connected) - - - - - - - Sewage Treatment - - - - - - - Central WWTPs and Septic Systems 40,000 - 30,000 10,000 - - -
Agriculture Livestock - - - - - - - Enteric Fementation 519,547 - 519,547 - - - - Manure management 107,207 - 88,631 18,577 - - - Crop Production and Soil Management - - - - - - - Use of Fertilizer 31,506 - - 31,506 - - - Crop Residue Incineration - - - - - - -
Grand Totals 6,723,362 5,592,254 879,538 85,828 22,996 99,181 10,359