nykredit bank group h1 interim report 2019
TRANSCRIPT

Nykredit Bank – H1 Interim Report 2019 1/46
Nykredit Bank
H1 Interim Report 2019

2/46 H1 Interim Report 2019 – Nykredit Bank
MANAGEMENT COMMENTARY 2
Financial highlights 3
Financial review 4
Performance highlights for H1/2019 4
Results for Q2/2019 relative to Q1/2019 6
Outlook for 2019 6
Special accounting circumstances 6
Other 6
Uncertainty as to recognition and measurement 6
Events since the balance sheet date 6
Capital 7
Equity and own funds 7
Credit ratings 7
Supervisory Diamond for banks 8
Impairment and lending 9
Alternative performance measures 11
MANAGEMENT STATEMENT 12
Statement by the Board of Directors and the Executive Board 12
FINANCIAL STATEMENTS 13
Statements of income and comprehensive income 13
Balance sheets 15
Statement of changes in equity 17
Cash flow statement 19
Notes 20
CONTENTS

Nykredit Bank – H1 Interim Report 2019 3/46
DKK million
Nykredit Bank Group H1/ H1/ Q2/ Q1/
2019 2018 2019 2019 2018
BUSINESS PROFIT AND PROFIT FOR THE PERIOD
Net interest income 742 752 373 369 1,533
Net fee income 267 273 139 128 521
Wealth management income 719 670 369 350 1,361
Net interest from capitalisation (15) (15) (7) (7) (30)
Trading, investment portfolio and other income 349 523 220 129 756
Income 2,062 2,202 1,093 969 4,141
Costs 1,048 988 528 520 2,029
Business profit before impairment charges 1,014 1,215 565 448 2,112
Impairment charges for loans and advances 97 129 36 61 274
Business profit 917 1,086 529 387 1,838
Legacy derivatives (269) 219 (50) (219) 280
Profit before tax 647 1,305 479 168 2,118
Tax 141 281 104 37 458
Profit for the period 506 1,025 375 131 1,660
SUMMARY BALANCE SHEET
Assets 30.06.2019 30.06.2018 30.06.2019 31.03.2019 31.12.2018
Cash balances and receivables from credit institutions and central banks 24,385 12,724 24,385 26,493 17,909
Reverse repurchase lending 49,147 31,192 49,147 36,548 37,427
Loans, advances and other receivables at amortised cost 63,505 58,344 63,505 60,723 60,566
Bonds and equities etc 49,041 49,075 49,041 44,933 49,289
Remaining assets 28,555 22,755 28,555 24,261 21,943
Total assets 214,634 174,090 214,634 192,958 187,135
Liabilities and equity
Payables to credit institutions and central banks 77,760 42,434 77,760 49,098 54,620
Repo deposits 3,216 11,851 3,216 10,475 5,745
Deposits and other payables 80,088 72,442 80,088 79,856 77,119
Bonds in issue at amortised cost 5,511 4,779 5,511 4,849 5,411
Other non-derivative financial liabilities at fair value 9,411 6,059 9,411 11,363 7,618
Remaining liabilities 14,751 13,811 14,751 13,765 13,236
Provisions 295 254 295 326 290
Subordinated debt 2,000 2,000 2,000 2,000 2,000
Equity 21,601 20,460 21,601 21,226 21,095
Total liabilities and equity 214,634 174,090 214,634 192,958 187,135
FINANCIAL RATIOS¹
Profit for the period as % pa of average equity 4.7 10.2 7.0 2.5 8.1
Costs as % of income 50.8 44.8 48.3 53.7 49.0
Total provisions for loan impairment and guarantees 2,758 2,853 2,758 2,862 2,896
Impairment charges for the period, % 0.06 0.14 0.03 0.10 0.30
Total capital ratio, % 20.7 22.4 20.7 20.8 21.5
Tier 1 capital ratio, % 18.7 20.0 18.7 19.0 19.4
Common Equity Tier 1 capital ratio, % 18.7 20.0 18.7 19.0 19.4
Average number of staff, full-time equivalent 843 830 856 830 837
¹ Financial ratios are defined on page 113 in the Annual Report 2018.
FINANCIAL HIGHLIGHTS

4/46 H1 Interim Report 2019 – Nykredit Bank
PERFORMANCE HIGHLIGHTS FOR H1/2019 The financial performance in H1/2019 was in accordance with our ex-
pectations. Business profit amounted to DKK 917 million (H1/2018:
DKK 1,086 million). Profit before tax amounted to DKK 647 million
(H1/2018: DKK 1,305 million). The profit decline was mainly due to the
lower interest level affecting value adjustments of swaps.
Nykredit Bank is an important part of the Nykredit Group and many
mortgage customers are also full-service banking customers of
Nykredit Bank. Nykredit Bank widely underpins the Group's mortgage
business, eg by offering market making in the Group's covered bonds
and thus contributing to ensuring high liquidity.
Nykredit Bank aims to be customers' preferred bank, always striving to
further enhance the customer experience. Nykredit's customer con-
cepts continued to generate satisfactory growth in the number of full-
service (BoligBank) customers and increasing business volumes.
Bank lending increased by DKK 5.2 billion to DKK 63.5 billion, corre-
sponding to a 8.8% increase since 30 June 2018. Including secured
homeowner loans transferred to Totalkredit of DKK 6.7 billion, loans
and advances have increased by 10.4% since end-June 2018.
To our full-service personal banking customers who have consoli-
dated all of their finances with Nykredit, we have launched the
MineMål benefits programme aimed at helping customers achieve
their goals and dreams as homeowners. Under this programme, cus-
tomers receives a cash bonus of DKK 250 each quarter. In May we
paid the bonus for Q2 into customers’ MineMål accounts, and at the
same time we launched the MineMål app which offers customers a
string of special deals from some of Nykredit's business partners.
From 1 July 2019, customers under the MineMål benefits programme
also get an interest rate discount of 0.15% on the outstanding debt on
homeowner loans with Nykredit Bank.
Assets under management continued the strong growth of recent
years, particularly driven by international clients, professional Danish
clients and Private Banking Elite clients. Assets under management
have grown by DKK 22.2 billion since end-2018 to DKK 232.9 billion
at end-H1/2019. At end-June, the formal agreement to acquire 75% of
the shares in Sparinvest was signed. Closing is subject to regulatory
approval, but is expected in H2/2019 and will further increase
Nykredit’s assets under management. Joining strengths with Sparin-
vest will increase our joint competitiveness and distribution power,
consolidate our wealth management skills and secure a wider and
stronger product portfolio, improving our capacity to accommodate the
demands that both personal customers and institutional clients place
on us as asset manager, also in the long run.
Nykredit Private Banking has received several private banking awards
in 2019. Nykredit Private Banking Elite won Best Domestic Clients
Team in the category European Private Banking at the Wealth Briefing
European Awards 2019 and was honoured with first place in the cate-
gory Outstanding Private Banking Customer Relationship Service and
Engagement by Private Banker International in London for the second
consecutive year.
Income
Income declined by DKK 140 million to DKK 2,062 million (H1/2018:
DKK 2,202 million), which was primarily attributable to the lower inter-
est rate level affecting value adjustments of swaps negatively.
Net interest income declined by DKK 10 million to DKK 742 million
(H1/2018: DKK 752 million) and net fee income declined by DKK 6
million to a total of DKK 267 million (H1/2018: DKK 273 million). Net
interest income was negatively affected by a decrease in lending mar-
gins.
Wealth management income increased by DKK 49 million to DKK 719
million (H1/2018: DKK 670 million). Income rose mainly due to growth
in assets under management.
Net interest from capitalisation, which includes interest on subordi-
nated debt etc, totalled an expense of DKK 15 million (H1/2018: a loss
of DKK 15 million).
FINANCIAL REVIEW
Business profit for H1/2019
DKK 917 million
Business profit for the period
Profit for H1/2019
DKK 647 million
Profit before tax for the period
Income in H1/2019
DKK 2,062 million
Income
Return on equity
4.7%
Profit for the period as % of average
equity
Cost:income ratio
50.8%
Costs as % of income
Impairment charges, %
0.06%
Impairment charges for the period
divided by loans, advances and
guarantees

Nykredit Bank – H1 Interim Report 2019 5/46
Trading, investment portfolio and other income, including value adjust-
ments of swaps currently offered, fell by DKK 174 million to DKK 349
million (H1/2018: DKK 523 million), driven by the lower interest rate
level affecting value adjustments of swaps negatively, which was
partly offset by a rise in investment portfolio income.
Costs
Costs increased by DKK 60 million to DKK 1,048 million (H1/2018:
DKK 988 million). The Group still maintains focus on building organi-
sational efficiency, while investing significant resources in compliance
and implementation of new regulatory requirements as well as extend-
ing the partnership with BEC.
The average number of full-time equivalent staff totalled 843 (830 in
H1/2018).
Impairment charges for loans and advances and provisions for
guarantees etc
Impairment charges for the period remained low at 0.06% (H1/2018:
0.14%). Impairment charges and provisions came to DKK 97 million
(H1/2018: DKK 129 million). Retail Banking accounted for DKK 123
million, C&I Banking accounted for a net reversal of DKK 28 million
and Wealth Management accounted for a net reversal of DKK 5 mil-
lion.
Legacy derivatives
This item includes credit value adjustment of swaps involving an in-
creased risk of loss. These value adjustments are not included in the
business profit and comprise all net income from a number of deriva-
tive products which Nykredit no longer offers to customers.
Value adjustment was a negative DKK 269 million (H1/2018: an in-
come of DKK 219 million). The decline in legacy derivatives primarily
resulted from decreasing interest rates.
The portfolio of legacy derivatives had a total market value of DKK 6.2
billion (DKK 5.6 billion at end-2018). The portfolio was written down to
DKK 4.0 billion (DKK 3.5 billion at end-2018).
Tax
Tax on profit for the period was DKK 141 million (H1/2018: DKK 281
million).
Balance sheet
The balance sheet stood at DKK 214.6 billion at end-June 2019 (DKK
187.1 billion at end-2018).
Receivables from credit institutions and cash balances etc rose by
DKK 6.5 billion to DKK 24.4 billion, and reverse repurchase lending in-
creased by DKK 11.7 billion to DKK 49.1 billion.
Lending at amortised cost (excluding reverse repurchase lending)
rose by DKK 2.9 billion relative to end-2018 to DKK 63.5 billion at end-
June 2019.
In recent years, Nykredit Bank has transferred a number of secured
homeowner loans to Totalkredit, which has reduced the Bank's bal-
ance sheet. At 30 June 2019 these loans amounted to DKK 6.7 billion
(DKK 6.2 billion at end-2018). Loan balances including secured home-
owner loans totalled DKK 70.2 billion (DKK 66.8 billion at end-2018).
The bond and equity portfolios totalled DKK 49.0 billion (DKK 49.3 bil-
lion at end-2018). The bond portfolio might fluctuate significantly from
one reporting period to another, which should be seen in the context
of the Bank's repo activities, trading positions and general liquidity
management. The same applies to balances with credit institutions.
Remaining assets were DKK 28.6 billion (DKK 21.9 billion at end-
2018). At end-June 2019 DKK 22.6 billion was attributable to positive
market values of derivatives (DKK 17.8 billion at end-2018). The posi-
tive market values related to the Bank's customer activities in deriva-
tives and positions for hedging own risk. The Bank's interest rate risk
is widely hedged through offsetting interest rate swaps.
Payables to credit institutions and central banks rose by DKK 23.1 bil-
lion to DKK 77.8 billion (DKK 54.6 billion at end-2018), while repo de-
posits fell by DKK 2.5 billion to DKK 3.2 billion (DKK 5.7 billion at end-
2018).
Deposits and other payables (excluding repo deposits) went up by
DKK 3.0 billion to DKK 80.1 (DKK 77.1 billion at end-2018).
Bonds in issue totalled DKK 5.5 billion (DKK 5.4 billion at end-2018).
The Bank's issues under the ECP and EMTN programmes are contin-
uously adapted to the Bank's liquidity needs.
Other non-derivative financial liabilities at fair value, which include
negative bond portfolios, for which the Bank has a repurchase obliga-
tion, came to DKK 9.4 billion (DKK 7.6 billion at end-2018).
Remaining payables and provisions amounted to DKK 15.0 billion
(DKK 13.5 billion at end-2018). The item mainly consisted of interest
and commission payable and negative market values of derivative fi-
nancial instruments. The negative market values of derivative financial
instruments were DKK 12.7 billion (DKK 10.7 billion at end-2018).
Equity
Equity stood at DKK 21.6 billion at end-June 2019 (DKK 21.1 billion at
end-2018).
DKK million
Nykredit Bank Group
Equity 30.06.2019 31.12.2018
Equity, beginning of year 21,095 19,877
IFRS 9 impact - (441)
Profit after tax 506 1,660
Total equity 21,601 21,095
6/46 H1 Interim Report 2019 – Nykredit Bank
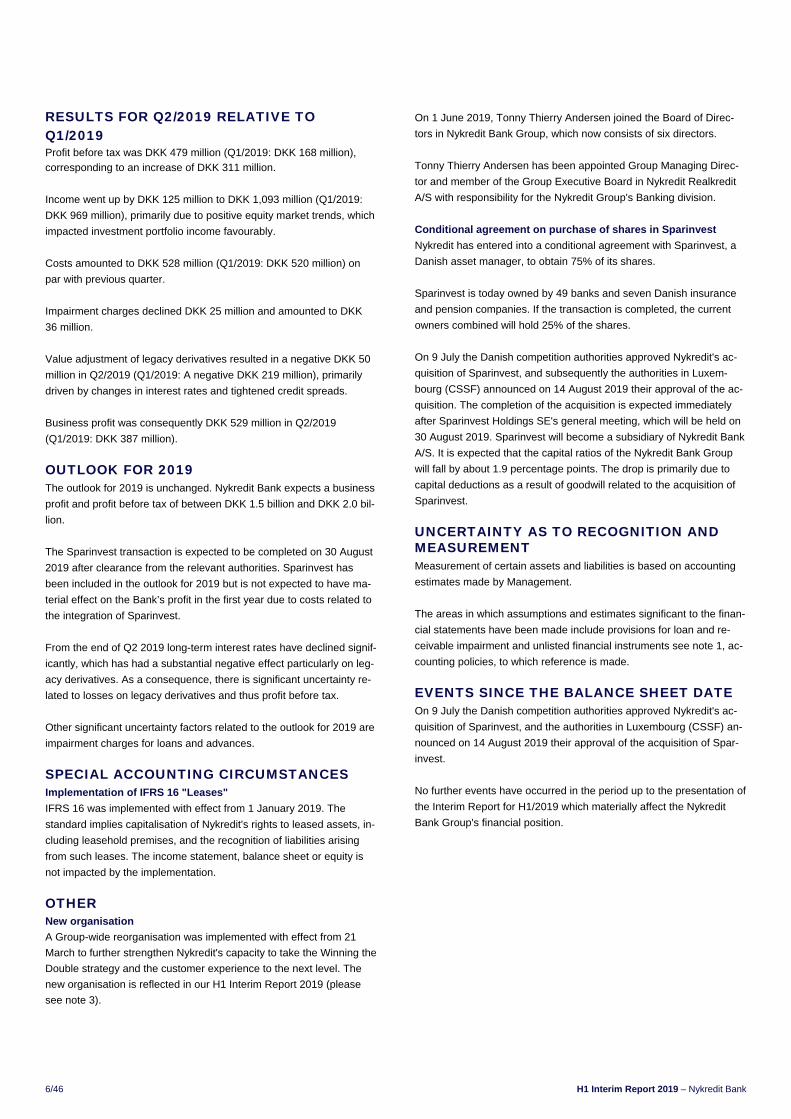
RESULTS FOR Q2/2019 RELATIVE TO Q1/2019 Profit before tax was DKK 479 million (Q1/2019: DKK 168 million),
corresponding to an increase of DKK 311 million.
Income went up by DKK 125 million to DKK 1,093 million (Q1/2019:
DKK 969 million), primarily due to positive equity market trends, which
impacted investment portfolio income favourably.
Costs amounted to DKK 528 million (Q1/2019: DKK 520 million) on
par with previous quarter.
Impairment charges declined DKK 25 million and amounted to DKK
36 million.
Value adjustment of legacy derivatives resulted in a negative DKK 50
million in Q2/2019 (Q1/2019: A negative DKK 219 million), primarily
driven by changes in interest rates and tightened credit spreads.
Business profit was consequently DKK 529 million in Q2/2019
(Q1/2019: DKK 387 million).
OUTLOOK FOR 2019 The outlook for 2019 is unchanged. Nykredit Bank expects a business
profit and profit before tax of between DKK 1.5 billion and DKK 2.0 bil-
lion.
The Sparinvest transaction is expected to be completed on 30 August
2019 after clearance from the relevant authorities. Sparinvest has
been included in the outlook for 2019 but is not expected to have ma-
terial effect on the Bank’s profit in the first year due to costs related to
the integration of Sparinvest.
From the end of Q2 2019 long-term interest rates have declined signif-
icantly, which has had a substantial negative effect particularly on leg-
acy derivatives. As a consequence, there is significant uncertainty re-
lated to losses on legacy derivatives and thus profit before tax.
Other significant uncertainty factors related to the outlook for 2019 are
impairment charges for loans and advances.
SPECIAL ACCOUNTING CIRCUMSTANCES Implementation of IFRS 16 "Leases"
IFRS 16 was implemented with effect from 1 January 2019. The
standard implies capitalisation of Nykredit's rights to leased assets, in-
cluding leasehold premises, and the recognition of liabilities arising
from such leases. The income statement, balance sheet or equity is
not impacted by the implementation.
OTHER New organisation
A Group-wide reorganisation was implemented with effect from 21
March to further strengthen Nykredit's capacity to take the Winning the
Double strategy and the customer experience to the next level. The
new organisation is reflected in our H1 Interim Report 2019 (please
see note 3).
On 1 June 2019, Tonny Thierry Andersen joined the Board of Direc-
tors in Nykredit Bank Group, which now consists of six directors.
Tonny Thierry Andersen has been appointed Group Managing Direc-
tor and member of the Group Executive Board in Nykredit Realkredit
A/S with responsibility for the Nykredit Group's Banking division.
Conditional agreement on purchase of shares in Sparinvest
Nykredit has entered into a conditional agreement with Sparinvest, a
Danish asset manager, to obtain 75% of its shares.
Sparinvest is today owned by 49 banks and seven Danish insurance
and pension companies. If the transaction is completed, the current
owners combined will hold 25% of the shares.
On 9 July the Danish competition authorities approved Nykredit's ac-
quisition of Sparinvest, and subsequently the authorities in Luxem-
bourg (CSSF) announced on 14 August 2019 their approval of the ac-
quisition. The completion of the acquisition is expected immediately
after Sparinvest Holdings SE's general meeting, which will be held on
30 August 2019. Sparinvest will become a subsidiary of Nykredit Bank
A/S. It is expected that the capital ratios of the Nykredit Bank Group
will fall by about 1.9 percentage points. The drop is primarily due to
capital deductions as a result of goodwill related to the acquisition of
Sparinvest.
UNCERTAINTY AS TO RECOGNITION AND MEASUREMENT Measurement of certain assets and liabilities is based on accounting
estimates made by Management.
The areas in which assumptions and estimates significant to the finan-
cial statements have been made include provisions for loan and re-
ceivable impairment and unlisted financial instruments see note 1, ac-
counting policies, to which reference is made.
EVENTS SINCE THE BALANCE SHEET DATE On 9 July the Danish competition authorities approved Nykredit's ac-
quisition of Sparinvest, and the authorities in Luxembourg (CSSF) an-
nounced on 14 August 2019 their approval of the acquisition of Spar-
invest.
No further events have occurred in the period up to the presentation of
the Interim Report for H1/2019 which materially affect the Nykredit
Bank Group's financial position.

Nykredit Bank – H1 Interim Report 2019 7/46
EQUITY AND OWN FUNDS Equity
Equity carried for accounting purposes totalled DKK 21.6 billion at end
June-2019 (DKK 21.1 billion at end-2018). Equity is identical in
Nykredit Bank A/S and the Nykredit Bank Group, as the same recog-
nition and measurement principles are applied.
DKK million
Nykredit Bank Group
Capital and capital adequacy 30.06.2019 31.12.2018
Credit risk 95,476 87,742
Market risk 11,286 12,794
Operational risk 8,143 7,765
Total risk exposure amount 114,904 108,300
Share capital 8,045 8,045
Retained earnings 13,556 13,050
Equity, end of period 21,601 21,095
Prudent valuation adjustment (26) (32)
Intangible assets and deferred tax assets (15) (16)
Deduction for difference between IRB losses and
impairments - -
Other deductions - -
Transitional adjustment of deductions - -
Common Equity Tier 1 capital 21,561 21,048
Additional Tier 1 capital - -
Other deductions - -
Tier 1 capital 21,561 21,048
Tier 2 capital 2,000 2,000
Tier 2 capital additions/deductions 227 336
Transitional adjustment of Tier 2 capital - -
Own funds 23,787 23,384
Common Equity Tier 1 capital ratio, % 18.7 19.4
Tier 1 capital ratio, % 18.7 19.4
Total capital ratio, % 20.7 21.5
Internal capital adequacy requirement
(Pillar I and II), % 10.8 10.2
DKK million
Nykredit Bank Group
Required own funds and internal capital ade-quacy requirement 30.06.2019 31.12.2018
Credit risk (including CVA) 7,638 7,019
Market risk 903 1,023
Operational risk 651 621
Total Pillar I 9,192 8,664
Slightly weaker economic climate etc. 704 976
Other risks 2,516 1,196
Model and calculation uncertainties - 192
Total Pillar II 3,220 2,364
Total required own funds 12,412 11,029
Internal capital adequacy requirement
(Pillar I and Pillar II), % 10.8 10.2
Capital
At end June-2019 Nykredit Bank's total own funds came to DKK 23.8
billion (DKK 23.4 billion at end-2018) determined inclusive of profit for
H1/2019. Common Equity Tier 1 (CET1) capital is the most important
capital concept in the determination of capital, as this is the type of
capital required to comply with most of the regulatory capital require-
ments in the future. The Bank's CET1 capital amounted to DKK 21.6
billion (DKK 21.0 billion at end-2018).
The risk exposure amount (REA) totalled DKK 114.9 billion (DKK
108.3 billion at end-2018), mainly due to increased credit risk.
At end-June 2019 the total capital ratio was 20.7% and the CET 1
capital ratio 18.7% (21.5% and 19.4% at end-2018).
The determination of required own funds takes into account the busi-
ness objectives by allocating capital for all relevant risks. Nykredit
Bank's required own funds totalled DKK 12.4 billion (DKK 11.0 billion
at end-2018). Nykredit Bank's internal capital adequacy requirement is
calculated as the required own funds as a percentage of REA. The in-
ternal capital adequacy requirement was 10.8% (10.2% at end-2018).
CREDIT RATINGS Nykredit Realkredit A/S and Nykredit Bank A/S have rating relation-
ships with the international credit rating agencies S&P Global Ratings
(S&P) and Fitch Ratings regarding the credit ratings of the companies
and their funding.
S&P Global Ratings
Nykredit Realkredit and Nykredit Bank each have long-term and short-
term issuer ratings of A/A-1 with S&P. The rating outlook is positive.
Nykredit Realkredit and Nykredit Bank have been assigned long-term
and short-term Resolution Counterparty Ratings of A+/A-1.
Senior unsecured non-preferred debt has a BBB+ rating with S&P.
Fitch Ratings
Nykredit Realkredit and Nykredit Bank each have long-term and short-
term issuer credit ratings of A/F1 with Fitch Ratings. The rating outlook
is stable.
Nykredit Realkredit's and Nykredit Bank's long-term senior unsecured
preferred debt ratings were A+, while Nykredit Bank's long-term and
short-term deposit ratings are A+/F1.
Senior unsecured non-preferred debt has an A rating with Fitch Rat-
ings.
Listing of ratings
A table listing Nykredit's credit ratings with S&P and Fitch Ratings is
available at nykredit.com/rating.
CAPITAL
8/46 H1 Interim Report 2019 – Nykredit Bank
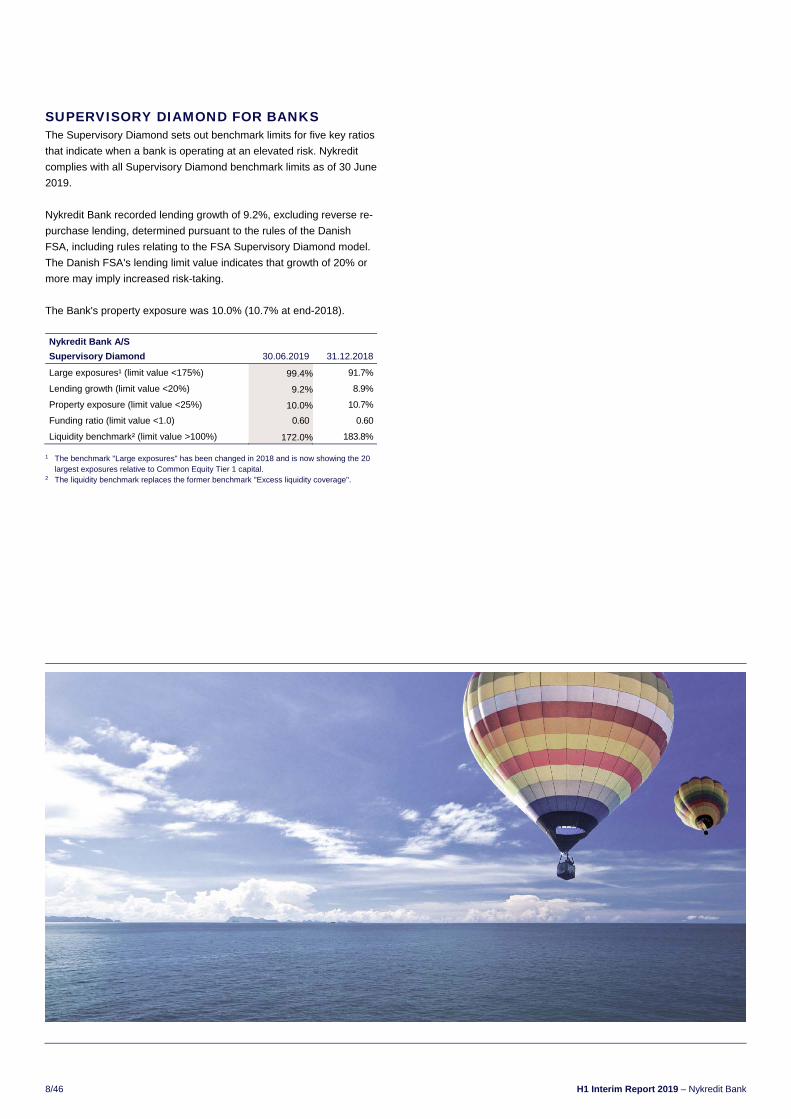
SUPERVISORY DIAMOND FOR BANKS The Supervisory Diamond sets out benchmark limits for five key ratios
that indicate when a bank is operating at an elevated risk. Nykredit
complies with all Supervisory Diamond benchmark limits as of 30 June
2019.
Nykredit Bank recorded lending growth of 9.2%, excluding reverse re-
purchase lending, determined pursuant to the rules of the Danish
FSA, including rules relating to the FSA Supervisory Diamond model.
The Danish FSA's lending limit value indicates that growth of 20% or
more may imply increased risk-taking.
The Bank's property exposure was 10.0% (10.7% at end-2018).
Nykredit Bank A/S
Supervisory Diamond 30.06.2019 31.12.2018
Large exposures¹ (limit value <175%) 99.4% 91.7%
Lending growth (limit value <20%) 9.2% 8.9%
Property exposure (limit value <25%) 10.0% 10.7%
Funding ratio (limit value <1.0) 0.60 0.60
Liquidity benchmark² (limit value >100%) 172.0% 183.8%
1 The benchmark "Large exposures" has been changed in 2018 and is now showing the 20 largest exposures relative to Common Equity Tier 1 capital.
2 The liquidity benchmark replaces the former benchmark "Excess liquidity coverage".

Nykredit Bank – H1 Interim Report 2019 9/46
Earnings impact
Impairment charges for loans and advances were a charge of DKK 97
in H1/2019 (H1/2018: DKK 129 million). Of the total impairment
charges, impairment charges for loans and advances etc represented
DKK 124 million (end-2018: DKK 322 million), while recoveries on
loans and advances previously written off were DKK 27 million (end-
2018: DKK 48 million).
DKK million
Nykredit Bank Group
Provisions for loan impairment and guarantees 30.06.2019 31.12.2018
Impairment provisions, beginning of period 2,779 2,800
Impairment provisions and reversals (21) (21)
Impairment provisions, end of period 2,758 2,779
- of which impairment provisions for loans
and advances etc 2,741 2,767
- of which impairment provisions for loans
and advances to banks 17 12
117 120
Provisions for guarantees and loan
commitments
Provisions, beginning of period
Provisions, end of period 132 117
Total provisions 2,890 2,896
Earnings impact
New impairment provisions and write-offs
for the period, net 109 325
Recoveries on loans and advances
previously written off 27 48
Total 82 277
Provisions for guarantees and loan
commitments 15 (3)
Total earnings impact 97 274
Total provisions
Total provisions reduced to DKK 2,890 million at 30 June 2019 from
DKK 2,896 million at end-2018.
In addition, value adjustment of interest rate swaps of DKK 3.3 billion
was recorded, of which credit value adjustments amounted to DKK 2.9
billion, comprising DKK 2.3 billion relating to legacy derivatives and
DKK 0.6 billion relating to other items.
Provisions for guarantees amounted to DKK 132 million (117 million at
end-2018).
Relative to total loans, advances and guarantees, provisions
amounted to 2.0% (2.3% at end-2018).
IMPAIRMENT AND LENDING

10/46 H1 Interim Report 2019 – Nykredit Bank
Loans, advances and guarantees by sector
The carrying amount of Group loans, advances and guarantees was
DKK 141.1 billion (DKK 120.5 billion at end-2018), corresponding to a
rise of DKK 20.6 billion.
This figure comprised a rise in reverse repurchase lending of DKK
11.7 billion, a rise in other loans and advances of DKK 3.0 billion and
a rise in guarantees of DKK 5.9 billion. Reverse repurchase lending
totalled DKK 49.1 billion (DKK 37.4 billion at end-2018).
Finance and insurance remained the largest single sector exposure at
DKK 53.4 billion (DKK 41.9 billion at end-2018). The exposure widely
comprised reverse repurchase lending with bonds serving as security.
Finance and insurance accounted for 38.8% (34.8% at end-2018) and
personal customers 20.5% (22.5% at end-2018).
At 30 June 2019, loan impairment provisions for the real estate sector
totalled DKK 0.6 billion (DKK 0.5 billion at end-2018), or 4.0% of total
loans and advances to the sector (3.4% at end-2018).
Nykredit Bank Group
Credit exposures in terms of bank lending, reverse repurchase lending and guarantees by sector¹ DKK million
30.06.2019 31.12.2018
Lending,
end of period
Total
impairment
provisions
Earnings
impact
Lending,
year end²
Total
impairment
provisions
Earnings
impact
Public sector 818 1 (1) 639 3 (1)
Agriculture, hunting, forestry and fishing 3,735 147 6 3,332 125 1
Manufacturing, mining and quarrying 9,321 284 (2) 7,482 272 56
Energy supply 1,793 22 4 1,372 18 (16)
Construction 3,235 163 (4) 2,620 171 15
Trade 6,979 533 68 5,882 334 129
Transport, accommodation and food service activities 6,501 95 14 6,296 62 (38)
Information and communication 3,366 72 13 3,291 45 16
Finance and insurance 54,691 135 (18) 41,924 243 155
Real estate 13,307 556 18 13,328 475 (197)
Other 8,406 278 13 7,215 447 157
Total business customers 111,335 2,285 112 92,742 2,192 279
Personal customers 28,969 586 (18) 27,140 689 (14)
Total 141,122 2,873 93 120,520 2,884 265
- of which provisions for losses under guarantees 132 15 117 (3)
Impairment provisions for credit institutions 17 4 12 9
- of which intercompany guarantees and total 21,767 2,890 97 16,614 2,896 274
¹ As the breakdown is based on public sector statistics, it is not directly comparable with the Bank's business areas. ² Comparative figures for 2018 have been restated, and certain loans, advances and guarantees of personal customers have been reclassified from personal customers to industry groups under
business customers in order to achieve a better presentation of the connection between loans and advances and the credit risk profile. Total loans, advances and guarantees are unchanged.

Nykredit Bank – H1 Interim Report 2019 11/46
In the opinion of Management, the Management Commentary should
be based on the internal management and business division reporting,
which also forms part of Nykredit's financial governance. Readers of
the financial reports are thus provided with information that is relevant
to their assessment of Nykredit's financial performance.
The income statement format of the financial highlights on page 3 and
the business areas (note 3) reflects the internal management report-
ing.
In certain respects, the presentation of the financial highlights differs
from the format of the Financial Statements prepared under the Inter-
national Financial Reporting Standards (IFRS). No correcting entries
have been made, implying that the profit for the period is the same in
the financial highlights and in the IFRS-based Financial Statements.
The reclassification in note 4 shows the reconciliation between the
presentation in the financial highlights table of the Management Com-
mentary and the presentation in the Consolidated Financial State-
ments prepared according to the IFRS and includes:
"Net interest income" comprising interest income from bank lending
and deposits. The corresponding item in the income statement (page
13) includes all interest.
"Net fee income" comprising income from bank lending, service fees,
provision of guarantees and leasing business etc.
"Wealth management income" comprising asset management and ad-
ministration fees etc. This item pertains to business with customers
performed through the Group's entities Nykredit Markets, Nykredit As-
set Management and Nykredit Portefølje Administration A/S but where
income is ascribed to the business divisions serving the customers.
"Net interest from capitalisation" comprising the risk-free interest at-
tributable to equity and net interest from subordinated debt.
"Trading, investment portfolio and other income" comprising income
from swaps and derivatives transactions currently offered, Nykredit
Markets activities, repo deposits and lending, debt capital markets ac-
tivities as well as other income and expenses not allocated to the
business divisions.
Supplementary financial ratios etc
In relation to the internal presentation of income, a number of supple-
mentary financial ratios are included in the Management Commentary.
Profit (loss) for the period as % pa of average equity. Average equity
is calculated on the basis of the value at the beginning of the period
and at the end of all quarters of the period.
Costs as % of income is calculated as the ratio of "Costs" to "Income".
Impairment charges for the period, %. Impairment charges are calcu-
lated based on impairment charges for loans and advances relative to
loans and advances.
ALTERNATIVE PERFORMANCE MEASURES
12/46 H1 Interim Report 2019 – Nykredit Bank
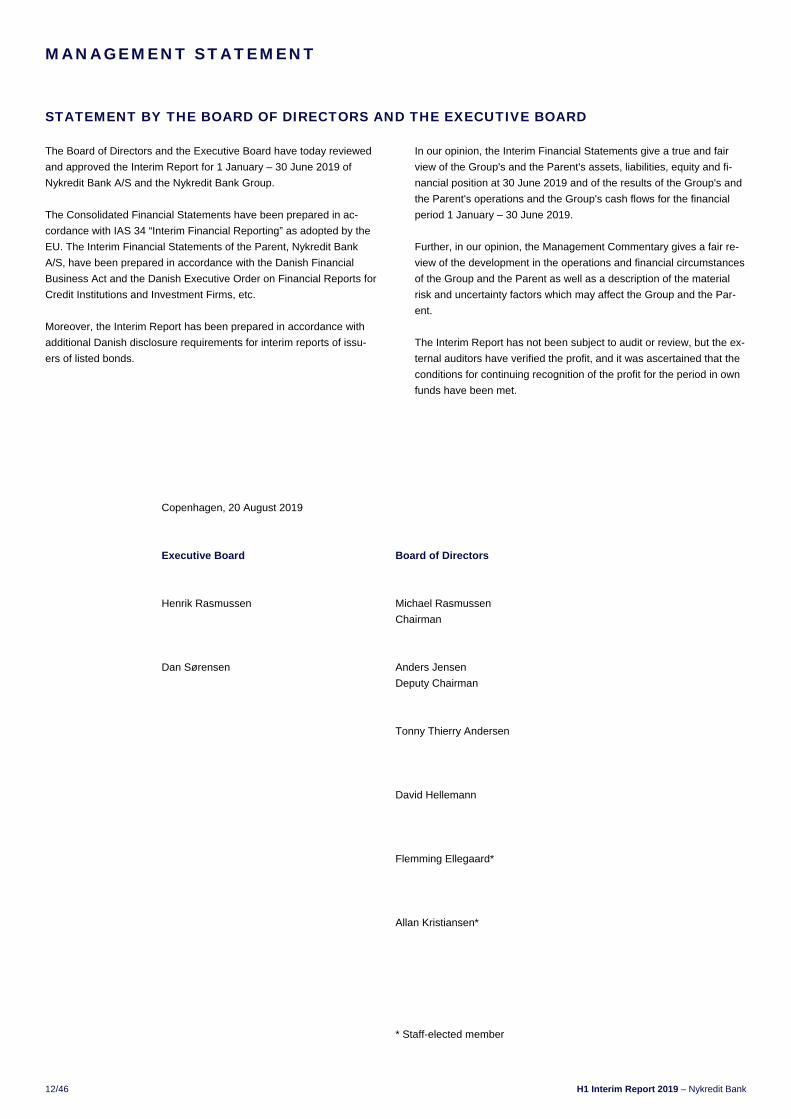
STATEMENT BY THE BOARD OF DIRECTORS AND THE EXECUTIVE BOARD
The Board of Directors and the Executive Board have today reviewed
and approved the Interim Report for 1 January – 30 June 2019 of
Nykredit Bank A/S and the Nykredit Bank Group.
The Consolidated Financial Statements have been prepared in ac-
cordance with IAS 34 “Interim Financial Reporting” as adopted by the
EU. The Interim Financial Statements of the Parent, Nykredit Bank
A/S, have been prepared in accordance with the Danish Financial
Business Act and the Danish Executive Order on Financial Reports for
Credit Institutions and Investment Firms, etc.
Moreover, the Interim Report has been prepared in accordance with
additional Danish disclosure requirements for interim reports of issu-
ers of listed bonds.
In our opinion, the Interim Financial Statements give a true and fair
view of the Group's and the Parent's assets, liabilities, equity and fi-
nancial position at 30 June 2019 and of the results of the Group's and
the Parent's operations and the Group's cash flows for the financial
period 1 January – 30 June 2019.
Further, in our opinion, the Management Commentary gives a fair re-
view of the development in the operations and financial circumstances
of the Group and the Parent as well as a description of the material
risk and uncertainty factors which may affect the Group and the Par-
ent.
The Interim Report has not been subject to audit or review, but the ex-
ternal auditors have verified the profit, and it was ascertained that the
conditions for continuing recognition of the profit for the period in own
funds have been met.
MANAGEMENT STATEMENT
Copenhagen, 20 August 2019
Executive Board
Board of Directors
Henrik Rasmussen
Michael Rasmussen
Chairman
Dan Sørensen
Anders Jensen
Deputy Chairman
Tonny Thierry Andersen
David Hellemann
Flemming Ellegaard*
Allan Kristiansen*
* Staff-elected member

Nykredit Bank – H1 Interim Report 2019 13/46
DKK million
Nykredit Bank Group
Note H1/2019 H1/2018 Q2/2019 Q2/2018
INCOME STATEMENT
Interest income based on the effective interest method 983 997 499 501
Other interest income (42) (48) (13) 4
Negative interest, income (111) (90) (62) (40)
Positive interest expenses (128) (130) (68) (59)
Interest expenses 151 160 74 85
Net interest income 6 807 829 418 439
Dividend on equities etc 6 5 4 3 2
Fee and commission income 1,085 1,014 548 523
Fee and commission expenses 196 173 94 91
Net interest and fee income 1,700 1,674 876 873
Value adjustments 6, 7 68 732 157 415
Other operating income 21 14 9 8
Staff and administrative expenses 1,036 976 522 485
Other operating expenses 12 12 6 6
Impairment charges for loans, advances and receivables etc 8 97 129 36 (9)
Profit from investments in associates and Group enterprises 10 3 1 1 1
Profit before tax 647 1,305 479 816
Tax 141 281 104 174
Profit for the period 506 1,025 375 642
Proposal for the distribution of profit
Statutory reserves - - - -
Retained earnings 506 1,025 375 642
Profit for the period 506 1,025 375 642
COMPREHENSIVE INCOME
Profit for the period 506 1,025 375 642
Other comprehensive income - - - -
Comprehensive income for the period 506 1,025 375 642
STATEMENTS OF INCOME AND COMPREHENSIVE INCOME
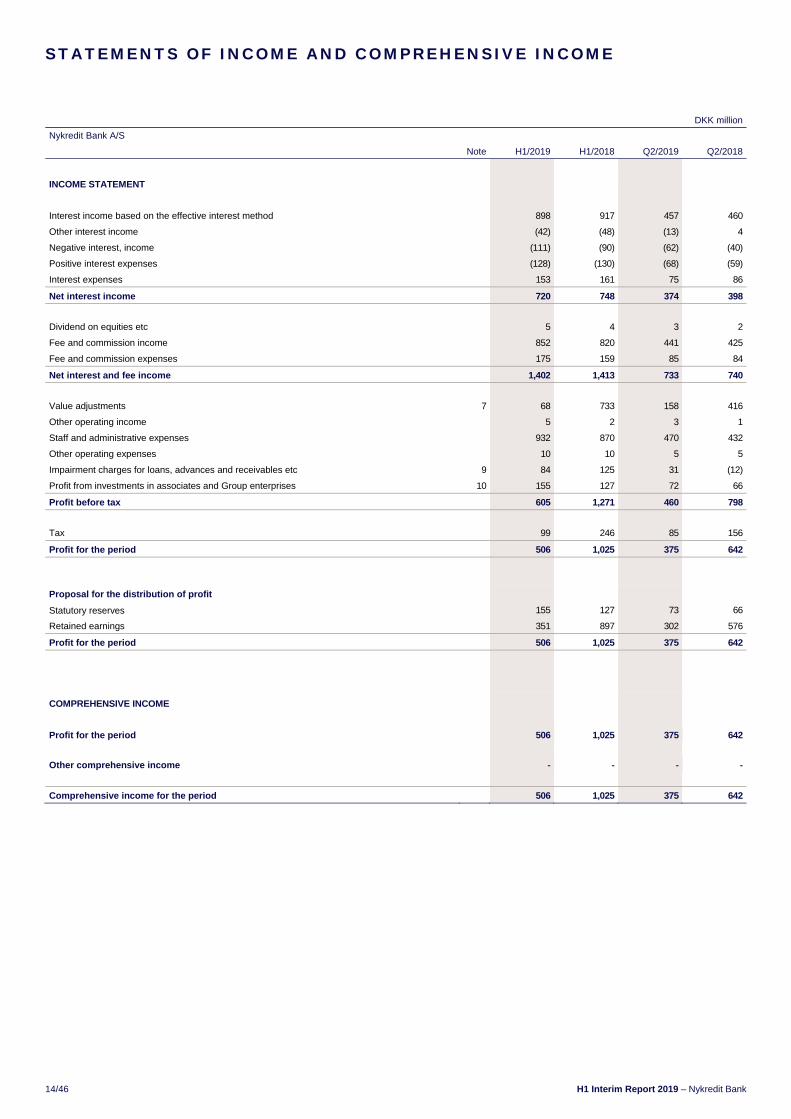
14/46 H1 Interim Report 2019 – Nykredit Bank
DKK million
Nykredit Bank A/S
Note H1/2019 H1/2018 Q2/2019 Q2/2018
INCOME STATEMENT
Interest income based on the effective interest method 898 917 457 460
Other interest income (42) (48) (13) 4
Negative interest, income (111) (90) (62) (40)
Positive interest expenses (128) (130) (68) (59)
Interest expenses 153 161 75 86
Net interest income 720 748 374 398
Dividend on equities etc 5 4 3 2
Fee and commission income 852 820 441 425
Fee and commission expenses 175 159 85 84
Net interest and fee income 1,402 1,413 733 740
Value adjustments 7 68 733 158 416
Other operating income 5 2 3 1
Staff and administrative expenses 932 870 470 432
Other operating expenses 10 10 5 5
Impairment charges for loans, advances and receivables etc 9 84 125 31 (12)
Profit from investments in associates and Group enterprises 10 155 127 72 66
Profit before tax 605 1,271 460 798
Tax 99 246 85 156
Profit for the period 506 1,025 375 642
Proposal for the distribution of profit
Statutory reserves 155 127 73 66
Retained earnings 351 897 302 576
Profit for the period 506 1,025 375 642
COMPREHENSIVE INCOME
Profit for the period 506 1,025 375 642
Other comprehensive income - - - -
Comprehensive income for the period 506 1,025 375 642
STATEMENTS OF INCOME AND COMPREHENSIVE INCOME

Nykredit Bank – H1 Interim Report 2019 15/46
DKK million
Nykredit Bank A/S Nykredit Bank Group
End-2018 H1/2019 Note H1/2019 End-2018
ASSETS
8,585 6,975 Cash balances and demand deposits with central banks 6,975 8,585
9,323 17,398 Receivables from credit institutions and central banks 17,399 9,324
96,699 111,292 Loans, advances and other receivables at amortised cost 11 112,655 97,993
41,926 41,497 Bonds at fair value 12 42,256 42,772
6,282 6,502 Bonds at amortised cost 6,502 6,282
233 282 Equities etc 284 234
8 11 Investments in associates 11 8
1,643 1,795 Investments in Group enterprises - -
14 14 Intangible assets 14 14
- - Other property, plant and equipment 0 0
17 54 Current tax assets 54 17
127 124 Deferred tax assets 124 127
2 (0) Assets in temporary possession - 2
21,664 28,219 Other assets 28,253 21,707
59 99 Prepayments 109 69
186,581 214,090 Total assets 214,634 187,135
BALANCE SHEETS

16/46 H1 Interim Report 2019 – Nykredit Bank
DKK million
Nykredit Bank A/S Nykredit Bank Group
End-2018 H1/2019 Note H1/2019 End-2018
LIABILITIES AND EQUITY
54,620 77,760 Payables to credit institutions and central banks 13 77,760 54,620
82,942 83,400 Deposits and other payables 14 83,304 82,864
5,411 5,511 Bonds in issue at amortised cost 15 5,511 5,411
7,618 9,411 Other non-derivative financial liabilities at fair value 16 9,411 7,618
- - Current tax liabilities 85 35
12,751 14,233 Other liabilities 14,647 13,191
6 14 Deferred income 19 10
163,347 190,330 Total payables 190,737 163,749
PROVISIONS
- - Provisions for deferred tax 136 151
117 132 Provisions for losses under guarantees 132 117
22 27 Other provisions 27 22
139 159 Total provisions 295 290
2,000 2,000 Subordinated debt 17 2,000 2,000
Equity
8,045 8,045 Share capital 8,045 8,045
Other reserves
1,181 1,336 - statutory reserves - -
11,869 12,220 - retained earnings 13,556 13,050
21,095 21,601 Total equity 21,601 21,095
186,581 214,090 Total liabilities and equity 214,634 187,135
OFF-BALANCE SHEET ITEMS
22,626 28,569 Contingent liabilities 28,470 22,527
8,724 9,411 Other commitments 9,636 8,924
31,350 37,980 Total 38,106 31,450
BALANCE SHEETS

Nykredit Bank – H1 Interim Report 2019 17/46
DKK million
Nykredit Bank Group
2019 Sha
re c
apita
l¹
Ret
aine
d ea
rnin
gs
Tot
al e
quity
Equity, 1 January 8,045 13,050 21,095
Profit for the period - 506 506
Total comprehensive income - 506 506
Total changes in equity - 506 506
Equity, 30 June 8,045 13,556 21,601
2018
Equity, end-2017, see the Annual Report 8,045 11,832 19,877
Changes in impairment charges owing to implementation of IFRS 9 - (566) (566)
Changes in taxes due owing to implementation of IFRS 9 - 125 125
Equity, 1 January 8,045 11,391 19,436
Profit for the period - 1,025 1,025
Total comprehensive income - 1,025 1,025
Total changes in equity - 1,025 1,025
Equity, 30 June 8,045 12,415 20,460
1 The share capital breaks down into 19 shares in multiples of DKK 1 million. The share capital is wholly owned by Nykredit Realkredit A/S, Copenhagen, Denmark. Nykredit Bank is included in the Consolidated Financial Statements of this company and the Consolidated Financial Statements of the association Forenet Kredit, Kalvebod Brygge 1-3, Copenhagen, Denmark, which owns 78.9% of Nykredit Realkredit A/S. The Financial Statements (in Danish) of Forenet Kredit f.m.b.a. may be obtained from the association.
STATEMENT OF CHANGES IN EQUITY

18/46 H1 Interim Report 2019 – Nykredit Bank
DKK million
Nykredit Bank A/S
2019 Sha
re c
apita
l¹
Sta
tuto
ry r
eser
ves
Ret
aine
d ea
rnin
gs
Tot
al e
quity
Equity, 1 January 8,045 1,181 11,869 21,095
Profit for the period - 155 351 506
Total comprehensive income - 155 351 506
Total changes in equity - 155 351 506
Equity, 30 June 8,045 1,336 12,220 21,601
2018
Equity, end-2017, see the Annual Report 8,045 930 10,902 19,877
Changes in impairment charges owing to implementation of IFRS 9 - (566) (566)
Changes in taxes due owing to implementation of IFRS 9 - 125 125
Equity, 1 January 8,045 930 10,461 19,436
Profit for the period - 127 897 1,025
Total comprehensive income - 127 897 1,025
Total changes in equity - 127 897 1,025
Equity, 30 June 8,045 1,057 11,357 20,460
1 The share capital breaks down into 19 shares in multiples of DKK 1 million. The share capital is wholly owned by Nykredit Realkredit A/S, Copenhagen, Denmark. Nykredit Bank is included in the Consolidated Financial Statements of this company and the Consolidated Financial Statements of the association Forenet Kredit, Kalvebod Brygge 1-3, Copenhagen, Denmark, which owns 78.9% of Nykredit Realkredit A/S. The Financial Statements (in Danish) of Forenet Kredit f.m.b.a. may be obtained from the association.
STATEMENT OF CHANGES IN EQUITY

Nykredit Bank – H1 Interim Report 2019 19/46
DKK million
Nykredit Bank Group
H1/2019 H1/2018
PROFIT FOR THE PERIOD 506 1,025
Adjustments
Interest income, net (807) (829)
Amortisation and impairment charges for intangible assets - 0
Other non-cash changes (4) 4
Impairment charges for loans, advances and receivables etc 124 156
Tax on profit for the period 141 281
Total (40) 636
Change in operating capital
Loans, advances and other receivables (14,762) (6,903)
Deposits and other payables (313) 7,583
Payables to credit institutions and central banks 23,695 1,987
Bonds (924) (1,443)
Equities etc (53) 16
Other operating capital (3,298) (8,342)
Total 4,305 (6,465)
Interest income received 909 1,822
Interest expenses paid (107) (961)
Corporation tax paid, net (148) (181)
Cash flows from the above operating activities 4,959 (5,785)
Cash flows from financing activities
Bonds in issue 104 (1,719)
Total 104 (1,719)
Total cash flows for the period 5,063 (7,504)
Cash and cash equivalents, beginning of period: 17,909 19,991
Foreign currency translation adjustment of cash 1,413 237
Total cash flows for the period 5,063 (7,504)
Cash and cash equivalents, end of period 24,385 12,724
Cash and cash equivalents, end of period:
Cash balances and demand deposits with central banks 6,975 4,950
Receivables from credit institutions and central banks 17,410 7,774
Total 24,385 12,724
CASH FLOW STATEMENT
20/46 H1 Interim Report 2019 – Nykredit Bank
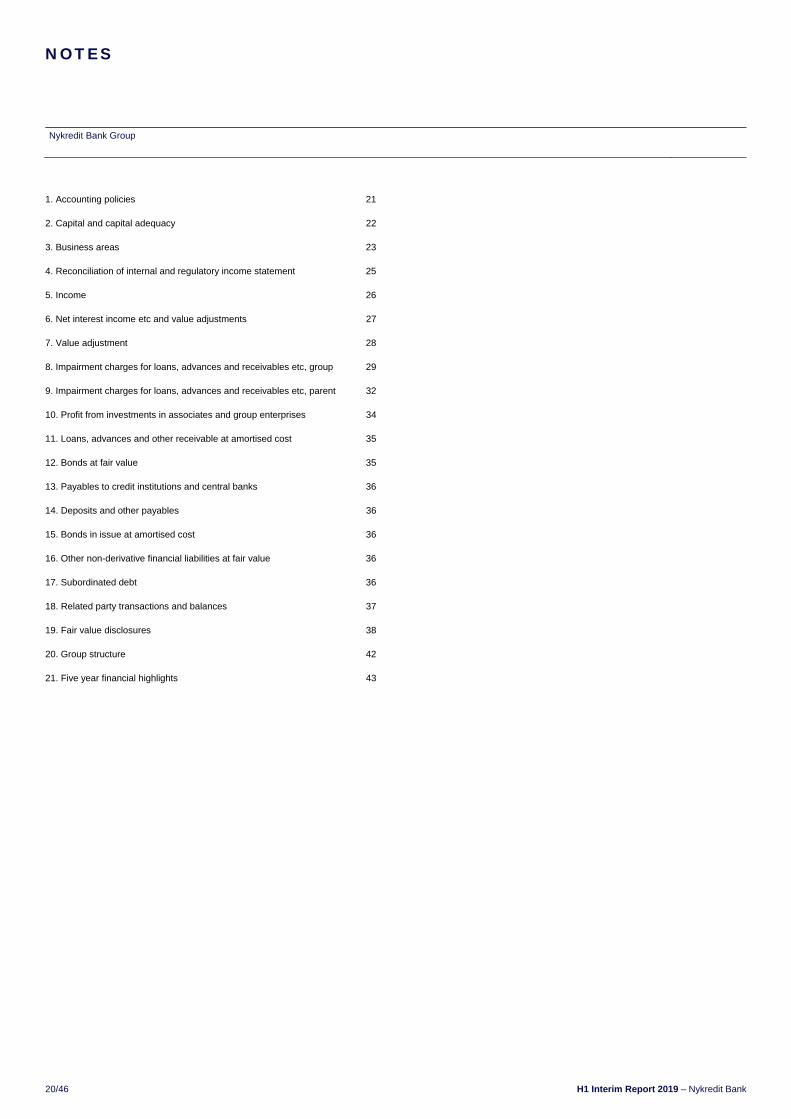
1. Accounting policies 21 2. Capital and capital adequacy 22 3. Business areas 23 4. Reconciliation of internal and regulatory income statement 25 5. Income 26 6. Net interest income etc and value adjustments 27 7. Value adjustment 28 8. Impairment charges for loans, advances and receivables etc, group 29 9. Impairment charges for loans, advances and receivables etc, parent 32 10. Profit from investments in associates and group enterprises 34 11. Loans, advances and other receivable at amortised cost 35 12. Bonds at fair value 35 13. Payables to credit institutions and central banks 36 14. Deposits and other payables 36 15. Bonds in issue at amortised cost 36 16. Other non-derivative financial liabilities at fair value 36 17. Subordinated debt 36 18. Related party transactions and balances 37 19. Fair value disclosures 38 20. Group structure 42 21. Five year financial highlights 43
NOTES
Nykredit Bank Group

Nykredit Bank – H1 Interim Report 2019 21/46
1. ACCOUNTING POLICIES
GENERAL
The Consolidated Financial Statements for H1/2019 have been prepared in ac-
cordance with IAS 34 "Interim Financial Reporting" as adopted by the EU and
further Danish financial reporting and disclosure requirements for interim re-
ports. Compliance with IAS 34 implies observance of the principles of recogni-
tion and measurement of the IFRS but also a less detailed presentation relative
to the Annual Report.
The Parent Interim Financial Statements for H1/2019 have been prepared in ac-
cordance with the Executive Order on Financial Reports for Credit Institutions
and Investment Firms, etc. (the Danish Executive Order on Financial Reports)
issued by the Danish Financial Supervisory Authority (FSA).
Following standards etc are implemented in H1/2019 without any impact on the
accounting policies:
IFRS 16 "Leases"
annual improvements to IFRS 2015-2017
The accounting policies of Nykredit Bank A/S and the Nykredit Bank Group are
thus unchanged compared with the Annual Report 2018 (note 1), and compared
with the information disclosed in the Annual Report 2018 no new reporting
standards or interpretations have been issued or approved, and no amendments
have been made to the Danish Executive Order on Financial Reports of the
Danish FSA which influence the H1 Interim Report 2019.
The accounting policies as well as a description of the Company's and the
Group's material risks appear from the Annual Report for 2018.
Presentation of business areas
Following an organisational adjustment, minor changes have been made to the
presentation of business areas (note 3) which do not affect results, comprehen-
sive income, balance sheet or equity.
All figures in the Annual Report are rounded to the nearest million Danish kroner
(DKK), unless otherwise specified. The totals stated are calculated on the basis
of actual figures prior to rounding. Due to the rounding-off to the nearest whole
million Danish kroner, the sum of individual figures and the stated totals may dif-
fer slightly.
Significant accounting estimates and assessments
The preparation of the Financial Statements involves the use of qualified ac-
counting estimates and assessments. These estimates and assessments are
made by the Bank’s Management in accordance with accounting policies and
based on past experience and an assessment of future conditions.
Accounting estimates are tested and assessed regularly. The estimates and as-
sessments applied are based on assumptions which Management considers
reasonable and realistic, but which are inherently uncertain and unpredictable.
Areas implying a high degree of assessment or complexity or areas in which as-
sumptions and estimates are material to the Financial Statements include provi-
sions for loan and receivable impairment as well as valuation of unlisted finan-
cial instruments, see the Annual Report 2018.
NOTES
Nykredit Bank Group

22/46 H1 Interim Report 2019 – Nykredit Bank
DKK million
Nykredit Bank A/S Nykredit Bank Group
End-2018 H1/2019 H1/2019 End-2018
2. CAPITAL AND CAPITAL ADEQUACY
21,095 21,601 Equity 21,601 21,095
(32) (26) Prudent valuation adjustment (26) (32)
(16) (15) Intangible assets excluding deferred tax liabilities (15) (16)
- - Provisions for expected credit losses in accordance with IRB approach - -
- - Other additions/deductions - -
- - Transitional adjustment of deductions - -
(47) (41) Common Equity Tier 1 capital deductions (41) (47)
21,048 21,561 Common Equity Tier 1 capital 21,561 21,048
- - Additional Tier 1 capital - -
- - Additional Tier 1 capital deductions - -
- - Total Additional Tier 1 capital after deductions - -
21,048 21,561 Tier 1 capital 21,561 21,048
2,000 2,000 Tier 2 capital 2,000 2,000
336 227 Tier 2 capital additions/deductions 227 336
23,384 23,787 Own funds 23,787 23,384
93,375 102,142 Credit risk 95,476 87,742
12,794 11,286 Market risk 11,286 12,794
6,899 7,180 Operational risk 8,143 7,765
113,067 120,608 Total risk exposure amount 114,904 108,300
Financial ratios
18.6 17.8 Common Equity Tier 1 capital ratio, % 18.7 19.4
18.6 17.8 Tier 1 capital ratio, % 18.7 19.4
20.6 19.7 Total capital ratio, % 20.7 21.5
Capital and capital adequacy have been determined in accordance with Capital Requirements Regulation (EU) No 575/2013 of the European Parliament and of the Coun-
cil of 26 June 2013 as well as the Danish transitional rules laid down by the Danish FSA.
Nykredit has been designated as a systemically important financial institution (SIFI) by the Danish authorities. As a result, a special SIFI CET1 capital buffer requirement
of 2% applies to the Nykredit Realkredit Group. To this should be added the permanent CET1 capital buffer requirement of 2.5% and the countercyclical buffer of 1%
which must also be met with Common Equity Tier 1 capital.
Nykredit has entered into a conditional agreement with the owners of Sparinvest to obtain 75% of the shares. On 9 July the Danish competition authorities approved
Nykredit's acquisition of Sparinvest and the authorities in Luxembourg (CSSF) announced on 14 August 2019 their approval of the acquisition of Sparinvest. It is expected
that the capital ratios of the Nykredit Realkredit Group and the Nykredit Bank Group are expected to fall by about 1.1 percentage points and about 1.9 percentage points,
respectively. The drop is primarily due to capital deductions as a result of goodwill related to the acquisition of Sparinvest.
NOTES

Nykredit Bank – H1 Interim Report 2019 23/46
DKK million
Nykredit Bank Group
3. BUSINESS AREAS
The business areas reflect Nykredit's organisation and internal reporting. In March 2019 the business areas were reorganised, now comprising Banking,
Totalkredit Partners and Wealth Management. Banking includes: Retail, which serves personal customers and SMEs (small and medium-sized enter-prises).
It also includes Corporates & Institutions, comprising activities with corporate and institutional clients, securities trading and derivatives trading. Wealth Man-
agement comprises wealth and asset management activities. Please refer to the Management Commentary.
The presentation is based on the segments used for the internal management reporting.
Results
H1/2019 Per
sona
l Ban
king
Bus
ines
s B
anki
ng
To
tal R
etai
l
Cor
pora
tes
& In
stitu
tions
Ba
nki
ng
Wea
lth
Man
agem
ent
Gro
up
Ite
ms
To
tal
Results by business area
Net interest income 162 312 474 237 711 27 4 742
Net fee income 76 81 157 111 267 8 (9) 267
Wealth management income 166 74 241 51 291 422 5 719
Net interest from capitalisation (10) (24) (33) (27) (61) (4) 50 (15)
Trading, investment portfolio and other income 27 31 58 197 255 25 69 349
Income 422 473 896 569 1,464 478 119 2,062
Costs 360 209 569 234 803 225 21 1,048
Business profit before impairment charges 62 265 327 335 662 254 98 1,014
Impairment charges for loans and advances 7 116 123 (28) 94 (5) 8 97
Business profit 55 149 204 363 568 259 91 917
Legacy derivatives (4) (162) (166) (103) (269) (0) - (269)
Profit (loss) before tax 52 (13) 38 260 298 259 91 647
BALANCE SHEET
Assets
Reverse repurchase lending at amortised cost - - - - - - 49,147 49,147
Loans and advances at amortised cos 11,953 22,565 34,519 25,040 59,558 4,239 (290) 63,508
Assets by business area 11,953 22,565 34,519 25,040 59,558 4,239 48,857 112,655
Unallocated assets 101,979
Total assets 214,634
Liabilities and equity
Repo deposit at amortised cost 3,216 3,216
Deposits and other payables at amortised cost 33,185 19,406 52,591 8,585 61,176 16,598 2,314 80,088
Liabilities by business area 33,185 19,406 52,591 8,585 61,176 16,598 5,530 83,304
Unallocated liabilities 109,728
Equity 21,601
Total liabilities and equity 214,634
NOTES

24/46 H1 Interim Report 2019 – Nykredit Bank
DKK million
Nykredit Bank Group
3. BUSINESS AREAS
Results
H1/2018 Per
sona
l Ban
king
Bus
ines
s B
anki
ng
To
tal R
etai
l
Cor
pora
tes
& In
stitu
tions
Ba
nki
ng
Wea
lth
Man
agem
ent
Gro
up
Ite
ms
To
tal
Results by business area
Net interest income 207 301 508 220 727 26 (2) 752
Net fee income 87 80 167 112 279 6 (12) 273
Wealth management income 177 72 249 63 312 350 8 670
Net interest from capitalisation (10) (21) (30) (26) (56) (3) 44 (15)
Trading, investment portfolio and other income 44 187 232 271 502 18 3 523
Income 506 619 1,125 640 1,765 396 41 2,202
Costs 348 180 527 226 754 220 15 988
Business profit before impairment charges 158 440 598 414 1,011 177 27 1,215
Impairment charges for loans and advances 66 33 99 (0) 98 22 9 129
Business profit 92 407 499 414 913 155 18 1,086
Legacy derivatives 0 156 157 63 220 (0) - 219
Profit (loss) before tax 92 563 655 477 1,132 155 18 1,305
BALANCE SHEET
Assets
Reverse repurchase lending at amortised cost - - - - - - 31,192 31,192
Loans and advances at amortised cos 11,666 20,433 32,099 22,206 54,304 3,539 501 58,344
Assets by business area 11,666 20,433 32,099 22,206 54,304 3,539 31,693 89,536
Unallocated assets 84,554
Total assets 174,090
Liabilities and equity
Repo deposit at amortised cost 11,851 11,851
Deposits and other payables at amortised cost 29,404 17,797 47,201 10,167 57,368 12,060 3,014 72,442
Liabilities by business area 29,404 17,797 47,201 10,167 57,368 12,060 14,865 84,293
Unallocated liabilities 69,337
Equity 20,460
Total liabilities and equity 174,090
Comparative figures for 2018 have been adjusted to reflect the new organisation effective from 21 March 2019.
NOTES

Nykredit Bank – H1 Interim Report 2019 25/46
DKK million
Nykredit Bank Group
4. RECONCILIATION OF INTERNAL AND REGULATORY INCOME STATEMENT H1/2019 H1/2018
Ear
ning
s pr
esen
tatio
n in
Man
agem
ent
Com
men
tary
Rec
lass
ifica
tion
Inco
me
stat
emen
t
Ear
ning
s pr
esen
tatio
n in
Man
agem
ent
Com
men
tary
Rec
lass
ifica
tion
Inco
me
stat
emen
t
Net interest income 742 65 807 752 77 829
Dividend on equities etc 5 5 4 4
Fee and commission income, net 267 621 888 273 568 841
Net interest and fee income 691 1,700 650 1,674
Wealth management income 719 (719) - 670 (670) -
Net interest from capitalisation (15) 15 - (15) 15 -
Trading, investment portfolio and other income 349 (349) - 523 (523) -
Value adjustments 68 68 732 732
Other operating income 21 21 14 14
Total income 2,062 2,203
Costs 1,048 - 1,048 988 - 988
Business profit before impairment charges 1,014 1,215
Impairment charges for loans and advances etc 97 - 97 129 - 129
Profit from investments in associates 3 3 1 1
Business profit 917 1,086
Legacy derivatives (269) 269 - 219 (219) -
Profit before tax 647 - 647 1,305 - 1,305
Note 4 combines the earnings presentation in the Management Commentary (internal presentation), including the financial highlights and presentation of business areas, and the formal income statement of the Financial Statements.
The most important difference is that all income is recognised in two main items in the internal presentation: "Income", including sub-items, and "Legacy derivatives". The sum of these two items thus corresponds to "Net interest and fee income", "Value adjustments", "Other operating income" and "Profit from investments in associates and Group enterprises" in the income statement of the Financial Statements. The column "Reclassification" thus comprises only differences between the internal presentation and the income statement with respect to these items.
"Costs" in the internal presentation corresponds to total costs recognised in the Financial Statements: "Staff and administrative expenses", "Depreciation, amortisation and impairment charges for property, plant and equipment as well as intangible assets" and "Other operating expenses".
"Impairment charges for loans and advances etc" corresponds to the presentation in the income statement.
The internal presentation is based on the same recognition and measurement principles as the IFRS-based Financial Statements. Thus, "profit before tax" is unchanged
.
NOTES
26/46 H1 Interim Report 2019 – Nykredit Bank
DKK million
Nykredit Bank Group
H1/2019 H1/2018
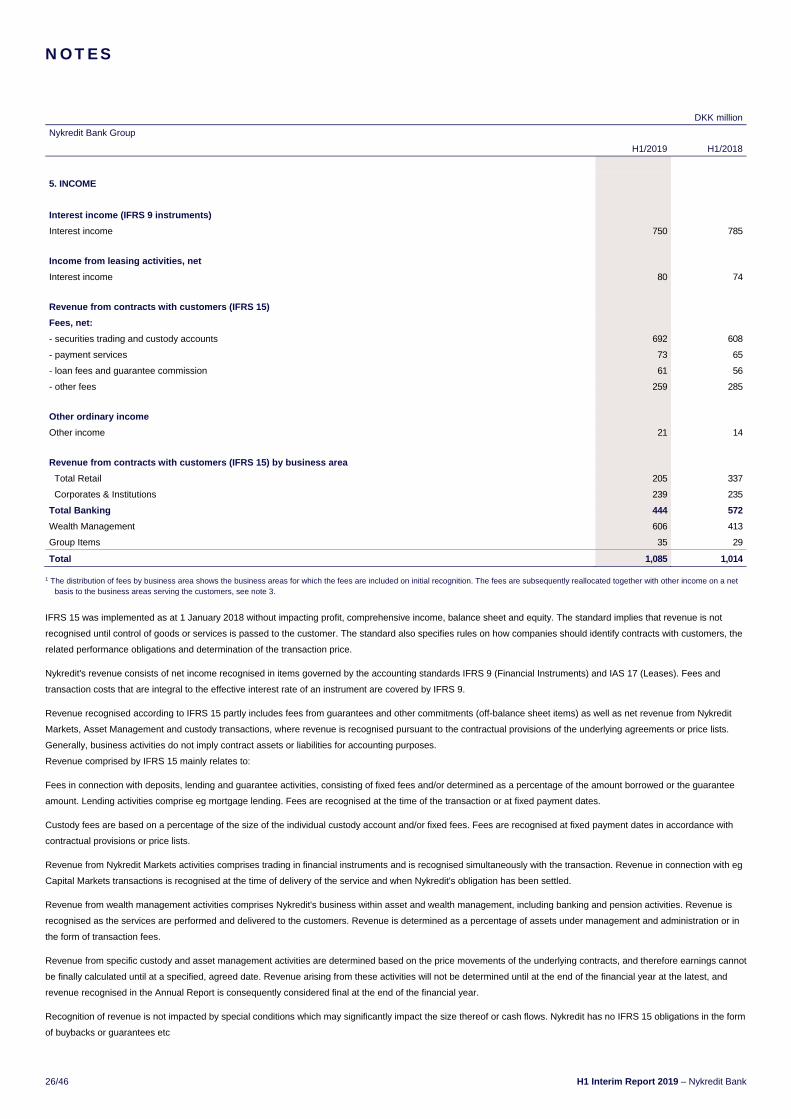
5. INCOME
Interest income (IFRS 9 instruments)
Interest income 750 785
Income from leasing activities, net
Interest income 80 74
Revenue from contracts with customers (IFRS 15)
Fees, net:
- securities trading and custody accounts 692 608
- payment services 73 65
- loan fees and guarantee commission 61 56
- other fees 259 285
Other ordinary income
Other income 21 14
Revenue from contracts with customers (IFRS 15) by business area
Total Retail 205 337
Corporates & Institutions 239 235
Total Banking 444 572
Wealth Management 606 413
Group Items 35 29
Total 1,085 1,014
1 The distribution of fees by business area shows the business areas for which the fees are included on initial recognition. The fees are subsequently reallocated together with other income on a net basis to the business areas serving the customers, see note 3.
IFRS 15 was implemented as at 1 January 2018 without impacting profit, comprehensive income, balance sheet and equity. The standard implies that revenue is not
recognised until control of goods or services is passed to the customer. The standard also specifies rules on how companies should identify contracts with customers, the
related performance obligations and determination of the transaction price.
Nykredit's revenue consists of net income recognised in items governed by the accounting standards IFRS 9 (Financial Instruments) and IAS 17 (Leases). Fees and
transaction costs that are integral to the effective interest rate of an instrument are covered by IFRS 9.
Revenue recognised according to IFRS 15 partly includes fees from guarantees and other commitments (off-balance sheet items) as well as net revenue from Nykredit
Markets, Asset Management and custody transactions, where revenue is recognised pursuant to the contractual provisions of the underlying agreements or price lists.
Generally, business activities do not imply contract assets or liabilities for accounting purposes.
Revenue comprised by IFRS 15 mainly relates to:
Fees in connection with deposits, lending and guarantee activities, consisting of fixed fees and/or determined as a percentage of the amount borrowed or the guarantee
amount. Lending activities comprise eg mortgage lending. Fees are recognised at the time of the transaction or at fixed payment dates.
Custody fees are based on a percentage of the size of the individual custody account and/or fixed fees. Fees are recognised at fixed payment dates in accordance with
contractual provisions or price lists.
Revenue from Nykredit Markets activities comprises trading in financial instruments and is recognised simultaneously with the transaction. Revenue in connection with eg
Capital Markets transactions is recognised at the time of delivery of the service and when Nykredit's obligation has been settled.
Revenue from wealth management activities comprises Nykredit's business within asset and wealth management, including banking and pension activities. Revenue is
recognised as the services are performed and delivered to the customers. Revenue is determined as a percentage of assets under management and administration or in
the form of transaction fees.
Revenue from specific custody and asset management activities are determined based on the price movements of the underlying contracts, and therefore earnings cannot
be finally calculated until at a specified, agreed date. Revenue arising from these activities will not be determined until at the end of the financial year at the latest, and
revenue recognised in the Annual Report is consequently considered final at the end of the financial year.
Recognition of revenue is not impacted by special conditions which may significantly impact the size thereof or cash flows. Nykredit has no IFRS 15 obligations in the form
of buybacks or guarantees etc
NOTES

Nykredit Bank – H1 Interim Report 2019 27/46
DKK million
Nykredit Bank Group
6. NET INTEREST INCOME ETC AND VALUE ADJUSTMENTS
H1/2019 Interest income
Interest expenses
Net interest income
Dividend on equities
Value adjustments Total
Financial portfolios at amortised cost
Receivables from and payables to credit institutions and central banks 7 (24) 31 - - 31
Lending and deposits 968 (22) 989 - 4 993
Repo transactions and reverse repurchase lending (97) - (97) - - (97)
Bonds in issue at amortised cost - 7 (7) - - (7)
Subordinated debt - 20 (20) - - (20)
Other financial instruments 1 42 (42) - - (42)
Total 878 23 855 - 4 858
Financial portfolios at fair value and financial instruments at fair value
Bonds 58 - 58 - 103 162
Equities etc - - - 5 33 38
Derivative financial instruments etc (106) - (106) - (107) (213)
Total (48) - (48) 5 29 (14)
Foreign currency translation adjustment 36 36
Net interest income etc and value adjustments 830 23 807 5 68 880
H1/2018
Financial portfolios at amortised cost
Receivables from and payables to credit institutions and central banks 3 9 (6) - - (6)
Lending and deposits 987 (16) 1,003 - 7 1,010
Repo transactions and reverse repurchase lending (81) (57) (24) - - (24)
Bonds in issue at amortised cost - 37 (37) - - (37)
Subordinated debt - 20 (20) - - (20)
Other financial instruments 1 38 (37) - - (37)
Total 910 30 880 - 7 887
Financial portfolios at fair value and financial instruments at fair value
Bonds 43 - 43 - 10 53
Equities etc - - - 4 17 22
Derivative financial instruments etc (95) - (95) - 650 555
Total (51) - (51) 4 677 630
Foreign currency translation adjustment 48 48
Net interest income etc and value adjustments 859 30 829 4 732 1,565
NOTES

28/46 H1 Interim Report 2019 – Nykredit Bank
DKK million
Nykredit Bank A/S Nykredit Bank Group
H1/2018 H1/2019 H1/2019 H1/2018
7. VALUE ADJUSTMENT
Assets measured at fair value through profit or loss
7 4 Other loans, advances and receivables at fair value 4 7
11 104 Bonds 103 10
17 33 Equities etc 33 17
48 36 Foreign exchange 36 48
644 (129) Foreign exchange, interest rate and other contracts as well as derivative financial instruments (130) 644
6 22 Other assets 22 6
733 68 Total 68 732
NOTES
Nykredit Bank – H1 Interim Report 2019 29/46
DKK million
Nykredit Bank Group
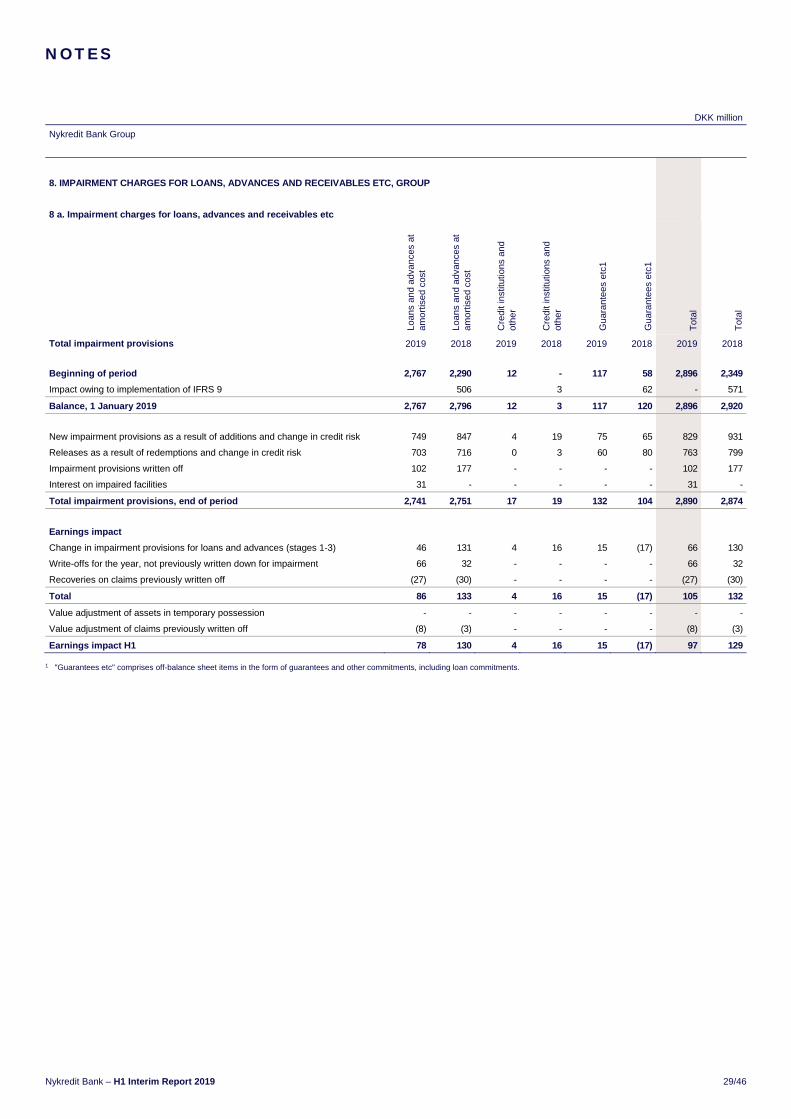
8. IMPAIRMENT CHARGES FOR LOANS, ADVANCES AND RECEIVABLES ETC, GROUP
8 a. Impairment charges for loans, advances and receivables etc
Loan
s an
d ad
vanc
es a
t am
ortis
ed c
ost
Loan
s an
d ad
vanc
es a
t am
ortis
ed c
ost
Cre
dit
inst
itutio
ns a
nd
othe
r
Cre
dit
inst
itutio
ns a
nd
othe
r
Gua
rant
ees
etc1
Gua
rant
ees
etc1
Tot
al
Tot
al
Total impairment provisions 2019 2018 2019 2018 2019 2018 2019 2018
Beginning of period 2,767 2,290 12 - 117 58 2,896 2,349
Impact owing to implementation of IFRS 9 506 3 62 - 571
Balance, 1 January 2019 2,767 2,796 12 3 117 120 2,896 2,920
New impairment provisions as a result of additions and change in credit risk 749 847 4 19 75 65 829 931
Releases as a result of redemptions and change in credit risk 703 716 0 3 60 80 763 799
Impairment provisions written off 102 177 - - - - 102 177
Interest on impaired facilities 31 - - - - - 31 -
Total impairment provisions, end of period 2,741 2,751 17 19 132 104 2,890 2,874
Earnings impact
Change in impairment provisions for loans and advances (stages 1-3) 46 131 4 16 15 (17) 66 130
Write-offs for the year, not previously written down for impairment 66 32 - - - - 66 32
Recoveries on claims previously written off (27) (30) - - - - (27) (30)
Total 86 133 4 16 15 (17) 105 132
Value adjustment of assets in temporary possession - - - - - - - -
Value adjustment of claims previously written off (8) (3) - - - - (8) (3)
Earnings impact H1 78 130 4 16 15 (17) 97 129
1 "Guarantees etc" comprises off-balance sheet items in the form of guarantees and other commitments, including loan commitments.
NOTES

30/46 H1 Interim Report 2019 – Nykredit Bank
DKK million
Nykredit Bank Group
8. IMPAIRMENT CHARGES FOR LOANS, ADVANCES AND RECEIVABLES ETC, GROUP (CONTINUED)
8 b. 2019: Total impairment provisions by stage
loans, advances and receiva-
bles at amortised cost Guarantees
Stage 1 Stage 2 Stage 3 Stage 1 Stage 2 Stage 3 Total
Total, 1 January 2019 317 187 2,274 36 29 53 2,896
Transfer to stage 1 141 (119) (22) 21 (10) (11) (0)
Transfer to stage 2 (7) 77 (70) (3) 9 (6) 0
Transfer to stage 3 (1) (14) 15 (0) (1) 2 0
Impairment provisions for new loans and advances (additions) 69 23 48 8 5 3 157
Additions as a result of change in credit risk 98 121 394 6 26 26 671
Releases as a result of change in credit risk 247 86 370 30 12 18 763
Previously written down for impairment, now written off 0 0 102 - - - 102
Interest on impaired facilities - - 31 - - - 31
Total impairment provisions, end of period 371 189 2,198 38 45 49 2,890
Total 2,758 132 2,890
Impairment provisions, end of period, are moreover attributable to:
Credit institutions 17 - - 17
Earnings impact for H1/2019 (79) 58 72 (16) 19 12 66
8 b. 2018: Total impairment provisions by stage
loans, advances and receiva-
bles at amortised cost Guarantees
Stage 1 Stage 2 Stage 3 Stage 1 Stage 2 Stage 3 Total
Impairment provisions as at 1 January 2018 deter-mined according to IFRS 9 princi-
ples 463 177 2,160 36 25 59 2,920
Transfer to stage 1 8 (1) (7) 0 (0) - -
Transfer to stage 2 (70) 118 (48) (5) 5 (1) -
Transfer to stage 3 (7) (18) 26 (0) (0) 0 -
Impairment provisions for new loans and advances (additions) 67 13 54 4 1 1 140
Additions as a result of change in credit risk 147 115 468 27 19 13 789
Releases as a result of change in credit risk 252 194 273 23 23 34 799
Previously written down for impairment, now written off 0 - 177 - - - 177
Total impairment provisions, end of period 355 210 2,204 39 27 38 2,873
Total impairment provisions, end of period 2,768 105 2,873
Impairment provisions, end of period, are attributable to:
Credit institutions 19 - - 19
Earnings impact for H1/2018 (38) (66) 250 7 (3) (20) 130
The principles of impairment are described in detail in the accounting policies (note 1) of the Annual Report 2018.
Stage 1 covers loans and advances etc without significant increase in credit risk since initial recognition. For this category, impairment provisions are made corresponding
to the expected credit losses over a period of 12 months for lending etc at amortised cost. For loans and advances at fair value the initial impairment was calculated at
DKK 0.
Stage 2 covers loans and advances etc with significant increase in credit risk since initial recognition. For this category, impairment provisions are made corresponding to
the expected credit losses over the asset's maturity.
Stage 3 covers loans and advances etc that are credit impaired, and which have been subject to individual provisioning on the specific assumption that the customers will
default on their loans
NOTES

Nykredit Bank – H1 Interim Report 2019 31/46
DKK million
Nykredit Bank Group
8. IMPARMENT CHARGES FOR LOANS, ADVANCES AND RECEIVABLES ETC, GROUP (CONTINUED)
8 c. 2019: Distribution of provisions for loan impairment and guarantees etc, end of period
Stage 1 (12-month
expected credit losses)
Stage 2 (12-month
expected credit losses)
Stage 3 (12-month
expected credit losses) Total
Loans and advances at amortised cost etc, gross
Loans and advances at amortised cost etc, gross 110,104 2,283 3,006 115,394
Total impairment provisions, end of period 354 189 2,198 2,741
Loans and advances, carrying amount 109,750 2,094 808 112,652
Guarantees and loan commitments
Guarantees etc 47,152 666 155 47,973
Total impairment provisions, end of period 38 45 49 132
Guarantees and loan commitments, carrying amount 47,114 621 106 47,841
8 c. end-2018: Distribution of provisions for loan impairment and guarantees etc, end of period
Stage 1 (12-month
expected credit losses)
Stage 2 (12-month
expected credit losses)
Stage 3 (12-month
expected credit losses) Total
Loans and advances at amortised cost etc, gross
Loans and advances at amortised cost etc, gross 93,750 4,001 3,009 100,760
Total impairment provisions, end of period 305 187 2,274 2,766
Loans and advances, carrying amount 93,445 3,814 735 97,993
Guarantees and loan commitments
Guarantees etc 39,862 542 218 40,622
Total impairment provisions, end of period 36 29 53 118
Guarantees and loan commitments, carrying amount 39,826 513 165 40,504
NOTES

32/46 H1 Interim Report 2019 – Nykredit Bank
DKK million
Nykredit Bank A/S
9. IMPAIRMENT CHARGES FOR LOANS, ADVANCES AND RECEIVABLES ETC, PARENT
9 a. Impairment charges for loans, advances and receivables etc
Loan
s an
d ad
vanc
es a
t am
ortis
ed c
ost
Loan
s an
d ad
vanc
es a
t am
ortis
ed c
ost
Cre
dit
inst
itutio
ns a
nd
othe
r
Cre
dit
inst
itutio
ns a
nd
othe
r
Gua
rant
ees
etc1
Gua
rant
ees
etc1
Tot
al
Tot
al
Total impairment provisions 2019 2018 2019 2018 2019 2018 2019 2018
Beginning of period 2,670 2,214 12 - 117 58 2,799 2,272
Impact owing to implementation of IFRS 9 506 3 62 - 571
Balance, 1 January 2019 2,670 2,720 12 3 117 120 2,799 2,843
New impairment provisions as a result of additions and change in credit risk 718 815 4 19 75 63 797 897
Releases as a result of redemptions and change in credit risk 681 688 0 3 60 80 741 771
Impairment provisions written off 98 173 - - - - 98 173
Interest on impaired facilities 31 - - - - - 31 -
Total impairment provisions, end of period 2,639 2,674 17 19 132 103 2,788 2,796
Earnings impact
Change in impairment provisions for loans and advances (stages 1-3) 37 131 4 16 15 (17) 56 130
Write-offs for the year, not previously written down for impairment 55 31 - - - - 55 31
Recoveries on claims previously written off (19) (30) - - - - (19) (30)
Total 73 133 4 16 15 (17) 92 132
Value adjustment of assets in temporary possession - - - - - - - -
Value adjustment of claims previously written off (8) (3) - - - - (8) (3)
Earnings impact H1 65 130 4 16 15 (17) 84 129
NOTES

Nykredit Bank – H1 Interim Report 2019 33/46
DKK million
Nykredit Bank A/S
9. IMPAIRMENT CHARGES FOR LOANS, ADVANCES AND RECEIVABLES ETC, PARENT (CONTINUED)
9 b. 2019: Total impairment provisions by stage regarding loans and advances at fair value through profit or loss
loans, advances and receiva-
bles at amortised cost Guarantees
Stage 1 Stage 2 Stage 3 Stage 1 Stage 2 Stage 3 Total
Total, 1 January 2019 308 182 2,192 36 29 53 2,800
Transfer to stage 1 140 (119) (21) 21 (10) (11) 0
Transfer to stage 2 (7) 74 (67) (3) 9 (6) 0
Transfer to stage 3 (1) (14) 15 (0) (1) 2 (0)
Impairment provisions for new loans and advances (additions) 67 22 44 8 5 3 150
Additions as a result of change in credit risk 96 119 374 6 26 26 647
Releases as a result of change in credit risk 243 82 356 30 12 18 741
Previously written down for impairment, now written off - - 98 - - - 98
Interest on impaired facilities - - 31 - - - 31
Total impairment provisions 360 183 2,114 38 45 49 2,788
Total impairment provisions, end of period 2,656 132 2,788
Impairment provisions, end of period, are attributable to:
Credit institutions 17 - - 17
Earnings impact for H1/2019 (81) 59 63 (16) 19 12 56
9 b. 2018: Total impairment provisions by stage regarding loans and advances at fair value through profit or loss
loans, advances and receiva-
bles at amortised cost Guarantees
Stage 1 Stage 2 Stage 3 Stage 1 Stage 2 Stage 3 Total
Impairment provisions as at 1 January 2018 determined according to IFRS 9 princi-
ples 446 172 2,105 36 25 59 2,843
Transfer to stage 1 4 (4) - 0 (0) - -
Transfer to stage 2 (70) 118 (47) (5) 5 (1) -
Transfer to stage 3 (8) (18) 26 (0) (0) 0 -
Impairment provisions for new loans and advances (additions) 64 12 50 4 1 1 132
Additions as a result of change in credit risk 147 113 446 27 19 13 765
Releases as a result of change in credit risk 239 188 264 23 23 34 771
Previously written down for impairment, now written off - - 173 - - - 173
Total impairment provisions 344 205 2,143 39 27 38 2,795
Total impairment provisions, end of period 2,691 105 2,795
Impairment provisions, end of period, are attributable to:
Credit institutions 19 - - 19
Earnings impact for H1/2018 (27) (63) 232 7 (3) (20) 126
NOTES
34/46 H1 Interim Report 2019 – Nykredit Bank
DKK million
Nykredit Bank A/S Nykredit Bank Group
H1/2018 H1/2019 H1/2019 H1/2018
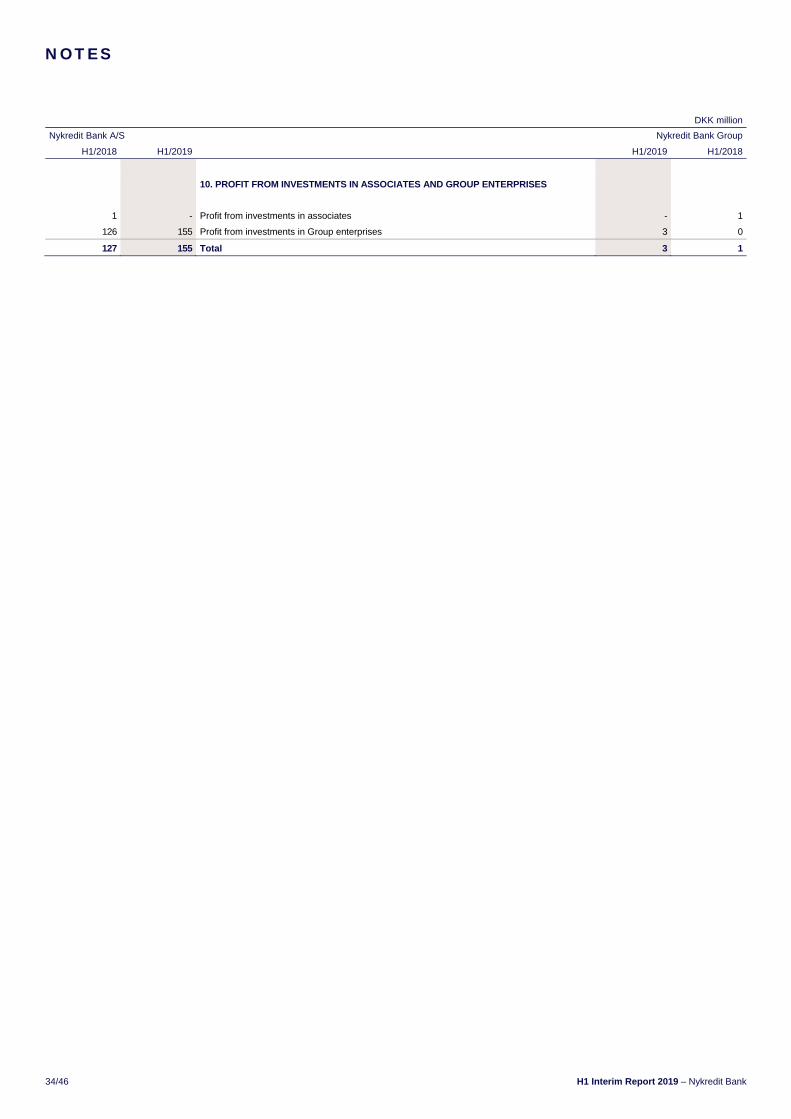
10. PROFIT FROM INVESTMENTS IN ASSOCIATES AND GROUP ENTERPRISES
1 - Profit from investments in associates - 1
126 155 Profit from investments in Group enterprises 3 0
127 155 Total 3 1
NOTES

Nykredit Bank – H1 Interim Report 2019 35/46
DKK million
Nykredit Bank A/S Nykredit Bank Group
End-2018 H1/2019 H1/2019 End-2018
11. LOANS, ADVANCES AND OTHER RECEIVABLE AT AMORTISED COST
61,943 64,785 Bank loans and advances 66,249 63,333
37,427 49,147 Reverse repurchase lending 49,147 37,427
99,370 113,929 Balance, end of period 115,394 100,760
Adjustment for credit risk
(2,671) (2,640) Impairment provisions (2,741) (2,767)
96,699 111,292 Balance after impairment, end of period 112,655 97,993
12. BONDS AT FAIR VALUE
38,382 38,079 Covered bonds 38,838 39,228
1,020 1,714 Government bonds 1,714 1,020
2,699 1,881 Other bonds etc 1,881 2,699
42,101 41,674 Total 42,433 42,947
175 177 Self-issued bonds offset against bonds in issue 177 175
41,926 41,497 Total 42,256 42,772
The effect of fair value adjustment is recognised in the income statement.
373 865 Of which redeemed bonds 869 377
15,993 15,518 Assets sold as part of genuine sale and repurchase transactions 15,518 15,993
NOTES
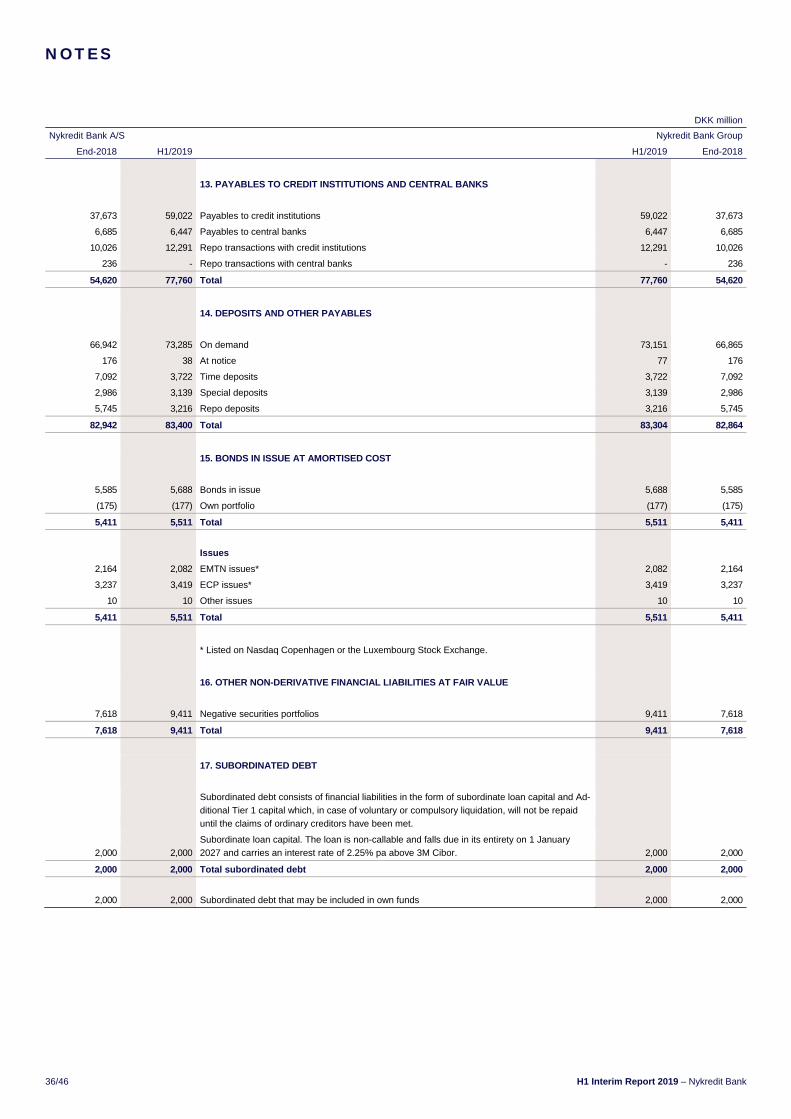
36/46 H1 Interim Report 2019 – Nykredit Bank
DKK million
Nykredit Bank A/S Nykredit Bank Group
End-2018 H1/2019 H1/2019 End-2018
13. PAYABLES TO CREDIT INSTITUTIONS AND CENTRAL BANKS
37,673 59,022 Payables to credit institutions 59,022 37,673
6,685 6,447 Payables to central banks 6,447 6,685
10,026 12,291 Repo transactions with credit institutions 12,291 10,026
236 - Repo transactions with central banks - 236
54,620 77,760 Total 77,760 54,620
14. DEPOSITS AND OTHER PAYABLES
66,942 73,285 On demand 73,151 66,865
176 38 At notice 77 176
7,092 3,722 Time deposits 3,722 7,092
2,986 3,139 Special deposits 3,139 2,986
5,745 3,216 Repo deposits 3,216 5,745
82,942 83,400 Total 83,304 82,864
15. BONDS IN ISSUE AT AMORTISED COST
5,585 5,688 Bonds in issue 5,688 5,585
(175) (177) Own portfolio (177) (175)
5,411 5,511 Total 5,511 5,411
Issues
2,164 2,082 EMTN issues* 2,082 2,164
3,237 3,419 ECP issues* 3,419 3,237
10 10 Other issues 10 10
5,411 5,511 Total 5,511 5,411
* Listed on Nasdaq Copenhagen or the Luxembourg Stock Exchange.
16. OTHER NON-DERIVATIVE FINANCIAL LIABILITIES AT FAIR VALUE
7,618 9,411 Negative securities portfolios 9,411 7,618
7,618 9,411 Total 9,411 7,618
17. SUBORDINATED DEBT
Subordinated debt consists of financial liabilities in the form of subordinate loan capital and Ad-
ditional Tier 1 capital which, in case of voluntary or compulsory liquidation, will not be repaid
until the claims of ordinary creditors have been met.
2,000 2,000
Subordinate loan capital. The loan is non-callable and falls due in its entirety on 1 January
2027 and carries an interest rate of 2.25% pa above 3M Cibor. 2,000 2,000
2,000 2,000 Total subordinated debt 2,000 2,000
2,000 2,000 Subordinated debt that may be included in own funds 2,000 2,000
NOTES

Nykredit Bank – H1 Interim Report 2019 37/46
18. RELATED PARTY TRANSACTIONS AND BALANCES
The Parent Nykredit Realkredit, its parent as well as Group enterprises and as-
sociates are regarded as related parties. In addition, Nykredit Bank's Group en-
terprises and associates as stated in the Group structure are included as well as
the Bank's Board of Directors, its Executive Board and related parties thereof.
No unusual related party transactions occurred in 2019 and 2018.
The companies have entered into various intercompany agreements as a natu-
ral part of the Group's day-to-day operations. The agreements typically involve
financing, provision of guarantees, insurance, sales commission, tasks relating
to IT support and IT development projects, payroll and staff administration as
well as other administrative tasks.
Intercompany trading in goods and services took place on an arm's length, cost
reimbursement or profit split basis.
Moreover, Nykredit Realkredit A/S contributed DKK 2.0 billion to Nykredit Bank
in the form of Tier 2 capital.
Agreements between Nykredit Realkredit A/S and Nykredit Bank A/S
Framework agreement on the terms for financial transactions relating to loans
and deposits in the securities and money market areas etc. Transactions in fi-
nancial instruments are covered by master netting agreements involving an on-
going exchange of collateral in the form of cash and bonds.
Agreements between Totalkredit A/S and Nykredit Bank A/S
Nykredit Bank may transfer secured homeowner loans to Totalkredit A/S. In
2018 and 2019 Nykredit Bank transferred secured homeowner loans to To-
talkredit A/S.
NOTES
Nykredit Bank Group

38/46 H1 Interim Report 2019 – Nykredit Bank
19. FAIR VALUE DISCLOSURES
Listed prices
The Group's assets and liabilities at fair value are to the widest extent possible
recognised at listed prices or prices quoted in an active market or authorised
market place.
Bonds at fair value are recognised at listed prices if external prices have been
updated within the past three trading days prior to the balance sheet date. If no
listed prices have been observed during this time span, the portfolio is recog-
nised at observable inputs.
Observable inputs
When an instrument is not traded in an active market, measurement is based on
the most recent listed price in an inactive market, the price of comparable trans-
actions or generally accepted valuation techniques based on, for instance, dis-
counted cash flows and option models.
Observable inputs are typically yield curves, volatilities and market prices of sim-
ilar instruments, which are usually obtained through ordinary providers such as
Reuters, Bloomberg and market makers. If the fair value is based on transac-
tions in similar instruments, measurement is exclusively based on transactions
at arm's length. Unlisted derivatives generally belong to this category.
Bonds not traded in the past three trading days belong to this category. The val-
uation is based on the most recent observed price, and adjustments are made
for subsequent changes in market conditions, eg by including transactions in
similar instruments (matrix pricing). Redeemed bonds are transferred to this cat-
egory, as there is no access to official prices in active markets.
Further, the valuation of derivatives implies the use of Credit Valuation Adjust-
ment (CVA), thus including counterparty credit risk in the valuation. The CVA of
derivatives with positive market values is primarily based on external credit
curves such as Itraxx Main, but also on internal data as regards customers with-
out impairment in the lowest rating categories, as there are no external curves
suitable for the calculation of credit risk on these customers. Finally, calculations
are made to simulate future exposures to interest rate swaps. Calculations en-
tailing increased CVA are included in the value adjustment.
Furthermore, a Funding Valuation Adjustment (FVA) for the valuation of deriva-
tives is used. FVA allows for Nykredit's future funding costs incurred by deriva-
tives transactions where clients have not provided sufficient collateral. Nykredit
has used a funding curve for this calculation, which is assessed on the basis of
objective prices of Danish SIFI banks' traded bonds. This calculation is made on
the basis of a discount curve method.
FVA may involve both a funding benefit and a funding cost, but for Nykredit, the
net FVA adjustment will be a funding cost resulting from customers' insufficient
or lacking provision of collateral. Debit Valuation Adjustment (DVA) is now a
sub-element of the FVA adjustment.
Net value adjustment due to CVA, DVA and FVA amounted to DKK 603 million
at 30 June 2019 against DKK 588 million at end-2018.
Upon entering into derivatives contracts, further provisions are made in the form
of a so-called minimum margin for liquidity and credit risk and return on capital
etc. The minimum margin is amortised at the valuation of derivatives over their
times-to-maturity. At 30 June 2019, the non-amortised minimum margin
amounted to DKK 142 million against DKK 147 million at end-2018. With regard
to liquidity and credit risk, DKK 194 million for 30 June 2019 and DKK 201 mil-
lion at end-2018 have been included above in the net adjustment of FVA and
CVA. Finally, in some instances further value adjustment based on management
judgement is made if the models are not deemed to take into account all known
risks, including eg legal risks.
In some cases, markets, eg the bond market, have become inactive and illiquid.
When assessing market transactions, it may therefore be difficult to conclude
whether the transactions were executed at arm's length or were forced sales. If
measurement is based on recent transactions, the transaction price is compared
with a price based on relevant yield curves and discounting techniques.
Unobservable inputs
When it is not possible to measure financial instruments at fair value based on
prices in active markets or observable inputs, measurement is based on own as-
sumptions and extrapolations etc. Where possible and appropriate, measure-
ment is based on actual transactions adjusted for differences in eg the liquidity,
credit spreads and maturities etc of the instruments. The Group's unlisted equi-
ties are generally classified under this heading, and valuation is based on the
IPEV Valuation Guidelines.
The positive market values of a number of interest rate swaps with customers in
the lowest rating categories have been adjusted for increased credit risk based
on additional CVA. The adjustment uses for instance the statistical data applied
by Nykredit to calculate expected credit losses on loans and advances at amor-
tised cost. Interest rate swaps which have been fair value adjusted to DKK 0 (af-
ter deduction for collateral) due to the creditworthiness of the counterparty are
also included in the category "Unobservable inputs".
Fair value totalled DKK 2.545 million at 30 June 2019 after value adjustment.
Credit value adjustments came to DKK 2.551 million at 30 June 2019 (End-
2018: DKK 2,308 million).
The interest rate risk on these interest rate swaps is hedged in all material re-
spects. However, interest rate fluctuations may impact results to the extent that
the market value must be adjusted due to increased counterparty credit risk. A
0.1 percentage point change in interest rate levels will impact the fair value by
+/- DKK 88 million.
However, financial assets measured on the basis of unobservable inputs ac-
count for a very limited part of total financial assets at fair value. At 30 June
2019, the proportion was thus 4,1% compared with 2,6% at end-2018. The pro-
portion of financial liabilities was 0,0% against 0.0% at end-2018.
NOTES
Nykredit Bank Group

Nykredit Bank – H1 Interim Report 2019 39/46
Valuation, notably of instruments classified as unobservable inputs, is subject to
some uncertainty. Of total assets and liabilities, DKK 2,6 billion (end-2018: DKK
1,6 billion) belonged to this category.
Assuming that an actual market price will deviate by +/- 10% from the calculated
fair value, the earnings impact will be DKK 264 million at 30 June 2019 (1,22%
of equity at 30 June 2019). The earnings impact at 31 December 2018 was esti-
mated at DKK 158 million (0.75% of equity at 31 December 2018).
Transfers between categories
Transfers between the categories Listed prices, Observable inputs and Unob-
servable inputs are made when an instrument is classified differently on the bal-
ance sheet date than at the beginning of the financial year. The value trans-
ferred to another category corresponds to the fair value at the beginning of the
year. With respect to interest rate swaps that have been fair value adjusted to
DKK 0 due to credit risk adjustment, separate calculations are made at the end
of each month.
In 2019 and 2018, transfers between the categories Observable inputs and Un-
observable inputs mainly resulted from changes to the ratings (credit risk) of
counterparties and primarily concerned interest rate swaps, as regards financial
instruments with positive market value.
Transfers between the categories Listed prices and Observable inputs mainly
result from bonds that are reclassified either due to traded volume or the number
of days between last transaction and the time of determination. As at 30 June
2019, financial assets of DKK 1,2 billion have been transferred from Listed
prices to Observable inputs and DKK 1,8 billion from Observable inputs to Listed
prices. Financial liabilities of DKK 0,3 billion were transferred from Listed prices
to Observable inputs and DKK 0,1 billion from Observable inputs to Listed
prices.
Redeemed bonds (usually comprised by Listed prices) are transferred to Ob-
servable inputs on the last day before the coupon date, as there is no access to
official prices in active markets. At 30 June 2019 the amount was DKK 0,3 billion
against DKK 0.4 billion at end-2018.
No transfers were made between the categories Listed prices and Unobservable
inputs.
NOTES
Nykredit Bank Group

40/46 H1 Interim Report 2019 – Nykredit Bank
DKK million
Nykredit Bank Group
19. FAIR VALUE DISCLOSURES (CONTINUED)
19. Fair value of assets and liabilities recognised at fair value (IFRS hierarchy)
30 June 2019
Financial assets:
Listed
prices
Observable
inputs
Unobservable
inputs
Total
fair value
- bonds at fair value 20,915 21,341 - 42,256
- equities measured at fair value through profit or loss 191 - 93 284
- positive fair value of derivative financial instruments 43 19,973 2,545 22,560
Total 21,148 41,314 2,638 65,100
Percentage 32.5 63.5 4.1 100.0
Financial liabilities:
- other non-derivative financial liabilities at fair value 4,499 4,912 - 9,411
- negative fair value of derivative financial instruments 126 12,560 - 12,687
Total 4,625 17,472 - 22,098
Percentage 20.9 79.1 - 100.0
Assets and liabilities measured on the basis of unobservable inputs
Bonds Equities Derivatives Total
Fair value, beginning of period, assets - 82 1,495 1,577
Unrealised capital gains and losses recognised in "Value adjustments" in the income statement - 2 441 443
Purchases for the period - 4 - 4
Sales for the period - - (89) (89)
Transferred from Listed prices and Observable inputs - 7 1,474 1,482
Transferred to Listed prices and Observable inputs - (2) (777) (779)
Fair value, end of period, assets - 93 2,545 2,638
¹ Transfers from Observable inputs to Unobservable inputs consist of interest rate swaps individually adjusted for increased credit risk. ² Transfers to Observable inputs from Unobservable inputs principally consist of interest rate swaps for which individual adjustment for increased credit risk is no longer required. 3 Recognised at fair value through fair value option.
NOTES

Nykredit Bank – H1 Interim Report 2019 41/46
DKK million
Nykredit Bank Group
19. FAIR VALUE DISCLOSURES (CONTINUED)
19. Fair value of assets and liabilities recognised at fair value (IFRS hierarchy)
31 December 2018
Financial assets:
Listed
prices
Observable
inputs
Unobservable
inputs
Total
fair value
- bonds at fair value 10,504 32,268 - 42,772
- equities measured at fair value through profit or loss 152 - 82 234
- positive fair value of derivative financial instruments 56 16,212 1,495 17,763
Total 10,712 48,480 1,577 60,769
Percentage 17.6 79.8 2.6 100.0
Financial liabilities:
- other non-derivative financial liabilities at fair value 3,514 4,104 - 7,618
- negative fair value of derivative financial instruments 50 10,662 - 10,712
Total 3,564 14,767 - 18,330
Percentage 19.4 80.6 - 100.0
Assets and liabilities measured on the basis of unobservable inputs
Bonds Equities Derivatives Total
Fair value, beginning of period, assets - 79 1,104 1,183
Unrealised capital gains and losses recognised in "Value adjustments" in the income statement - 6 377 383
Sales for the period - (3) (57) (60)
Transferred from Listed prices and Observable inputs - - 564 564
Transferred to Listed prices and Observable inputs - - (493) (493)
Fair value, end of period, assets - 82 1,495 1,577
¹ Transfers from Observable inputs to Unobservable inputs consist of interest rate swaps individually adjusted for increased credit risk. ² Transfers to Observable inputs from Unobservable inputs principally consist of interest rate swaps for which individual adjustment for increased credit risk is no longer required. 3 Recognised at fair value through fair value option
.
NOTES
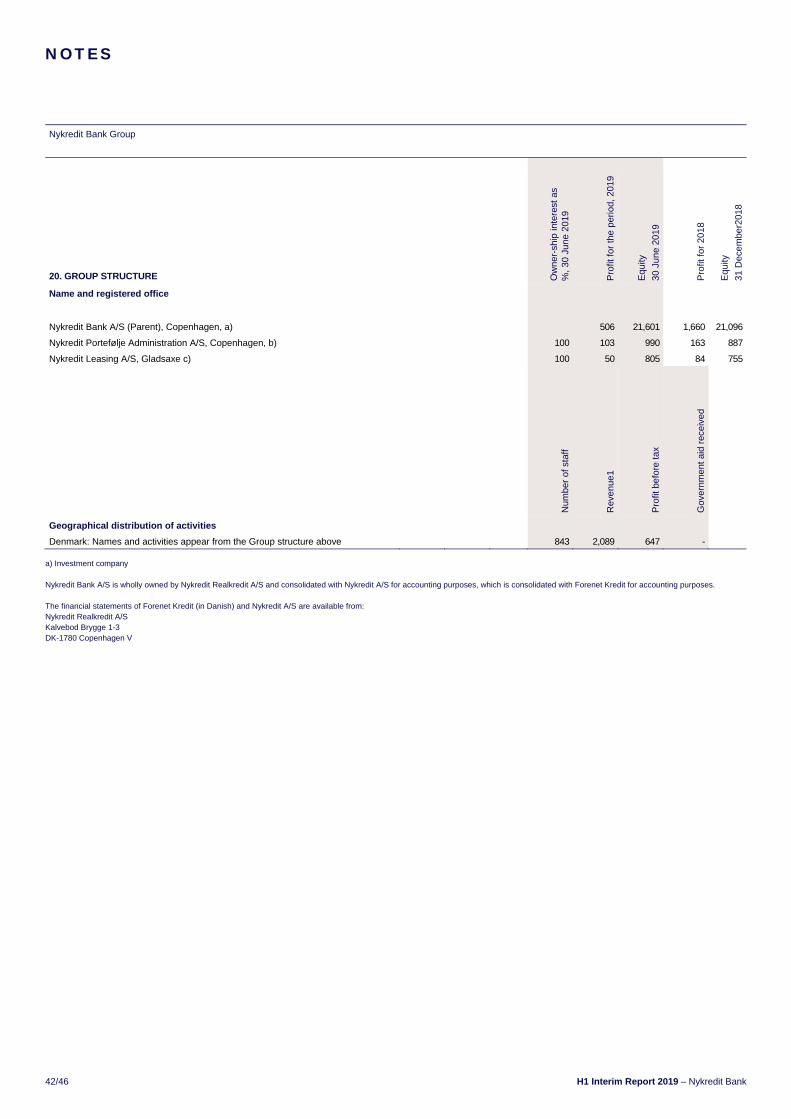
42/46 H1 Interim Report 2019 – Nykredit Bank
Nykredit Bank Group
20. GROUP STRUCTURE Ow
ner-
ship
inte
rest
as
%, 3
0 Ju
ne 2
019
Pro
fit fo
r th
e pe
riod,
201
9
Equ
ity
30 J
une
2019
Pro
fit fo
r 20
18
Equ
ity
31 D
ecem
ber2
018
Name and registered office
Nykredit Bank A/S (Parent), Copenhagen, a) 506 21,601 1,660 21,096
Nykredit Portefølje Administration A/S, Copenhagen, b) 100 103 990 163 887
Nykredit Leasing A/S, Gladsaxe c) 100 50 805 84 755
Num
ber
of s
taff
Rev
enue
1
Pro
fit b
efor
e ta
x
Gov
ernm
ent a
id r
ecei
ved
Geographical distribution of activities
Denmark: Names and activities appear from the Group structure above 843 2,089 647 -
a) Investment company Nykredit Bank A/S is wholly owned by Nykredit Realkredit A/S and consolidated with Nykredit A/S for accounting purposes, which is consolidated with Forenet Kredit for accounting purposes. The financial statements of Forenet Kredit (in Danish) and Nykredit A/S are available from: Nykredit Realkredit A/S Kalvebod Brygge 1-3 DK-1780 Copenhagen V
NOTES

Nykredit Bank – H1 Interim Report 2019 43/46
DKK million
Nykredit Bank Group H1/ H1/ H1/ H1/ H1/
2019 2018 2017 2016 2015
21. FIVE YEAR FINANCIAL HIGHLIGHTS
Summary income statement
Net interest income 807 829 743 703 865
Net fee income etc 893 846 800 526 510
Net interest and fee income 1,700 1,674 1,543 1,228 1,375
Value adjustments 68 732 2,241 (778) 954
Other operating income 21 14 17 14 15
Staff and administrative expenses 1,036 976 934 953 932
Depreciation, amortisation and impairment charges for property, plant and equipment as
well as intangible assets 0 0 7 8 8
Other operating expenses 12 12 11 13 33
Impairment charges for loans, advances and receivables etc 97 129 (207) (86) (89)
Profit (loss) from investments in associates and Group enterprises 3 1 - (0) 0
Profit (loss) before tax 647 1,305 3,054 (424) 1,460
Tax 141 281 671 (107) 342
Profit (loss) for the period 506 1,025 2,383 (317) 1,118
SUMMARY BALANCE SHEET, END OF PERIOD 30.06.2019 30.06.2018 30.06.2017 30.06.2016 30.06.2015
ASSETS
Cash balances and receivables from credit institutions and central banks 24,385 12,724 25,486 37,410 31,953
Loans, advances and other receivables at fair value - - 21,511 30,350 29,765
Loans, advances and other receivables at amortised cost 112,652 89,536 57,544 49,554 49,441
Bonds and equities etc 42,539 49,075 36,205 38,144 44,109
Remaining assets 35,057 22,755 25,041 39,558 37,689
Total assets 214,634 174,090 165,787 195,016 192,957
LIABILITIES AND EQUITY
Payables to credit institutions and central banks 77,760 42,434 41,252 40,205 45,693
Deposits and other payables 83,304 84,293 69,716 69,643 66,056
Bonds in issue at amortised cost 5,511 4,779 6,366 14,990 25,763
Other non-derivative financial liabilities at fair value 9,411 6,059 10,149 21,075 8,171
Remaining liabilities 14,751 13,811 16,958 33,081 31,286
Provisions 295 254 219 221 195
Subordinated debt 2,000 2,000 2,000 - 100
Equity 21,601 20,460 19,127 15,801 15,693
Total liabilities and equity 214,634 174,090 165,787 195,016 192,957
OFF-BALANCE SHEET ITEMS
Contingent liabilities 28,470 21,692 19,627 13,689 21,156
Other commitments 9,636 7,315 6,291 6,022 4,671
NOTES

44/46 H1 Interim Report 2019 – Nykredit Bank
Nykredit Bank Group H1/ H1/ H1/ H1/ H1/
2019 2018 2017 2016 2015
21. FIVE YEAR FINANCIAL HIGHLIGHTS (CONTINUE)
FINANCIAL RATIOS¹
Total capital ratio, % 20.7 22.4 20.8 20.0 18.9
Tier 1 capital ratio, % 18.7 20.0 18.7 19.6 18.5
Return on equity before tax, % 3.0 6.5 17.0 (2.7) 10.3
Return on equity after tax, % 2.4 5.1 13.3 (2.0) 7.9
Cost:income ratio 1.57 2.17 5.09 0.52 2.65
Foreign exchange position, % 0.6 0.1 0.4 0.1 0.1
Loans and advances:equity (loan gearing) 5.2 4.4 4.1 5.1 5.0
Growth in loans and advances for the period, excluding repo transactions % 4.9 4.6 4.6 6.0 5.1
Impairment charges for the period, % 0.1 0.1 (0.2) (0.1) (0.1)
Return on capital employed, % 0.2 0.6 1.4 (0.2) 0.6
Average number of staff, full-time equivalent 843 830 827 791 761
¹ Financial ratios are based on the Danish FSA's definitions and guidelines. Definitions appear from note 53 in the Annual Report 2018
NOTES
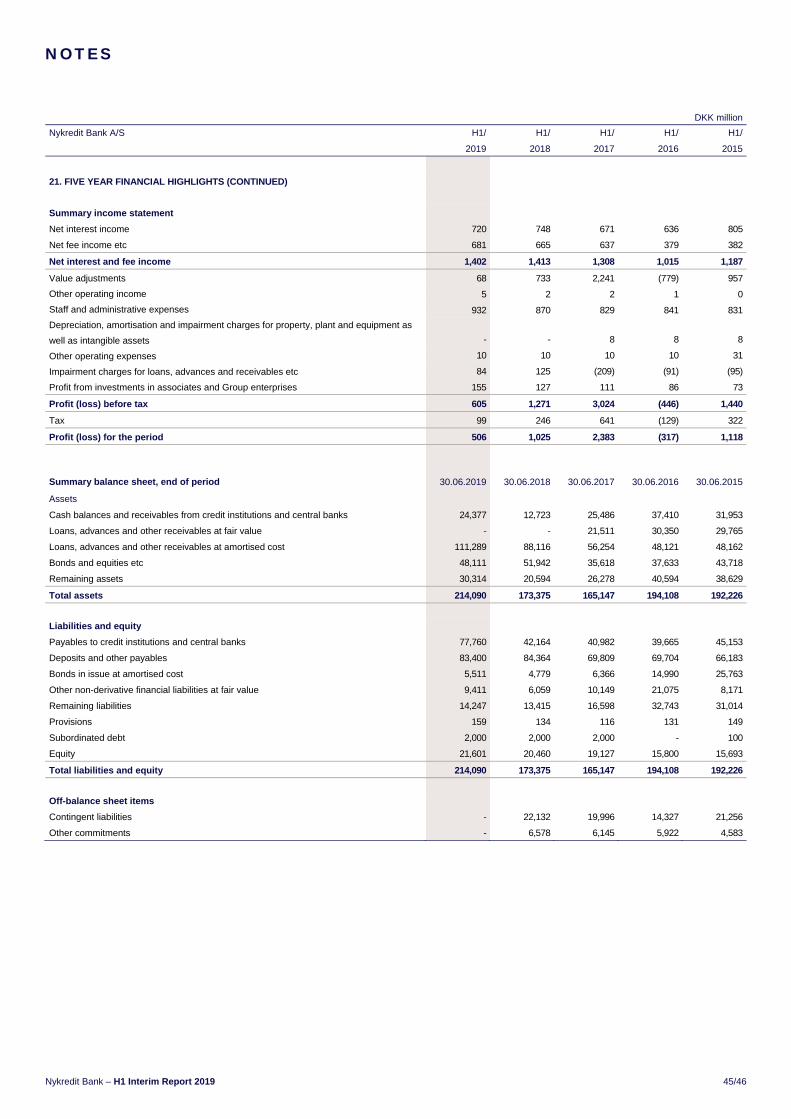
Nykredit Bank – H1 Interim Report 2019 45/46
DKK million
Nykredit Bank A/S H1/ H1/ H1/ H1/ H1/
2019 2018 2017 2016 2015
21. FIVE YEAR FINANCIAL HIGHLIGHTS (CONTINUED)
Summary income statement
Net interest income 720 748 671 636 805
Net fee income etc 681 665 637 379 382
Net interest and fee income 1,402 1,413 1,308 1,015 1,187
68 733 2,241 (779) 957
5 2 2 1 0
932 870 829 841 831
- - 8 8 8
10 10 10 10 31
84 125 (209) (91) (95)
Value adjustments
Other operating income
Staff and administrative expenses
Depreciation, amortisation and impairment charges for property, plant and equipment as
well as intangible assets
Other operating expenses
Impairment charges for loans, advances and receivables etc
Profit from investments in associates and Group enterprises 155 127 111 86 73
Profit (loss) before tax 605 1,271 3,024 (446) 1,440
Tax 99 246 641 (129) 322
Profit (loss) for the period 506 1,025 2,383 (317) 1,118
Summary balance sheet, end of period 30.06.2019 30.06.2018 30.06.2017 30.06.2016 30.06.2015
Assets
Cash balances and receivables from credit institutions and central banks 24,377 12,723 25,486 37,410 31,953
Loans, advances and other receivables at fair value - - 21,511 30,350 29,765
Loans, advances and other receivables at amortised cost 111,289 88,116 56,254 48,121 48,162
Bonds and equities etc 48,111 51,942 35,618 37,633 43,718
Remaining assets 30,314 20,594 26,278 40,594 38,629
Total assets 214,090 173,375 165,147 194,108 192,226
Liabilities and equity
Payables to credit institutions and central banks 77,760 42,164 40,982 39,665 45,153
Deposits and other payables 83,400 84,364 69,809 69,704 66,183
Bonds in issue at amortised cost 5,511 4,779 6,366 14,990 25,763
Other non-derivative financial liabilities at fair value 9,411 6,059 10,149 21,075 8,171
Remaining liabilities 14,247 13,415 16,598 32,743 31,014
Provisions 159 134 116 131 149
Subordinated debt 2,000 2,000 2,000 - 100
Equity 21,601 20,460 19,127 15,800 15,693
Total liabilities and equity 214,090 173,375 165,147 194,108 192,226
Off-balance sheet items
Contingent liabilities - 22,132 19,996 14,327 21,256
Other commitments - 6,578 6,145 5,922 4,583
NOTES
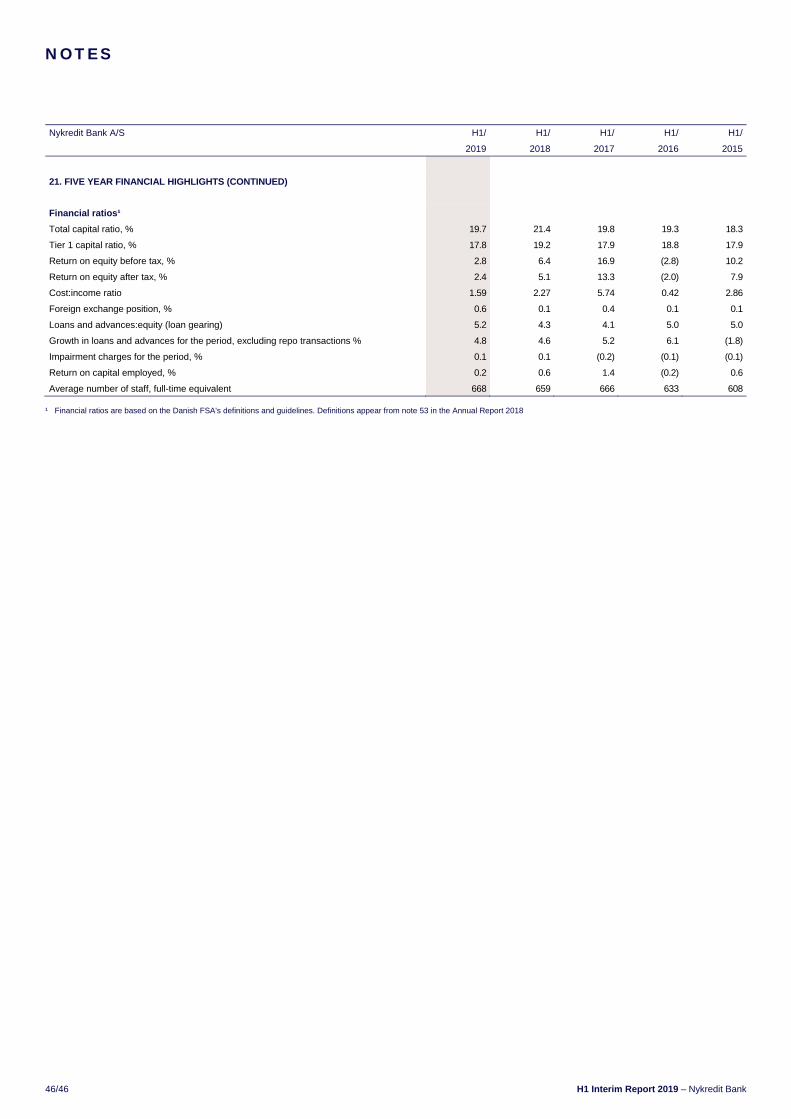
46/46 H1 Interim Report 2019 – Nykredit Bank
Nykredit Bank A/S H1/ H1/ H1/ H1/ H1/
2019 2018 2017 2016 2015
21. FIVE YEAR FINANCIAL HIGHLIGHTS (CONTINUED)
Financial ratios¹
Total capital ratio, % 19.7 21.4 19.8 19.3 18.3
Tier 1 capital ratio, % 17.8 19.2 17.9 18.8 17.9
Return on equity before tax, % 2.8 6.4 16.9 (2.8) 10.2
Return on equity after tax, % 2.4 5.1 13.3 (2.0) 7.9
Cost:income ratio 1.59 2.27 5.74 0.42 2.86
Foreign exchange position, % 0.6 0.1 0.4 0.1 0.1
Loans and advances:equity (loan gearing) 5.2 4.3 4.1 5.0 5.0
Growth in loans and advances for the period, excluding repo transactions % 4.8 4.6 5.2 6.1 (1.8)
Impairment charges for the period, % 0.1 0.1 (0.2) (0.1) (0.1)
Return on capital employed, % 0.2 0.6 1.4 (0.2) 0.6
Average number of staff, full-time equivalent 668 659 666 633 608
¹ Financial ratios are based on the Danish FSA's definitions and guidelines. Definitions appear from note 53 in the Annual Report 2018
NOTES