nyc young street tree mortality study - state of michigan
TRANSCRIPT

Copyright 2010 by the authors. All rights reserved. This work is licensed to the public under the Creative Commons
Attribution License. Cities and the Environment is produced by the Urban Ecology Program, Department of
Biology, Seaver College, Loyola Marymount University in cooperation with the USDA Forest Service. Published by
The Berkeley Electronic Press (bepress). http://catejournal.org
Lu, J.W.T., E.S. Svendsen, L.K. Campbell, J. Greenfeld, J. Braden, K.L. King, N. Falxa-Raymond. 2010.
Biological, social, and urban design factors affecting young street tree mortality in New York City. Cities and the
Environment. 3(1):article 5. http://escholarship.bc.edu/cate/vol3/iss1/5. 15 pp.
Cities and the Environment
2010 Volume 3, Issue 1 Article 5
Biological, Social, and Urban Design Factors Affecting Young Street Tree Mortality in
New York City
Jacqueline W.T. Lu, Erika S. Svendsen, Lindsay K. Campbell, Jennifer Greenfeld, Jessie Braden,
Kristen L. King, and Nancy Falxa-Raymond
Abstract
In dense metropolitan areas, there are many factors including traffic congestion, building development
and social organizations that may impact the health of street trees. The focus of this study is to better
understand how social, biological and urban design factors affect the mortality rates of newly planted
street trees. Prior analyses of street trees planted by the New York City Department of Parks & Recreation
between 1999 and 2003 (n=45,094) found 91.3% of those trees were alive after two years and 8.7% were
either standing dead or missing completely. Using a site assessment tool, a randomly selected sample of
13,405 of these trees was surveyed throughout the City of New York during the summers of 2006 and
2007. Overall, 74.3% of the sample trees were alive when surveyed and the remainder were either
standing dead or missing. Results of our initial analyses reveal that highest mortality rates occur within
the first few years after planting, and that land use has a significant effect on street tree mortality. Trees
planted in one- and two-family residential areas had the highest survival rates (82.7%), while young street
trees planted in industrial areas, open space and vacant land had the lowest rates of street tree survival
(60.3% -62.9%). Also significant in predicting street tree success and failure are species type, tree pit
enhancements, direct tree care/stewardship, and local traffic conditions. These results are intended to
inform urban forest managers in making decisions about the best conditions for planting new street trees.
Keywords
Urban forestry; street trees; mortality; stewardship; urban design; planting

Lu et al: Factors afffecting young street tree mortality in New York City
2
INTRODUCTION
It is understood that the establishment period following planting of an urban street tree is crucial
to its survival (Richards 1979; Gilbertson and Bradshaw 1990), yet little is known about the factors or
relationships that ultimately contribute to tree mortality or survival. Improving the survival of young
street trees can do more to reduce replacement needs than will investments to maintain older trees
(Richards 1979). This study of young street trees planted throughout neighborhoods in New York City
provides a context in which to understand how biological, social, and urban design factors impact the
establishment of new street trees through a multi-disciplinary site assessment framework that examines
the conditions of the urban street. In this study, we present our rationale, methods, and descriptive
statistics on the subject in an effort to contribute to the literature on street tree health and as a means to
inform similar practitioner-based efforts in other urban areas.
One of the fundamental challenges to city managers and civic groups is ensuring the survival of
newly-planted street trees in places as dynamic, heterogeneous, and diverse as cities. Population growth,
vehicular traffic, poor air quality, and building and sidewalk designs all present challenges to urban street
trees, yet trees must reach maturity in order to maximize proven biophysical and social benefits (Dwyer et
al. 1992). While there is much research on soil regimes, nursery stock, and species selection, survival
rates still vary widely—from 34.7% to 99.7% according to a recent review of the literature (Roman
2006). As cities around the United States increase their investment in tree planting via programs such as
MillionTreesNYC, Million Trees Los Angeles, and Keep Indianapolis Beautiful, urban forest managers
must be able to ensure young trees’ best chance of survival.
Other published work on tree mortality provides insight into factors impacting the life of an urban
street tree. One early study analyzes street trees in three Boston neighborhoods that differ both
socioeconomically and demographically and reports a 26% mortality rate of 136 trees planted two to four
years prior on one commercial street (Foster and Blaine 1978). The authors also observed low rates of
vandalism, high rates of automobile damage, and the potential for tree stakes to damage newly-planted
trees. Localized effects could also be at play in the findings of an Oakland study that assesses street tree
growth and mortality of 480 volunteer-planted trees along a 5.4-mile stretch of one boulevard; after two
years, 34% of the trees were dead or removed (Nowak et al. 1990). Although the authors find differences
in mortality related to adjacent land uses, it is uncertain if the mortality here is high overall due to
conditions local to the boulevard; if the trees were planted incorrectly by the volunteers; or if the trees
were too small to withstand minor stresses that may not affect trees of a larger caliper; or some other
factor. Another study with a local focus reports on environmental factors influencing 1,000 urban street
trees in New York City (Berrang et al. 1985). Because all of the trees in this study are sited directly
around electrical power facilities, it is difficult to determine if their observations are a result of this
adjacent land use or if they can be applied across the urban landscape. Observational studies such as these
give insight into potential factors influencing the survival of newly-planted trees, but have yet to be tested
on a city-wide scale. This study examines similarities and differences among a wide range of site
conditions and neighborhoods.
The published study with the largest sample size reports on observations of 10,000 newly-planted
trees in northern England and finds 9.7% mortality after one year (Gilbertson and Bradshaw 1985). The
researchers draw attention to the many factors potentially affecting mortality levels such as stock quality,
planting technique, and maintenance regime, but do not attempt to directly link any of these phenomena
to tree mortality rates. A similar study tracks four groups of newly-planted trees during their first year in
urban Brussels (Impens and Delcarte 1979). The average mortality rate after one year is 11.3%, but
detailed information that describes the size, species, or specific location of the trees is not addressed by
the study.

Cities and the Environment 3(1):2010
3
A second study about the survival of newly-planted urban trees in Northern England reports on
constant, in-situ monitoring of the study trees, which has the potential to provide more detailed
information about precisely when and how the tree died (Gilbertson and Bradshaw 1990). The authors
found 22.7% mortality after three growing seasons in the inner-city compared with 17% in greater
Liverpool. Although the difference is assumed to be linked to the inhospitable environment of the study
cohort, vandalism is not a primary cause of tree death in inner city Liverpool. Instead, biological factors
such as species tolerance, transplant stress, water stress, and weed competition are deemed most crucial
for urban tree establishment (Gilbertson and Bradshaw 1990).
The methods used in urban tree mortality research are broad and varied, making it difficult to
compare rates of survival, but several key observations can be gleaned from these prior studies that likely
have implications on mortality rates. Vandalism, as measured by the observation of broken branches in
the canopy or a broken main stem, is an important factor in the mortality of urban trees (Gilbertson and
Bradshaw 1985; Nowak et al. 1990; Pauleit et al. 2002; Roman 2006); adjacent land use can negatively
affect street tree populations (Nowak et al. 2004; Roman 2006); and some species of trees fare much
better than others as street trees (Gilbertson and Bradshaw 1990; Miller and Miller 1991; Sydnor et al.
1999; Pauleit et al. 2002). Few studies have analyzed the role of physical urban design factors such as
traffic volume or the tree’s location within the streetscape on mortality rates. Previous studies have not
fully investigated the contribution of social or stewardship factors including sociability of the area
proximate to the tree (e.g. seating, gardens, front yards) or signs of direct tree care and stewardship (e.g.
weeding, mulching, gardening in tree bed), to young street tree success. The goal of this study is twofold,
to develop an assessment tool that includes biological, social, and urban design factors and apply it across
a wide range of land uses and neighborhood settings to gain insight into the multiple pathways and
processes impacting the health of young street trees.
METHODOLOGY
Sampling Plan
The 13,405 trees analyzed in this study were pulled from a larger sample of 45,094 trees using a
partial inventory technique based on stratified random sampling (Sun and Bassuk 1991; Jaenson et al.
1992). The sample was stratified by time in-ground and land use in order to get a random and
comprehensive sample of trees in each of these groups. At the time of field survey, all trees had been in
the ground between 3 and 9 years. For the stratified random sample, the trees planted from spring 1999 to
fall 2003 were grouped into three planting periods. The sample was also stratified using aggregated land
use classes from the New York City Primary Land Use Tax Lot Output (PLUTO) data set (NYC
Department of City Planning 2005); the original land use types were grouped into One & Two Family
Residential, Multi-family Residential; Mixed, Commercial and Public Institutions; Industrial, Utility &
Parking; and Open Space & Vacant Land. During field surveys we found that the land use information in
PLUTO was not up-to-date or accurate. Forty eight percent of the tree planting locations visited had
actual land uses that differed from the PLUTO data. Because of issues encountered with the accuracy of
the PLUTO database, we present our results using the land use types observed for the tree in the field. We
also readjusted our stratified sample to account for the distribution of field-verified land use.
Field Methods
In order to efficiently visit and record data on 13,405 trees across all five boroughs of New York
City, a grid map series at roughly 1:10,000 was produced using ArcGIS. A custom data collection form
designed in Pendragon Forms allowed survey questions to be loaded on a Palm Pilot for mobile data
collection. These field data were directly synchronized into Microsoft Excel. In this study, the data were
collected at multiple scales - the tree level, then the building level, and at the block level. In order to

Lu et al: Factors afffecting young street tree mortality in New York City
4
facilitate easy repetition of data collection, all variables were optimized for simple field observation and
require no laboratory analysis or precise measurements. The data are organized into the three groups of
relevant information: biological factors that may affect young street trees, urban design factors, and
sociability/stewardship factors. Some of the variables we collected can apply to more than one tier – for
example, presence or absence of a tree guard can be both a physical design and a stewardship factor,
depending on whether they are routinely installed as part of municipal tree planting.
These methods were based upon social site assessment models used for natural resource
management (Freudenburg 1986) with city foresters taking an active role in training and supervising
researchers in the field. All fieldwork was conducted by 20 interns hired and trained by the New York
City Department of Parks & Recreation (NYC Parks) and the USDA Forest Service Northern Research
Station (NRS). Data collection took place over the summers of 2006 and 2007 in hundreds of New York
City neighborhoods. Recording the presence or absence of observable phenomena, the team used a
combined study approach and developed a data collection framework that resulted in the collection of
over forty items of data at the location of each tree. Street tree locations varied widely, from high-rise
areas, to low-rise brownstone neighborhoods, to single family structures in suburban settings. For the
purposes of this analysis, missing trees were counted as dead, following the precedent of previous studies
(Gilbertson and Bradshaw 1990; Miller and Miller 1991; Pauleit et al. 2002).
Biological Factors
Table 1 lists the biological factors that may have an effect on the success and failure of young
street trees. If the tree cannot obtain its minimum biological requirements, it will not thrive, regardless of
the urban context in which it was planted. This first layer of data collection provides important clues to
the overall health of the tree. The data items listed below may indicate tree health, growth rates, damage
and decay, or soil health or identify biological stressors affecting establishment. They are most useful in
determining the overall health of a living street tree; if a tree is dead or missing from where it was
planted, it is not possible to collect many of these data items. In light of the developing awareness in an
objective methodology in appraising tree health (Bond 2010) and linking urban tree evaluations into the
forest inventory analysis (FIA) through the ongoing International Union of Forest Research Organizations
(IUFRO) Urban Forestry Data Standards effort, our approach is certainly subject to change as methods
become standardized. Soil compaction was measured by applying pressure to the soil with a screwdriver
tip; if the screwdriver easily entered the soil, the soil was said to be uncompacted.
Data Item Response type
water pooling in tree pit presence/absence
soil compaction presence/absence
animal waste presence/absence
sucker growth presence/absence
evidence of leaf chlorosis presence/absence
evidence of insect damage presence/absence
evidence of dieback presence/absence
guiding wires girdling tree presence/absence
guard/grate girdling tree presence/absence
broken branches presence/absence
unnatural lean presence/absence
trunk wound presence/absence
pit soil level categorical
planting depth categorical
species categorical
diameter at breast height categorical
Table 1. Biological factors
potentially affecting young street
trees in NYC.

Cities and the Environment 3(1):2010
5
Sociability/stewardship Factors
The social factors which potentially influence young street tree mortality are listed in Table 2.
Our data collection methodology includes recording direct signs of tree stewardship at the level of each
tree (i.e. planting in tree pits, adding mulch), which are indicators that individuals or groups are caring for
a tree. At the building and neighborhood level, we observed off-tree signs of stewardship such as the
presence of home decorations, front yard gardens, and murals. These factors are considered ―cues to
care‖ that provide evidence that individual and/or community-level stewardship is taking place (Nassauer
1995). A well-cared for urban street tree and pit area is considered to be a sign of active local
stewardship. We also collected data on practices that could have conflicting effects on a tree’s health; for
example, tree lights could retard tree growth by strangling the tree, but also could draw attention to the
presence of a tree thereby triggering stewardship.
Table 2. Sociability/stewardship factors potentially affecting street trees in NYC
Data Item Response type
pit off curb (at least 12" away) presence/absence
curb intact presence/absence
tree grate presence/absence
block paving in tree pit presence/absence
tree guard* presence/absence
tree pit type categorical
presence/condition of block pavers presence/absence; categorical
tree pit size (square feet) number
ground floor door presence/absence
awning on adjacent building presence/absence
scaffolding on adjacent building presence/absence
number of building stories number
land use classification categorical
median strip on street presence/absence
on-street parking presence/absence
bus stop nearby (< 5') presence/absence
driveway nearby (< 5') presence/absence
bike rack nearby presence/absence
sidewalk condition categorical
traffic volume categorical
tree placement in slope categorical
sidewalk width number
number of traffic lanes number
% pavement within drip line number* the variable presence of a tree guard can also apply to the sociability / stewardship category
Bu
ildin
g le
vel
Tree
/tre
e p
it le
vel
Stre
etsc
ape
leve
l
Lu et al: Factors afffecting young street tree mortality in New York City
6
Data were collected about neighborhood sociability to ascertain whether the tree is incorporated
into active street life. For example, benches are built into tree pits, seating is arranged under trees’
canopies, or play equipment is often proximate to the tree. At the neighborhood level, signs of sociability
indicate more ―eyes upon the street‖ (Jacobs 1961) or the orientation of urban space to enhance
community awareness and engagement. This sociability can influence tree survival via multiple pathways,
such as through prevention of tree vandalism. Moreover, these signs of sociability can be considered
indicators of community street life and may relate to stewardship over time. Given a study that collects
observational data at one moment in time, it is important to use these proximate measures of social life as
indicators that stewardship may have occurred historically. Areas of community street activity include
facilities such as places of worship and schools, which are known to sponsor local stewardship activities.
Drawing upon the work of Wilson and Kelling (1982), negative indicators were also observed, such as the
presence of broken windows, vacant lots and buildings, and (non-mural) graffiti. Known as the ―broken-
window theory,‖ the presence of vacant buildings and lots strewn with garbage tend to attract more
visible disorder on and around neighborhood streets. Researchers documented the presence and absence
of disorder around each street tree.
One difference in this section of data is that it is possible for some items to have two response
types. For example, if a front yard is present (presence/absence), it may be valuable to note what type of
yard (categorical; i.e. paved, grass). The same can be said for gardens, building security, murals, and
public facilities. Collecting this second tier of data gives researchers the ability to strengthen an analysis
of the dynamic social factors affecting street tree mortality.
Urban Design Factors
This study suggests that physical urban design factors influence the success of young street trees;
this category includes information at three different levels: tree/tree pit, building, and streetscape (listed in
Table 3). The factors measured at the level of the tree and tree pit itself are more directly connected with
the tree success or failure, while others, such as the presence of a bike rack nearby and the width of the
sidewalk, are more exploratory in nature and may only provide insights into potential influences. All
factors comprise the physical urban context into which the tree has been planted. They are the result of
urban design, zoning practices, or unplanned piecemeal development and they affect the flow of
pedestrians, bicycles, and motor vehicles through the environment surrounding the tree. At the same
time, these factors also affect airflow, sunlight, and wind speed that can impact the growing conditions of
trees (McGrath et al. 2007).
Most of these data are collected in the presence/absence format, but some other responses are
categorical in nature. For example, pit type could be characterized as a sidewalk cutout or tree lawn;
block paving status can range from good to raised or altogether missing; traffic volume could be low,
medium, or high; and sidewalk condition could be good, cracked, poor condition, etc.

Cities and the Environment 3(1):2010
7
Data Item Response type
tree care-related signage presence/absence
stakes present, but no wires presence/absence
walled tree well presence/absence
tree pit plantings presence/absence
tree guard* presence/absence
tree pit paved to tree trunk presence/absence
mulch in tree pit presence/absence
gravel in tree pit presence/absence
bench near/around pit presence/absence
bird feeder in tree or tree pit presence/absence
irrigation bag presence/absence
evidence of weeding of tree pit presence/absence
litter in tree pit presence/absence
evidence of pruning presence/absence
debris in canopy of tree presence/absence
electrical outlet in tree pit presence/absence
lights in or around tree presence/absence
seating area associated with building presence/absence
play equipment in yard of building presence/absence
flag on building presence/absence
decorations on door of building presence/absence
flower planters presence/absence
building has front yard (type) presence/absence; categorical
building has garden (type) presence/absence; categorical
building security (type) presence/absence; categorical
graffiti on adjacent buildings presence/absence
broken/missing windows presence/absence
mural on adjacent building (type) presence/absence; categorical
public facilities on block (type) presence/absence; categorical
block-level vacancies categorical* the variable presence of a tree guard can also apply to the urban design category
Stre
etsc
ape
Bu
ildin
g le
vel
Tree
/tre
e p
it le
vel
FINDINGS FROM DESCRIPTIVE STATISTICS
The following descriptive statistical analyses examine the effects of time since planting, land use, and
selected biological, social, and urban design factors on urban young street tree mortality. Contingency
tables and chi-square analyses were used to assess the effect of each variable, with the simplifying
assumption that variables are independent and do not interact with each other. Although in reality our
dataset contains many nested, correlated and confounding variables, as practitioners we are interested in
evaluating the contributions of each variable from a management perspective and for refining planting
policies and site selection procedures. Formal analysis incorporating combinations of and interactions
between these factors is ongoing and will be treated in future manuscripts.
Table 3. Urban design factors potentially affecting street trees in NYC.
Lu et al: Factors afffecting young street tree mortality in New York City
8
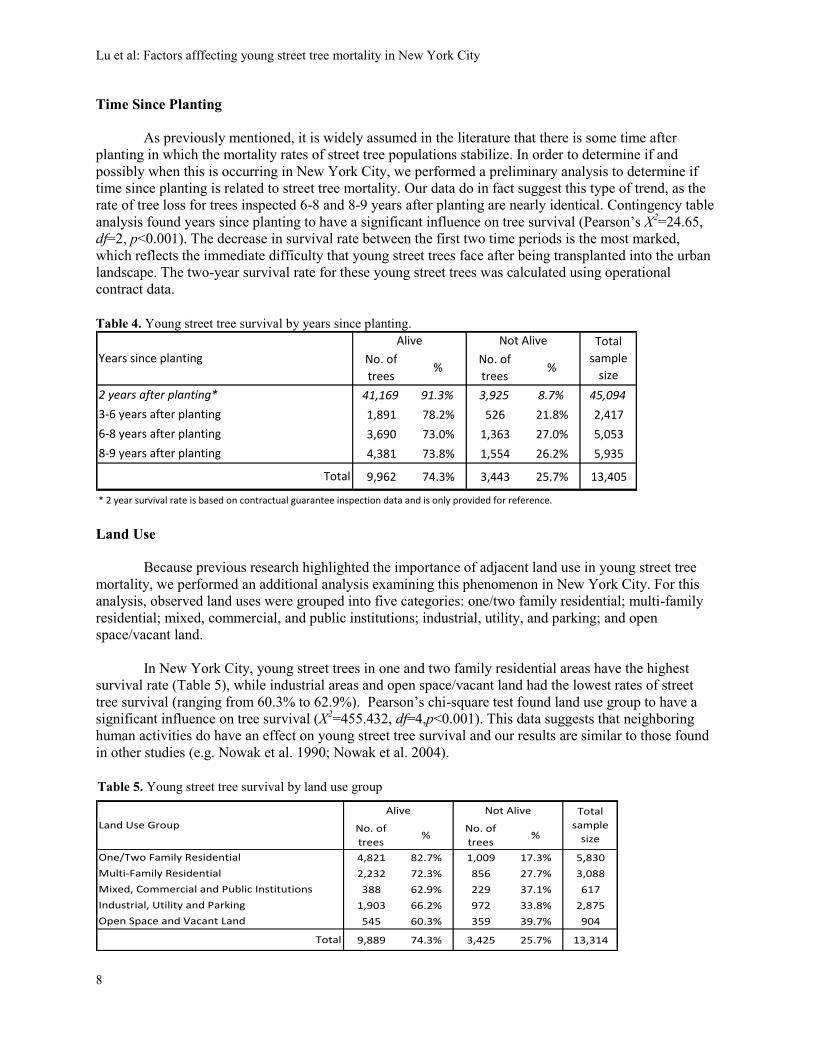
Time Since Planting
As previously mentioned, it is widely assumed in the literature that there is some time after
planting in which the mortality rates of street tree populations stabilize. In order to determine if and
possibly when this is occurring in New York City, we performed a preliminary analysis to determine if
time since planting is related to street tree mortality. Our data do in fact suggest this type of trend, as the
rate of tree loss for trees inspected 6-8 and 8-9 years after planting are nearly identical. Contingency table
analysis found years since planting to have a significant influence on tree survival (Pearson’s X2=24.65,
df=2, p<0.001). The decrease in survival rate between the first two time periods is the most marked,
which reflects the immediate difficulty that young street trees face after being transplanted into the urban
landscape. The two-year survival rate for these young street trees was calculated using operational
contract data.
Table 4. Young street tree survival by years since planting.
No. of
trees%
No. of
trees%
41,169 91.3% 3,925 8.7% 45,094
1,891 78.2% 526 21.8% 2,417
3,690 73.0% 1,363 27.0% 5,053
4,381 73.8% 1,554 26.2% 5,935
9,962 74.3% 3,443 25.7% 13,405
* 2 year survival rate is based on contractual guarantee inspection data and is only provided for reference.
Years since planting
Alive Total
sample
size
Not Alive
2 years after planting*
3-6 years after planting
6-8 years after planting
8-9 years after planting
Total
Land Use
Because previous research highlighted the importance of adjacent land use in young street tree
mortality, we performed an additional analysis examining this phenomenon in New York City. For this
analysis, observed land uses were grouped into five categories: one/two family residential; multi-family
residential; mixed, commercial, and public institutions; industrial, utility, and parking; and open
space/vacant land.
In New York City, young street trees in one and two family residential areas have the highest
survival rate (Table 5), while industrial areas and open space/vacant land had the lowest rates of street
tree survival (ranging from 60.3% to 62.9%). Pearson’s chi-square test found land use group to have a
significant influence on tree survival (X2=455.432, df=4,p<0.001). This data suggests that neighboring
human activities do have an effect on young street tree survival and our results are similar to those found
in other studies (e.g. Nowak et al. 1990; Nowak et al. 2004).
No. of
trees%
No. of
trees%
4,821 82.7% 1,009 17.3% 5,830
2,232 72.3% 856 27.7% 3,088
388 62.9% 229 37.1% 617
1,903 66.2% 972 33.8% 2,875
545 60.3% 359 39.7% 904
9,889 74.3% 3,425 25.7% 13,314Total
Land Use Group
Alive Total
sample
size
Not Alive
One/Two Family Residential
Multi-Family Residential
Mixed, Commercial and Public Institutions
Industrial, Utility and Parking
Open Space and Vacant Land
Table 5. Young street tree survival by land use group

Cities and the Environment 3(1):2010
9
Biological, Sociability/Stewardship, And Urban Design Factors
As mentioned previously, we looked at how individual or groups of variables affected survival
rates through a series of two-way contingency tables. The results presented here begin to lay out the type
of processes at work in the urban forest. Our initial results are summarized in Tables 6 through 8.
Biological Factors
Previous research has shown that species does matter with respect to the mortality of urban street
trees, and this study reinforces that idea that there are significant differences in survival rates between
species (Table 6). Of the trees planted that comprise greater than one percent of the total, callery pear
(Pyrus calleryana) is the most successful. Although the entire suite of species that NYC Parks plants are
known to be tolerant of urban conditions, some have higher tolerances than others. Anecdotally, one of
the most common stressors that an urban street tree faces believed to face is deposition of animal waste in
the tree pit, yet in our results the presence of scat was unexpectedly associated with higher survival,
underscoring how these simplistic analyses based on one-time observations should be interpreted with
caution.
Independent Variable Alive Not Alive % Survival X 2 value df p -value
Tree species (>1% of all planted trees)
Pyrus calleryana 1,863 381 83.0%
Gleditsia triacanthos 1,274 332 79.3%
Tilia cordata 617 168 78.6%
Quercus palustris 639 177 78.3%
Zelkova serrata 537 149 78.3%
Tilia tomentosa 143 41 77.7%
Quercus rubra 145 42 77.5%
Fraxinus pennsylvanica 268 85 75.9% 178.611 18 <0.001
Prunus cerasifera (Purpleleaf plum) 113 37 75.3%
Acer rubrum 245 81 75.2%
Prunus serotina (Kwanzan cherry) 266 88 75.1%
Japanese pagoda tree 310 109 74.0%
Prunus virginiana (Shubert cherry) 452 184 71.1%
Tilia tomentosa 477 204 70.0%
Acer campestre 170 73 70.0%
Liquidambar styraciflua 171 77 69.0%
Prunus spp. 210 107 66.2%
Gingko biloba 370 189 66.2%
Plantanus acerifolia 112 68 62.2%
Presence of animal scat in tree pit or near tree
Present 627 139 81.9% 24.19 1 <0.001
Not present 9,335 3,301 73.9%
Sociability/ Stewardship Factors
These variables can help to elucidate the level of engagement that an individual or local
community group has with trees in the urban landscape. In terms of sociability, trees with adjacent seating
or an adjacent front yard were all more likely to survive in the urban environment (Table 7). Our data also
show that a tree is more likely to survive if the building in front of which it is planted has a garden or
planters/window boxes. If a garden is present, though, the type or visible level of garden care does not
have any bearing on young street tree survival. Our interpretation of these results is that either (1) the
mere presence of adjacent stewardship of other natural amenities (lawns, gardens) is adequate to engage
Table 6. Young street tree survival and select contributing biological factors

Lu et al: Factors afffecting young street tree mortality in New York City
10
local residents in the care of maintenance of their street trees; or (2) presence of signs of off-tree
stewardship may be an indicator of on-tree stewardship that has occurred historically.
A stewardship index was constructed from factors that directly affect the area in and around the
tree pit, including: presence of signage, plantings in pits, mulch, and evidence of weeding. This
stewardship index is significantly correlated with tree survival. Planting in the tree pit was the most often
observed stewardship behavior (1,039 trees), followed by mulch (962 trees), weeding (317 trees), and
signage (232 trees). Evidence of active, direct tree stewardship is a positive indicator or predictor of
street tree survival.
Independent Variable Alive Not Alive % Survival X 2 value df p -value
Presence of seating near tree
With seating 694 135 83.7% 28.44 1 <0.001
No seating 8,719 2,824 75.5%
Presence of front yard near tree
Yard present 5,246 1,170 81.8% 236.40 1 <0.001
No yard 4,167 1,789 70.0%
Presence of a garden near tree
Garden present 3,266 607 84.3% 210.59 1 <0.001
No garden 6,147 2,352 72.3%
Garden type (if present)
Natural 3,345 623 84.3% 1.04 1 0.308
Plastic 12 4 75.0%
Garden care (if present)
Good 3,201 580 84.7% 4.40 1 0.036
Poor 155 41 79.1%
Presence of planters or window boxes
Present 1,623 244 86.9% 142.19 1 <0.001
Not present 7,790 2,715 74.2%
Presence of stewardship signs*
4 signs 20 0 100.0%
3 signs 112 3 97.4%
2 signs 328 11 96.8% 412.36 4 <0.001
1 sign 1,325 122 91.6%
None 8,177 3,307 71.2%* signs of stewardship include presence of signage on or near the tree; plantings in street tree pits; mulch placed in pit; and evidence of weeding
Urban Design Factors
Our research indicates that the urban context into which street trees are planted is an important
factor in their success and failure (Table 8). Street trees have a greater chance at survival when planted in
lawn strips rather than sidewalk cutouts. In our data the size of sidewalk cut out pits does not have a
significant influence on the survival of young street trees. Given that larger tree pits yield greater volumes
of uncompacted soil for the roots to grow and greater surface area for water to enter the tree pit, one
would expect that street trees would fare much better in large tree pits. One possible interpretation of this
result is that tree pit size is not as important in the early life of a young street tree, but will become a
limiting factor as the tree begins to grow out of its spot in the sidewalk.
Installing a perimeter tree pit guard prevents vandalism and vehicular damage, prevents animal
waste deposition, and is visually representative of a tree that is being cared for by someone. It is likely
because of a combination these factors that trees in pits with perimeter guards have a greater chance at
success than trees in unprotected pits. The presence/absence of tree guards can also be considered as a
sociability/stewardship factor, not just a physical design variable. This is because while the mechanism
for reduced mortality for street trees with tree guards are physical (by preventing soil compaction or
Table 7. Young street tree survival and select sociability/stewardship factors

Cities and the Environment 3(1):2010
11
inadvertent contact to the tree by cars), tree guards are typically installed privately and not by NYC Parks,
and therefore also represents an act of stewardship. This may vary in other urban areas.
Independent Variable Alive Not Alive % Survival X2 value df p -value
Pit type
Lawn 3,548 992 78.1%
Sidewalk 5,917 2,196 72.9% 58.43 2 <0.001
Continuous 397 193 67.3%
Presence of perimeter tree guard
With guard 1,121 83 93.1% 116.42 1 <0.001
No guard 8,841 2,150 80.4%
Tree Pit Size (sidewalk trees only)
55+ sq. ft 42 7 85.7%
45 to <55 sq. ft 160 29 84.7%
15 to <25 sq. ft 3,066 570 84.3%
05 to <15 sq. ft 336 70 82.8% 7.48 5 0.188
35 to <45 sq. ft 266 58 82.1%
25 to <35 sq. ft 2,007 446 81.8%
Tree location
Located on curb 9,413 2,959 76.1% 262.78 1 <0.001
Located on median 549 484 53.1%
Observed traffic volume
Light 6,785 1,842 78.6%
Moderate 2,224 1,026 68.4% 280.49 2 <0.001
Heavy 806 530 60.3%
The physical location of the tree within the urban streetscape is also significant. Trees planted in
street medians have a poor chance at survival when compared to trees planted at the curbside. Traffic
volume also has an effect on young street tree mortality, with trees in low traffic areas faring better than
those planted in moderate or high traffic thoroughfares.
Another finding not explored here but worthy of discussion is that of missing trees. Of the over
13,000 trees visited in this study, nearly twenty percent of them were not present from their planted
location while only six percent were standing dead. Although these two groups were collapsed for the
purpose of discussing overall mortality, their large number warranted further analysis. We looked at
whether or not the populations of standing and dead trees were significantly different with respect to some
of our variables and found the following: trash in the tree pit is more common with dead trees than
missing; missing trees are more likely when a sidewalk is less than five feet wide; trees are more likely to
be missing than standing dead in a lawn strip than any other pit type. Missing trees are not statistically
linked to the following: street slope, presence of street parking, sidewalk condition, or traffic volume.
Urban forest managers in New York City agree that there are several possibilities of the fate of those
missing trees: vandalism, vehicular collision, or tree removal without subsequent replacement but,
regardless of the pathway, these missing trees are dead.
DISCUSSION
The highly local and specific nature of other published street tree mortality studies inspired this
study to examine which factors may affect mortality in New York City. New York City’s street tree
planting mortality rates are lower than those published for other cities (see Figure 1). Some possible
reasons for this distinction are: trees planted in New York City are planted by experienced contractors
working under the supervision of trained foresters, while other tree planting programs frequently use
volunteers with little or no planting experience (e.g. Nowak et al. 1990) or aren’t working with strict
contract specifications; and larger caliper trees (2.5-3‖) are planted in New York City, while smaller stock
was planted in other locations (Nowak et al. 1990; Gilbertson and Bradshaw 1990).
Table 8. Young street tree survival and select urban design factors

Lu et al: Factors afffecting young street tree mortality in New York City
12
In this manuscript we present a socio-ecological-design framework for future young street tree
mortality research, with the intention of facilitating the replication of this type of study in other urban
areas. Based on this work we have developed a Site Assessment Tools Description (available at
http://www.nyc.gov/parks/ystm), a step-by-step guide for city managers and researchers on how to assess
early street tree survival and mortality. Our hope is that other cities will replicate at least part of this study
and over time build up data sets which will allow for cross-city comparisons.
These preliminary results provide an initial understanding of some of the factors that are
important in the success and failure of young street trees planted in New York City, and provides direct
feedback that managers can use to refine NYC Parks’ planting practices and policies. Variation in
planting survival rates by species has important implications for the long-term dynamics of New York
City’s street tree population. In terms of a tree’s urban design and neighborhood context, this study
confirms the observations of many urban foresters that curbside trees planted in lawn strips and in low-
vehicular traffic areas are more likely to survive. This study also quantifies the disproportionately high
mortality rates of trees that are planted in street medians compared to trees located on the curb. Based on
this result, NYC Parks has already changed their planting policies for median trees, and is planting trees
in only the widest street medians, where adverse factors like collisions, salt exposure, and minimal soil
volume are less likely. Similarly, our observation of the effectiveness of tree guards in protecting young
street trees is corroborated by the experiences of NYC’s practicing urban foresters. Such demonstrated
effectiveness may justify the expense of securing street tree guards at the time of planting.
Our results suggest that civic stewardship and neighborhood sociability is a critical complement
to municipal management and investment in new street tree plantings. However, we have only started to
explore how the data we collected could be used to develop more comprehensive indices representing
stewardship or neighborhood sociability. The mechanisms that relate the signs of neighborhood
sociability – or even of other non-tree signs of stewardship – to improved tree survival cannot be revealed
through this study. While we hypothesize that active presence of residents on the street can serve to help
ensure that vandalism of trees does not occur, other qualitative methods such as interviews and repeated
social observational studies would be required to evaluate this hypothesis. Moreover, this study cannot
determine directionality of observed relationships. For example, the presence of stewardship activities in
Figure 1. Other newly-planted street tree mortality studies (Aggregated from Roman, 2006), including
the results from New York City.

Cities and the Environment 3(1):2010
13
nearby lawns and gardens may either inspire the care of street trees, or the presence of the new tree itself
may encourage other acts of local stewardship along the street.
The initial results presented here offer an important basis for urban planning programs as well as
for researchers interested in further exploring factors affecting tree canopy restoration efforts in the urban
environment. This is just the beginning of what we will be able to learn from the data we collected using
this integrated socio-ecological framework. The current MillionTreesNYC campaign aims to plant street
trees in every available and feasible sidewalk location across a wide range of site types in New York City,
but at other times and in other places, difficult choices must be made in terms of street tree planting
locations. Taken together, these biological, social, and urban design factors can be weighed by urban
foresters when designing and selecting the locations for street tree plantings and developing community
stewardship programs. Further analysis of our data set will assess the relative importance of these and the
remaining data variables that were collected during the field survey of these trees. As cities such as New
York continue to develop and implement comprehensive tree planting campaigns, these findings provide
insight in the field of natural resource management on the relationship between locations and
vulnerability; stewardship and sustainability.
ACKNOWLEDGEMENTS
The research presented in this paper was funded by the National Urban & Community Forestry
Advisory Council and the TREE Fund. The authors would like to thank the many people that made this
project possible: Fiona Watt and Ayla Zeimer, New York City Department of Parks & Recreation; Jason
Grabosky and Jessica Sanders, Rutgers University; Brian McGrath, Parsons The New School for Design;
all the interns who helped collect data for this project.
LITERATURE CITED
Berrang, P., D.F. Karnosky, and B.J. Stanton. 1985. Environmental factors affecting tree health in New
York City. Journal of Arboriculture 11(6):185-189.
Dwyer J.F., E.G. McPherson, H.W. Schroeder, and R.A. Rowntree. 1992. Assessing the benefits and
costs of the urban forest. Journal of Arboriculture. 18(5):227-234.
Fisher, D.R., E.S. Svendsen, and L.K. Campbell. 2007. Toward a framework for mapping urban environmental
stewardship. International Symposium on Society and Resource Management, published abstract.
http://www.docstoc.com/docs/50284639/List-of-Oral-Presentations-ISSRM-2007-(listed-in-
alphabetical (accessed 01/28/2011).
Foster, R.S. and J. Blaine. 1978. Urban tree survival: trees in the sidewalk. Journal of Arboriculture 4(1):
14-17.
Freudenburg, W.R., 1986. Social impact assessment. Annual Review of Sociology 12:451-478.
Gilbertson, P. and A.D. Bradshaw. 1985. Tree survival in cities: the extent and nature of the problem.
Arboricultural Journal 9:131-142.
Gilbertson, P. and A.D. Bradshaw. 1990. The survival of newly-planted trees in inner cities.
Arboricultural Journal 14:287-309.
Impens, R.A. and E. Delcarte. 1979. Survey of urban trees in Brussels, Belgium. Journal of Arboriculture
5(8):169-176.
Lu et al: Factors afffecting young street tree mortality in New York City
14
Jacobs, J. 1961. The Death and Life of Great American Cities. 1992 edition, Vintage Books, New York.
Jaenson, R., N. Bassuk, S. Schwager, and D. Headley. 1992. A statistical method for the accurate and
rapid sampling of urban street tree populations. Journal of Arboriculture 18(4):171-183.
McGrath, B., V. Marshall, M.L. Cadenasso, J.M. Grove, S.T.A. Pickett, R. Plunz, and J. Towers. 2007.
Designing Patch Dynamics. Columbia University, School of Architecture, Planning and
Preservation. New York. 250 pp.
Miller, R.H. and R.W. Miller. 1991. Planting survival of selected street tree taxa. Journal of
Arboriculture 17(7):185-191.
Nassauer, J.I. 1995. Messy ecosystems, orderly frames. Landscape Journal 14(2):161-169.
Nowak, D.J., J.R. McBride, and R.A. Beatty. 1990. Newly planted street tree growth and mortality.
Journal of Arboriculture 16 (5):124-129.
Nowak, D.J., M. Kuroda, and D.E. Crane. 2004. Tree mortality rates and tree population projections in
Baltimore, Maryland, USA. Urban Forestry and Urban Greening 2:139-147.
NYC Department of City Planning. 2005. MapPLUTO (Release 04C): NYC Department of City
Planning.
Pauleit, S., N. Jones, G. Garcia-Martin, J.L. Garcia-Valdecantos, L.M. Rivière, L. Vidal-Beaudet, M.
Bodson, and T.B. Randrup. 2002. Tree establishment practice in cities and towns -- Results from
a European survey. Urban Forestry and Urban Greening 5(3):111-120.
Richards, N.A. 1979. Modeling survival and consequent replacement needs in a street tree population.
Journal of Arboriculture 5(11):251-255.
Roman, L. 2006. Trends in street tree survival: Philadelphia, PA. University of Pennsylvania, Department
of Earth and Environmental Science, Master of Environmental Studies Capstone Project. 30 pp.
http://repository.upenn.edu/mes_capstones/4/. (accessed 01/28/2011).
Sydnor, D., J. Chatfield, D. Todd, and D. Balser,. 1999. Ohio street tree evaluation project. Ohio State
University and Ohio Department of Natural Resources. Bulletin 877-99.
http://www.dnr.state.oh.us/forestry/urban/ostep/ostepintro/tabid/5546/Default.aspx. (accessed
05/01/2010).
Sun, W.-Q. and N. Bassuk. 1991. Approach to determine effective sampling size for urban street tree
survey. Landscape and Urban Planning 20(4):277-283.
Wilson, J.Q. and G. Kelling. 1982. The police and neighborhood safety: Broken windows. Atlantic
Monthly 127:29-38.

Cities and the Environment 3(1):2010
15
Jacqueline W.T. Lu, Forestry, Horticulture, and Natural Resources, City of New York Department of
Parks and Recreation, Olmsted Center, Flushing Meadows Corona Park, Flushing, NY, 11368,
Erika S. Svendsen, USDA Forest Service Northern Research Station, 290 Broadway, 26th Floor, New
York, NY 10007, [email protected]
Lindsay K. Campbell, USDA Forest Service Northern Research Station, 290 Broadway, 26th Floor, New
York, NY 10007, [email protected]
Jennifer Greenfeld, Central Forestry & Horticulture, City of New York Department of Parks and
Recreation, Olmsted Center, Flushing Meadows Corona Park, Flushing, NY, 11368,
Jessie Braden, Central Forestry & Horticulture, City of New York Department of Parks and Recreation,
Olmsted Center, Flushing Meadows Corona Park, Flushing, NY, 11368,
Kristen L. King, Forestry, Horticulture, and Natural Resources, City of New York Department of Parks
and Recreation, Olmsted Center, Flushing Meadows Corona Park, Flushing, NY, 11368,
Nancy Falxa-Raymond, Department of Ecology, Evolution, and Environmental Biology, Columbia
University, New York, NY, 10027, [email protected]
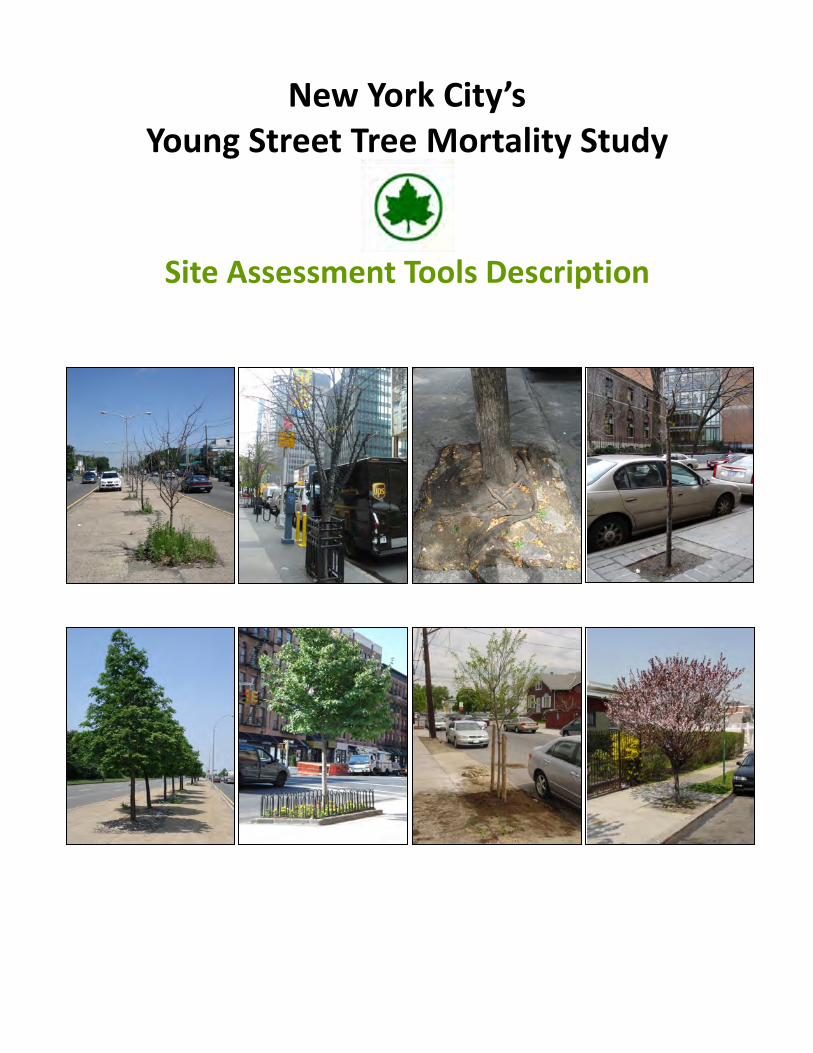
New York City’s Young Street Tree Mortality Study
Site Assessment Tools Description
2
New York City’s Urban Street Tree Mortality Study Site Assessment Tools Description
Table of Contents
Introduction .......................................................................................................................... 5
Site Types .............................................................................................................................. 7
Field Data Indicators ............................................................................................................ 10
Methods .............................................................................................................................. 13
Recommendations ............................................................................................................... 16
Appendix I: Field Observation Guide ..................................................................................... 17
Appendix II: Literature Review ............................................................................................. 32

3

4
New York City’s Urban Street Tree Mortality Study
Site Assessment Tools Description
Credits
NYC Parks & Recreation Fiona Watt: Assistant Commissioner Forestry, Horticulture, Natural Resources
Jennifer Greenfeld: Director, Street Tree Planting Jacqueline Lu: Director, Research & Analysis
Jessie Braden: GIS Project Manager Nancy Falxa-Raymond: Forestry Analyst
Ayla Zeimer: Project Coordinator Interns
Tasha Angelet, John Bigulski, Talia Chapman, Lee Cronin-Fine, Akiva Fishman, Julian Gantt, Kristen King, Natalie Little, Colin Mew, Chenchau Lu, Victoria Sade, Philip Silva, Allen Strouse, Kate Tuttle, Eva Williamson, and Winnie
Yu and assistance from Douglas Still.
USDA Forest Service Northern Research Station Erika Svendsen: Research Social Scientist
Lindsay Campbell: Research Social Scientist
Rutgers University Jason Grabosky: Assistant Professor, John Kuser Faculty Scholar for Urban and Community Forestry
Parsons, The New School for Design
Brian McGrath: Associate Professor of Urban Design
October 2010
City of New YorkParks & RecreationMichael R. Bloomberg, MayorAdrian Benepe, Commissioner

5
6
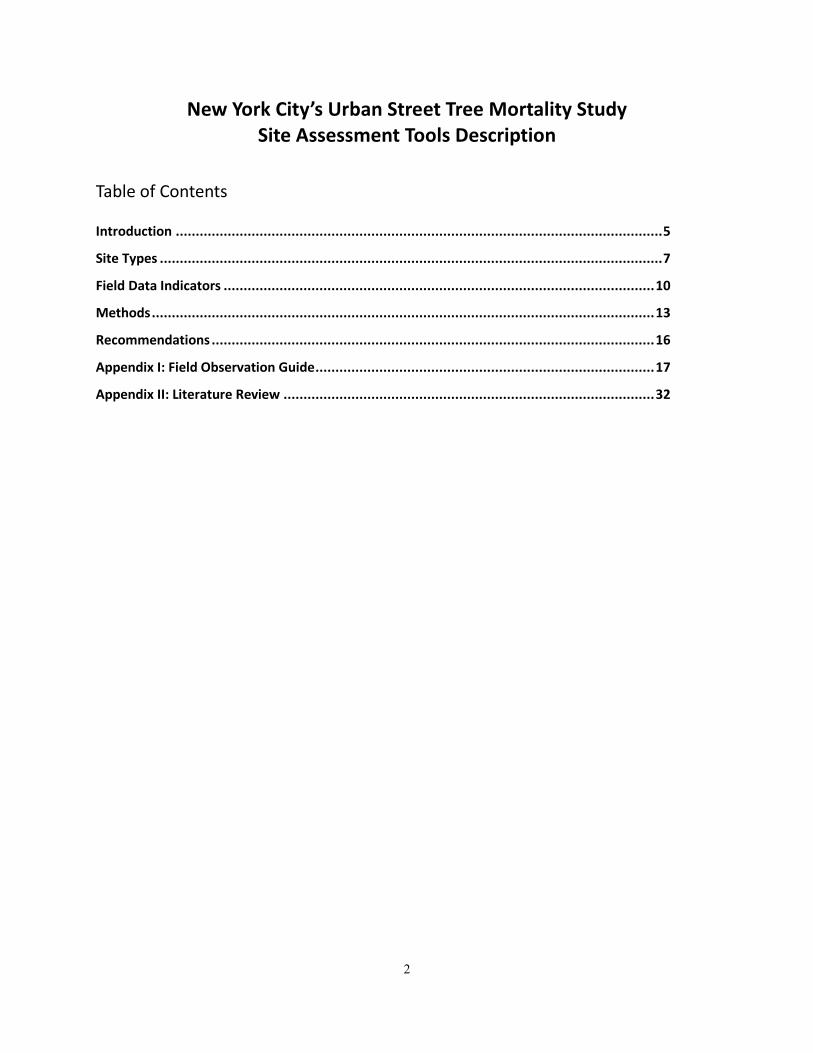
INTRODUCTION Background It is assumed that the early years, from 5 to 10 years after planting, are critical to the establishment of a healthy ur-ban street tree. Yet little is known about the factors or sig-nificant relationships that ultimately contribute to tree mortality or survival. This project provides a context in which to understand how social, biophysical and neighbor-hood design factors impact the establishment of street trees. The project brought together a multi-disciplinary set of researchers and practitioners to study the condi-tions of the urban street tree in an unprecedented study of unique spatial design, scale and intensity. One of the fundamental challenges to city managers and civic groups is to ensure the survival of newly planted street trees in places as dynamic and diverse as cities. Because residents and managers value the health and benefits of an older tree canopy, we need ensure that what we plant today will live as long as this older stock. Population growth, vehicular traffic, poor air quality and building and sidewalk designs all present challenges to the contemporary urban street trees. Yet in order to maximize proven urban forestry benefits (both biophysical and so-cial), trees must reach maturity. While there is much research on soil regimes, nursery stock, and species selection, survival rates still vary widely—from 34.7% to 99.7% according to a re-cent review of the literature (Roman, 2006). As cities around the United States increase their investment in tree planting, we must be able to ensure the trees’ best chance of survival. The Purpose of This Report This report is intended to provide a step by step guide for city managers and researchers on how to assess early street tree survival and mortality. While it is based on the 2006/2007 study completed in New York City, it does not report its results. Rather it provides a detailed look at what data we collected and why in order to serve as a stand-alone guidance document. Our hope is that other cities will replicate at least part of this study in order to add to the profes-sion’s body of knowledge about early tree planting success in ways that allows us to compare our successes and learn from one another. About the Study Funded by the National Urban and Community Forestry Advisory Council and the Tree Fund, the New York City Department of Parks & Recreation (Parks) assembled a multi-disciplinary team of researchers to develop preliminary hypotheses and data collection tools. The data set consisted of 45,000 street trees planted by Parks between 1999 and 2003. Street tree locations varied widely, from concrete downtown to grassy outer borough. The team used a combined study approach that examined social (presence of garbage, stewardship, graffiti, etc), biological (soil compaction, tree condition, etc.) and physical (street width, building height, street slope,

7
etc.) factors with the potential to impact trees in the first decade of street tree establishment. The study investigated factors on two scales. First, we looked at the entire tree population us-ing existing data sets. Second we sampled 14,000 street trees from the larger group of trees , visited them, and collected over 40 additional pieces of related data.
All field work was conducted by interns hired and trained by Parks. Data collection took two summers (2006 and 2007). Interns used a survey tool on palm pilots to record data in the field.

8
SITE TYPES New York City, with a population of eight million people and five different boroughs, is a het-erogeneous urban landscape with a wide variety of sit types. Each site type provides a different growing environment and different challenges for street trees. The most common site types are: 1. Skyscraper dominated business districts
These streets resemble canyons of concrete, steel, and glass. There is high pedestrian and car traffic, reduced sunlight and likely increased water pollu-tion.
2. Residential neighborhoods with high-rise apart-
ment buildings These residential areas have very tall buildings with thousands of tenants, but they have little if any street level commerce.
3. Densely populated residential neighborhoods with 1, 2, or 3
family homes These residential neighborhoods are filled with smaller build-ings with no more than three units each. Although these blocks are densely populated, but less dense than #2 above, there is little if any commerce.
4. Suburban-like neighborhoods with lawns in front
of single family homes These neighborhoods have low buildings on rela-tively large properties and residents often own rather than rent their homes.
9
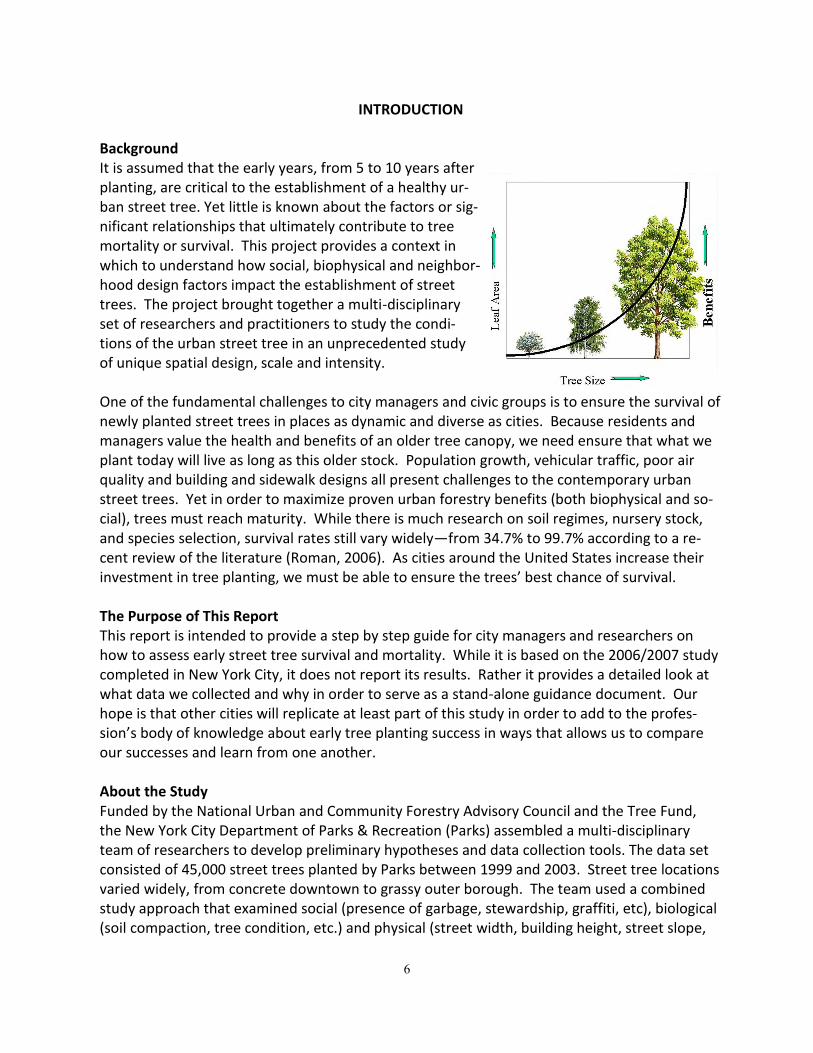
5. Industrial districts Industrial districts’ activities are typically limited to the early part of the day when streets are filled with trucks loading and unloading merchandise. At all other times these neighborhoods are relatively de-void of street life.
6. Neighborhood commercial centers Pedestrians, outdoor vendors, and delivery trucks all compete for limited sidewalk space in these areas, which serve as commercial centers for local resi-dents. These blocks may or may not include resi-dences above the shops, but the street level is dominated by commerce.
7. Big box shopping districts
Vehicle traffic, pollution, limited soil volume, and extreme heat from an abundance of reflective sur-faces characterize these shopping districts.
8. Neighborhoods in transition from industrial to resi-dential. In the past decade, many city neighborhoods have seen a conversion of industrial zones to residential neighborhoods. These areas have industrial condi-tions side by side with large-scale construction of new high-rise residential buildings. Street tree plant-ings typically accompany the construction of new residences.
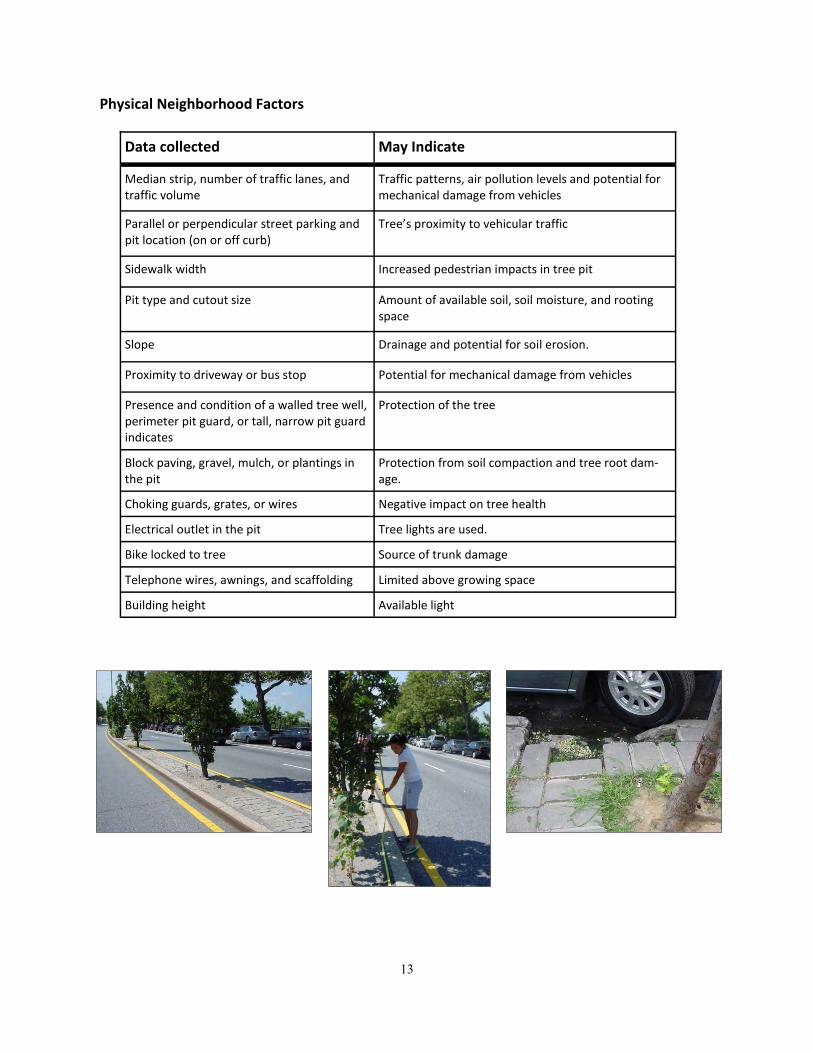
9. Low-density residential neighborhoods in transition from high vacancy rates to new homes In these neighborhoods old and/or vacant houses are torn down and are replaced by new low-density residential buildings. Often the new buildings are larger with the new footprints occupying more space than the previous building.

10
10. Waterfront neighborhoods These communities may have any number of residential or commercial development but share harsh environmental conditions with salt spray and wind.

11
Field Data Indicators The data collected comprised of 42 criteria grouped with three broad areas: biological, sociabil-ity and stewardship, and physical. Below is a list of the data categories including the rationale behind each one. Please note that several indicators are cross-listed due to their applicability to more than one category. Biological Factors
Data collected May indicate
Sucker growth, leaf chlorosis, insect/disease damage, twig dieback, whole branch dieback, broken branches, unnatu-ral lean, or trunk wound.
Overall tree health
Diameter at breast height, time in ground, species
Growth rates
Planting too high, soil erosion Tree root damage, storm water damage
Planting too low, added soil level Trunk decay
Compacted soil Soil moisture and oxygen levels
Pooling water Compacted soil
Tree pit opening Soil moisture
Animal scat Soil chemistry, animal urine
Strong wind Growth rate

12
Sociability and Stewardship Factors
Data collected May Indicate
Type of front yard and barrier, visibility into front yard, presence of play equipment, presence and condition of garden, ground floor door in vicinity of tree, seating area, porch, stoop, ramp, balcony, type of building security, door decorations, flower planters, or flag.
Building sociability
Chalk or art on the sidewalk, murals, and public facilities.
Neighborhood sociability
Amount of loose trash, canopy debris, graffiti, broken windows, vacancies.
Neighborhood decay
Citizen encounters Public perception of urban street trees
Evidence of pruning, bench, bird feeder, or sign-age in tree pit; evidence of weeding; tree gator bag
Tree stewardship
Presence and condition of a walled tree well, pe-rimeter pit guard, or tall, narrow pit guard
Protection of the tree
Block paving, gravel, mulch, or plantings in the pit Protection from soil compaction and tree root damage.
Choking guards, grates, or wires; electrical outlet in the pit; bicycle locked to tree; tree lights
Negative attitudes or lack of understanding about street tree care
13
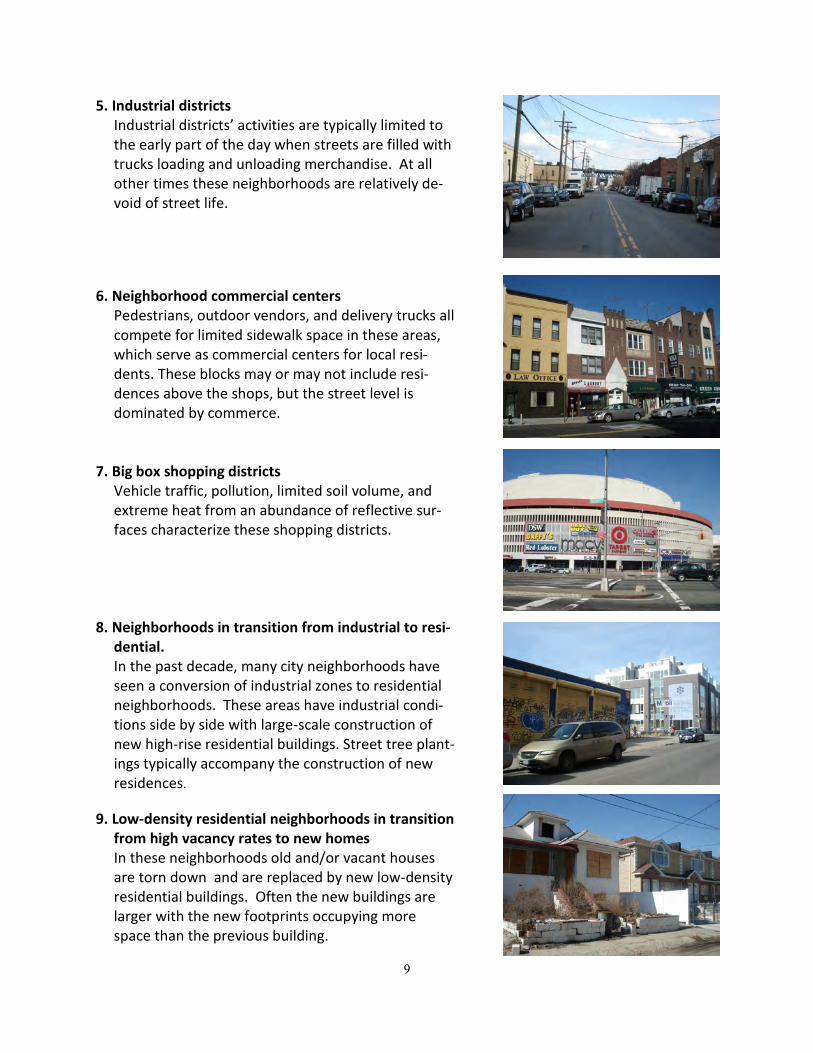
Physical Neighborhood Factors
Data collected May Indicate
Median strip, number of traffic lanes, and traffic volume
Traffic patterns, air pollution levels and potential for mechanical damage from vehicles
Parallel or perpendicular street parking and pit location (on or off curb)
Tree’s proximity to vehicular traffic
Sidewalk width Increased pedestrian impacts in tree pit
Pit type and cutout size Amount of available soil, soil moisture, and rooting space
Slope Drainage and potential for soil erosion.
Proximity to driveway or bus stop Potential for mechanical damage from vehicles
Presence and condition of a walled tree well, perimeter pit guard, or tall, narrow pit guard indicates
Protection of the tree
Block paving, gravel, mulch, or plantings in the pit
Protection from soil compaction and tree root dam-age.
Choking guards, grates, or wires Negative impact on tree health
Electrical outlet in the pit Tree lights are used.
Bike locked to tree Source of trunk damage
Telephone wires, awnings, and scaffolding Limited above growing space
Building height Available light

14
Methods
Sampling Plan Trees were selected for inclusion in the study using a partial inventory technique based on stratified random sampling (Sun and Bassuk, 1991 and Jaenson et al., 1992). A 14,000 tree sam-ple was pulled from a 45,000 tree data set. The sample was stratified by time in-ground and land use. A sampling plan was developed to determine the required sample size for each plant-ing period and land use grouping.
A random number was assigned to each of the 45,000 records using a script in the GIS. The records were exported in groups based on their land use and planting period. In Ex-cel, the records for each exported group were sorted by the random number. The highest random number to be included in the sample (based on required sample size per planting period/land use) was noted. The records with a sample number within the required range were given an attribute in the GIS field, “InSamp.” The final sample contained 14,090 trees.
The data was stratified by time in ground and land use. To confirm a large enough sample size, some land use categories were combined.
15
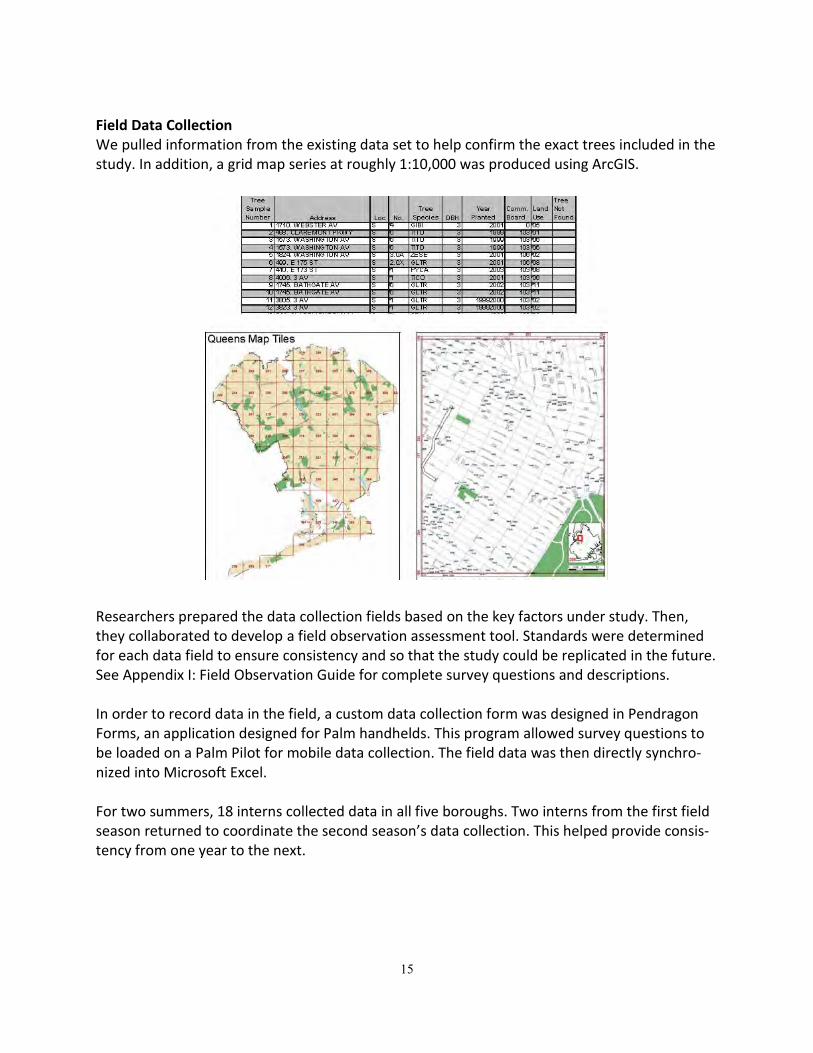
Field Data Collection We pulled information from the existing data set to help confirm the exact trees included in the study. In addition, a grid map series at roughly 1:10,000 was produced using ArcGIS.
Researchers prepared the data collection fields based on the key factors under study. Then, they collaborated to develop a field observation assessment tool. Standards were determined for each data field to ensure consistency and so that the study could be replicated in the future. See Appendix I: Field Observation Guide for complete survey questions and descriptions. In order to record data in the field, a custom data collection form was designed in Pendragon Forms, an application designed for Palm handhelds. This program allowed survey questions to be loaded on a Palm Pilot for mobile data collection. The field data was then directly synchro-nized into Microsoft Excel. For two summers, 18 interns collected data in all five boroughs. Two interns from the first field season returned to coordinate the second season’s data collection. This helped provide consis-tency from one year to the next.
16
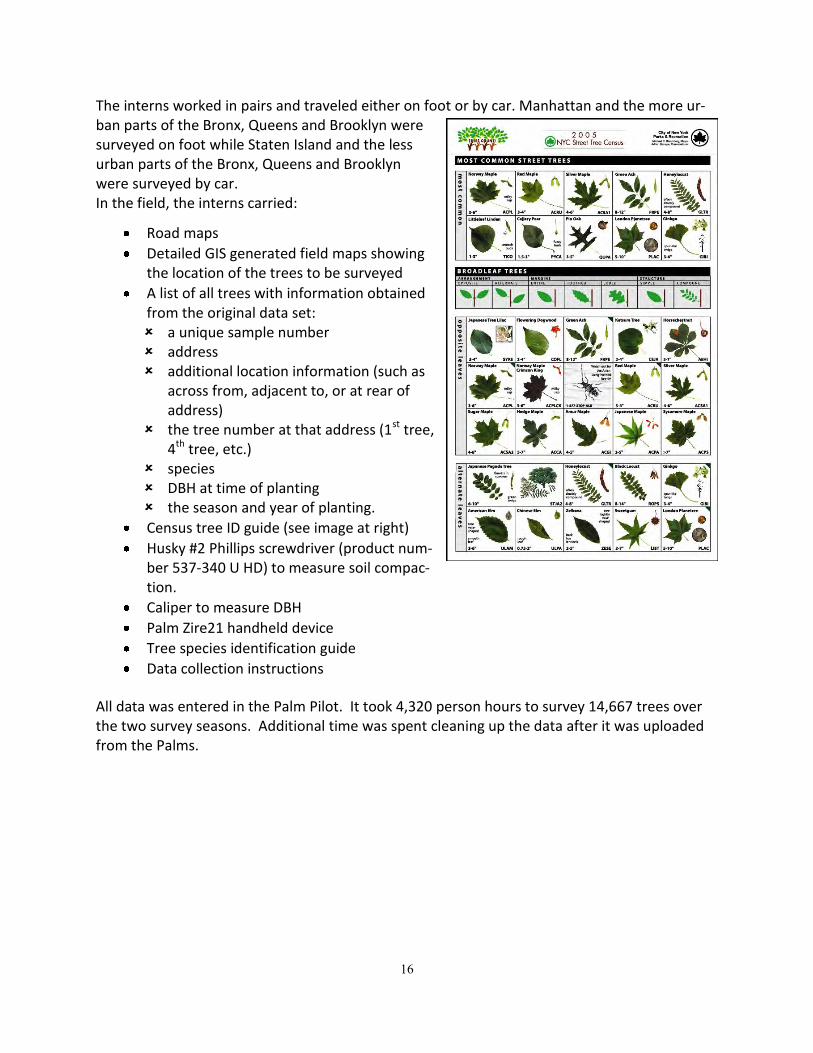
The interns worked in pairs and traveled either on foot or by car. Manhattan and the more ur-ban parts of the Bronx, Queens and Brooklyn were surveyed on foot while Staten Island and the less urban parts of the Bronx, Queens and Brooklyn were surveyed by car. In the field, the interns carried:
Road maps
Detailed GIS generated field maps showing the location of the trees to be surveyed
A list of all trees with information obtained from the original data set: a unique sample number address additional location information (such as
across from, adjacent to, or at rear of address)
the tree number at that address (1st tree, 4th tree, etc.)
species DBH at time of planting the season and year of planting.
Census tree ID guide (see image at right)
Husky #2 Phillips screwdriver (product num-ber 537-340 U HD) to measure soil compac-tion.
Caliper to measure DBH
Palm Zire21 handheld device
Tree species identification guide
Data collection instructions
All data was entered in the Palm Pilot. It took 4,320 person hours to survey 14,667 trees over the two survey seasons. Additional time was spent cleaning up the data after it was uploaded from the Palms.

17
Recommendations
In preparing for this study and in the course of two summers of data collection clean up, we have collected a vast amount of wisdom and some recommendations on the best ways to conduct such a study. What follows are some of the key suggestions useful for similar efforts.
Verify Tree Locations Finding and confirming the study tree was the single most time consuming part of the study. It is important to keep excellent records on planting location from the initial time of planting using whatever method is preferred, such as GPS, geocoding, or address asso-ciation.
Confirm the Quality of Data Sets If possible, it is important to field verify remotely gathered data. For example, we found the city generated land use designation for the parcel associated with the study tree did not always match field conditions. In fact they only matched 52% of the time.
Avoid Extraneous Variables Some data proved may be less useful than we had hoped. For example: pooling water and measured compaction is highly impacted by recent rainfall. Other data was difficult to detect: e.g. weeded pits and strong winds.
Consider Importance of Rarely Occurring Variables Some data, such as electrical outlets or tall tree guards were found so rarely, that it is dif-ficult to make any conclusions about the impact of their presence; however, if combined with data from other cities, we may be able to gain useful insight.
Streamline Data Collection Fields It is important to test the data collection tool before the collection instrument is finalized. We found that by carefully organizing the order in which the fields were listed, the choices within each field, and the default responses, we could streamline data collection signifi-cantly. For example, we placed the tree condition choice “good” first on the check off list since that one was most often noted. In addition, we kept all of the items that required examining a specific location together; area around the base of the tree, tree canopy, street area, and adjacent building required different places to look and these observations were grouped. In addition we ordered fields so that later ones built on information col-lected in earlier fields. For example, we placed overall tree condition in the list after the more specific health assessments (such as tree damage).
Standardize Data Collection with Visuals Data collection standards must be clearly defined with detailed descriptions and photos.

18
Appendix I
Field Observation Guide Data for over 14,000 randomly selected street trees planted between 1999 and 2003 and stratified by land use and planting period, was collected using palm pilots loaded with Pendragon Forms. The following list details what data was collected and how it was collected and entered into the Palm. Bold face type indicates the exact word-ing as it appeared in the palm pilot. I. Preliminary The following four entries need to be completed in order for the data to be saved Tree Inventory # This number is automatically generated by the palm pilot. Each palm is set so that its unique number will not over-lap with another palm. Tree Sample # This unique number is entered manually and corresponds to the sample number on the list of trees. Date & Time These two entries record the date and time the survey was performed. The palm pilot is programmed with the current date and time so that the two entries need only to be confirmed in order for both to be recorded. Team & Team 2 These two entries include the initials or code numbers of the team members that filled out the survey for that individual tree sample. II. Tree Level This portion of the survey refers to the tree itself and the building the tree is located in front of.
1. Median Strip: Yes / No Note whether there is a median present. Check even if the tree is located in the median. If tree is located in median strip, then the following questions should not be answered: pit off curb (5), ground floor door (24), building type (25), front yard (26), Sociability (27) , Building/façade (28), Building Security (29), Building Stewardship (30), Building Stories (31). The following should only be answered if the tree is planted in a sidewalk cutout in the median: sidewalk width (4) and sidewalk condition (9).
2. # Traffic Lanes: limited list of 1-10
Count the number of traffic lanes, including parking lanes. 3. On Street Parking Yes / No
Parallel o Perpendicular o
Perpendicular Parallel parking
Median

19
Select yes if there is parking directly in front of specified tree. If there is parking, check only one box to indicate if the parking is parallel to the curb or perpendicular to the curb.
4. Sidewalk Width: select one <5, 5-10, 10-15, >15 Estimate the sidewalk width (in feet) from the tree pit edge to the point where the sidewalk meets a limited object, e.g. porch, lawn, fence, stoop, building. This was not measured with a meas-uring tape.
5. Pit Off Curb: Yes / No
Note whether the tree pit is located along the curb (select No) or at least five feet off the curb (Yes).
6. Pit Type
Select one of the three choices: Sidewalk-a pit cut out of the paved sidewalk surface. Continuous- pit with two or more trees planted in a shared
sidewalk cut out or growing space with block paving in be-tween trees.
Lawn- trees planted in a curb strip dominated by grass or soil.
7. Cutout Size
For sidewalk pits: use a measuring tape to measure the length (side parallel to the curb) and the width (side perpendicular to the curb). For lawn or continuous pits, use a measuring tape to measure only the width. Count the number of trees in the stretch of lawn pit (or number that could fit) and put that number in continuous pit length. If there is a double/parallel row of trees, only count the number which would indicate the length of the pit.
8. Is there a Slope Yes / No
Use your eye/judgement to determine if a slope is present. A slope indicates the whole street, not just within the pit. Select the placement of the tree in relationship to the slope.
Sidewalk < 5 feet Sidewalk 5-10 feet
Sidewalk 10-15 feet Sidewalk > 15 feet
Pit on curb
Pit off curb
Sidewalk pit
Lawn pit
Continuous pit
20
Degree of Slope: select one Low, Med, High Slope Placement: select one Bottom, Middle, Top
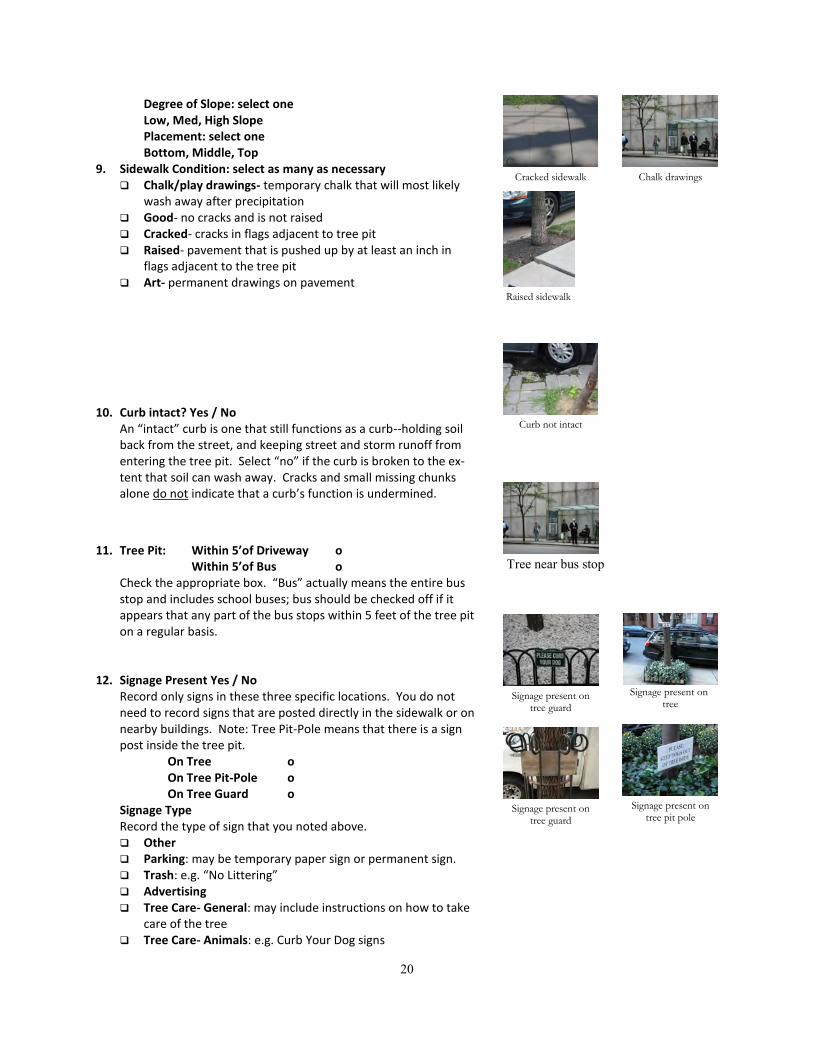
9. Sidewalk Condition: select as many as necessary Chalk/play drawings- temporary chalk that will most likely
wash away after precipitation Good- no cracks and is not raised Cracked- cracks in flags adjacent to tree pit Raised- pavement that is pushed up by at least an inch in
flags adjacent to the tree pit Art- permanent drawings on pavement
10. Curb intact? Yes / No
An “intact” curb is one that still functions as a curb--holding soil back from the street, and keeping street and storm runoff from entering the tree pit. Select “no” if the curb is broken to the ex-tent that soil can wash away. Cracks and small missing chunks alone do not indicate that a curb’s function is undermined.
11. Tree Pit: Within 5’of Driveway o
Within 5’of Bus o Check the appropriate box. “Bus” actually means the entire bus stop and includes school buses; bus should be checked off if it appears that any part of the bus stops within 5 feet of the tree pit on a regular basis.
12. Signage Present Yes / No
Record only signs in these three specific locations. You do not need to record signs that are posted directly in the sidewalk or on nearby buildings. Note: Tree Pit-Pole means that there is a sign post inside the tree pit.
On Tree o On Tree Pit-Pole o On Tree Guard o
Signage Type Record the type of sign that you noted above. Other Parking: may be temporary paper sign or permanent sign. Trash: e.g. “No Littering” Advertising Tree Care- General: may include instructions on how to take
care of the tree Tree Care- Animals: e.g. Curb Your Dog signs
Raised sidewalk
Cracked sidewalk Chalk drawings
Curb not intact
Tree near bus stop
Signage present on tree
Signage present on tree pit pole
Signage present on tree guard
Signage present on tree guard

21
Tree Care- Stewardship: indicates who takes care of the tree. This could be a block group, business improvement zone, or an individual.
Commemorative: Indicates the tree was planted to memori-alize a person or event, or in honor of someone.
13. Site Conditions: Check as many as apply
Planted too High: top of root ball visible, surface woody roots do not count.
Planted too Low: cannot see the flared base of the tree trunk.
Choking Wires: wires that restrict growth of tree. Water Pooling: water pooled in tree pit at time of inspec-
tion. 14. Soil Compaction
Use a Husky #2 Phillips head screwdriver to determine the level of difficulty to penetrate the soil. Measure the soil one foot from the trunk of the tree. If you can feel a rock or other solid impedi-ment, try shifting the screwdriver slightly.
Difficult/Impossible to Penetrate- this means that a great amount of force is required to push screwdriver into soil or the soil is impossible to penetrate.
Easy to Penetrate- little to moderate amount of force is re-quired to penetrate soil.
15. Pit Soil Level
Planted too high Planted too low
Choking wires
Soil compaction
Erosion Added soil
22
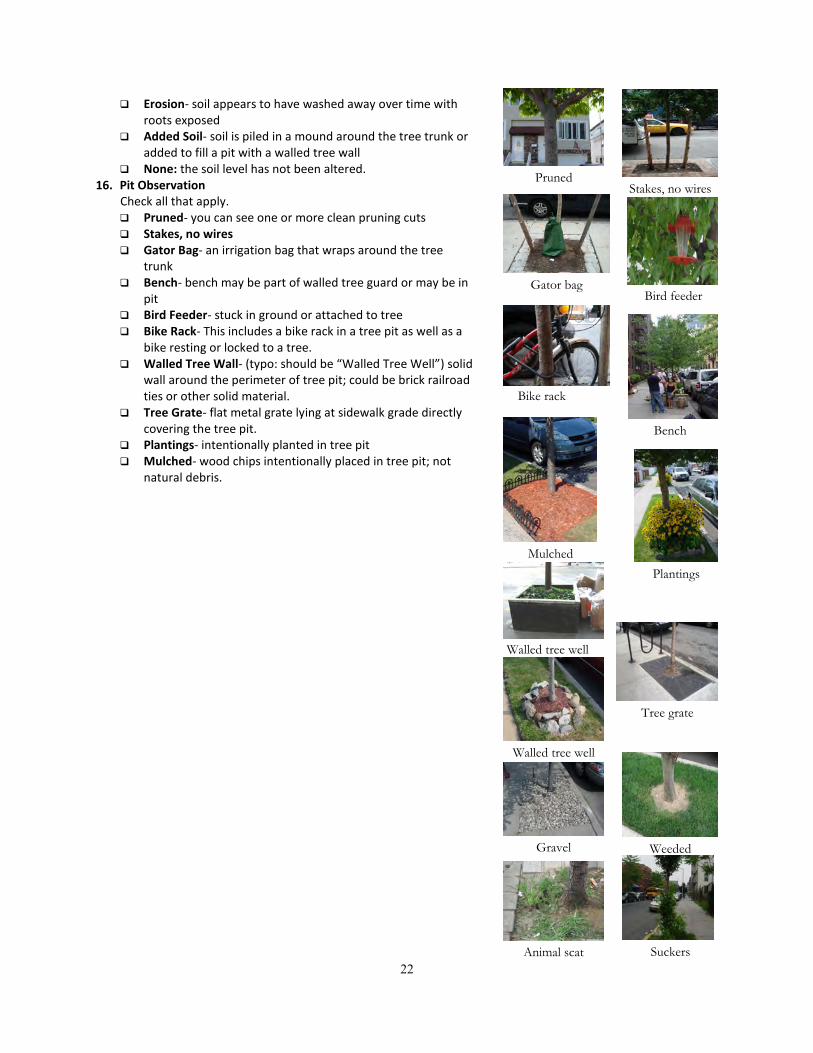
Erosion- soil appears to have washed away over time with roots exposed
Added Soil- soil is piled in a mound around the tree trunk or added to fill a pit with a walled tree wall
None: the soil level has not been altered. 16. Pit Observation
Check all that apply. Pruned- you can see one or more clean pruning cuts Stakes, no wires Gator Bag- an irrigation bag that wraps around the tree
trunk Bench- bench may be part of walled tree guard or may be in
pit Bird Feeder- stuck in ground or attached to tree Bike Rack- This includes a bike rack in a tree pit as well as a
bike resting or locked to a tree. Walled Tree Wall- (typo: should be “Walled Tree Well”) solid
wall around the perimeter of tree pit; could be brick railroad ties or other solid material.
Tree Grate- flat metal grate lying at sidewalk grade directly covering the tree pit.
Plantings- intentionally planted in tree pit Mulched- wood chips intentionally placed in tree pit; not
natural debris.
Bike rack
Walled tree well
Tree grate
Gravel
Animal scat Suckers
Gator bag
Walled tree well
Weeded
Bird feeder
Plantings
Mulched
Pruned Stakes, no wires
Bench
23
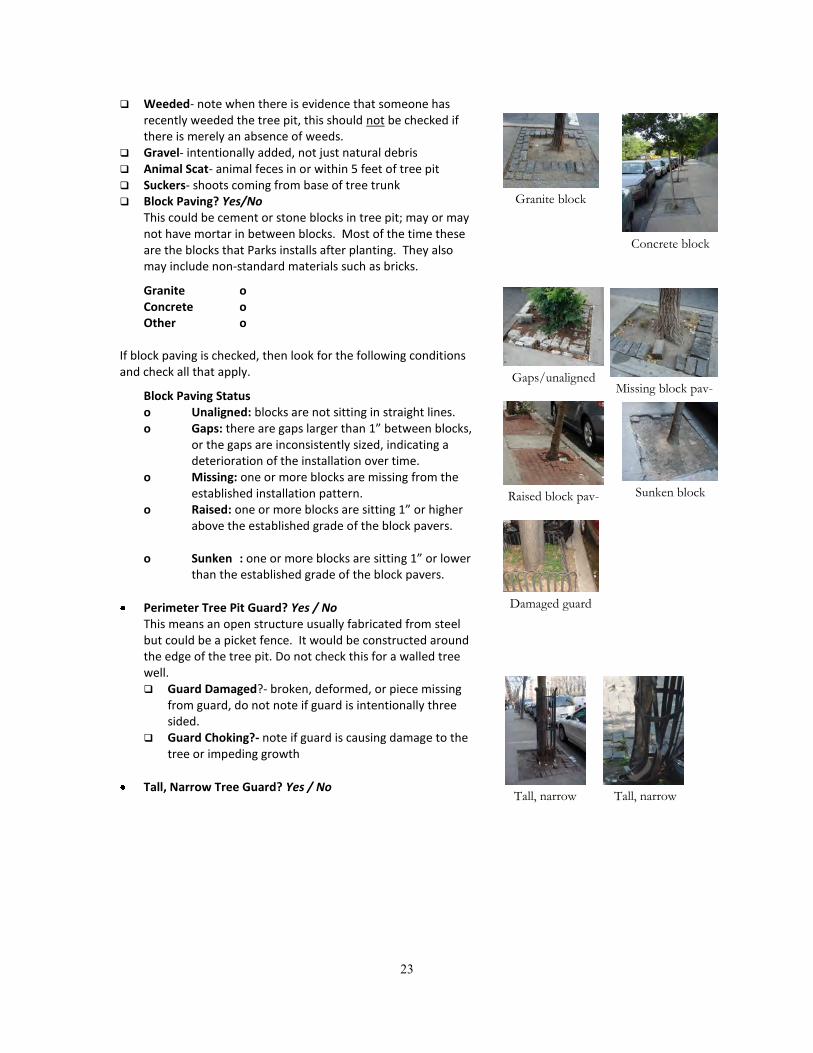
Weeded- note when there is evidence that someone has recently weeded the tree pit, this should not be checked if there is merely an absence of weeds.
Gravel- intentionally added, not just natural debris Animal Scat- animal feces in or within 5 feet of tree pit Suckers- shoots coming from base of tree trunk Block Paving? Yes/No
This could be cement or stone blocks in tree pit; may or may not have mortar in between blocks. Most of the time these are the blocks that Parks installs after planting. They also may include non-standard materials such as bricks.
Granite o Concrete o Other o
If block paving is checked, then look for the following conditions and check all that apply.
Block Paving Status o Unaligned: blocks are not sitting in straight lines. o Gaps: there are gaps larger than 1” between blocks,
or the gaps are inconsistently sized, indicating a deterioration of the installation over time.
o Missing: one or more blocks are missing from the established installation pattern.
o Raised: one or more blocks are sitting 1” or higher above the established grade of the block pavers.
o Sunken : one or more blocks are sitting 1” or lower than the established grade of the block pavers.
Perimeter Tree Pit Guard? Yes / No This means an open structure usually fabricated from steel but could be a picket fence. It would be constructed around the edge of the tree pit. Do not check this for a walled tree well. Guard Damaged?- broken, deformed, or piece missing
from guard, do not note if guard is intentionally three sided.
Guard Choking?- note if guard is causing damage to the tree or impeding growth
Tall, Narrow Tree Guard? Yes / No
Damaged guard
Tall, narrow Tall, narrow
Granite block
Concrete block
Sunken block
Missing block pav-Gaps/unaligned
Raised block pav-

24
These are usually made from steel or some other metal and are constructed close to the tree trunk within the tree pit. Guard Damaged? - broken, deformed, or piece missing
from guard Guard Choking? - causing damage to tree; impeding
growth 17. Loose Trash? Yes / No
Look for trash in and around the tree.
In Tree Pit o On Sidewalk o Against Building o
Man-made o Natural Debris o Include grass clippings; wood chips; fallen, or collected tree branches
Trash Amount Light Heavy
18. Tree Damage Yes / No
Leaf Chlorosis- yellowing of leaves throughout the tree Insect Disease/Damage- could be any number of signs in-
cluding small holes around the trunk; spots on leaves, holes in leaves, insect skeletons.
Twig Dieback- dead twigs at the tips of branches throughout tree
Whole Branch Dieback- dead branch or branches; does not include broken branches
Light man-made Heavy man-made
Light man-made Heavy man-made
Natural debris
Leaf Chlorosis Insect/Disease
Whole branch dieback
Twig dieback Broken branch
Unnatural lean
Trunk wound

25
Broken Branch- broken part of branch may or may not be there
Unnaturally Lean- (typo: should be “Unnatural Lean”) entire tree leaning in one direction
Trunk Wound- at least one unhealed or healed wound; deeper than bark
19. Infrastructure Conflicts? Yes / No Canopy Debris- large or significant amount of trash stuck
either in canopy or intersection of branch and trunk, this could include plastic bags (not just one bag), shoes, etc.
Paved to Trunk- pavement extends to the base of trunk; could be solid concrete or paving blocks/bricks
Choked by Guard/Grate- causing damage to tree; impeding growth
Tree Lights- lights wrapped around trunk and/or branches Electrical Outlet- in tree pit Bagged Trash in Pit Other- examples include wires (marked “tw”)
20. Pavement in Canopy Zone
Estimate how much of the tree’s canopy covers paved surfaces. 0 – 24% 25 – 49% 50 – 74% 75 – 100%
Choked by tree guard
Bagged trash in
Canopy debris
Paved to trunk
Choked by grate
Electrical outlet in tree
Telephone wires
0-24%
25-49%
50-74% 75-100%
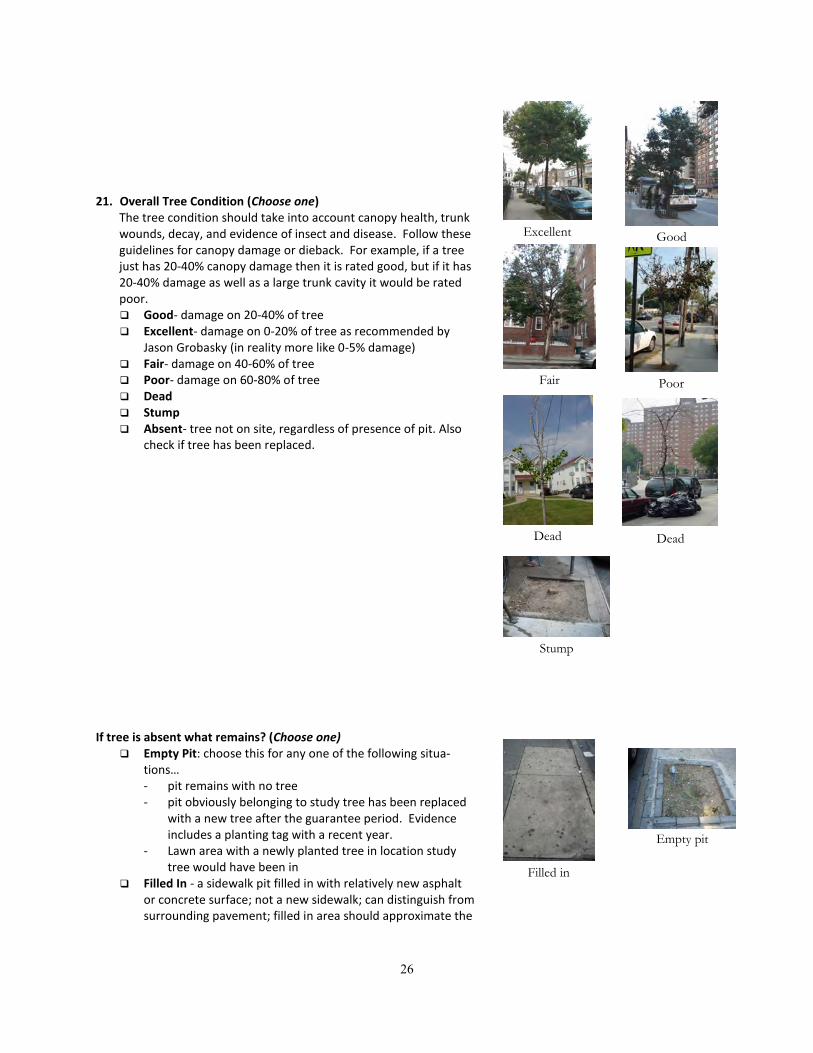
26
21. Overall Tree Condition (Choose one)
The tree condition should take into account canopy health, trunk wounds, decay, and evidence of insect and disease. Follow these guidelines for canopy damage or dieback. For example, if a tree just has 20-40% canopy damage then it is rated good, but if it has 20-40% damage as well as a large trunk cavity it would be rated poor. Good- damage on 20-40% of tree Excellent- damage on 0-20% of tree as recommended by
Jason Grobasky (in reality more like 0-5% damage) Fair- damage on 40-60% of tree Poor- damage on 60-80% of tree Dead Stump Absent- tree not on site, regardless of presence of pit. Also
check if tree has been replaced. If tree is absent what remains? (Choose one)
Empty Pit: choose this for any one of the following situa-tions… - pit remains with no tree - pit obviously belonging to study tree has been replaced
with a new tree after the guarantee period. Evidence includes a planting tag with a recent year.
- Lawn area with a newly planted tree in location study tree would have been in
Filled In - a sidewalk pit filled in with relatively new asphalt or concrete surface; not a new sidewalk; can distinguish from surrounding pavement; filled in area should approximate the
Excellent Good
Fair Poor
Dead Dead
Stump
Empty pit
Filled in
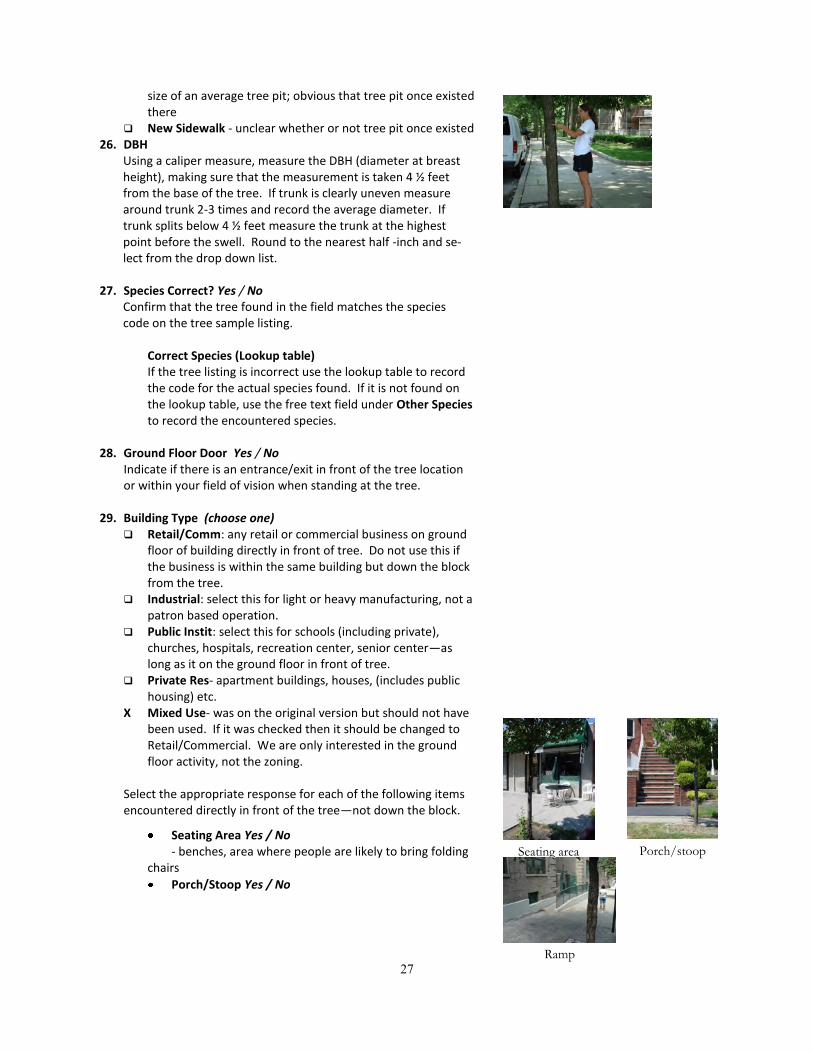
27
Seating area Porch/stoop
Ramp
size of an average tree pit; obvious that tree pit once existed there
New Sidewalk - unclear whether or not tree pit once existed 26. DBH
Using a caliper measure, measure the DBH (diameter at breast height), making sure that the measurement is taken 4 ½ feet from the base of the tree. If trunk is clearly uneven measure around trunk 2-3 times and record the average diameter. If trunk splits below 4 ½ feet measure the trunk at the highest point before the swell. Round to the nearest half -inch and se-lect from the drop down list.
27. Species Correct? Yes / No
Confirm that the tree found in the field matches the species code on the tree sample listing.
Correct Species (Lookup table) If the tree listing is incorrect use the lookup table to record the code for the actual species found. If it is not found on the lookup table, use the free text field under Other Species to record the encountered species.
28. Ground Floor Door Yes / No
Indicate if there is an entrance/exit in front of the tree location or within your field of vision when standing at the tree.
29. Building Type (choose one)
Retail/Comm: any retail or commercial business on ground floor of building directly in front of tree. Do not use this if the business is within the same building but down the block from the tree.
Industrial: select this for light or heavy manufacturing, not a patron based operation.
Public Instit: select this for schools (including private), churches, hospitals, recreation center, senior center—as long as it on the ground floor in front of tree.
Private Res- apartment buildings, houses, (includes public housing) etc.
X Mixed Use- was on the original version but should not have been used. If it was checked then it should be changed to Retail/Commercial. We are only interested in the ground floor activity, not the zoning.
Select the appropriate response for each of the following items encountered directly in front of the tree—not down the block.
Seating Area Yes / No - benches, area where people are likely to bring folding
chairs
Porch/Stoop Yes / No

28
Unpaved yard Paved yard
High fence; good visibility
Low fence
High fence; poor visibility
Ornamental fence
Play equipment
Play equipment
Good natural garden Good natural
Poor natural garden
Ramp Yes / No
Balcony Yes / No - within the height of the tree
30. Front Yard
Yard Present? Yes / No - Yard should be large enough and capable of being used in
some way, e.g. sitting, throwing a ball.
Yard Paving Paved o Unpaved o
Barriers Present? Yes / No Check all that apply.
High Fence- greater than five feet Low Fence- less than five feet Chain Link Fence Ornamental Fence
Shrubs Yes / No
Visibility (Select one) Good Poor
31. Sociability
Play Equipment Yes / No This could include small private jungle gym type equipment or extensive playgrounds
Garden Present Yes / No Select Yes if there is any type of ornamentation beyond a grass lawn including flowering or ornamental plantings purposely installed.
Garden Type (select one)
Plastic- only plastic decorations Natural- may include plastic decorations, but majority of
garden must have organic, live plantings
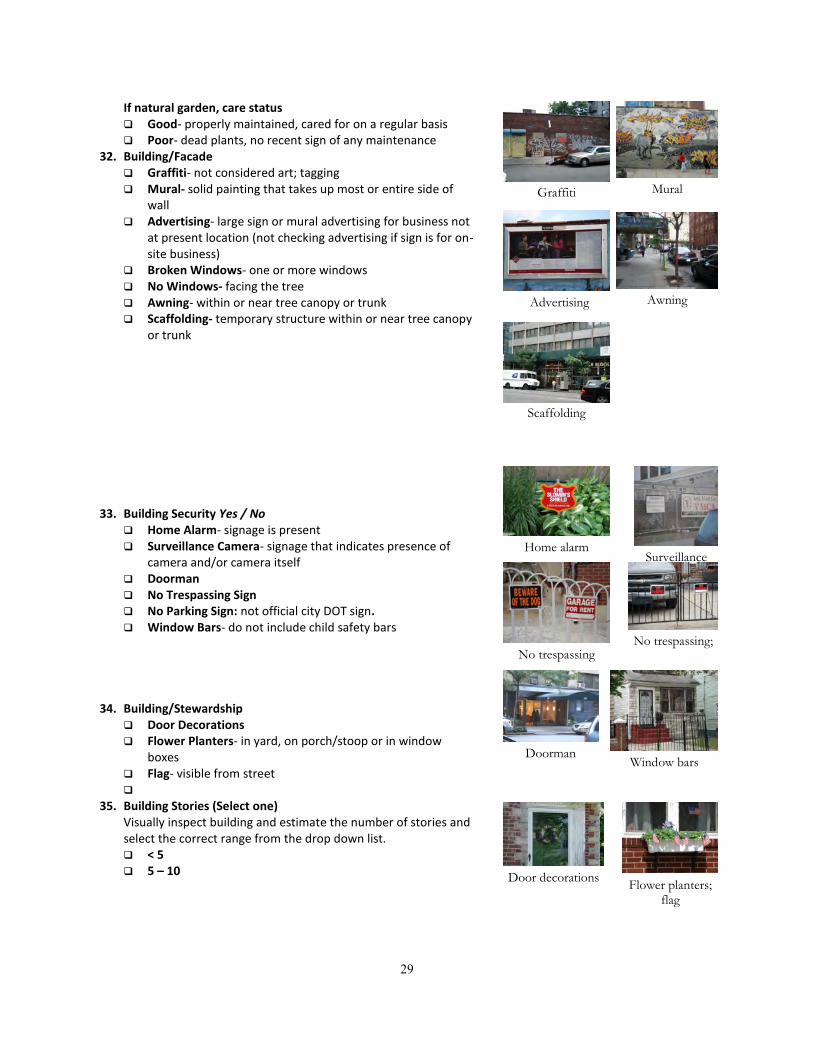
29
Graffiti Mural
Advertising Awning
Scaffolding
Home alarm Surveillance
Doorman
No trespassing No trespassing;
Window bars
Door decorations Flower planters;
flag
If natural garden, care status Good- properly maintained, cared for on a regular basis Poor- dead plants, no recent sign of any maintenance
32. Building/Facade Graffiti- not considered art; tagging Mural- solid painting that takes up most or entire side of
wall Advertising- large sign or mural advertising for business not
at present location (not checking advertising if sign is for on-site business)
Broken Windows- one or more windows No Windows- facing the tree Awning- within or near tree canopy or trunk Scaffolding- temporary structure within or near tree canopy
or trunk 33. Building Security Yes / No
Home Alarm- signage is present Surveillance Camera- signage that indicates presence of
camera and/or camera itself Doorman No Trespassing Sign No Parking Sign: not official city DOT sign. Window Bars- do not include child safety bars
34. Building/Stewardship
Door Decorations Flower Planters- in yard, on porch/stoop or in window
boxes Flag- visible from street
35. Building Stories (Select one) Visually inspect building and estimate the number of stories and select the correct range from the drop down list. < 5 5 – 10
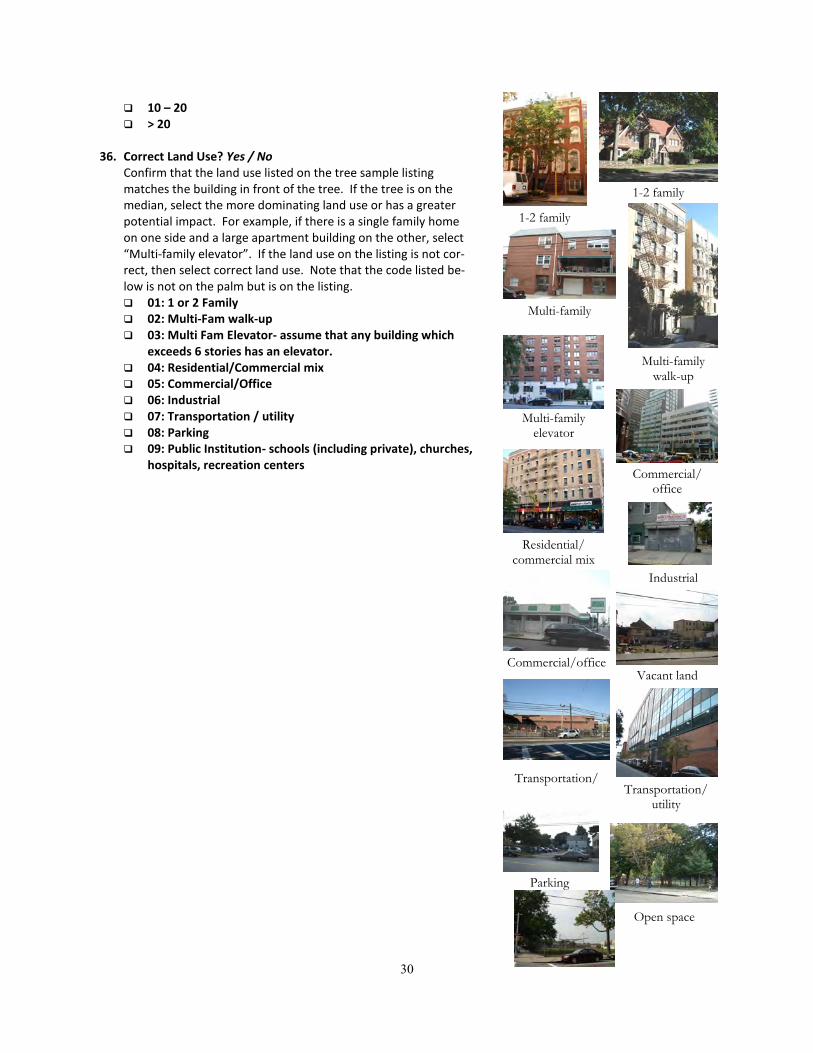
30
Commercial/office
Commercial/office
Industrial
Transportation/
Parking
Open space
Transportation/utility
Vacant land
10 – 20 > 20
36. Correct Land Use? Yes / No
Confirm that the land use listed on the tree sample listing matches the building in front of the tree. If the tree is on the median, select the more dominating land use or has a greater potential impact. For example, if there is a single family home on one side and a large apartment building on the other, select “Multi-family elevator”. If the land use on the listing is not cor-rect, then select correct land use. Note that the code listed be-low is not on the palm but is on the listing. 01: 1 or 2 Family 02: Multi-Fam walk-up 03: Multi Fam Elevator- assume that any building which
exceeds 6 stories has an elevator. 04: Residential/Commercial mix 05: Commercial/Office 06: Industrial 07: Transportation / utility 08: Parking 09: Public Institution- schools (including private), churches,
hospitals, recreation centers
1-2 family
1-2 family
Multi-family
Multi-family elevator
Residential/commercial mix
Multi-family walk-up

31
School
Fire station Police station
Hospital
Senior center
Recreation center
Place of worship
Other
10: Open Space- Parks (city, state, private), community garden 11: Vacant Land- no sign that land is being used
III. Block Level
This portion of the survey refers to the entire block on which the tree is planted. These observations should reflect a visual check of the entire block. 1. Traffic Volume (Select one)
Light Moderate Heavy
2. Murals Yes / No
These represent purposeful efforts of art and not graffiti.
Nature- environmental, animals, plants, planets, etc. Memorial/RIP Advertisement/Retail- can be for present business or other
businesses Hate/Profanity- derogatory or hateful message Public Health- promotes awareness of health issues Art- murals that cannot be categorized or do not pertain to
any specific topic Nationality- flags or other symbols of U.S. or other countries Community- depiction of people/surroundings/ name of
community Religion- religious symbols or words
3. Vacancy (Choose one)
This refers to vacant lots, undeveloped lots in less urban con-texts, abandoned buildings, or high vacancy rates of existing residential or commercial buildings. Few- less than half of the block Many- more than half of block None
4. Public Facilities
School (not nursery) Hospital Fire Station Police Station Senior Center

32
Recreation Center Place of Worship Other
5. Strong Wind? Yes / No Select if you feel a constant strong wind
6. Citizen Encounter? Yes / No
Note if surveyor met anyone while surveying the tree,.
Citizen Age (select one) Senior- about 65 or over Adult- age 18-65 Child- less than 18 years of age
Citizen Sex Male Female M/F Couple F/F Couple M/M Couple
Citizen Attitude Positive- appreciates tree, curious about tree condition or survey Negative- suspicious, not appreciative of tree or parks department Neutral- no positive or negative comments or actions regarding tree or survey
7. Location Comments
Please use this space to provide any clarifications or corrections to the location provided in the listing.
8. Misc.
Please include any other notes that may be needed, including picture taken and if so the picture #; also if and when tree was replaced. Also include information given by neighbors that may provide useful in study.
9. Is all the information finalized and complete for this tree?
Yes/No

33
Appendix II: Literature Review Survey techniques Goodwin, D.W. 1996. A street tree inventory for Massachusetts using a geographic information system. J. Arbori-culture. 22(1): 19-28. Explores various techniques for mapping tree locations and creates a spatial database of tree locations and fourteen tree attributes. Smiley, E.T. and F.A. Baker. 1988. Options in street tree inventories. J. Arboriculture 14(2): 36-42. Outlines and discusses how to set up and carry out street tree inventories. Includes what data should be collected, how it should be collected, budgeting. i-Tree Sample Plot Generator for UFORE. Typically, 200 one-tenth acre plots for a large city and 30 plots for a small town.
Johannsen, H.J. 1975. Municipal tree survey and urban tree inventory. J. Arboriculture April 1975: 71-74. De-scribes system for identifying street trees. Cumming, A.B., M.F. Galvin, R.J. Rabaglia, J.R. Cumming, and D.B. Twardus. 2001. Forest health monitoring proto-col applied to roadside trees in Maryland. J. of Arbor. 27(3):126-138. Methodology for assessing the condition of roadside trees. Jaenson, R., N. Bassuk, S. Schwager, and D. Headley. 1992. A statistical method for the accurate and rapid sam-pling of urban street tree populations. J. Arboriculture. 18(4): 171-183. Develops statistical sampling method, based on stratified random sampling, that can be used to estimate the species composition of an urban street tree population. Results presented for four New York cities. Sun, W.-Q. and N.L. Bassuk. 1991. Landscape Urban Plann. 20: 277-283. Recommends sampling size for street tree surveys. Computer simulation concludes that sample quality improves little after a certain sampling size, but quality declines significantly at a smaller size. Tree health studies Berrang, P., K.F. Karnosky, and B.J. Stanton. 1985. Environmental factors affecting tree health in New York City. J. Arboriculture. 11(6): 185-189. Presents the results of data collection on over 80 variables for 375 trees planted near Consolidated Edison Company facilities in New York City. The study finds excessive soil moisture, mounding of soil on roots, soil salts, and root system size to be the most important factors affecting tree health. Chacalo, A., A. Aldama, and J. Grabinsky. 1994. Street tree inventory in Mexico City. J. Arboriculture. 20(4): 222-226. Surveyed 1261 street trees in Mexico City, collecting data for seven variables. Problems with tree health are attributed to planting in inappropriate locations, species choice, and lack of adequate maintenance and planning. Gartner, J.T., T. Treiman, and T. Frevert. 2002. Missouri urban forest—a ten-year comparison. J. Arboriculture. 28(2): 76-83. Surveyed sample plots in 44 urban communities throughout Missouri as a follow-up to a 1989 survey of tree size, condition, and history, conducted by the American Forestry Association and the USDA Forest Service. The study finds that communities need to devote more of their resources and time to tree maintenance, as op-posed to new plantings. Skiera, Bob and Gary Moll. 1992. The sad state of city trees. American Forests. Summary of the American For-estry Association’s survey of 20 U.S. cities. Finds that average life of a downtown street tree is 13 years. Hauer, R.J., R.W. Miller, and D.M. Ouimet. 1994. Street tree decline and construction damage. J. of Arboriculture. 20(2): 94-97. Hauer et al. (1994) followed a cohort 10 years after planting, examining 845 trees. Construction damage from street widening and curb and sidewalk replacement were found to negatively affect both tree sur-

34
vival and condition. Trees in narrow tree lawns suffered the greatest reduction in condition from construction damage. Construction damage was found to have a high economic impact on street tree value. Nowak, D.J., M. Kuroda, and D.E. Crane. 2004. Tree mortality rates and tree population projections in Baltimore, Maryland, USA. Urban For. and Urban Green. 2: 139-147. Research by scientists in the LTER Baltimore Ecosystem Study. Nowak et al (2004) found that smaller diameter trees have significantly higher mortality than larger trees, but this study did not focus on causality. Thompson, J.R. , D.J. Nowak, D.E. Crane, and J.A. Hunkins. 2004. Iowa, U.S., communities benefit from a tree-planting program: characteristics of recently planted trees. J of Arbor. 30(1): 1-9. Species diversity, survival, size, growth, carbon uptake, carbon storage, and pollution removal of 932 trees planted in 21 communities in differ-ent parts of Iowa were assessed by repeated measurements over a 4-year period. Management Tate, R.L. 1985. Uses of street tree inventory data. J. Arboric. 11(7): 210-213. How to create, increase, improve or save an urban tree management program. Meza, H.M. 1992. Current situation of the urban forest in Mexico City. J. Arboriculture. 18(1): 33-36. Discusses history of arboriculture in Mexico City, current problems with management of urban trees and programs in place to improve the situation. Tree benefits Nowak, D.J. and D.E. Crane. 2002. Carbon storage and sequestration by urban trees in the USA. Environmental Pollution 116: 381-389. Carbon storage and sequestration by urban trees based on field data from 10 cities in the USA and national urban tree cover data. Regional variation dicussed. Urban trees currently store 700 million tons of carbon, with an annual sequestration rate of 22.8 million tons (equal to USA population emissions over 5 days). Urban ecology theory Zipperer, W.C., S.M. Sisinni, and R.V. Pouyat. 1997. Urban tree cover: an ecological perspective. Urban Ecosys-tems 1: 229-246. Evaluation of urban tree cover based on patch dynamics. Treed patches are classified by their origin, structure, and management intensity. Using the patch approach, Zipperer et al. evaluate ecological pat-terns and processes for remnant, emergent and planted patches, which differ according to origin. A patch is a fundamental unit of measurement for landscape analysis and management. Patches imply a relatively discrete spatial pattern and a relationship of interactions and exchanges between patches. Ecological patterns and proc-esses discussed include morphology, canopy cover, forest development, species richness, biomass, succession and nutrient and carbon cycling. Social science Hope, D., C. Gries, W.Zhu, W.F. Fagan, C.L. Redman, N.B. Grimm, A.L. Nelson, C. Martin, and A. Kinzig. 2003. So-cioeconomics drive urban plant diversity. PNAS 100(15): 8788-8792. Spatial variation in plant diversity was found to be driven by a combination of land use, elevation, median family income, and whether the site has ever been farmed. This study finds a relationship between wealth and plant diversity that has been observed in other cities as well. Gorman, James. 2004. Residents’ opinions on the value of street trees depending on tree location. J. Arboric. 30(1): 36-44. Residents’ opinions on the value (or negative aspects) of street trees were impacted by the presence or absence of a tree directly in front of their residence. Statistical significance found for 5 positive factors: give shade; flowers on tree; neighborhood is more liveble; increased property values. And 3 negative factors: branches break power lines in storms; sidewalk damage; and trees block visibility.

35
Grove, J. Morgan; Cadenasso, Mary L.; Burch, William R., Jr.; Pickett, Steward T.; Schwarz, Kirsten; O'Neil-Dunne, Jarlath; Wilson, Matthew; Troy, Austin; Boone, Christopher 2006. Data and methods comparing social structure and vegetation structure of urban neighborhoods in Baltimore, Maryland Society and Natural Resources 19:117-136. Looks at diversity as it relates to population, lifestyle behavior and social stratification.