nyc carbon challenge progress report april 2018 carbon challenge_2018... · 1 | nyc carbon...
TRANSCRIPT

1 | NYC CARBON CHALLENGE PROGRESS REPORT APRIL 2018
The City of New YorkMayor Bill de Blasio
Mayor’s Office of Sustainability
NYC CARBON CHALLENGE
PROGRESS REPORT APRIL 2018
2 | NYC CARBON CHALLENGE PROGRESS REPORT APRIL 2018
Executive Summary
Program Summary
Early Achievers
Retail
Colleges and Universities
Hospitals
Commercial Owners and Tenants
Multifamily
Hotels
Conclusion
End Notes
3
5
9
10
13
19
25
37
41
45
47
Table of Contents
NYC CARBON CHALLENGEPROGRESS REPORT APRIL 2018

3 | NYC CARBON CHALLENGE PROGRESS REPORT APRIL 2018
Executive Summary
Program Summary
Early Achievers
Retail
Colleges and Universities
Hospitals
Commercial Owners and Tenants
Multifamily
Hotels
Conclusion
End Notes
Global climate change is one of the most significant challenges we face today. Across the globe, greenhouse gas (GHG) emissions continue to increase, causing a rise in average global temperature and changes to climate patterns. New York City is experiencing the impacts of climate change firsthand from rising sea levels, increasing temperatures and heat waves, and more frequent and intense storms. The damage caused by and Hurricane Sandy in 2012 provided tragic evidence of these vulnerabilities.
On Earth Day 2015, New York City Mayor Bill de Blasio announced One New York: The Plan for a Strong and Just City (OneNYC), a groundbreaking effort to address New York City’s long-term challenges. As part of OneNYC, New York City committed to reduce GHG emissions 80 percent by 2050 from 2005 levels (80 x 50), with an interim target to reduce emissions 40 percent by 2030 (40 x 30).
When the United States announced it would pull out of the Paris Climate Agreement in June 2017, New York City pledged to adhere to the goals of the Agreement and accelerate its commitment to 80 x 50 by front-loading the most dramatic reductions in the coming decade. New York has been joined by more than 400 other municipalities across the country in this collective climate action effort.
This problem cannot be solved without the help of all New Yorkers. To make progress toward 80 x 50, New York City has relied on the action and leadership of its private and institutional sector leaders. The City first launched the NYC Carbon Challenge (Challenge) in 2007 to partner with the
city’s leading colleges and universities to achieve significant GHG emissions reductions in their buildings. Participants have pledged to voluntarily reduce their building-based GHG emissions by 30 percent or more over the course of ten years. Since the initial launch, over 100 participants have accepted the Challenge, including the City’s largest colleges and universities, hospitals, commercial owners and tenants, residential property management firms, and hotels.
In total, current participants account for over 510 million square feet of real estate, or more than nine percent of citywide building square footage. Since the launch of the Challenge, participants have significantly cut their energy use and GHG emissions, revealing effective strategies and providing insight on how to use voluntary action to meet policy goals. The Challenge has also fostered collective action by creating a platform to share ideas and engaging new communities in the effort to address climate change.
2017 marked the anniversary of the initial ten-year Challenge for colleges and universities, but not the end of participants’ efforts. Seventeen New York City colleges and universities have deepened their commitments under the Challenge, pledging to reduce their GHG emissions by 40 percent or 50 percent. Their proven strategies can now be replicated across colleges and universities across the state and the rest of the country even as these New York City leaders continue to push forward with their bold commitments to climate action and innovative new strategies to reduce GHG emissions.
Executive Summary
4 | NYC CARBON CHALLENGE PROGRESS REPORT APRIL 2018
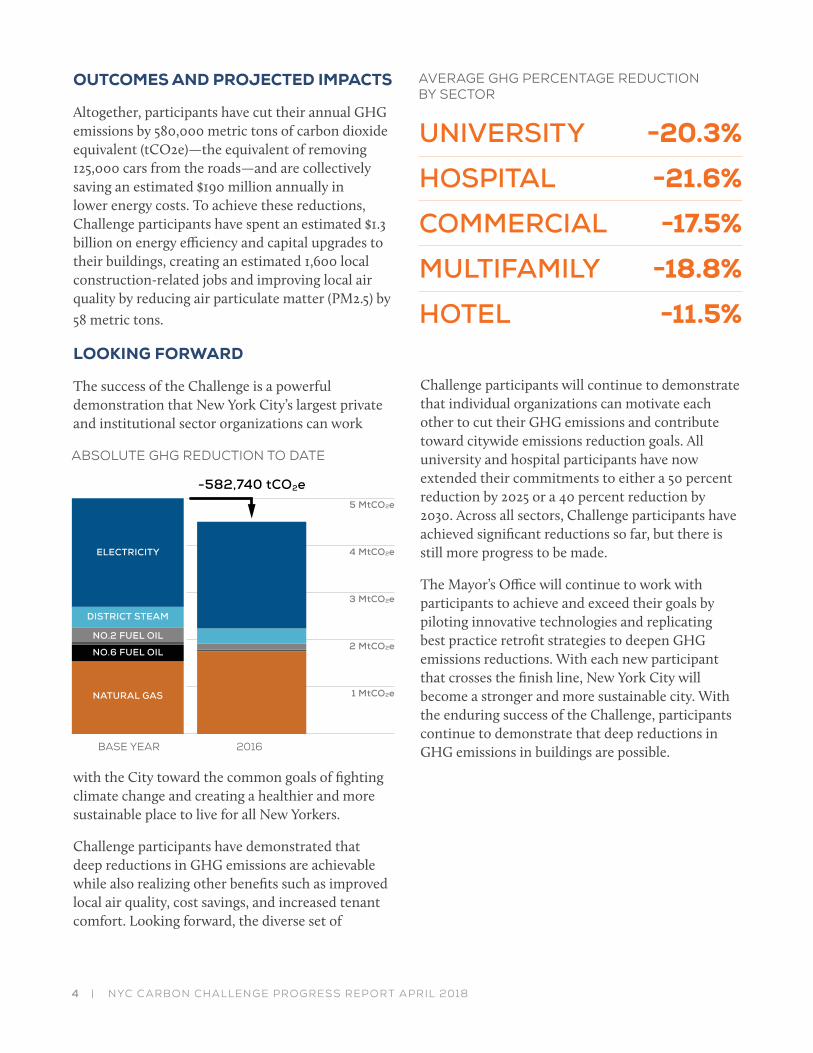
OUTCOMES AND PROJECTED IMPACTS
Altogether, participants have cut their annual GHG emissions by 580,000 metric tons of carbon dioxide equivalent (tCO2e)—the equivalent of removing 125,000 cars from the roads—and are collectively saving an estimated $190 million annually in lower energy costs. To achieve these reductions, Challenge participants have spent an estimated $1.3 billion on energy efficiency and capital upgrades to their buildings, creating an estimated 1,600 local construction-related jobs and improving local air quality by reducing air particulate matter (PM2.5) by 58 metric tons.
LOOKING FORWARD
The success of the Challenge is a powerful demonstration that New York City’s largest private and institutional sector organizations can work
with the City toward the common goals of fighting climate change and creating a healthier and more sustainable place to live for all New Yorkers.
Challenge participants have demonstrated that deep reductions in GHG emissions are achievable while also realizing other benefits such as improved local air quality, cost savings, and increased tenant comfort. Looking forward, the diverse set of
ABSOLUTE GHG REDUCTION TO DATE
AVERAGE GHG PERCENTAGE REDUCTION BY SECTOR
ELECTRICITY
5 MtCO2e
4 MtCO2e
3 MtCO2e
2 MtCO2e
1 MtCO2e
-582,740 tCO2e
DISTRICT STEAM
NO.2 FUEL OIL
NO.6 FUEL OIL
NATURAL GAS
UNIVERSITY
HOSPITAL
COMMERCIAL
MULTIFAMILY
HOTEL
-20.3%
-21.6%
-17.5%
-18.8%
-11.5%
Challenge participants will continue to demonstrate that individual organizations can motivate each other to cut their GHG emissions and contribute toward citywide emissions reduction goals. All university and hospital participants have now extended their commitments to either a 50 percent reduction by 2025 or a 40 percent reduction by 2030. Across all sectors, Challenge participants have achieved significant reductions so far, but there is still more progress to be made.
The Mayor’s Office will continue to work with participants to achieve and exceed their goals by piloting innovative technologies and replicating best practice retrofit strategies to deepen GHG emissions reductions. With each new participant that crosses the finish line, New York City will become a stronger and more sustainable city. With the enduring success of the Challenge, participants continue to demonstrate that deep reductions in GHG emissions in buildings are possible.2016BASE YEAR

510
2,300
580,000
$190
7.2
1,600
MILLION SQUARE FEETOF REAL ESTATE9% OF CITY-WIDE BUILT SQUARE FOOTAGE
HOSPITALIZATIONS AVERTED BY58 MILLION TONS OFPM2.5 REDUCED
MILLION MMBTU
DIRECT JOBS
MILLION
REDUCED
CREATED
TONS OF CO2e REDUCED
IN ENERGY COST SAVINGS TO DATE
5 | NYC CARBON CHALLENGE PROGRESS REPORT APRIL 2018
Program Summary
SIZE
CARBON
ENERGY
SAVINGS
HEALTH
JOBS
EQUIVALENT TO TAKING 125,000 CARS OFF THE ROAD
EQUIVALENT TO TAKING 170,000 HOMES OFF THE GRID

6 | NYC CARBON CHALLENGE PROGRESS REPORT APRIL 2018
NEW YORK CITY’S CLIMATE STRATEGY
To address the challenges and mitigate the threats of climate change, New York City must adapt to a changing climate and take bold action to reduce the harmful GHG emissions that contribute to a changing climate. New York City has joined the world’s leading cities in doing our part to reduce our contributions to global GHG emissions, by committing to 80 x 50, and aligning ourselves with the Paris Climate Agreement. Achieving this goal requires significant reductions in GHG emissions produced by the city’s energy supply, buildings, transportation, and solid waste. We now know that to achieve 80 x 50 the City must accelerate efforts to:
• Make all buildings significantly more energy efficient
• Replace many fossil fuel-based heating and hot water systems in buildings with renewable or high-efficiency electric systems
• Scale up on-site installations of renewable energy sources across buildings and City-owned properties
• Transition towards a renewables-based electric grid
• Reduce the number of miles driven and remaining vehicles with zero-emissions vehicles
• Achieve the goal of sending Zero Waste to landfills
In New York City, close to 70 percent of citywide GHG emissions can be attributed to the energy used to heat, power, and cool buildings, and more than 90
percent of the buildings that are here today will still be here in 2050. Therefore, improving the energy efficiency of New York City’s existing building stock presents the most important opportunity to reduce citywide GHG emissions in the long term. The City is committed to pioneering and leading the way through energy efficiency and conservation measures in its City-owned buildings while also working with private and institutional leaders to drive building energy efficiency to achieve our 80 x 50 goal.
Background
200720082009201020112012201320142015201620172018
LAUNCHED COLLEGE AND UNIVERSITY CHALLENGE
LAUNCHED HOSPITAL CHALLENGE
LAUNCHED COMMERCIAL CHALLENGE AND MULTIFAMILY CHALLENGE
12 PARTICIPANTS COMMIT TO 50% REDUCTION GOAL, LAUNCHED HOTEL CHALLENGE
COMMERCIAL CHALLENGEEXPANDED TO INCLUDE 10 COMMERCIAL OWNERS AND 12 NEW COMMERCIAL TENANTS
LAUNCH OF RETAIL CHALLENGE,UNIVERSITIES AND HOSPITALS EXTEND COMMITMENTS
7 | NYC CARBON CHALLENGE PROGRESS REPORT APRIL 2018
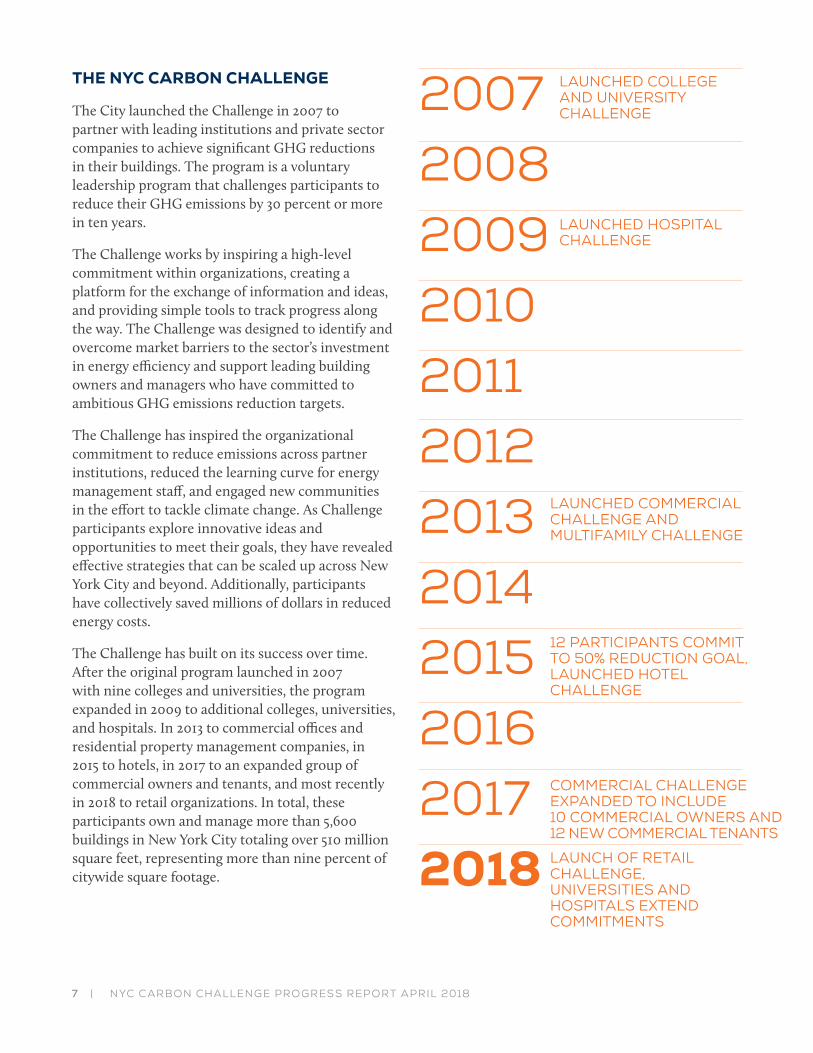
THE NYC CARBON CHALLENGE
The City launched the Challenge in 2007 to partner with leading institutions and private sector companies to achieve significant GHG reductions in their buildings. The program is a voluntary leadership program that challenges participants to reduce their GHG emissions by 30 percent or more in ten years.
The Challenge works by inspiring a high-level commitment within organizations, creating a platform for the exchange of information and ideas, and providing simple tools to track progress along the way. The Challenge was designed to identify and overcome market barriers to the sector’s investment in energy efficiency and support leading building owners and managers who have committed to ambitious GHG emissions reduction targets.
The Challenge has inspired the organizational commitment to reduce emissions across partner institutions, reduced the learning curve for energy management staff, and engaged new communities in the effort to tackle climate change. As Challenge participants explore innovative ideas and opportunities to meet their goals, they have revealed effective strategies that can be scaled up across New York City and beyond. Additionally, participants have collectively saved millions of dollars in reduced energy costs.
The Challenge has built on its success over time. After the original program launched in 2007 with nine colleges and universities, the program expanded in 2009 to additional colleges, universities, and hospitals. In 2013 to commercial offices and residential property management companies, in 2015 to hotels, in 2017 to an expanded group of commercial owners and tenants, and most recently in 2018 to retail organizations. In total, these participants own and manage more than 5,600 buildings in New York City totaling over 510 million square feet, representing more than nine percent of citywide square footage.

8 | NYC CARBON CHALLENGE PROGRESS REPORT APRIL 2018
NYC CARBON CHALLENGE METRICS
All participants in the Challenge have pledged to reduce the GHG emissions intensity of their buildings by 30 percent or more in ten years from a set base year. GHG emissions intensity is measured as carbon dioxide equivalent (CO2e) divided by total gross building square footage or full-time equivalent employees (FTE) as their chosen normalization factor. Some participants have selected a higher goal of either a 40 percent or 50 percent reduction.
As part of joining the Challenge, participants commit to provide the City with their aggregated utility information on an annual basis through a GHG Emissions Inventory Calculator template designed by the Mayor’s Office. Participants can also elect to submit building-level energy information through the U.S. Environmental Protection Agency (US EPA) Portfolio Manager. Every other year, participants submit a comprehensive Climate Action Plan that details progress to date, specific energy efficiency project information, and strategies to achieve the GHG emissions reduction target.
Participants track building-based energy use by fuel type. Participants also have the option to report on their total waste output, as well as gasoline and diesel consumption from their owned vehicle fleet. Participants track “Scope 1” emissions, which are direct emissions physically produced on site (e.g. fossil fuels used in boilers) and “Scope 2” emissions, which are indirect emissions that result from off-site energy generation in a location separate from the institution’s property (e.g. district steam or electricity generation). The Challenge does not include “Scope 3” emissions, which are indirect emissions that are not produced on site, but are nonetheless attributable to the institution’s activities (e.g. emissions from air travel or transportation emissions associated with solid waste disposal).
The Challenge goal is based on GHG emissions intensity normalized per square foot or per full-time equivalent employee because this standardizes emissions levels for facilities of different sizes. An absolute GHG emissions reduction is not feasible in many cases because participants may expect to significantly increase their size as they add more employees, staff, students, patients, and/or research capacity. This expansion is central to institutional missions and vital to New York City’s broader economy. Measuring GHG emissions intensity still translates to absolute reductions even as participants continue to grow, particularly as they expand into older buildings and facilities and renovate them to become more energy efficient.
For the purposes of the Challenge, the coefficients used to determine the GHG emissions associated with electricity and steam are fixed at 2005 levels. Holding the electricity and steam GHG coefficients constant at 2005 levels measures only the direct efforts of the participants, and not exogenous changes to the energy supply.
PARTICIPANT PROGRESS
Participants began the Challenge with a wide diversity in terms of their energy and fuel mix, available financial resources, and age of buildings or tenant spaces. These factors can significantly impact individual participants’ ability to reduce their GHG emissions over time. As a voluntary program, the Challenge does not penalize institutions that are unable to meet the Challenge goal, but rather aims to encourage progress and facilitate the prioritization of institutional resources to meet voluntary GHG emissions reduction pledges.
Outcomes

9 | NYC CARBON CHALLENGE PROGRESS REPORT APRIL 2018
Early Achievers
Participants have achieved significant reductions in GHG emissions through a wide range of projects and strategies, demonstrating that there are many ways to reach the emissions reduction target. Across all participants, the key factor for success is the development and implementation of a strategic plan that is tailored to individual needs and the dedication of staff capacity to implement the strategy across buildings and tenant spaces. The sustainability and facilities staff vary by composition and size across participants, but in all cases having staff that is empowered to provide strategic direction, oversee implementation, and ensure accountability was the most important ingredient for success.
Specific projects implemented by Challenge participants include lighting upgrades, retro-commissioning and optimization of building equipment, installation of building controls, major heating and cooling equipment upgrades, installation of solar photovoltaics (PV) and other renewable energy sources, improved operations and maintenance, procurement of energy efficient appliances, enhanced building insulation, and public education campaigns aimed at behavioral change. Case studies of these specific projects and Climate Action Plan results are included throughout this report for sectors in which participants have submitted this information to the City.
BARNARDCOLLEGE
NEW YORKUNIVERSITY -30%
-30%
WEILL CORNELLMEDICINE -30%
MEMORIAL SLOANKETTERING -32%MONTEFIORE MEDICAL CENTER -36%NEW YORK PRESBYTERIAN - QNS -39%NYU LANGONE HEALTH -31%
NYUTANDON -32%ST. JOHN’SUNIVERSITY -32%
BLACKROCK -45%CREDIT SUISSE -41%
GOOGLE -43%INTERPUBLIC GROUP -43%
KIRKLAND ANDELLIS, LLP -31%
JP MORGANCHASE -31%
UBS -54%
EDF -43%GOLDMAN SACHS -45%
JETBLUE -78%
FASHION INSTITUTE OFTECHNOLOGY -55%
NORMANDY REALESTATE PARTNERS -40%
COLLEGES & UNIVERSITIES
HOSPITALS
COMMERCIAL

Retail ParticipantsAMALGAMATED BANK
BANK OF AMERICA
BARNES AND NOBLE
CITI
EQUINOX
JUST SALAD
L’ORÉAL
LE PAIN QUOTIDIEN
LOWE’S
SPRINT
TD BANK
VERIZON
WARBY PARKER
10 | NYC CARBON CHALLENGE PROGRESS REPORT APRIL 2018
PARTNERSHIP WITH RETAIL LEADERS
Comprising over 270 million square feet, or five percent of overall citywide building square footage, the retail sector is poised to help New York City lead the way in GHG emissions reductions. The retail sector in New York City consists of a wide range of building typologies and retail subsectors including, but not limited to, stand-alone retail buildings, ground floor leased retail spaces, apparel stores, department stores, financial institutions, flagship stores, food and beverage retailers, health clubs, home improvement stores, specialty stores, and wireless communications.
Even with differing space configurations and unique energy use profiles between these subsectors, significant opportunities exist for retailers to increase energy efficiency including the measurement and monitoring of on-site energy use, installation of energy efficient lighting and controls, optimization of heating, ventilation, and air conditioning (HVAC) systems and controls, upgrades to refrigeration equipment, installation of variable speed drives on fans and motors, and utilization of ENERGY STAR® appliances.
The NYC Carbon Challenge for Retail now includes leading retail organizations with owned or leased space in New York City. The partnership is an opportunity to recognize, publicize, and celebrate the energy efficiency and sustainability efforts these leading retail organizations are implementing throughout their portfolios. New York City is a world-class destination and the Challenge program serves as a platform and channel through which retailers can communicate to all employees and the public their commitments to climate action and meaningful GHG emissions reductions in partnership with the City.

11 | NYC CARBON CHALLENGE PROGRESS REPORT APRIL 2018
ADDITIONAL BENEFITS
Beyond the impact that the Challenge has on citywide GHG reductions, the program has provided additional benefits to both participants and the City that are less quantifiable but equally important. The Challenge is set up to help participants plan an energy management strategy and track reductions in GHG emissions. The program also offers a forum for the open exchange of ideas, an opportunity for institutional and private sector organizations to partner with the City on sustainability initiatives, and the prospect to be recognized for their leadership.
The visibility and recognition of the Challenge has helped motivate senior level leadership within participating organizations to take meaningful action to fight climate change. This high-level commitment is often necessary to prioritize investments in energy efficiency and can also serve as motivation that diffuses throughout an organization from the top down. The program has helped break down professional silos between financial departments, sustainability offices, and facilities staff by encouraging collaboration to achieve a common goal.
The Challenge has also has helped expedite the learning curve associated with energy management by providing tools for participants, such as a GHG Emissions Inventory Calculator and a Climate Action Plan template. Quarterly partner meetings allow participants to hear from guest speakers about new resources and opportunities and share ideas on successes, challenges, obstacles, and experiences to further facilitate action. The Challenge has created a growing community of dedicated professionals in New York City who help each other navigate energy-saving opportunities and implementation strategies.
The Challenge has also engaged new communities in the important but often invisible work of energy efficiency. Participants have launched campaigns
to actively involve their employees, staff, students, patients, faculty, and the public in their energy reduction efforts. These campaigns often build on participation in the Challenge as a way to motivate a broad array of stakeholders. The reach of the Challenge therefore extends far beyond the participating institutions as others are inspired to take action in their own lives, playing an important role for New York City’s broader environmental goals.
Finally, the experiences of Challenge participants have allowed the City to identify innovative new strategies and replicable best practices for achieving GHG emissions reductions—creating an important feedback loop for new policy and program development. For example, the City launched the NYC Retrofit Accelerator in 2015 to provide free, personalized advisory services for building owners and decision-makers to help them implement energy and water upgrades in their buildings. The Retrofit Accelerator’s “Better Steam Heat” campaign helps building owners upgrade their steam heating distribution systems, which largely builds on the successes of Challenge participants who completed similar upgrades and realized significant reductions in heating energy use. Many Challenge participants are also now participating in the NYC Retrofit Accelerator’s new High Performance Retrofit Track, which will assist building owners in the development and implementation of long-term capital plans that will achieve a 40-60 percent reduction in energy use in individual buildings.
Going forward, the City will continue to build on the experiences of Challenge participants to develop future policies and programs.

12 | NYC CARBON CHALLENGE PROGRESS REPORT APRIL 2018

13 | NYC CARBON CHALLENGE PROGRESS REPORT APRIL 2018
In 2007, nine leading colleges and universities became the first participants in the Challenge, pledging to reduce their GHG emissions by 30 percent in ten years. In 2009, eight additional colleges and universities joined the Challenge.
In their base years, participating colleges and universities made up almost 70 million square feet of space in New York City and emitted roughly 930,000 tCO2e from their facilities – more than 1.5 percent of total citywide GHG emissions based on 2005 levels. Since the start of the Challenge, participating colleges and universities have significantly increased in size by adding new facilities, labs, students and staff, all while decreasing their GHG emissions and reaping significant savings in energy costs.
By 2016, participating colleges and universities increased in size by more than eight million square feet while simultaneously decreasing their total GHG emissions by 10.6 percent (more than 98,000 tCO2e), resulting in a 21.1 percent decrease in GHG emissions per square foot. Participants have also reduced their source energy use intensity by more than seven percent from their base years and are estimated to have saved over $29 million per year in reduced energy costs.
Colleges and Universities
21% GHG REDUCTION
ParticipantsBARNARD COLLEGE 50%
BERKELEY COLLEGE 40%
CITY UNIVERSITY OF NEW YORK 40%
COLUMBIA UNIVERSITY 40%
THE COOPER UNION 40%
FASHION INSTITUTE OF TECHNOLOGY 50%
FORDHAM UNIVERSITY 40%
THE NEW SCHOOL 40%
NEW YORK UNIVERSITY 50%
NYU TANDON SCHOOL OF ENGINEERING 40%
PACE UNIVERSITY 40%
PRATT INSTITUTE 40%
THE ROCKEFELLER UNIVERSITY 40%
SCHOOL OF VISUAL ARTS 50%
ST. JOHN’S UNIVERSITY 40%
WAGNER COLLEGE 40%
WEILL CORNELL MEDICINE 40%
69,566,142 SQ. FT. IN BASE YEAR78,831,565 SQ. FT. IN 2016
12% INCREASE IN FLOOR AREA
931,110 tCO2e IN BASE YEAR
832,336 tCO2e EMITTED IN 2016
AND CHALLENGE REDUCTION GOAL

14 | NYC CARBON CHALLENGE PROGRESS REPORT APRIL 2018
HEATING & COOLING
$8.1 M
$2.5 M
$1.2 M
29,726tCO2e
4,016tCO2e 6,304
tCO2e
3,806tCO2e
$1.3 M
O&M BEHAVIOR
CHANGE
DISTRIBUTIONSYSTEMS
LIGHTING &PLUG LOAD
CLIMATE ACTION PLAN RESULTS
College and university participants have made progress towards their GHG emissions reduction goals by deploying a variety of energy efficiency measures and operational improvements. Eight college and university participants submitted complete information on planned and completed projects to the Mayor’s Office through their Climate Action Plan reports. Complete project information includes data on installation cost and energy and cost savings.
Participants reported 122 projects, with an average energy savings of 6,100 MMBtu and cost savings of over $105,000 per project. Reported projects had an average simple payback period of 4.5 years. The combined installation cost of all projects was almost $60 million, yielding a total energy savings of over 750,000 MMBtu. The most common projects focused on distribution system improvements and heating and cooling system upgrades, comprising more than half of the reported projects. The projects with the quickest payback were operations and maintenance, lighting, process, and plug load upgrades.
AGGREGATE ANNUAL COST SAVINGS FOR PLANNED AND COMPLETED PROJECTS.
AGGREGATE ANNUAL GHG SAVINGS FOR PLANNED AND COMPLETED PROJECTS.
43,852tCO2e GHG REDUCED
$13,057,530COST SAVINGS

15 | NYC CARBON CHALLENGE PROGRESS REPORT APRIL 2018
To meet its 30 percent goal, Weill Cornell Medicine undertook the following actions:
• Implemented energy efficient LED lighting upgrades, saving over 500,000 kilowatt-hours (kWh) per year.
• Organized a four-day Green Professional (GPRO) training through Urban Green Council to promote energy and sustainability best practices to physical plant and maintenance operations staff.
• Upgraded liquid-ring compressors that provide compressed air to laboratories, to compressors utilizing energy-efficient scroll pumps, resulting in both water and electric energy savings.
• Converted constant air volume spaces to variable air volume, and upgraded controls from pneumatic to digital.
• Engaged greater Weill Cornell community in sustainability initiatives like Unpower Hour, which encourages staff and students to conserve energy during a designated date and time.
Weill Cornell Medicine
Weill Cornell Medicine was founded in 1898 and is among the top-ranked educational, clinical, and medical research centers in the country. Totaling more than two million square feet, Weill Cornell’s main campus includes a diverse mix of laboratory, classroom, administrative, residential, and clinical spaces. In 2016, Weill Cornell achieved the original 30 percent GHG emissions reduction target and has now committed to a 40 percent reduction by 2030.
LEADING MEDICAL INSTITUTION ACHIEVES 30 PERCENT GHG REDUCTION GOAL WITH CAPITAL INVESTMENTS, EFFICIENT NEW CONSTRUCTION, AND STAFF TRAINING
CASE STUDY

16 | NYC CARBON CHALLENGE PROGRESS REPORT APRIL 2018
In 2008, Weill Cornell undertook a campus-wide retro-commissioning effort. It began by reexamining existing spaces that had been constructed or modified over the years to deliver excessive air change rates, which resulted in significant energy waste.
After receiving input from Environmental Health & Safety and other departments, Weill Cornell standardized air change rates for various spaces and was able to reduce air change rates and energy usage in multiple buildings. This was made easier by the move to variable air volume systems in many locations, which resulted in greater comfort, control, and energy efficiency than the previous constant air volume systems.
In addition, under NYC Local Law 87, starting in 2010, buildings on the main campus each went through a retro-commissioning process to identify and implement operational and maintenance improvements that resulted in utility savings. Improvements have included activities such as replacement or recalibrating of critical sensors, replacement of control valves, and tightening of fan drive belts.
To date, Weill Cornell has identified over $100,000 in annual energy savings from operations and maintenance activities alone, and additional retro-commissioning studies are ongoing.
PROJECT HIGHLIGHT: CAMPUS WIDE RETRO-COMMISSIONING
BELFER RESEARCH BUILDING
17 | NYC CARBON CHALLENGE PROGRESS REPORT APRIL 2018
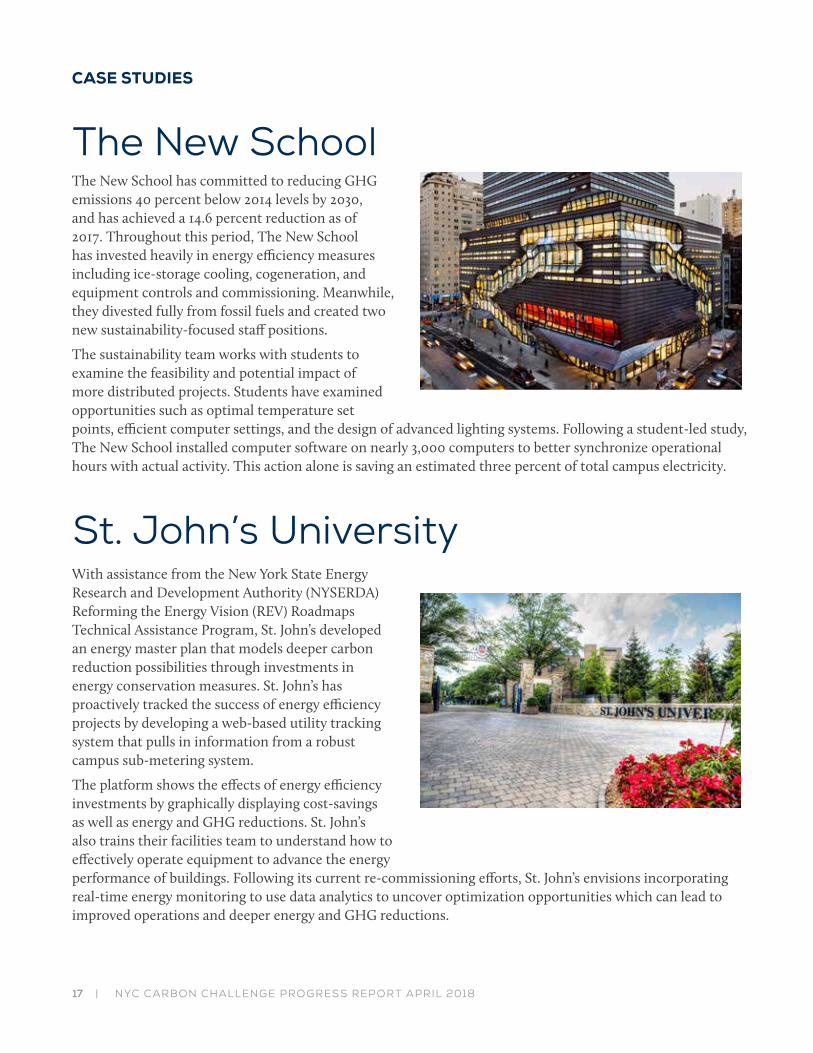
The New School has committed to reducing GHG emissions 40 percent below 2014 levels by 2030, and has achieved a 14.6 percent reduction as of 2017. Throughout this period, The New School has invested heavily in energy efficiency measures including ice-storage cooling, cogeneration, and equipment controls and commissioning. Meanwhile, they divested fully from fossil fuels and created two new sustainability-focused staff positions.
The sustainability team works with students to examine the feasibility and potential impact of more distributed projects. Students have examined opportunities such as optimal temperature set points, efficient computer settings, and the design of advanced lighting systems. Following a student-led study, The New School installed computer software on nearly 3,000 computers to better synchronize operational hours with actual activity. This action alone is saving an estimated three percent of total campus electricity.
CASE STUDIES
The New School
St. John’s UniversityWith assistance from the New York State Energy Research and Development Authority (NYSERDA) Reforming the Energy Vision (REV) Roadmaps Technical Assistance Program, St. John’s developed an energy master plan that models deeper carbon reduction possibilities through investments in energy conservation measures. St. John’s has proactively tracked the success of energy efficiency projects by developing a web-based utility tracking system that pulls in information from a robust campus sub-metering system.
The platform shows the effects of energy efficiency investments by graphically displaying cost-savings as well as energy and GHG reductions. St. John’s also trains their facilities team to understand how to effectively operate equipment to advance the energy performance of buildings. Following its current re-commissioning efforts, St. John’s envisions incorporating real-time energy monitoring to use data analytics to uncover optimization opportunities which can lead to improved operations and deeper energy and GHG reductions.

18 | NYC CARBON CHALLENGE PROGRESS REPORT APRIL 2018

19 | NYC CARBON CHALLENGE PROGRESS REPORT APRIL 2018
In 2009, the Challenge expanded to hospitals to engage one of the most vitally important but energy-intensive sectors of New York City’s economy. Nine of the largest hospital systems in New York City accepted the Challenge, representing more than 40 individual hospitals and dozens of clinics, outpatient centers, and medical offices.
In their base years, participating hospitals accounted for roughly 2.2 percent of total citywide GHG emissions, based on 2005 emissions levels. At the start of the Challenge, hospitals’ aggregate energy use intensity (EUI) was nearly twice that of the colleges and universities, because of more sophisticated heating ventilation and air conditioning systems, more energy-intensive medical equipment, and longer operating hours.
By 2016, the participating hospitals dramatically grew in size, adding over 9.6 million square feet and growing their total square footage by almost 19 percent. Simultaneously, hospitals’ absolute source energy remained close to constant while reducing their source energy use per square foot by 16.3 percent. This has resulted in a reduction in absolute GHG emissions by more than five percent and a reduction in GHG emissions per square foot by more than 20 percent. Based on participants’ utility consumption, it is projected that hospital participants are now saving over $60 million per year in reduced energy costs.
Hospitals
20% GHG REDUCTION
ParticipantsMAIMONIDES MEDICAL CENTER 40%
MEMORIAL SLOAN KETTERING CANCER CENTER 50%
MONTEFIORE MEDICAL CENTER 50%
MOUNT SINAI HEALTH SYSTEM 40%
NEWYORK PRESBYTERIAN HOSPITAL 40%
NEWYORK PRESBYTERIAN QUEENS 50%
NORTHWELL HEALTH 40%
NYC HEALTH + HOSPITALS 50%
NYU LANGONE HEALTH 50%
52,176,726 SQ. FT. IN BASE YEAR60,502,946 SQ. FT. IN 2016
19% INCREASE IN FLOOR AREA
AND CHALLENGE REDUCTION GOAL
147,583 tCO2e IN BASE YEAR
1,279,111 tCO2e IN 2016

20 | NYC CARBON CHALLENGE PROGRESS REPORT APRIL 2018
HEATING & COOLING
$2.4 M $2.5 M$2.2 M
10,467tCO2e
17,005tCO2e
6,226tCO2e
16,769tCO2e
$4.1 M
O&M BEHAVIOR
CHANGE
DISTRIBUTIONSYSTEMS
LIGHTING &PLUG LOAD
CLIMATE ACTION PLAN RESULTS
Hospital participants have made progress towards their GHG reduction goals by deploying a wide variety of energy efficiency measures and operational improvements. Six hospital participants submitted complete information on planned and completed projects to the Mayor’s Office through their Climate Action Plan reports. Complete project information includes data on installation cost and energy and cost savings.
Participants reported 133 projects, with an average energy savings of 6,800 MMBtu and cost savings of more than $80,000 per project. Reported projects had an average simple payback period of 3.5 years. The combined installation cost of all projects was more than $39 million, yielding a total energy savings of over 900,000 MMBtu. The most common projects focused on distribution system improvements, lighting system upgrades, and heating and cooling system retrofits.
AGGREGATE ANNUAL COST SAVINGS FOR PLANNED AND COMPLETED PROJECTS.
AGGREGATE ANNUAL GHG SAVINGS FOR PLANNED AND COMPLETED PROJECTS.
50,468tCO2e GHG REDUCED
$11,296,883COST SAVINGS

21 | NYC CARBON CHALLENGE PROGRESS REPORT APRIL 2018
To make progress toward the GHG emissions reduction goal, MSK has:
• Completed LED lighting upgrades in five buildings, reducing annual electricity consumption by 1.9 million kWh and saving over $400,000 per year.
• Implemented energy efficiency measures at the Zuckerman Research Center, including an upgrade to the building automation system to allow for enhanced HVAC controls, new variable frequency drives (VFDs) on laboratory fume hood exhaust fans that allows exhaust to fluctuate based on static need of the system, installation of demand ventilation control in labs and the vivarium, and chilled water demand control, saving over $2.5 million per year.
• Implemented controls to reduce peak electrical load by controlling VFDs for various fans and pumps, saving over $600,000 per year.
• Created a user-friendly Computer Power Up and Shutdown Scheduler that allows users to schedule their computers to shut down at a designated time each night, increasing the shutdown rate from 16 percent in 2009 to 80 percent in 2016 and saving more than $230,000 per year.
Memorial Sloan Kettering Cancer Center
Memorial Sloan Kettering Cancer Center (MSK) is one of the world’s oldest and largest private cancer centers, with over three million square feet of care, administrative, and research facilities spread throughout the city.
Accepting the Challenge in 2009, MSK has met its initial 30 percent GHG emissions reduction target and has committed to a 50 percent reduction below 2007 levels by 2025. From 2007 – 2016, MSK has invested over $16.5 million in energy-related system upgrades.
MEMORIAL SLOAN KETTERING IMPLEMENTS DIVERSE SET OF STRATEGIES TO MEET 30 PERCENT REDUCTION GOAL, EXTENDS COMMITMENT TO 50 PERCENT REDUCTION IN GHG EMISSIONS
CASE STUDY

22 | NYC CARBON CHALLENGE PROGRESS REPORT APRIL 2018
MSK has continued to realize the value of staff education by teaching plant operators about its larger institutional sustainability mission and empowering them to identify opportunities to contribute to the achievement of MSK’s NYC Carbon Challenge goal.
To date, MSK has trained 76 plant operators in the City University of New York (CUNY) Building Performance Lab’s (BPL) Building Operator Training (BOC®) Level I and II, a nationally recognized training and certification program focused on energy-efficient building operations and preventative maintenance procedures.
To obtain this training, MSK sent their facilities staff to classes offered by the CUNY BPL. After the first round of training in 2011, MSK began to provide annual in-house classes for all building operators in both levels of BOC®.
These courses have inspired building operators to look for energy efficiency opportunities and have created a strong culture of energy management. In 2016, utilizing the knowledge from the BOC® course, building staff identified an opportunity to further reduce the air changes per hour from 12 to 6 in the Main Campus operating rooms during unoccupied times.
MSK plant operators collected the necessary data to ensure this operational adjustment was possible and assembled a report that outlined the potential energy reductions and cost savings. The adjustments to air changes were made in early 2016 and it is expected that this project will save nearly one million kWh per year.
PROJECT HIGHLIGHT: SUSTAINABILITY TRAINING FOR STAFF
FACILITIES STAFF AT MSK

23 | NYC CARBON CHALLENGE PROGRESS REPORT APRIL 2018
Totaling over 21 million square feet, NYC Health + Hospitals (NYC H+H) is the largest integrated municipal healthcare system in the United States. In the summer of 2015, the NYC H+H Energy Management Unit completed a preliminary assessment of the conditions of high pressure steam traps with the assistance of three Environmental Defense Fund Climate Corps Fellows. Equipped with thermal cameras and ultrasonic testing equipment, the Fellows tested over 700 high pressure traps at 15 facilities. After the study was completed, a professional steam trap vendor was subsequently hired to tag the location of traps at all facilities.
In 2017, NYC H+H completed its first phase of the program, replacing 422 high/medium pressure and 127 low pressure steam traps, as well as installing over 1,000 insulation jackets for the steam traps at 12 facilities. The $810,000 project was funded by the NYC Department of Citywide Administrative Services (DCAS). The project is expected to reduce total GHG emissions by 2.5 percent and result in energy cost savings of $1 million. NYC H+H is now in the process of replacing all defective low pressure traps system-wide.
CASE STUDIES
NYC Health + Hospitals (NYC H+H)
Montefiore Medical CenterMontefiore has implemented a robust waste management strategy to address the amount of waste generated from their campuses, which includes a single-stream recycling initiative, an electronic waste recycling program, and two biodigesters. The waste program is managed by a dedicated staff member, the Green Initiative Liaison, who reports through the Engineering Team.
The electronic waste program has resulted in a 29 percent increase in recycled electronic waste from 2016 to 2017 and the biodigesters have prevented an estimated 150,000 pounds of food waste from going to landfill each year. Additionally, to reduce single use medical instruments, Montefiore uses a third-party to reprocess some devices by sterilizing, repairing, and repackaging them. To date, Montefiore has increased its recycling rate to 24.73 percent and decreased medical waste by 5.5 percent from 2015 to 2017.

24 | NYC CARBON CHALLENGE PROGRESS REPORT APRIL 2018

25 | NYC CARBON CHALLENGE PROGRESS REPORT APRIL 2018
Commercial buildings account for roughly 30 percent of New York City’s GHG emissions and the energy used in leased interior tenant space accounts for 40 to 60 percent of total energy consumption in a typical commercial building. However, commercial owners and tenants face a range of major barriers to coordination that delay or prevent uptake of energy efficiency and cost-saving measures. These include lack of coordination between base building and supplemental heating and cooling systems, oversizing of equipment in new tenant space fit-outs, and increasing energy use from space densification, plug loads, and information technology equipment, which leads to increased demands on the base building systems.
Building owners and commercial tenants that lease out office space face major differences in operational control over energy use. Realizing many of the opportunities to reduce energy use from both base building systems and commercial tenant spaces require better alignment between owners and tenants to ensure they are approaching energy efficiency upgrades in concert.
The City launched the NYC Carbon Challenge for Commercial Offices in 2013 to include large commercial firms that are either commercial tenants that lease office space or own and occupy commercial buildings (commercial “owner-occupiers”). In 2017, the City partnered with the Real Estate Board of New York (REBNY) to expand the NYC Carbon Challenge for Commercial Offices to include owners and additional tenants. The goal of the expanded program, which programmatically brought together owners and tenants for the first
Commercial Owners and Tenants
time, is to help develop solutions to longstanding coordination barriers between these parties on energy efficiency.
After the program was launched, the Mayor’s Office convened a series of working group meetings to provide a forum for participants to develop solutions to issues around energy metering, tenant engagement, leasing, financing, new fit-outs, and major renovations. The working groups generated solutions that include guidance on sub-metering technologies, recommended templates for owner and tenant maintenance plans, and innovative financing for tenant energy efficiency improvements that includes on-lease repayment.
Participants are in the process of piloting these solutions in their buildings, with a long-term focus of creating replicable and scalable solutions for the broader market, which the City will work to encourage through new policies, industry resources, and public recognition to help unlock the full potential of energy efficiency opportunities in commercial buildings.
NYC CARBON CHALLENGE PARTNER MEETING

26 | NYC CARBON CHALLENGE PROGRESS REPORT APRIL 2018
In 2013, eight commercial tenants and three owner-occupiers committed to reduce their GHG emissions by 30 percent or more in ten years. Since then, an additional 13 commercial tenants and two owner-occupiers have joined the Challenge, bringing the total to 21 commercial tenants and five owner-occupiers.
Over the last several years, there has been a continuing trend towards densification of office space as commercial firms move toward open office set-ups, increase remote working, and reconfigure spaces in other ways. This means that more employees can work in the same amount of office space, which increases the energy use intensity within the space. As such, commercial participants have the opportunity to normalize their GHG emissions based on square footage or number of FTE employees within their space.
In their base years, participating commercial participants normalizing their GHG emissions per FTE employed more than 31,000 people and emitted more than 163,000 tCO2e associated with their electricity and heating consumption. By 2016, these participants increased headcount by 29 percent, adding more than 9,100 FTE employees, while reducing GHG emissions by more than 27,000 tCO2e. This equates to a 16.8 percent reduction in absolute GHG emissions and a 35.5 percent reduction in GHG emissions per FTE. Participant’s energy consumption decreased proportionally, with a decrease in absolute energy consumption by 14.7 percent and a decrease in energy use intensity by 33.8 percent. It is estimated that participants have saved over $9.3 million per year in reduced energy costs.
Commercial Tenants
The commercial office participants normalizing their GHG emissions per square foot have significantly expanded their office footprint over the course of the Challenge. These participants increased square footage by close to 15 percent, adding almost 2.4 million square feet between their base years and 2016. Simultaneously, these participants reduced their absolute GHG emissions by 22.8 percent, for a total of 59,000 tCO2e, and GHG emissions per square foot by 33 percent. Participant’s energy consumption decreased proportionally, with a decrease in absolute energy consumption by 22.8 percent and a decrease in energy use intensity by 33.4 percent. It is estimated that these commercial office participants have saved over $18.2 million per year in reduced energy costs. In total, these participants reduced absolute GHG emissions by more than 86,000 tCO2e, the equivalent of taking 15,000 cars off the road.
21% GHG REDUCTION
16,020,672 SQ. FT. IN BASE YEAR18,437,324 SQ. FT. IN 2016
31,717 FTE EMPLOYEES IN BASE YEAR40,897 FTE EMPLOYEES IN 2016
15% INCREASE IN FLOOR AREA
29% INCREASE IN FTE EMPLOYEES
421,728 tCO2e IN BASE YEAR
335,007 tCO2e EMITTED IN 2016

27 | NYC CARBON CHALLENGE PROGRESS REPORT APRIL 2018
ParticipantsALLEN & OVERY LLP 30%
BARCLAYS 30%
BARNES & NOBLE 45%
BLACKROCK 40%
BLOOMBERG LP 50%
CITI 50%
CREDIT SUISSE 40%
DEUTSCHE BANK 50%
ENVIRONMENTAL DEFENSE FUND 30%
ETSY 50%
FRIED, FRANK, HARRIS, SHRIVER & JACOBSON LLP 30%
GOLDMAN SACHS 40%
GOOGLE 50%
INTERPUBLIC GROUP 30%
JB&B 40%
JETBLUE 30%
JP MORGAN CHASE 30%
KIRKLAND & ELLIS, LLP 30%
MORGAN STANLEY 50%
NATURAL RESOURCES DEFENSE COUNCIL 50%
PAUL, WEISS, RIFKIND, WHARTON & GARRISON LLP 30%
PFIZER 30%
PVH CORP. 30%
STROOCK & STROOCK & LAVAN LLP 30%
SUMITOMO CORPORATION OF AMERICAS 30%
UBS 40%
VIACOM 30%
WHITE & CASE LLP 30%
YMCA OF GREATER NEW YORK 30%
AND CHALLENGE REDUCTION GOAL
When the NYC Carbon Challenge for Commercial Owners and Tenants launched in 2017, tenant participants across the commercial, college and university, and hospital Challenge sectors who had leased spaces that were already committed to the Challenge worked closely with owner participants to align their GHG reduction targets. Challenge participants who leased space made a GHG emissions reduction target in their sub-metered electricity consumption or already had leased space as part of their Challenge portfolio. Commercial owners made GHG emissions reduction commitments from the energy consumed in their base building systems. The Mayor’s Office brokered partnerships between the Challenge participants with leased space and participating owners to align both of their GHG emissions reduction targets and make joint, whole building GHG emissions reduction commitments together.

28 | NYC CARBON CHALLENGE PROGRESS REPORT APRIL 2018
HEATING & COOLING
$3.2 M$2.9 M
$1.8 M
7,432tCO2e
2,460tCO2e
4,192tCO2e 4,444
tCO2e
$1.2 M
O&M BEHAVIOR
CHANGE
DISTRIBUTIONSYSTEMS
LIGHTING &PLUG LOAD
CLIMATE ACTION PLAN RESULTS
Commercial participants have made progress towards their GHG emissions reduction goals by deploying a wide variety of energy efficiency measures and operational improvements. Seven commercial tenants and owner-occupiers submitted complete information on planned and completed projects to the Mayor’s Office through their Climate Action Plan reports. Complete project information includes data on installation cost as well as energy and cost savings.
Participants reported 85 projects, with an average of 3,500 MMBtu each and savings of more than $100,000 per project. Reported projects had average simple payback period of 3.4 years. The combined installation cost of all projects was over $31 million, yielding a total energy savings of nearly 300,000 MMBtu.
These strategies differ from universities and hospitals, with a much greater focus on electricity reductions from lighting and plug loads. This is due to the fact that these energy uses dominate commercial office energy use, and many commercial tenant participants do not have control over base building heating and cooling systems in their buildings.
AGGREGATE ANNUAL COST SAVINGS FOR PLANNED AND COMPLETED PROJECTS.
18,527tCO2e GHG REDUCED
$9,122,936COST SAVINGS
AGGREGATE ANNUAL GHG SAVINGS FOR PLANNED AND COMPLETED PROJECTS.

29 | NYC CARBON CHALLENGE PROGRESS REPORT APRIL 2018
In support of its Corporate Climate Action Plan, Credit Suisse met the 40 percent goal via several strategies:
• Implemented automated vacancy switching controls to decrease the electrical consumption of plug loads.
• Decreased the electrical consumption of information technology equipment through desktop and network upgrades.
• Upgraded air conditioning and ventilation equipment through efficiency upgrades and simpler configurations.
• Optimized control sequences of mechanical and electrical systems to increase system efficiency.
• Lowered the peak electrical demand through the automated control of electrical motor operation.
• Increased the productivity of real estate floor area through implementation of activity-based working.
Credit Suisse
Credit Suisse accepted the NYC Carbon Challenge in 2013, committing to reduce the GHG emissions intensity of their New York City tenancies by 40 percent from 2006 levels by 2023.
Credit Suisse has met the Challenge goal early, achieving a 40 percent reduction in their GHG emissions intensity in 2016. Credit Suisse’s achieved the goal by maintaining a consistent downward trend in GHG emissions through continued operational diligence and innovation.
CREDIT SUISSE STRATEGICALLY PLANS AND EXECUTES GHG REDUCTION STRATEGY, MEETING NYC CARBON CHALLENGE GOAL SEVEN YEARS EARLY
CASE STUDY
CREDIT SUISSE NEW YORK CITY HQ
30 | NYC CARBON CHALLENGE PROGRESS REPORT APRIL 2018
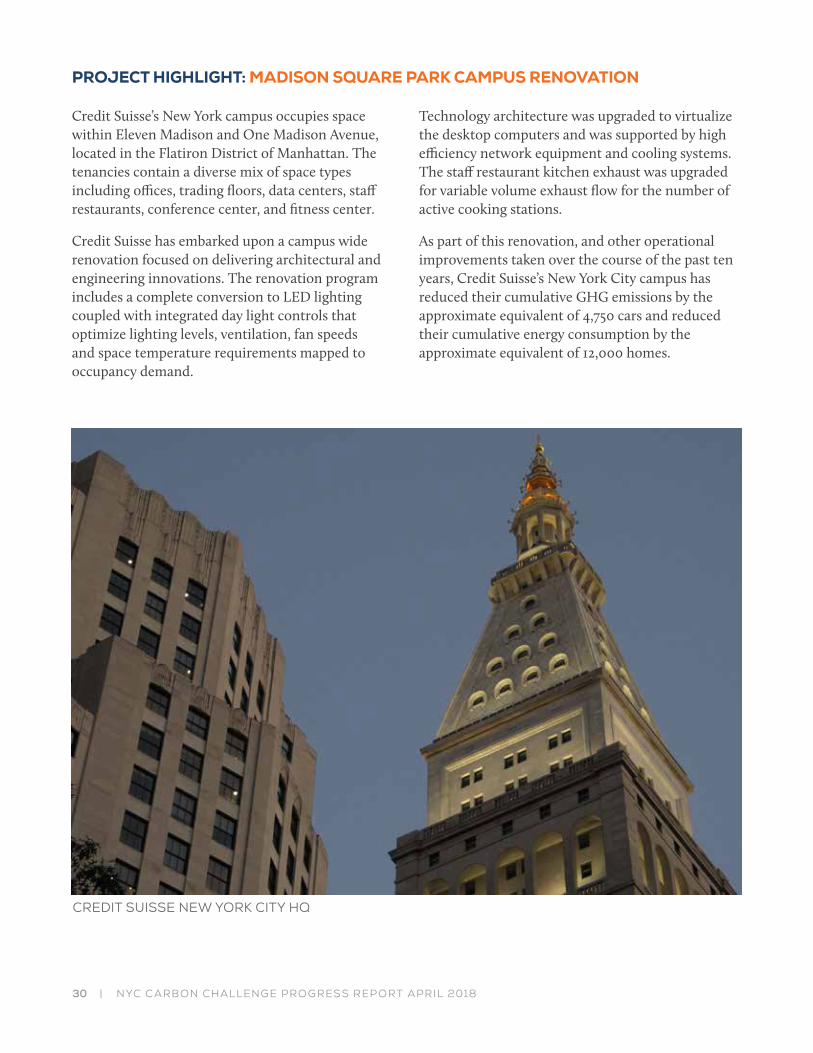
Credit Suisse’s New York campus occupies space within Eleven Madison and One Madison Avenue, located in the Flatiron District of Manhattan. The tenancies contain a diverse mix of space types including offices, trading floors, data centers, staff restaurants, conference center, and fitness center.
Credit Suisse has embarked upon a campus wide renovation focused on delivering architectural and engineering innovations. The renovation program includes a complete conversion to LED lighting coupled with integrated day light controls that optimize lighting levels, ventilation, fan speeds and space temperature requirements mapped to occupancy demand.
Technology architecture was upgraded to virtualize the desktop computers and was supported by high efficiency network equipment and cooling systems. The staff restaurant kitchen exhaust was upgraded for variable volume exhaust flow for the number of active cooking stations.
As part of this renovation, and other operational improvements taken over the course of the past ten years, Credit Suisse’s New York City campus has reduced their cumulative GHG emissions by the approximate equivalent of 4,750 cars and reduced their cumulative energy consumption by the approximate equivalent of 12,000 homes.
PROJECT HIGHLIGHT: MADISON SQUARE PARK CAMPUS RENOVATION
CREDIT SUISSE NEW YORK CITY HQ

31 | NYC CARBON CHALLENGE PROGRESS REPORT APRIL 2018
Bloomberg LP partnered with EnterSolar to develop the Bloomberg – JFK Airport Park Solar Project, a 1.5 megawatt (MW) roof-mounted commercial solar photovoltaic system located on warehouses near JFK airport. The system utilizes Remote Net Metering (RNM) to allow Bloomberg’s global headquarters at 731 Lexington Avenue in Manhattan to receive a net metering credit for the solar energy.
Since 2015 the system has produced nearly four million kWh of clean electricity – in 2016 the system offset 5 percent of electricity at 731 Lexington Avenue – reducing Bloomberg’s GHG emissions by over 535 tCO2e. The system’s annual output is equivalent to the electricity usage of 244 homes for one year. This multi-building system is the largest rooftop solar array in Queens, one of the largest installations in New York State, and the first project to use RNM to power a New York City skyscraper.
CASE STUDIES
Bloomberg LP
PVH Corp.PVH Corp. is a global apparel company which owns brands such as Tommy Hilfiger, Calvin Klein, and IZOD. Headquartered in New York City, PVH leases more than 740,000 square feet across four commercial office buildings. At the Calvin Klein headquarters, located at 205 West 39th Street, lighting retrofits and occupancy sensor installations across nine floors have resulted in cost savings of over $93,000 per year.
In March 2018, the Calvin Klein headquarters kicked off an energy assessment through NYSERDA’s Commercial Tenant Program to identify deeper energy reductions beyond lighting retrofits. PVH also completed the same assessment for its new Tommy Hilfiger offices in 2017, which identified $2.3 million in lighting and HVAC energy efficiency opportunities over the 16-year lease term. Since 2011, PVH has reduced its GHG emissions intensity, measured by total GHG emissions per full-time equivalent employee, by more than 21 percent.
32 | NYC CARBON CHALLENGE PROGRESS REPORT APRIL 2018
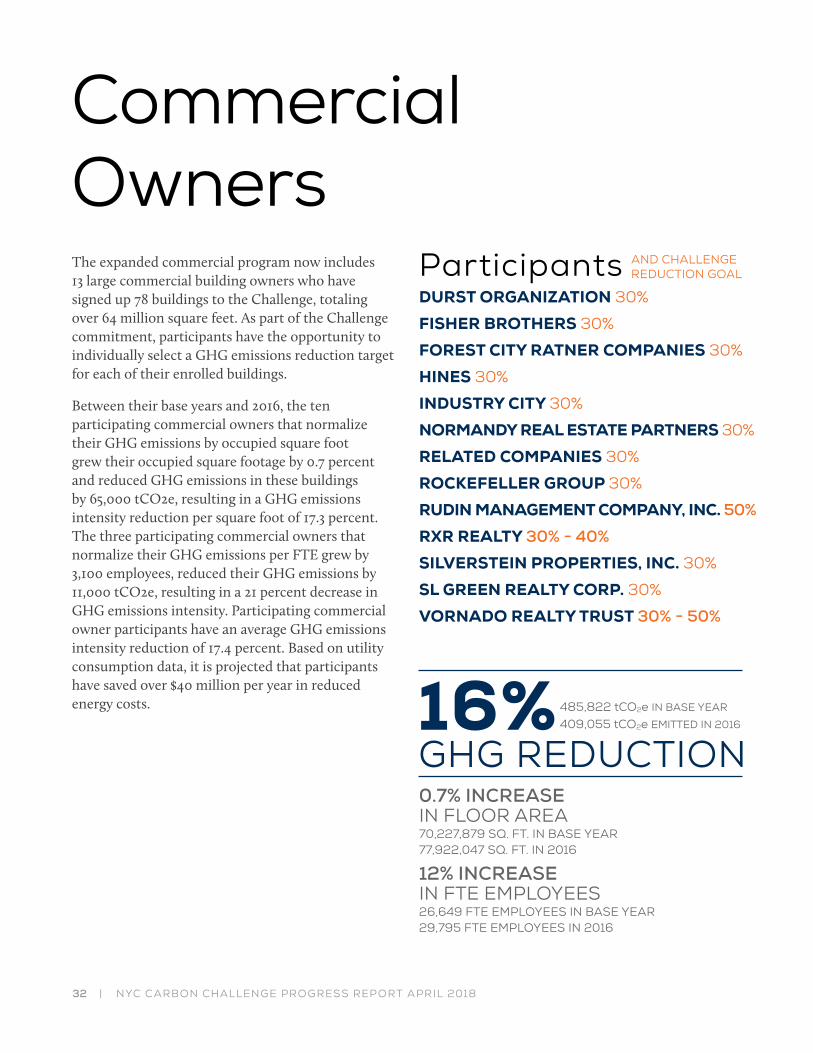
The expanded commercial program now includes 13 large commercial building owners who have signed up 78 buildings to the Challenge, totaling over 64 million square feet. As part of the Challenge commitment, participants have the opportunity to individually select a GHG emissions reduction target for each of their enrolled buildings.
Between their base years and 2016, the ten participating commercial owners that normalize their GHG emissions by occupied square foot grew their occupied square footage by 0.7 percent and reduced GHG emissions in these buildings by 65,000 tCO2e, resulting in a GHG emissions intensity reduction per square foot of 17.3 percent. The three participating commercial owners that normalize their GHG emissions per FTE grew by 3,100 employees, reduced their GHG emissions by 11,000 tCO2e, resulting in a 21 percent decrease in GHG emissions intensity. Participating commercial owner participants have an average GHG emissions intensity reduction of 17.4 percent. Based on utility consumption data, it is projected that participants have saved over $40 million per year in reduced energy costs.
CommercialOwners
16% GHG REDUCTION
ParticipantsDURST ORGANIZATION 30%
FISHER BROTHERS 30%
FOREST CITY RATNER COMPANIES 30%
HINES 30%
INDUSTRY CITY 30%
NORMANDY REAL ESTATE PARTNERS 30%
RELATED COMPANIES 30%
ROCKEFELLER GROUP 30%
RUDIN MANAGEMENT COMPANY, INC. 50%
RXR REALTY 30% - 40%
SILVERSTEIN PROPERTIES, INC. 30%
SL GREEN REALTY CORP. 30%
VORNADO REALTY TRUST 30% - 50%
70,227,879 SQ. FT. IN BASE YEAR77,922,047 SQ. FT. IN 2016
0.7% INCREASE IN FLOOR AREA
485,822 tCO2e IN BASE YEAR
409,055 tCO2e EMITTED IN 2016
AND CHALLENGE REDUCTION GOAL
26,649 FTE EMPLOYEES IN BASE YEAR29,795 FTE EMPLOYEES IN 2016
12% INCREASE IN FTE EMPLOYEES

33 | NYC CARBON CHALLENGE PROGRESS REPORT APRIL 2018
ParticipantsDURST ORGANIZATION 30%
FISHER BROTHERS 30%
FOREST CITY RATNER COMPANIES 30%
HINES 30%
INDUSTRY CITY 30%
NORMANDY REAL ESTATE PARTNERS 30%
RELATED COMPANIES 30%
ROCKEFELLER GROUP 30%
RUDIN MANAGEMENT COMPANY, INC. 50%
RXR REALTY 30% - 40%
SILVERSTEIN PROPERTIES, INC. 30%
SL GREEN REALTY CORP. 30%
VORNADO REALTY TRUST 30% - 50%
To make progress towards the 30 percent goal, SL Green:
• Replaced all rooftop display and common area lighting with high-efficiency LED fixtures.
• Upgraded building management systems and energy management software to run air handling units and condenser water pumps based on outside temperature and building space conditions, instead of fixed schedules.
• Upgraded air handling units with variable frequency drives, new controlling sensors and air monitoring stations.
• Retro-commissioned all operating equipment, including central heating, ventilation, and air-conditioning systems.
• Installed ceiling and piping insulation in steam room and installed air flap curtains at loading docks to reduce leakage of conditioned air .
SL GreenViacom Inc.
SL Green Realty Corp. is New York City’s largest commercial building owner and has enrolled eight of its properties—totaling more than eight million square feet—in the NYC Carbon Challenge. By 2026, SL Green has committed to reducing the greenhouse gas emissions of each these buildings 30 percent below their respective base years ranging from 2011 to 2014.
NEW YORK CITY’S LARGEST COMMERCIAL BUILDING OWNER COMMITS TO REDUCE GHG EMISSIONS BY 30 PERCENT IN PARTNERSHIP WITH TENANTS IN MORE THAN 8 MILLION SQUARE FEET OF REAL ESTATE
CASE STUDY
VIACOM INC. LOBBY IN 1515 BROADWAY

34 | NYC CARBON CHALLENGE PROGRESS REPORT APRIL 2018
In August 2012, Viacom Inc. renewed and extended its lease with SL Green Realty Corp., occupying 1.3 million square feet for its global headquarters at 1515 Broadway in Times Square. Located in a densely populated area with a Broadway theater and concert venue as tenants, the building provides significant opportunities to increase sustainability.
As part of the lease renewal, SL Green agreed to enhance the operational efficiency of both the base building and Viacom’s leased spaces. To advance energy reduction initiatives, the companies created employee “green teams”, comprised of executive leadership and staff from operations, engineering, leasing, and facilities. Together, these teams evaluated vendors and new technologies, and implemented energy efficiency and sustainability strategies.
Projects completed through this partnership include the retrofitting of all common spaces with LED lighting, optimization of steam plant controls and pipe insulation, and improvements in the flexibility
and efficiency of air handlers, as well as the implementation of a building management system (BMS) to track and improve building efficiency, and software to power down computers and phones after-hours. Additional enhancements include the planting of a green roof and terrace garden on-premises to reduce the urban heat island effect of the building and supply local produce for the cafeteria.
To date, Viacom and SL Green have achieved a 24 percent energy reduction, resulting in $2.3 million of annual utility savings during the course of improvements and $7 million of overall savings. SL Green expects an additional five percent reduction in energy once all measures are fully operational. In recognition of these efforts, the building has been awarded a LEED® Gold certification for Existing Buildings: Operations and Maintenance, and Viacom holds LEED® Commercial Interiors certifications across nine of the 45 floors that it occupies.
PROJECT HIGHLIGHT: SL GREEN AND VIACOM SUSTAINABILITY PARTNERSHIP
VIACOM LOBBY IN 1515 BROADWAY
35 | NYC CARBON CHALLENGE PROGRESS REPORT APRIL 2018
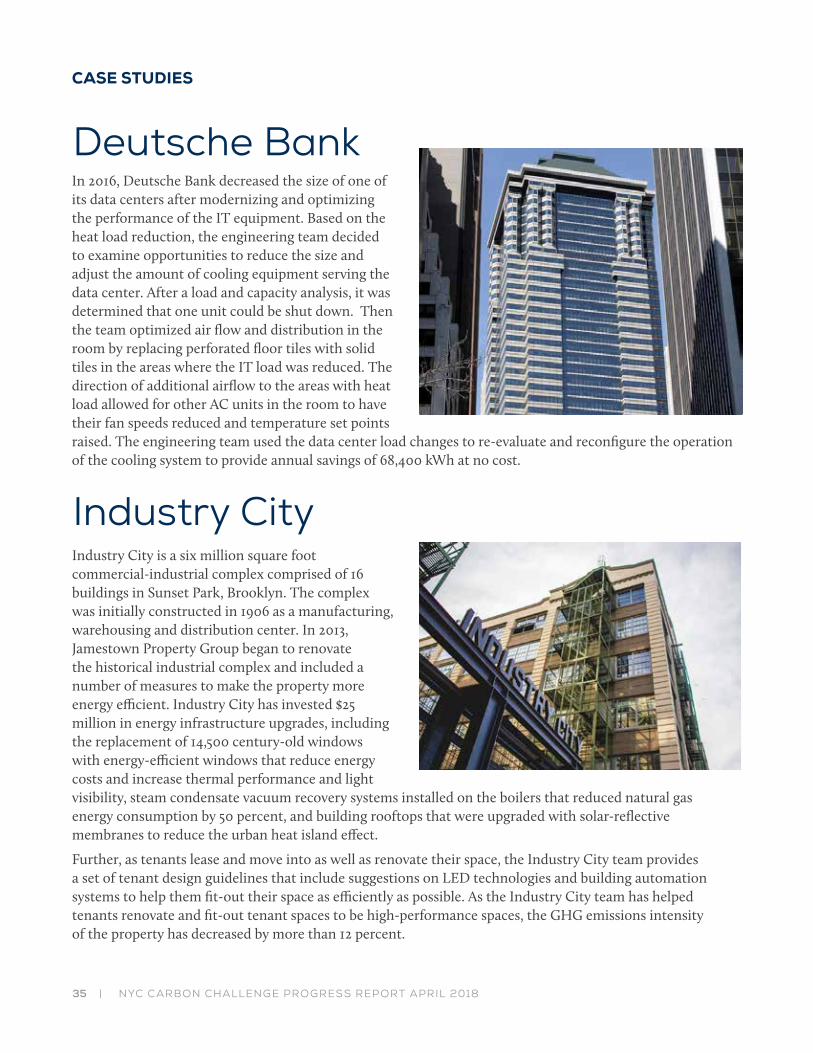
In 2016, Deutsche Bank decreased the size of one of its data centers after modernizing and optimizing the performance of the IT equipment. Based on the heat load reduction, the engineering team decided to examine opportunities to reduce the size and adjust the amount of cooling equipment serving the data center. After a load and capacity analysis, it was determined that one unit could be shut down. Then the team optimized air flow and distribution in the room by replacing perforated floor tiles with solid tiles in the areas where the IT load was reduced. The direction of additional airflow to the areas with heat load allowed for other AC units in the room to have their fan speeds reduced and temperature set points raised. The engineering team used the data center load changes to re-evaluate and reconfigure the operation of the cooling system to provide annual savings of 68,400 kWh at no cost.
CASE STUDIES
Deutsche Bank
Industry CityIndustry City is a six million square foot commercial-industrial complex comprised of 16 buildings in Sunset Park, Brooklyn. The complex was initially constructed in 1906 as a manufacturing, warehousing and distribution center. In 2013, Jamestown Property Group began to renovate the historical industrial complex and included a number of measures to make the property more energy efficient. Industry City has invested $25 million in energy infrastructure upgrades, including the replacement of 14,500 century-old windows with energy-efficient windows that reduce energy costs and increase thermal performance and light visibility, steam condensate vacuum recovery systems installed on the boilers that reduced natural gas energy consumption by 50 percent, and building rooftops that were upgraded with solar-reflective membranes to reduce the urban heat island effect.
Further, as tenants lease and move into as well as renovate their space, the Industry City team provides a set of tenant design guidelines that include suggestions on LED technologies and building automation systems to help them fit-out their space as efficiently as possible. As the Industry City team has helped tenants renovate and fit-out tenant spaces to be high-performance spaces, the GHG emissions intensity of the property has decreased by more than 12 percent.

36 | NYC CARBON CHALLENGE PROGRESS REPORT APRIL 2018

37 | NYC CARBON CHALLENGE PROGRESS REPORT APRIL 2018
ParticipantsA&E REAL ESTATE 30%
AKAM ASSOCIATES, INC. 30%
ASCENDANT NEIGHBORHOOD DEVELOPMENT CORPORATION 30%
AVALONBAY COMMUNITIES, INC. 30%
CHARLES H. GREENTHAL MANAGEMENT CORP. 30%
COMMUNITY LEAGUE OF THE HEIGHTS 30%
DOUGLAS ELLIMAN PROPERTY MANAGEMENT 30%
FIRSTSERVICE RESIDENTIAL 30%
HARLEM CONGREGATIONS FOR COMMUNITY IMPROVEMENT 30%
MARION SCOTT REAL ESTATE, INC. 30%
MILFORD MANAGEMENT 30%
NEW HOLLAND RESIDENCES 30%
NEW YORK CITY HOUSING AUTHORITY 30%
PENN SOUTH 40%
PRESTIGE MANAGEMENT 30%
RISEBORO COMMUNITY PARTNERSHIP 30%
RIVERBAY CORPORATION AT CO-OP CITY 30%
ROSE ASSOCIATES 30%
SELFHELP COMMUNITY SERVICES INC. 30%
SOLSTICE RESIDENTIAL 30%
STUYTOWN PROPERTY SERVICES 30%
URBAN AMERICAN 30%
AND CHALLENGE REDUCTION GOAL
In 2013, New York City launched the NYC Carbon Challenge for Multifamily Buildings to engage the City’s largest residential property management companies in committing to reduce their GHG emissions by 30 percent or more. Residential buildings account for 33 percent of New York City’s total GHG emissions, making up the largest single source of emissions in the city. The Challenge now includes 22 residential property management companies, owners, and the New York City Housing Authority (NYCHA).
Today, the building portfolios of multifamily participants make up more than 3,400 buildings, 300 million square feet, and 270,000 apartment units across the city. This includes over 200,000 units of affordable housing across the city.
Multifamily participants have reduced the absolute GHG emissions from buildings in their Challenge portfolios by more than 11 percent, equating roughly to 239,000 tCO2e. Participants have experienced minor turnover in their portfolios, resulting in a slight decrease in square footage. This did not significantly affect participants’ GHG intensity—they have achieved an 11.3 percent decrease in GHG emissions per square foot since their base years. It is estimated that multifamily participants have saved $59 million per year in reduced energy costs.
Multifamily
11% GHG REDUCTION
2,096,037 tCO2e IN BASE YEAR
1,862,563 tCO2e EMITTED IN 2016

38 | NYC CARBON CHALLENGE PROGRESS REPORT APRIL 2018
The first participant to sign on to the NYC Carbon Challenge for Multifamily Buildings in 2013, FirstService Residential has committed 61 multifamily buildings, accounting for over 14 million square feet of real estate, to a 30 percent reduction in GHG emissions. To help their portfolio enhance its energy performance, FirstService Residential created FS Energy, a subsidiary that offers energy advisory services on benchmarking, energy audits, energy project implementation, and education and training.
FS Energy meets regularly with building managers and co-op and condo boards to help them understand their energy consumption and available energy efficiency opportunities. FS Energy works with these entities to proactively implement energy conservation measures and operations and maintenance changes that will increase the efficiency of these buildings. Additionally, FS Energy holds quarterly operations and maintenance trainings for building staff to improve building performance. Since 2016, over 200 building operators have attended a training on steam management, over 500 building operators attended a cooling tower best practices and maintenance training, and more than 650 property managers and building staff members are in the process of being trained on basic building science principles.
CASE STUDIES
FirstService Residential
New York City Housing AuthorityThe New York City Housing Authority (NYCHA) Sustainability Agenda is an extension of NextGeneration NYCHA, a ten-year roadmap to improve quality of life for the 400,000 New Yorkers who live in NYCHA communities. The Sustainability Agenda highlights NYCHA’s commitment to create healthy and comfortable homes that will withstand the challenges of climate change.
Strategies include clean and distributed energy projects, efficient and reliable heat and hot water, a comprehensive waste management plan, energy efficiency retrofits, green infrastructure projects, and resiliency adaptation. A key milestone was reached in fall 2017 when NYCHA announced plans to install 25 MW of solar capacity across the five boroughs. This is NYCHA’s first large-scale solar program, which will provide public housing residents access to clean, low-cost energy and jobs in the growing solar industry.
RECENT EDUCATION TRAINING SEMINAR
NYCHA’S LARGE-SCALE SOLAR PROJECT

39 | NYC CARBON CHALLENGE PROGRESS REPORT APRIL 2018
Recently completed and planned energy upgrade projects include:
• Upgraded to LED fixtures in common areas and bi-level LED fixtures in stairwells; saving 5.7 million kWh annually.
• Modified existing single-pipe steam heat/vacuum return system, by installing riser zone control valves and sensors controlled through the BMS based on apartment and outside air temperatures.
• Installed BMS-controlled louvers in elevator shafts and stairwells, reducing energy loss from the stack effect and improving the building envelope.
• Installed variable frequency drives on 16 garage exhaust fans to prevent them from running constantly.
• Installed higher efficiency primary heat exchangers to reduce steam consumption by reusing heating condensate to heat hot water.
• Painting rooftops of all 110 housing structures with white, reflective paint in order to create “cool roofs” and reduce the A/C load.
• Installing a 3.8 megawatt (MW) solar PV system across the 22 acres of rooftops, which will be the largest private multifamily rooftop solar array in the United States.
Stuyvesant Town & Peter Cooper Village
Stuyvesant Town & Peter Cooper Village (StuyTown) is a multifamily complex located in Manhattan, just east of Gramercy Park and Union Square, encompassing 80 acres that include recreation areas, fitness centers, administrative offices, water features and 11,246 housing units.
StuyTown is among the first multifamily building operators in the country to earn the ENERGY STAR® certification rating. StuyTown has committed to a 30 percent reduction in GHG emissions below a 2008 baseline, and to date has achieved over a seven percent reduction in emissions.
STUYTOWN LEADS THE CHARGE IN MULTIFAMILY HOUSING TO OPTIMIZE ENERGY USE AND REDUCE GHG EMISSIONS
CASE STUDY
THE GROUNDS AT STUYTOWN

40 | NYC CARBON CHALLENGE PROGRESS REPORT APRIL 2018
In 2007, Stuytown installed a BMS to centralize the monitoring of utilities and critical infrastructure of all 110 buildings on the property. In 2012, Stuytown revamped the system to add further enhancements, giving the engineering staff improved control of the property’s steam heating distribution system.
Prior to the implementation of the BMS, the steam distribution system only had the capability to fluctuate between on and off. The BMS now allows the engineering staff to remotely modulate steam consumption based on outside air temperature and apartment sensors. There are three sensors on each apartment riser and the lowest temperature on the line will trigger the heat to be turned on. This will prevent the heating system from running constantly. If indoor air temperatures are held at
intended levels, the steam will be turned off. The BMS provides alerts and alarms in real time when there are any issues with the infrastructure that is tied back to the control panels.
Annual upgrades are made to the BMS, including tying primary heat exchangers back to the BMS to monitor hot water temperatures and laundry room lighting levels, and allowing system control to be based on clock time rather than outdated manual timers. Future plans include programming the outside lighting to be based on time of day rather than light detection monitors and tying utility meters, including steam, electric interval, and natural gas meters back to the BMS so that usage can be trended throughout the day.
PROJECT HIGHLIGHT: BUILDING MANAGEMENT SYSTEM INSTALLATION AND CONTINUOUS IMPROVEMENT
RENDERING OF STUYTOWN WITH SOLAR PV
41 | NYC CARBON CHALLENGE PROGRESS REPORT APRIL 2018
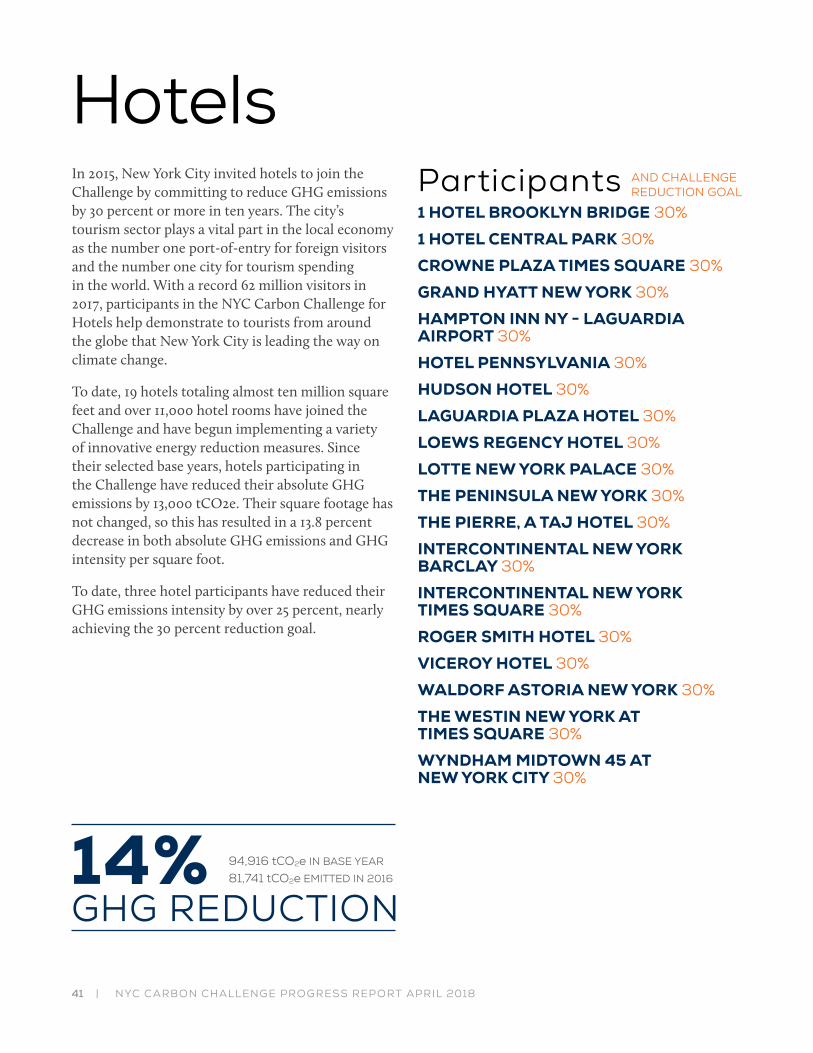
Participants1 HOTEL BROOKLYN BRIDGE 30%
1 HOTEL CENTRAL PARK 30%
CROWNE PLAZA TIMES SQUARE 30%
GRAND HYATT NEW YORK 30%
HAMPTON INN NY - LAGUARDIA AIRPORT 30%
HOTEL PENNSYLVANIA 30%
HUDSON HOTEL 30%
LAGUARDIA PLAZA HOTEL 30%
LOEWS REGENCY HOTEL 30%
LOTTE NEW YORK PALACE 30%
THE PENINSULA NEW YORK 30%
THE PIERRE, A TAJ HOTEL 30%
INTERCONTINENTAL NEW YORK BARCLAY 30%
INTERCONTINENTAL NEW YORK TIMES SQUARE 30%
ROGER SMITH HOTEL 30%
VICEROY HOTEL 30%
WALDORF ASTORIA NEW YORK 30%
THE WESTIN NEW YORK AT TIMES SQUARE 30%
WYNDHAM MIDTOWN 45 AT NEW YORK CITY 30%
AND CHALLENGE REDUCTION GOAL
In 2015, New York City invited hotels to join the Challenge by committing to reduce GHG emissions by 30 percent or more in ten years. The city’s tourism sector plays a vital part in the local economy as the number one port-of-entry for foreign visitors and the number one city for tourism spending in the world. With a record 62 million visitors in 2017, participants in the NYC Carbon Challenge for Hotels help demonstrate to tourists from around the globe that New York City is leading the way on climate change.
To date, 19 hotels totaling almost ten million square feet and over 11,000 hotel rooms have joined the Challenge and have begun implementing a variety of innovative energy reduction measures. Since their selected base years, hotels participating in the Challenge have reduced their absolute GHG emissions by 13,000 tCO2e. Their square footage has not changed, so this has resulted in a 13.8 percent decrease in both absolute GHG emissions and GHG intensity per square foot.
To date, three hotel participants have reduced their GHG emissions intensity by over 25 percent, nearly achieving the 30 percent reduction goal.
Hotels
14% GHG REDUCTION
94,916 tCO2e IN BASE YEAR
81,741 tCO2e EMITTED IN 2016

42 | NYC CARBON CHALLENGE PROGRESS REPORT APRIL 2018
In 2014, the Lotte New York Palace, one of the City’s largest luxury hotels, installed a cogeneration system, also known as combined heat and power (CHP). The system contains twelve 65 kW microturbines and provide 780 kW of electric capacity and 3.45 MMBtu per hour of hot water to the hotel’s over 900 guest rooms. The heat recovery loop can operate in one of two modes depending on the season. During the cooling season, the microturbines supply hot water to an absorption chiller for cooling, offsetting approximately 2.5 million kWh annually from their existing electric chillers. During the heating season, the microturbines supply hot water to the “building side” of their city steam-to-hot water heat exchangers, which displaces the amount of district steam that needs to be purchased. This installation lowered the hotel’s energy costs by roughly 23 percent annually, as well as reduced the building’s GHG emissions by more than five percent.
CASE STUDIES
Lotte New York Palace
Loews RegencyAs the cooling tower at the Loews Regency neared the end of its useful life, the hotel’s Director of Engineering saw an opportunity to increase the efficiency of the system while improving guest comfort. Previously, the cooling tower held all of its water in a single cell; meaning air conditioning operations had to be shut down whenever it was being cleaned. In 2017, the cooling tower was refurbished to hold water in two cells to allow for uninterrupted air conditioning for guests during cleaning. This project is anticipated to result in an estimated 980,000 kWh of electricity savings. In addition to this upgrade, the hotel has also insulated windows in guest rooms, install LEDs in all lighting fixtures, and have upgraded elevators to efficient direct drive technology, resulting in almost a 28 percent reduction in GHG emissions.

43 | NYC CARBON CHALLENGE PROGRESS REPORT APRIL 2018
To make progress towards the 30 percent goal, Wyndham Midtown 45 undertook the following actions:
• Installed variable speed drives on condenser water pumps, cooling tower fans and chilled water loop to allow for modulation in cooling.
• Converted all stairwell, common area, corridor and unit lighting to LEDs.
• Replaced BMS to better modulate controls around the property.
Wyndham Midtown 45
Wyndham Midtown 45 at New York City is a vacation ownership resort located in midtown Manhattan. Comprising over 140,000 square feet, the resort has 202 newly renovated high-rise condominium units on 33 floors. In 2015, Wyndham Midtown 45 committed to reduce its GHG emissions by 30 percent. The building’s mechanical equipment includes absorption chillers and two dual fuel burners that consume both fuel oil and natural gas on site. Since 2016, Wyndham Midtown 45 has made energy efficiency investments that have reduced electric usage by 25 percent and natural gas usage by 12 percent, resulting in a nearly 20 percent reduction in GHG emissions and over $190,000 in cost savings.
WYNDHAM MIDTOWN 45 REDUCES GHG EMISSIONS BY 20 PERCENT ON PATH TO ACHIEVE NYC CARBON CHALLENGE GOAL
CASE STUDY

44 | NYC CARBON CHALLENGE PROGRESS REPORT APRIL 2018
Wyndham has established a corporate-wide standard for energy efficient operations in all of their buildings. At Wyndham Midtown 45, building operations staff are trained in energy efficiency best practices to educate them on what the benefit is and why they are doing it, and understand their role in meeting the Challenge goal. By doing so, Wyndham Midtown 45 has created a culture focused on energy efficiency that has empowered building staff to contribute new ideas and become champions of efficiency that has led to greater energy savings.
All Wyndham building operations staff are first trained in “Achieving Everyday Sustainability” basics at an orientation that teaches high-impact daily practices that can improve energy efficiency.
At Wyndham Midtown 45, building staff is trained by the mechanical vendors to help them get a better understanding of the unique characteristics of the building’s equipment and learn how to optimize equipment performance. When new equipment is installed, such as the building’s upgraded BMS, staff receive training on how to operate it as efficiently as possible.
Staff are also offered online classes from vendor partners such as “Sustainability 101,” which is required for all new team members, and other voluntary courses such as Energy Efficiency Fundamentals, Strategic Energy Planning, Energy Audits and Best Practices for Energy Efficient Facilities.
PROJECT HIGHLIGHT: BUILDING STAFF ENGAGEMENT

45 | NYC CARBON CHALLENGE PROGRESS REPORT APRIL 2018
Conclusion
The success of the NYC Carbon Challenge demonstrates that motivating voluntary action on the part of private and institutional sector leaders can lead to substantial progress on policy goals. Taken together, the efforts of the Challenge participants have a measurable impact on citywide emissions, making the Challenge a tremendously cost-effective way for New York City to make progress towards its 80 x 50 commitment. Visible City support and cross-sector collaborations among public, private, nonprofit, and utility partners has been effective at overcoming market barriers, incentivizing action, and demonstrating concrete and measurable results.
In the first decade of the program, Challenge participants have proved that a diversity of building types can achieve sharp GHG emissions reductions over a relatively short period of time through the work of dedicated energy management staff and consistent efforts to invest in smart upgrades. While voluntary action has been crucial to spurring early reductions in building GHG emissions in partnership with the city’s biggest and most prominent institutions, all buildings will need to be included in the City’s 80 x 50 efforts moving forward. The successes of the Challenge participants help provide a roadmap for how all buildings across New York City will eventually achieve similar reductions. We will continue to engage new and vitally important sectors and buildings of New York City in this effort as the City continues on its pathway to 80 x 50.

46 | NYC CARBON CHALLENGE PROGRESS REPORT APRIL 2018

47 | NYC CARBON CHALLENGE PROGRESS REPORT APRIL 2018
METHODOLOGY
Participants have pledged to reduce the emissions intensity of their buildings, measured as carbon dioxide equivalent per square foot, by 30 percent or more from a set base year. The participants track energy use by fuel type, associated GHG emissions, emissions intensity per square foot, and energy use intensity per square foot. Metrics include:
Energy Use: The total amount of energy used in a participant’s buildings and facilities. Energy use is measured as million British thermal units (MMBtu), which is a standardized measure of total energy use to compare across different energy sources. The Challenge measures energy use in terms of “source energy,” or energy use that takes into account production, transmission, and delivery losses of an upstream energy source. “Source energy” is not weather-normalized for purposes of the Challenge.
GHG Emissions: The total level of emissions that result from a participant’s energy use. GHG emissions are measured as metric tons of carbon dioxide equivalent (tCO2e), which is a level of carbon dioxide (CO2) that would have the same climate impact as a given concentration and type of GHG gas. Under the Challenge methodology, emissions are calculated by applying a “carbon coefficient” to each participant’s annual energy consumption by fuel type. The Challenge uses New York City-specific coefficients for electricity and steam, which are calculated by the New York City Mayor’s Office of Sustainability (Mayor’s Office). These coefficients are based on aggregate power plant data and are in compliance with the 2012 United States Community
Protocol for Accounting and Reporting Greenhouse Gas Emissions (USCP). All emissions coefficients for natural gas, propane, and No. 2, 4, and 6 fuel oils were developed by the U.S. Environmental Protection Agency (EPA).
For the purposes of the Challenge, the coefficients used to determine the carbon emissions associated with electricity and steam are fixed at 2005 levels, as these coefficients can change dramatically over time. For example, since 2005, the retirement of coal-fired power plants, increased use of natural gas, and construction of more energy efficient combined cycle power units have decreased the carbon intensity of New York City’s electricity supply by more than 30 percent. Annually changing the electricity coefficient to reflect this reduction would provide an advantage to Challenge participants that depend primarily on electricity. Fixing the electricity and steam carbon coefficients at 2005 levels therefore measures only the direct efforts of the participants, and not exogenous changes to the energy supply. Additionally, fixing coefficients at 2005 levels for all Carbon Challenge sectors allows for aggregate measurement of and comparison between energy reductions achieved by different Challenge sectors.
GHG Emissions Intensity. The participants base their Challenge reduction goal on emissions¬sions intensity because this standardizes emissions levels for facilities of different sizes and accounts for expected future growth of the facility. Setting a goal to reduce absolute emissions is not feasible
End Notes

48 | NYC CARBON CHALLENGE PROGRESS REPORT APRIL 2018
because participants hope and expect to expand in the future, whether by adding more students, patients, staff, research capacity, or employees. Growth and development is both central to these institutions’ missions and vital to New York City’s broader economy. Measuring emissions intensity will still translate to real emissions reductions even as the universities and hospitals continue to grow, particularly as they renovate older buildings and facilities to make them more energy efficient.
Normalization Factor. Participants choose a normalization factor by which to normalize their GHG emissions reductions. Universities, hospitals, and hotels normalize by square feet, while commercial offices have the option to normalize by square feet or full time equivalent employees, and commercial owners normalized per occupied square foot.
Total Floor Area. The total square footage of a participant’s owned and leased space. Total floor area is measured in terms of gross square feet (sq ft), which includes the total number of square feet measured between the exterior surfaces of the enclosing fixed walls, including spaces such as vent shafts, stairs, basements, etc.
Full Time Equivalent (FTE) Employees. The average number of employees employed by the Challenge participant located within office space covered by the NYC Carbon Challenge. The annual FTE includes the average total number of employees, including consultants and contractors, who work within the covered office space on a given day of each month over the twelve months of a year. A full-time employee works at least 80 percent of a “full-time” work week (35 hours) on-site. A half-time employee works less than 80 percent of a “full-time” work week on-site.
Occupied Square Foot. Measured as gross square feet minus vacant space for the whole building. Vacant square feet is defined as non-leased usable square footage available for lease or sublease. This ensures that new or vacating tenants do not contribute to material fluctuations in GHG emissions intensity.
Energy Use Intensity (EUI). The level of a participant’s source energy use, measured in MMBtu, divided by their normalization factor (square footage or FTE). “Source energy” takes into account all production, transmission, and delivery losses of the energy source. For purposes of the Challenge, EUI is not weather-normalized.
Start Year. The year that a participant began the Challenge.
Base Year. The year from which Challenge participants’ GHG emissions reductions are measured. Challenge participants are encouraged to select a base year that aligns with their Start Year. However, in the event of missing energy/utility data, participants are permitted to use the earliest base year for which they have complete utility information.
End Year. The last year of the Challenge and the year by which the emissions reduction goal must be achieved. This is ten years from a Challenge participant’s start date.
Emissions Scopes. The Challenge participants are asked to report emissions from the energy used in their buildings, but it is important to understand that this does not cover the full profile of their emissions. The World Resources Institute’s Greenhouse Gas Protocol dictates that the full profile of an institution’s emissions include three main categories: “Scope 1” emissions, which are direct emissions physically produced on the institution’s property (for example, by fossil fuels used in boilers); “Scope 2” emissions, which are indirect emissions that result from off-site energy generation in a location separate from the institution’s property (for example, district steam or electricity); and “Scope 3” emissions, which are indirect emissions that are not produced on-site or from off-site energy generation but are nonetheless attributable to the institution’s activities (for example, emissions from air travel or solid waste disposal). The Challenge does not include Scope 3 emissions, both because they are not always located within the city and because there is a lack

49 | NYC CARBON CHALLENGE PROGRESS REPORT APRIL 2018
of agreement on proper accounting methodologies for calculating these emissions. However, GHG accounting protocols are evolving to include methodologies for calculat¬ing and reporting Scope 3 emissions. As these protocols become more established, future inventories may include emissions from Scope 3 sources.
Reporting GHG from Waste. The minimum reporting requirement for waste is the total annual tonnage of municipal solid waste (mixed/unsorted MSW), based on carter bills or an annual waste report. Completing a physical waste audit is optional, but will provide waste characterization percentages that will make the emissions calculations more accurate and most likely more favorable. The minimum waste characterization of the mixed/unsorted MSW include Mixed Recyclables (waste that could be recycled), Mixed Organics (waste that could be composted), and Sorted MSW (all remaining waste). Hiring waste audit professionals to complete a physical audit is recommended, but not required. Due to a lack of current available research, at this time the Mayor’s Office is not including regulated medical waste (red bag waste, sharps, trace chemical waste), hazardous waste (RCRA pharmaceutical waste, chemical waste, universal waste), bulk waste, e-waste/technoscrap, or waste from construction and demolition.
Reporting GHG from Fleets. The minimum reporting requirement for fleets are the total annual gallons of fuel consumed, aggregated by fuel type (gasoline, diesel, biodiesel). The electricity used to fuel hybrid, plug-ins, and electric vehicles are assumed be reported in an institution’s electricity bill, which would be reported in the ‘Energy’ section of the GHG inventory. Fleets are vehicles owned and operated by the institution which includes maintenance vehicles, intercampus bus/shuttles, and security vehicles.
Climate Action Plan. Each Challenge participant is required to develop an emissions reduction strategy in the form of a Climate Action Plan (CAP) and update it every other year. The Mayor’s Office provides Challenge participants with a template to
complete the CAP. All CAPs are received and kept confidentially by the Mayor’s Office. Participants are free to publicly disclose the CAP. The NYC Mayor’s Office provides a CAP Template that includes the minimum information that a participant must submit for the CAP. Multifamily buildings, commercial owners, and hotels will all develop Climate Action Plans for the first time in 2018. The Climate Action Plan includes:
• Background information about the Challenge participant’s owned buildings and facilities, rental properties, and tenant spaces.
• Decision making processes for drafting and updating the Climate Action Plan.
• An overview of results from the Challenge participant’s most recent Carbon Emissions Inventory and outcomes of Local Law 87 Energy Efficiency Reports.
• A description of the strategy and projects completed to date.
• Operations and Maintenance procedures aimed at improving energy efficiency.
• A description of the proposed strategy to achieve the remaining reductions needed to meet the Challenge goal.
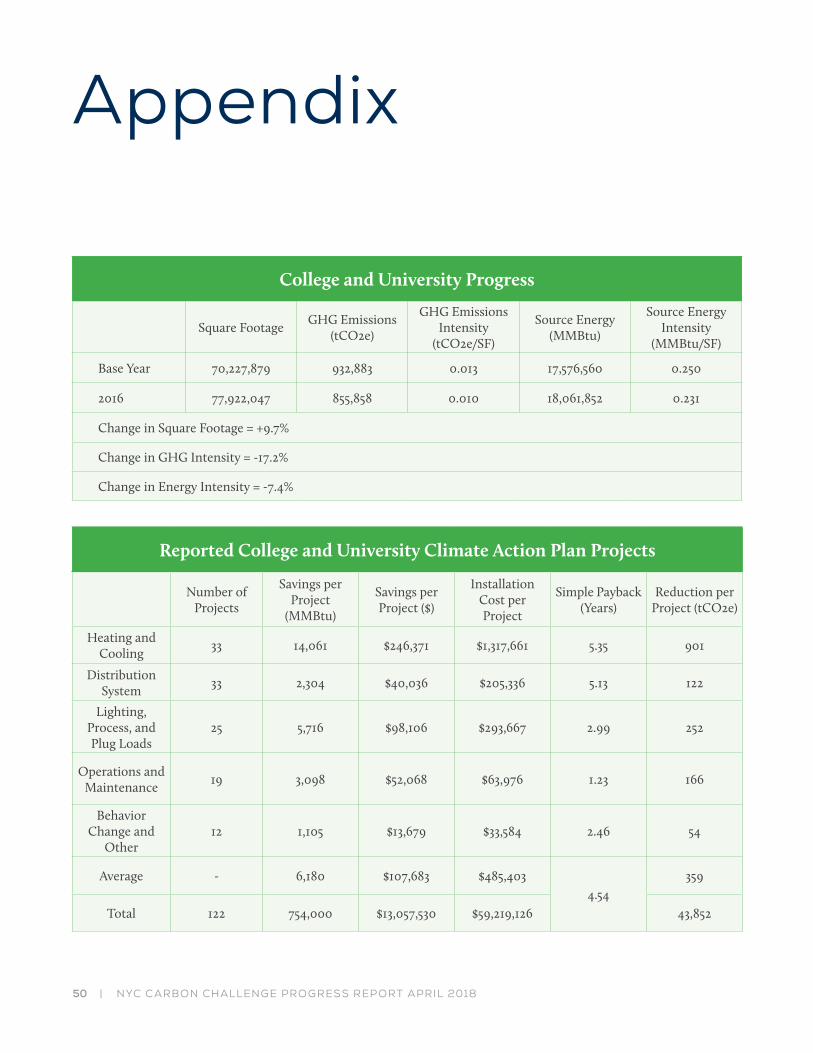
50 | NYC CARBON CHALLENGE PROGRESS REPORT APRIL 2018
Appendix
Reported College and University Climate Action Plan Projects
Number of Projects
Savings per Project
(MMBtu)
Savings per Project ($)
Installation Cost per Project
Simple Payback (Years)
Reduction per Project (tCO2e)
Heating and Cooling
33 14,061 $246,371 $1,317,661 5.35 901
Distribution System
33 2,304 $40,036 $205,336 5.13 122
Lighting, Process, and Plug Loads
25 5,716 $98,106 $293,667 2.99 252
Operations and Maintenance
19 3,098 $52,068 $63,976 1.23 166
Behavior Change and
Other12 1,105 $13,679 $33,584 2.46 54
Average - 6,180 $107,683 $485,4034.54
359
Total 122 754,000 $13,057,530 $59,219,126 43,852
College and University Progress
Square FootageGHG Emissions
(tCO2e)
GHG Emissions Intensity
(tCO2e/SF)
Source Energy (MMBtu)
Source Energy Intensity
(MMBtu/SF)
Base Year 70,227,879 932,883 0.013 17,576,560 0.250
2016 77,922,047 855,858 0.010 18,061,852 0.231
Change in Square Footage = +9.7%
Change in GHG Intensity = -17.2%
Change in Energy Intensity = -7.4%
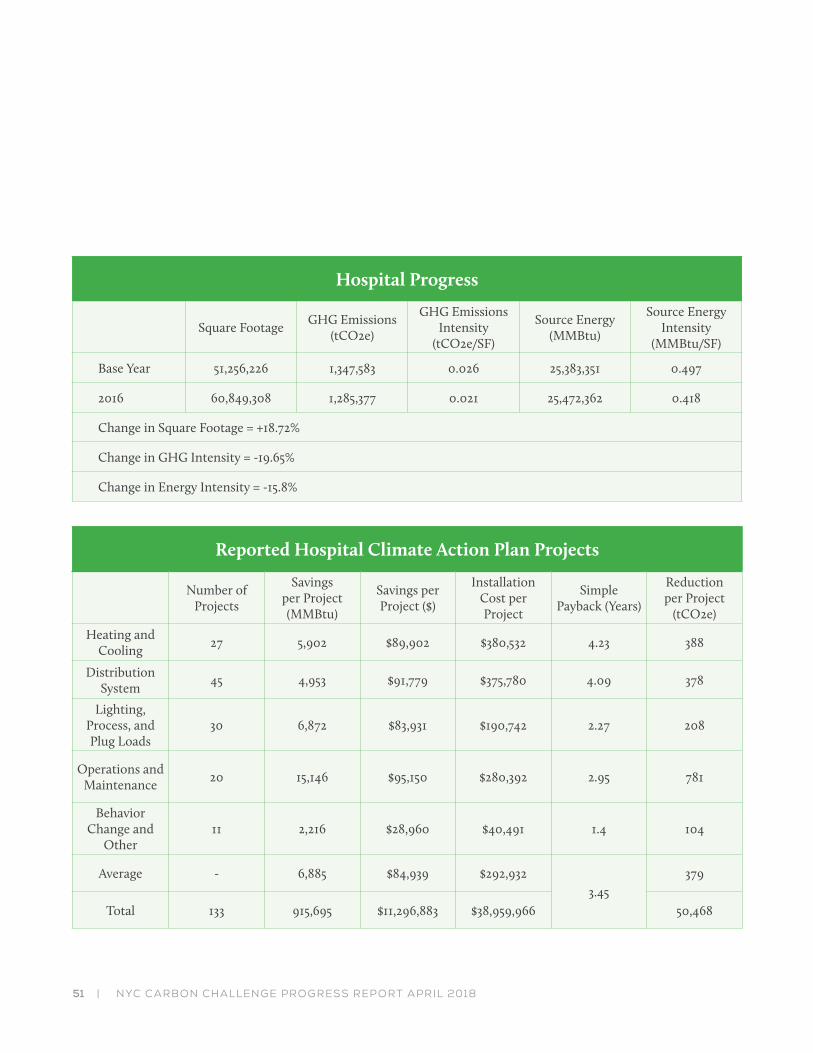
51 | NYC CARBON CHALLENGE PROGRESS REPORT APRIL 2018
Reported Hospital Climate Action Plan Projects
Number of Projects
Savings per Project (MMBtu)
Savings per Project ($)
Installation Cost per Project
Simple Payback (Years)
Reduction per Project
(tCO2e)
Heating and Cooling
27 5,902 $89,902 $380,532 4.23 388
Distribution System
45 4,953 $91,779 $375,780 4.09 378
Lighting, Process, and Plug Loads
30 6,872 $83,931 $190,742 2.27 208
Operations and Maintenance
20 15,146 $95,150 $280,392 2.95 781
Behavior Change and
Other11 2,216 $28,960 $40,491 1.4 104
Average - 6,885 $84,939 $292,9323.45
379
Total 133 915,695 $11,296,883 $38,959,966 50,468
Hospital Progress
Square FootageGHG Emissions
(tCO2e)
GHG Emissions Intensity
(tCO2e/SF)
Source Energy (MMBtu)
Source Energy Intensity
(MMBtu/SF)
Base Year 51,256,226 1,347,583 0.026 25,383,351 0.497
2016 60,849,308 1,285,377 0.021 25,472,362 0.418
Change in Square Footage = +18.72%
Change in GHG Intensity = -19.65%
Change in Energy Intensity = -15.8%

52 | NYC CARBON CHALLENGE PROGRESS REPORT APRIL 2018
Commercial Tenant Progress (SF)
Square FootageGHG Emissions
(tCO2e)
GHG Emissions Intensity
(tCO2e/SF)
Source Energy (MMBtu)
Source Energy Intensity
(MMBtu/SF)
Base Year 16,020,672 258,193 0.016 5,627,449 0.351
2016 18,437,324 199,082 0.011 4,310,464 0.234
Change in Square Footage = +15.08%
Change in GHG Intensity = -33.00%
Change in Energy Intensity = -33.44%
Commercial Tenant Progress (FTE)
Square FootageGHG Emissions
(tCO2e)
GHG Emissions Intensity
(tCO2e/SF)
Source Energy (MMBtu)
Source Energy Intensity
(MMBtu/SF)
Base Year 31,717 163,536 5.16 3,671,595 115.7
2016 40,897 135,924 3.32 3,101,105 75.8
Change in Square Footage = +28.94%
Change in GHG Intensity = -35.54%
Change in Energy Intensity = -34.50%

53 | NYC CARBON CHALLENGE PROGRESS REPORT APRIL 2018
Commercial Owner Progress (SF)
Square FootageGHG Emissions
(tCO2e)
GHG Emissions Intensity
(tCO2e/SF)
Source Energy (MMBtu)
Source Energy Intensity
(MMBtu/SF)
Base Year 48,048,038 481,179 0.010 10,097,128 0.210
2016 48,366,281 499,770 0.008 8,400,116 0.174
Change in Square Footage = 0.66%
Change in GHG Intensity = -17.47%
Change in Energy Intensity = -17.35%
Reported Commercial Tenant Climate Action Plan Projects
Number of Projects
Savings per Project (MMBtu)
Savings per Project ($)
Installation Cost per Project
Simple Payback (Years)
Reduction per Project
(tCO2e)
Heating and Cooling
15 4,685 $212,769 $793,107 3.73 495
Distribution System
9 5,012 $134,872 $734,423 5.45 273
Lighting, Process, and Plug Loads
49 1,752 $59,261 $247,481 4.18 86
Operations and Maintenance
10 9,658 $161,376 $1,617 0.01 436
Behavior Change and
Other2 955 100,000 $500,000 5 42
Average - 3,526 $107,329 $372,3433.47
218
Total 85 299,733 $9,122,936 $31,649,157 18,527

54 | NYC CARBON CHALLENGE PROGRESS REPORT APRIL 2018
Commercial Owner Progress (FTE)
FTEGHG Emissions
(tCO2e)
GHG Emissions Intensity
(tCO2e/FTE)
Source Energy (MMBtu)
Source Energy Intensity
(MMBtu/FTE)
Base Year 26,649 95,729 3.59 2,020,028 75.80
2016 29,795 84,532 2.83 1,778,289 59.68
Change in FTE = +11.81%
Change in GHG Intensity = -21.19%
Change in Energy Intensity = -21.27%
Multifamily Progress
Square FootageGHG Emissions
(tCO2e)
GHG Emissions Intensity
(tCO2e/SF)
Source Energy (MMBtu)
Source Energy Intensity
(MMBtu/SF)
Base Year 292,971,313 2,110,123 0.007 40,774,329 0.139
2016 292,872,908 1,871,292 0.006 37,204,976 0.127
Change in Square Footage = +0.03%
Change in GHG Intensity = -11.3%
Change in Energy Intensity = -8.4%
Hotel Progress
Square FootageGHG Emissions
(tCO2e)
GHG Emissions Intensity
(tCO2e/SF)
Source Energy (MMBtu)
Source Energy Intensity
(MMBtu/SF)
Base Year 10,070,813 94,915 0.0094 2,638,565 0.262
2016 10,070,813 81,741 0.0081 2,319,187 0.230
Change in Square Footage = 0%
Change in GHG Intensity = -13.88%
Change in Energy Intensity = -12.10%

55 | NYC CARBON CHALLENGE PROGRESS REPORT APRIL 2018
Acronyms
BMS – Building Management System
CHP – Combined heat and power
EUI – Energy use intensity
FTE – Full-time equivalent
GHG – Greenhouse gas
HVAC – Heating, ventilation, and air conditioning
KW – Kilowatt
kWh – kilowatt-hour
LED – Light emitting diode
MW – Megawatt
PM2.5 – Particulate matter with diameter less than 2.5 microns
PV – Photovoltaic
RNM – Remote Net Metering
tCO2e – metric ton of carbon dioxide equivalent
VFD – Variable frequency drive

56 | NYC CARBON CHALLENGE PROGRESS REPORT APRIL 2018
Image Credits
Cover“One World Observatory” by © NYC & Company/Tagger Yancey IV as noted by NYC & Company. For web site use, http://www.nycgo.com.
Page 11“Brooklyn Bridge Park” by © NYC & Company/Julienne Schaer as noted by NYC & Company. For web site use, http://www.nycgo.com.
Pages 14 & 15Courtesy of Weill Cornell Medicine
Page 16Courtesy of The New School and St. John’s University
Page 17“Washington Square Park” © NYC & Company/Christopher Postlewaite as noted by NYC & Company. For web site use, http://www.nycgo.com.
Pages 20 & 21Courtesy of Memorial Sloan Kettering Cancer Center
Page 22Courtesy of NYC Health + Hospitals and Montefiore Medical Center
Page 23Courtesy of John Hans Lee
Page 24Courtesy of the NYC Mayor’s Office of Sustainability
Page 28 & 29Courtesy of Credit Suisse
Page 30“731 Lexington” by Daniel Acker, Bloomberg News and courtesy of PVH Corp.
Pages 32 & 33Courtesy of SL Green
Page 34Courtesy of Deutsche Bank and Industry City
Page 35Courtesy of Samuel Man
Page 37Courtesy of FirstService Residential and the NYC Samuel Man
Pages 38 & 39Courtesy of StuyTown Property Services
Page 41Courtesy of Lotte New York Palace and Lowes Regency
Pages 42 & 43Courtesy of Wyndham Midtown 45
Page 45“Central Park View” by © NYC & Company/Jen Davis as noted by NYC & Company. For web site use, http://www.nycgo.com.

57 | NYC CARBON CHALLENGE PROGRESS REPORT APRIL 2018
MAYOR’S OFFICE OF SUSTAINABILITYCITY HALLNEW YORK, NY 10007WWW.NYC.GOV/ONENYC