nyag report on mutual fund fees and active share 24, 2018 · mutual funds, as fees can...
TRANSCRIPT

Mutual Fund Fees and Active Share April 2018
Investor Protection Bureau State of New York Office of the Attorney General 120 Broadway New York, New York 10271

1
1. Executive Summary
Investigation Overview American families who want to invest their savings deserve to have the information they need to make informed investment decisions. Today, nearly half of American households invest in mutual funds – either directly through individual brokerage accounts (e.g., retirement accounts) or indirectly through other investment vehicles. The mutual fund market, long a popular option for those seeking to diversify their savings, presents a dizzying number of options for investors — growth funds, sector funds, index funds, and many more. Fees to invest in mutual funds vary widely, and any fee an investor has to pay to invest in a mutual fund affects the investor’s return on investment. When deciding how to invest their savings, investors should have all of the information they need to be able to make fully-informed choices. In this time of increasing complexity in the mutual fund market, investors saving for retirement also face challenges because of ongoing uncertainty about the standard of care investment professionals owe to investors when helping them make decisions about their retirement savings. The Trump administration and Congress have taken steps to roll back federal investor protections that heighten the duty of care owed to investors and address conflicts of interest; federal courts have recently reached inconsistent decisions about the validity of those federal protections; and, although the U.S. Securities and Exchange Commission (“SEC”) has said that it will propose a rule to address these issues, it has not yet done so. In light of this uncertainty, it is particularly important for Americans saving for retirement to have all of the information they need to be able to make decisions about their investments and to evaluate investment advice they receive. The Investor Protection Bureau of the Office of the New York Attorney General (“NYOAG”) recently concluded an investigation into mutual fund fees and disclosures. This report summarizes the findings and outcomes of that investigation. One key decision mutual fund investors face is whether to invest in actively managed or passively managed (index) funds – or how best to allocate their savings in an array of mutual fund investments. Unlike a passively managed mutual fund, which tracks a market index like the S&P 500, an actively managed mutual fund relies on the skills and expertise of a portfolio manager to make fund asset allocation decisions. An actively managed mutual fund offers an investor an opportunity for increased return on investment because the fund’s portfolio manager picks stocks and utilizes strategies that he or she expects will outperform the fund’s benchmark. Investors who choose to invest in one or more actively managed mutual funds are typically looking for an opportunity to outperform the funds’ benchmarks. Thus, NYOAG focused its investigation on actively managed equity mutual funds (“actively managed equity funds”) because they are a popular category of mutual funds for retail

2
investors and because they typically charge significantly higher fees than passively managed, or index funds. Because investors choosing an actively managed equity fund are, presumably, interested in their ability to outperform the fund’s benchmark index, NYOAG wanted to understand if a fund’s fees reflect a fund’s opportunity to outperform the benchmark, as measured by the degree of overlap between the holdings in the fund and the holdings in the fund’s benchmark index.1 NYOAG analyzed mutual fund fees and disclosures, and surveyed 14 major mutual fund firms in New York and elsewhere for information about their practices. Key Findings
• Actively managed funds are typically much more expensive investment options than index funds. On average, fees on an investment in an actively managed fund cost an investor almost 4.5x more per year than fees on an investment in a passive fund.
• When investors choose to invest in actively managed funds, they incur additional expenses associated with those investments; however, there is no standard fee associated with active investing. Actively managed equity funds charge a wide range of fees, and NYOAG found that investors cannot necessarily assume that a high fee means that a fund will have a higher level of active management, as measured by the degree of overlap between the holdings in the fund and the holdings in the fund’s benchmark index.
• A metric referred to as “Active Share” measures the degree of overlap between the holdings in a fund and the holdings in the fund’s benchmark index, and NYOAG’s review shows that Active Share varies widely for actively managed equity funds with a high fee, or expense ratio.
• Retail investors often do not have access to Active Share information. Mutual fund firms use Active Share in a variety of ways in managing their investment portfolios, but NYOAG found unequal access to this important information in the market: all of the firms NYOAG surveyed provide Active Share information to institutional investors, but many of the firms surveyed do not regularly disclose Active Share to retail investors (i.e., individuals who purchase securities for their personal accounts). In other words, individual investors do not have access to certain information that would allow them to assess whether the fees they are paying are acceptable in light of a particular fund’s overlap with its benchmark.
1 Overlap to an index is only one measure of active management. It does not account for other factors relating to a fund’s management, such as the stock research and selection process or the amount of trading in any given fund.

3
Outcomes of NYOAG’s Investigation Following NYOAG’s investigation, 13 of the 14 mutual fund firms surveyed agreed to publish the Active Share metric for their actively managed equity funds available to U.S. investors. The 14th firm surveyed by NYOAG – Fidelity Management & Research Company – was already publishing Active Share for its relevant funds. As a result of these actions by some of the largest mutual fund firms in the United States, all investors will now have access to additional important information about more than 400 actively managed funds.2 The firms that have agreed to post Active Share information for their relevant funds on their websites on a quarterly basis are: AllianceBernstein LP; BlackRock, Inc.; The Dreyfus Corporation (a subsidiary of The Bank of New York Mellon); The Capital Group Companies, Inc. (American Funds); Columbia Management Investment Advisors, LLC; Eaton Vance Management; Goldman Sachs Asset Management, L.P.; JP Morgan Chase & Co.3; OppenheimerFunds, Inc.; Nuveen, LLC (a subsidiary of TIAA); T. Rowe Price Associates, Inc.; USAA Asset Management Company; and The Vanguard Group, Inc. NYOAG commends these firms for taking the lead in making Active Share information more readily available to the public, and urges all mutual fund firms to follow suit for their similarly-situated mutual funds. NYOAG believes that the equitable publication of Active Share information will benefit retail investors who should have access to pertinent information about their investments.
2. Mutual Fund Fees
Mutual Funds are a Popular Option for Retail Investors Mutual funds in the United States have experienced substantial growth in the total amount of assets under management over the last decade. In 2006, mutual funds managed over $10 trillion in net assets.4 By 2016, the total net assets managed by mutual funds had increased by more than 57% to over $16 trillion,5 and nearly half of all U.S. households owned mutual
2 The mutual fund firms NYOAG surveyed identified their relevant funds for purposes of publishing Active Share. 3 Although JP Morgan Chase & Co. was already publishing Active Share for most of its relevant funds, it has now agreed to publish Active Share for all of its relevant funds. 4 Statista, Total Net Assets of Mutual Funds in the U.S. from 1998 to 2016, available at https://www.statista.com/statistics/255518/mutual-fund-assets-held-by-investment-companies-in-the-united-states (last visited March 28, 2018). 5 Statista, Number of Mutual Funds in the U.S. from 1997-2016, available at https://www.statista.com/statistics/255590/number-of-mutual-fund-companies-in-the-united-states/ (last visited March 23, 2018); Statista, Total Net Assets of Mutual Funds in the U.S. from 1998 to 2016, available at https://www.statista.com/statistics/255518/mutual-fund-assets-held-by-investment-companies-in-the-united-states/ (last visited March 24, 2018).

4
funds.6 Retail investors invest in mutual funds directly or indirectly, including through employer sponsored retirement plans like 401(k)s. In 2016, U.S. mutual funds managed 55% of the assets of defined contribution plans7 and 47% of the assets of IRAs.8 U.S. equity funds, which are the most popular category of mutual funds, and exchange-traded funds (ETFs) held 42% of the total assets held in mutual funds and ETFs in 2016.9 Active versus Passive Fund Management Although many investors today choose to invest in cheaper, passively managed funds,10 actively managed funds are still a popular investment option for many retail investors. Index funds, which use a passive investment strategy designed to track the securities and/or asset holdings of a particular benchmark or market index, typically provide investors broad market exposure and lower costs.11 An investor who instead chooses to invest in an actively managed equity fund is typically seeking an opportunity to outperform that fund’s benchmark. Actively managed equity funds, “sell the potential to beat the market index” by picking stocks and utilizing strategies that the portfolio managers expect to outperform benchmarks.12 Importantly, this divergence from an index also means there may be more risk of underperforming compared to the benchmark. Fees Matter: Lower Fees Positively Impact Performance
The fees investors are charged to invest in mutual funds vary across funds, and the amount an investor pays in mutual fund fees directly impacts the investor’s return on investment.13
6 Statista, Shares of Households Owning Mutual Funds in the U.S. from 1980 to 2016, available at https://www.statista.com/statistics/246224/mutual-funds-owned-by-american-households/ (last visited March 24, 2018). 7 Defined contribution plans (e.g., 401(k)) are retirement savings plans that allow an employer, employee, or both to contribute a set percentage of salary or a set amount annually for the benefit of each employee. 8 Statista, Share of Retirement Account Assets Managed by Mutual Funds in the U.S. From 1995-2016, available at https://www.statista.com/statistics/255533/mutual-fund-percentage-of-household-retirement-assets-by-type-of-retirement-vehicle/ (last visited March 24, 2018). 9 Statista, Distribution of Investment Fund Assets in the United States in 2016, By Type, available at https://www.statista.com/statistics/255606/asset-allocation-mutual-funds-usa/ (last visited March 28, 2018). 10 Morningstar, Global Investors Shun Equity, Return to Fixed Income in 2016: 2016 Global Asset Flows Report (Mar. 6, 2017) at 11-13, available at https://www.vfb.be/vfb/Media/Default/news/Morningstar.pdf (last visited April 2, 2018). 11 See also SEC Investor Publication, Mutual Funds and Exchange-Traded Funds (ETFs) – A Guide for Investors, available at https://www.sec.gov/reportspubs/investor-publications/investorpubsinwsmfhtm.html#MF3 (last visited March 23, 2018 (hereinafter “SEC Mutual Fund and ETF Investor Guide”). 12 K.J. Martijn Cremers & Quinn Curtis, Do Mutual Fund Investors Get What They Pay For? The Legal Consequences of Closet Index Funds (November 24, 2015) at 1, available at http://ssrn.com/abstract=2695133 (“Cremers & Curtis (November 2015)”) (last visited March 28, 2018). 13 U.S. Fund Fee Study, Average Fund Fees Paid by Investors Continued to Decline in 2016, Morningstar Manager Research (May 23, 2017) (hereinafter “Morningstar U.S. Fund Fee Study”), available at https://corporate1.morningstar.com/ResearchLibrary/article/810041/us-fund-fee-study--average-fund-fees-paid-by-investors-continued-to-decline-in-2016/ (last visited March 26, 2018); SEC Investor Bulletin: How Fees and Expenses

5
According to Morningstar, “mutual fund costs are a reliable predictor of future fund returns, in that low-cost mutual funds generally outperform their more-expensive peers.”14 For example, compare the hypothetical growth of a $10,000 investment over a 20-year period in two funds:
• Fund A is an actively managed growth fund charging a higher 2.1% fee. • Fund B is a passively managed growth index fund charging a much lower 0.14%
fee.
Fund A Fund B Initial Amount Invested $10,000.00 $10,000.00 Holding Period 20 years 20 years Annual Rate of Return 5.00% 5.00% Annual Expense Ratio15 2.1% 0.14% Fund Value After 20 Year(s) $17,364.09 $25,800.41 Profit/Return After Fees $7,364.09 $15,800.41 Total Fees16 $5,658.49 $466.78
Above analysis adapted from the FINRA Fund Analyzer.
This example illustrates the compounding effect that higher fees may have over time. The cost of fees compounds because every dollar paid in fees is a dollar that cannot be re-invested and therefore does not benefit from the fund’s 5% rate of return in the years that follow. Here, a $10,000 investment in Fund B, the fund with lower fees, results in projected gains of $15,800 (more than double the projected gains of the more expensive fund). Investors who purchase shares of mutual funds that charge higher fees may see diminished returns on their investment even if the mutual fund performs well over time. Actively Managed Funds Are More Expensive
Generally, actively managed funds charge higher fees than passively managed funds.17 According to a recent study, “the asset-weighted average expense ratio of passive funds was 0.17% in 2016 compared with 0.75% for active funds.”18 In other words, an investment in
Affect Your Investment Portfolio, available at https://www.sec.gov/investor/alerts/ib_fees_expenses.pdf (last visited March 26, 2018). 14 Morningstar U.S. Fund Fee Study at 4. 15 A fund’s expense ratio is its total expenses expressed as a percentage of its average net assets. 16 Sum of annual expense ratio charges over 20-year period. 17 Morningstar U.S. Fund Fee Study at 1, available at https://corporate1.morningstar.com/ResearchLibrary/article/810041/us-fund-fee-study--average-fund-fees-paid-by-investors-continued-to-decline-in-2016/ (last visited March 28, 2018); FINRA Staff, What You Need to Know About the Passive vs. Active Management debate (Aug. 15, 2016), available at http://www.finra.org/investors/what-you-need-know-about-passive-vs-active-management-debate (last visited March 28, 2018). 18 Morningstar U.S. Fund Fee Study at 1.
6
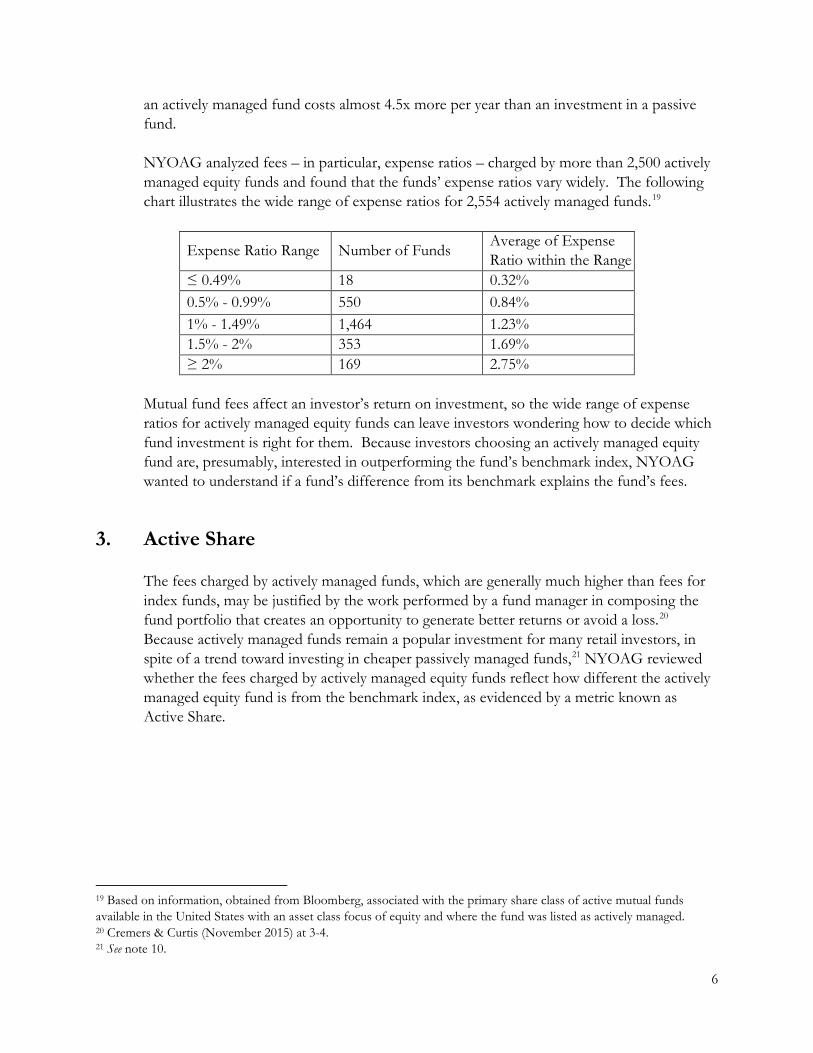
an actively managed fund costs almost 4.5x more per year than an investment in a passive fund. NYOAG analyzed fees – in particular, expense ratios – charged by more than 2,500 actively managed equity funds and found that the funds’ expense ratios vary widely. The following chart illustrates the wide range of expense ratios for 2,554 actively managed funds.19
Expense Ratio Range Number of Funds Average of Expense Ratio within the Range
≤ 0.49% 18 0.32% 0.5% - 0.99% 550 0.84% 1% - 1.49% 1,464 1.23% 1.5% - 2% 353 1.69% ≥ 2% 169 2.75%
Mutual fund fees affect an investor’s return on investment, so the wide range of expense ratios for actively managed equity funds can leave investors wondering how to decide which fund investment is right for them. Because investors choosing an actively managed equity fund are, presumably, interested in outperforming the fund’s benchmark index, NYOAG wanted to understand if a fund’s difference from its benchmark explains the fund’s fees.
3. Active Share The fees charged by actively managed funds, which are generally much higher than fees for index funds, may be justified by the work performed by a fund manager in composing the fund portfolio that creates an opportunity to generate better returns or avoid a loss.20 Because actively managed funds remain a popular investment for many retail investors, in spite of a trend toward investing in cheaper passively managed funds,21 NYOAG reviewed whether the fees charged by actively managed equity funds reflect how different the actively managed equity fund is from the benchmark index, as evidenced by a metric known as Active Share.
19 Based on information, obtained from Bloomberg, associated with the primary share class of active mutual funds available in the United States with an asset class focus of equity and where the fund was listed as actively managed. 20 Cremers & Curtis (November 2015) at 3-4. 21 See note 10.

7
What is Active Share? Active Share measures the degree of difference between a mutual fund’s holdings and the holdings of the fund’s benchmark index.22 The metric was introduced by academics Martijn Cremers and Antti Petajisto in a paper analyzing the performance of actively managed equity funds.23 Active Share is calculated by taking the sum of the absolute value of the differences of the weight of each holding in a fund’s portfolio versus the weight of each holding in a benchmark index and dividing by two.24 The higher the Active Share, the more divergent the fund’s holdings are from its benchmark. So, a mutual fund with no holdings in common with its benchmark index would have an Active Share of 100%. Conversely, a fund with holdings that exactly mirror its benchmark index would have an Active Share of 0%.
In Figure 1 below, a benchmark is represented in blue and an actively managed fund is represented in green. Fund A depicts an actively managed fund with a low Active Share. Fund B depicts an actively managed fund with a high Active Share. The dark green shaded areas indicate that portion of the fund that cannot outperform the benchmark index.
22 K.J. Martijn Cremers & Antti Petajisto, How Active Is Your Fund Manager? A New Measure That Predicts Performance (Mar. 31, 2009) at 1, available at http://depot.som.yale.edu/icf/papers/fileuploads/2370/original/06-14.pdf (“Cremers & Petajisto (March 2009)”) (last visited March 28, 2018). 23 Id. Professor Cremers maintains a website that provides, among other things, historical Active Share information for U.S. equity mutual funds. Professor Cremer’s website, which is updated annually and includes information he collected for academic purposes, can be accessed at https://activeshare.info/ (last visited March 24, 2018). 24 Cremers & Petajisto (March 2009) at 6. The Active Share calculation uses absolute value to account for instances where the fund has a larger position than the index for some securities and a smaller position than the index for others.

8
Active Share is a valuable metric that can help mutual fund investors evaluate mutual fund offerings. For equity mutual funds, Active Share’s ability to effectively describe to an investor the portion of a fund’s holdings that are the same as the holdings of the fund’s benchmark index makes it a useful tool for investors making investment decisions. Because a fund’s Active Share may change over time, investors considering a fund’s Active Share (among other information about the fund) should evaluate Active Share across multiple time periods. Importantly, Active Share does not reflect all of the information an investor may want to consider when making a mutual fund investment decision, and there is some debate about how investors can best use Active Share when making investment decisions. For instance, some have argued that Active Share is linked to a fund’s potential performance25, while others have said that Active Share does not predict returns.26 Further, Active Share does not measure all of the risks associated with investing in a particular mutual fund. In addition, Active Share may be more or less relevant depending on the type of mutual fund in question. For example, some argue that Active Share is not as meaningful a measure when an investor wants to compare funds with asset holdings of different market-cap sizes (e.g., a fund that holds all large-cap stocks versus one that holds large-cap, mid-cap, and small-cap stocks).27
High Fees Do Not Always Mean High Active Share
NYOAG reviewed data about mutual fund fees, which funds are required to disclose in their offering documents, in an effort to understand whether fees charged by actively managed equity funds correspond to the funds’ degree of active management, as reflected by their Active Share.28 NYOAG considered (1) the Active Share of 2,344 funds (expressed as an average in order to capture Active Share across multiple time periods); and (2) average expense ratios charged by those funds (to capture the fees charged across multiple time periods and across various share classes). The following illustrations summarize the results
25 Id. at 28. 26 AQR Deactivating Active Share (April 2015), available at https://www.aqr.com/~/media/files/papers/aqr-deactivating-active-share.pdf (last visited March 28, 2018). 27 Fidelity: Active Share: A Misunderstood Measure in Manager Selection (February 2014), available at https://www.fidelity.com/bin-public/060_www_fidelity_com/documents/leadership-series_active-share.pdf (last visited March 28, 2018). 28 NYOAG’s review of Active Share ranges and expense ratios is based on data Professor Martijn Cremers gathered and calculated for mutual funds and ETFs for the period January 2012 through December 2015 (the “Dataset”). Information from the Dataset was used in Cremers & Curtis (November 2015), available at http://ssrn.com/abstract=2695133 (last visited March 23, 2018). The Dataset includes funds that were liquidated during the time period, which means that Average Active Share and Average Expense Ratio will have been calculated using more data points for some funds than for others. This also means that the Dataset includes funds that are no longer available to investors. The Dataset may also include mutual funds that are only available to investors as part of a wrapped investment product – these funds may have lower expense ratios, but investors may also be required to pay other fees in order to invest in them. For funds with multiple share classes, expense ratio was calculated by computing the value-weighted average across the share classes which means that the expense ratio calculations do not reflect the actual expense ratios charged to retail investors for those funds. Additional information about the Dataset may be found at https://activeshare.nd.edu/data/ (last visited March 28, 2018).

9
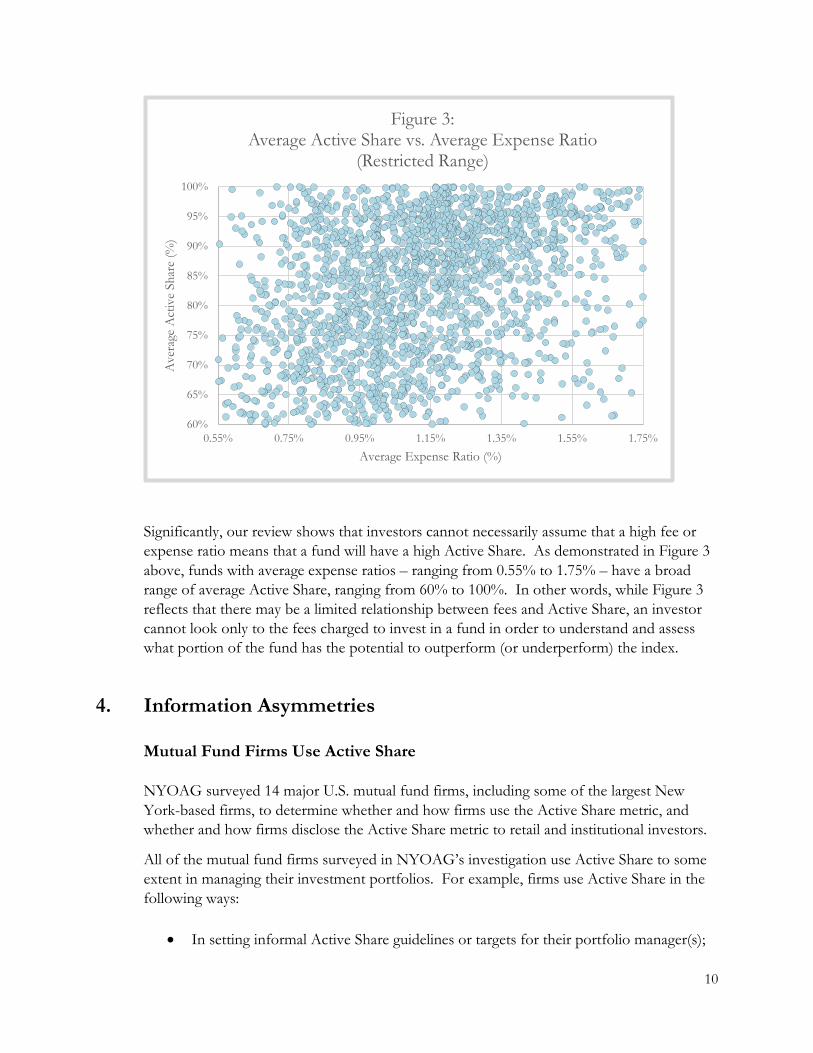
of NYOAG’s review.29 Figure 2 shows the comparison between the average Active Share of the 2,344 funds and the average expense ratios charged by those funds. Figure 3 zooms in on the average Active Share ranges and average expense ratios that are most prevalent in the dataset; 1,950 of the approximately 2,344 funds reviewed fell into this category.
29 Using the Dataset, NYOAG averaged each of the Active Share and expense ratio fund data points per fund. NYOAG’s review included funds where: (1) both expense ratio and Active Share information was provided; and (2) the majority of assets in the fund were invested in the Russell 1000 and Russell 2000 indices. NYOAG’s review endeavored to exclude passively managed mutual funds and ETFs that were included in the Dataset by identifying and removing funds with: (1) names that included the word “index” and (2) Active Share that was less than or equal to 10%.
0%
10%
20%
30%
40%
50%
60%
70%
80%
90%
100%
0.00% 0.50% 1.00% 1.50% 2.00% 2.50%
Ave
rage
Act
ive
Shar
e (%
)
Average Expense Ratio (%)
Figure 2:Average Active Share vs. Average Expense Ratio
10
Significantly, our review shows that investors cannot necessarily assume that a high fee or expense ratio means that a fund will have a high Active Share. As demonstrated in Figure 3 above, funds with average expense ratios – ranging from 0.55% to 1.75% – have a broad range of average Active Share, ranging from 60% to 100%. In other words, while Figure 3 reflects that there may be a limited relationship between fees and Active Share, an investor cannot look only to the fees charged to invest in a fund in order to understand and assess what portion of the fund has the potential to outperform (or underperform) the index.
4. Information Asymmetries
Mutual Fund Firms Use Active Share NYOAG surveyed 14 major U.S. mutual fund firms, including some of the largest New York-based firms, to determine whether and how firms use the Active Share metric, and whether and how firms disclose the Active Share metric to retail and institutional investors.
All of the mutual fund firms surveyed in NYOAG’s investigation use Active Share to some extent in managing their investment portfolios. For example, firms use Active Share in the following ways:
• In setting informal Active Share guidelines or targets for their portfolio manager(s);
60%
65%
70%
75%
80%
85%
90%
95%
100%
0.55% 0.75% 0.95% 1.15% 1.35% 1.55% 1.75%
Ave
rage
Act
ive
Shar
e (%
)
Average Expense Ratio (%)
Figure 3: Average Active Share vs. Average Expense Ratio
(Restricted Range)

11
• As one performance and attribution metric reviewed as part of reviews and oversight of funds’ investment strategies and portfolio management process;
• As one risk measure for monitoring the underlying risk/reward potential (versus the benchmark) of an individual fund;
• During the fund manager selection and ongoing evaluation process; • To describe one aspect of the costs, benefits, and risks associated with investing in a
particular fund or a portfolio of funds; and/or • When assessing the performance of a sub-advisor – that is, an advisor managing a
portion of a fund’s portfolio.
Retail Investors Often Do Not Have Access to Active Share Information
Even though mutual fund firms use Active Share in a variety of ways for their own internal purposes, investors do not all have the same access to Active Share information. NYOAG found that, of the firms surveyed, many offered professional and institutional investors access to Active Share information, but did not provide retail investors with the same access. All of the mutual funds NYOAG surveyed provide Active Share information to institutional investors (either as a matter of course, through presentations or pitch books, or upon request), but only four firms provide some readily accessible Active Share information to retail investors (e.g., via the firm’s website or in supplemental data sheets posted online). Other surveyed firms said that they provide Active Share to retail investors through brokers or other intermediaries, but only upon request. In other words, for those firms, only an investor who works with an intermediary that knows about Active Share is able to request and receive Active Share information. A handful of firms surveyed said that they do not provide Active Share information to retail investors at all.
Mutual fund firms provide investors – including retail investors – extensive information about mutual funds, including details about a fund’s objectives, a fund’s holdings at certain points in time, a fund’s past performance, and the fees a fund charges its investors. However, the lack of equal access to one valuable piece of information – Active Share – is an information gap that hinders retail investors’ ability to fully analyze the potential value proposition of an actively managed equity fund. By understanding and monitoring all available data about a fund, including a fund’s Active Share, as well as fees and other metrics,30 investors can make more informed judgments about whether particular mutual funds are right for them. For example, an investor paying a high fee for an actively managed equity fund with a low Active Share may want to examine whether the fund’s fees are acceptable given the high degree of overlap with the benchmark.
30 These metrics are already made available to retail and institutional investors alike.

12
Mutual fund firms that do not provide all investors equal access to Active Share information for their mutual funds deny certain investors an important piece of information they can use to make decisions about investing in particular funds.
5. The Shifting Federal Landscape Investors should always exercise care in their investment decisions, but recent developments in federal standards highlight the need for particular caution. Even the most informed investors may have difficulty understanding all of the data available regarding particular investment options. In making investment decisions, including when selecting mutual funds, retail investors often rely on the advice of paid brokers or financial advisors. To ensure that advisors act in investors’ best interest, and after six years of careful public deliberation by the Obama administration, the U.S. Department of Labor promulgated a Fiduciary Rule (the “Fiduciary Rule”) in April 2016. The Fiduciary Rule was designed to end the provision of conflicted advice by requiring financial advisors of retirement accounts to act in their clients’ best interests, and to ensure that conflicts of interest are disclosed to clients. These conflicts are rampant. The Regulatory Impact Assessment accompanying the Fiduciary Rule documented the pervasive conflicts of interest in the retirement advisory business and the harm that conflicts of interest cause investors, as New York Attorney General Eric T. Schneiderman noted in a letter to the Acting Secretary of Labor in April 2017, opposing any weakening of the Rule.31 Indeed, the Regulatory Impact Assessment found that conflicted advice in just the mutual fund segment alone could cost IRA investors alone between $95 billion and $189 billion over the next ten years.32 Despite the enactment of the Fiduciary Rule, there is ongoing uncertainty regarding these issues and the protections that the federal government affords retirement investors. For instance, in 2017, the Trump administration directed the Department of Labor to conduct yet another review of the Fiduciary Rule, later announced that it would not enforce the Rule, and then enacted a delay rule that puts off any enforcement of the Rule until at least July 2019. Meanwhile, Congress has taken steps to eliminate this important investor protection rule altogether. Multiple bills explicitly designed to delay, weaken, or eliminate the Fiduciary Rule have been introduced in Congress, and the House of Representatives passed one such bill in 2017. More recently, one federal appellate court found that the Fiduciary Rule was valid as applied to fixed indexed annuities, while another disagreed and invalidated the Rule in its entirety. Further, while the SEC has been considering implementing a new, uniform best interest standard since at least 2010, to date, it has not proposed such a rule.
31 April 17, 2017 Letter to Acting Secretary of Labor, available at https://ag.ny.gov/sites/default/files/2017_04_17_fiduciary_rule_comment_letter.pdf; see also April 2016 Department of Labor Regulatory Impact Analysis for Final Rule and Exemptions, available at https://www.dol.gov/sites/default/files/ebsa/laws-and-regulations/rules-and-regulations/completed-rulemaking/1210-AB32-2/conflict-of-interest-ria.pdf (last visited March 28, 2018). 32 Id.

13
This vast uncertainty surrounding what the federal government will do to define financial advisors’ obligations to retirement investors once and for all means that, for example, a financial advisor of a retirement account currently may be incentivized to recommend a higher fee mutual fund over a comparable lower fee fund. Accordingly, Americans saving for retirement must remain especially vigilant in evaluating their investment choices and the investment recommendations made by their advisors.
6. Recommendations Recommendations for Mutual Fund Firms Following NYOAG’s investigation, 13 mutual fund firms have agreed to publish Active Share information on their websites for their actively managed equity funds available to U.S. investors. As a result of the actions of these major U.S. firms, Active Share information will now be published for more than 400 actively managed funds. These 13 firms, along with the 14th firm that was already publishing Active Share, have taken the lead and are commended by NYOAG for their efforts to provide investors with valuable information they can use to make informed investment decisions. However, there is still more to do. NYOAG calls on all mutual fund firms to make Active Share information relating to their actively managed equity funds readily accessible to all investors. All investors should have equal access to Active Share information as they strive to make informed investment decisions. Recommendations for Investors As discussed, the federal rules that apply to financial professionals are in flux, including rules about whether a financial professional may lawfully recommend a particular investment that is not in the investor’s best interest. Whether investors choose to invest with a financial professional or not, they should have access to information they can use to educate themselves, compare funds, and make informed investment decisions. And while it is important to assess the totality of information available about specific investments, mutual fund investors should pay particular attention to the fees charged by mutual funds, as fees can significantly affect total returns on a mutual fund investment. Investors who choose to buy actively managed funds are choosing to pay more than they would for index funds, and therefore should seek to understand what additional value they may obtain in exchange for higher fees. Active Share helps investors discern the overlap between an actively managed fund and the fund’s corresponding benchmark index, and thus can help investors evaluate one or more actively managed fund investments. Investors can consider Active Share, along with other information, when making informed decisions about whether the fund’s portfolio selection process has created an opportunity for that mutual

14
fund to outperform its index. Similarly, Active Share may help an investor assess whether a fund’s fees are acceptable. Investors should seek to understand the Active Share metric and request Active Share information from their brokers or mutual fund providers if it is not publicly available.