nws houston, texas july 2019 - national weather service€¦ · photo taken by nws meteorologist...
TRANSCRIPT
NWS Houston, TexasSeptember 2019
Regional Climate Summary
. . . Abnormally warm temperatures continued with extreme rainfall brought on by Tropical Storm Imelda. . .
September continued the abnormally warm temperatures with twenty three daily temperaturerecords broken across the primary climate sites. Initially drought conditions expanded across theentire area for the start of the month, but then extreme rainfall from Tropical Storm Imelda helped toreverse the dry conditions across the eastern and southern portions of the region. Imelda’s extremerainfall brought flash flooding to portions of Chambers, Liberty, Montgomery, Harris, Galveston,Matagorda, and Brazoria counties. After Imelda, the abnormally dry and hot conditions continued forthe rest of the month.
1
Produced by Jimmy Fowler & Nikki Hathaway
Photo taken by NWS Meteorologist Tim Cady

Table of Contents
2
Page Number Page Title
1 Cover 2 Table of Contents3 September by the Numbers4 Precipitation5 Total Monthly Precipitation6 Total Monthly Precipitation Departure
from Normal7 Temperatures8 – 9 Monthly Temperature Charts10 Drought Conditions11 – 13 September Daily Record Reports14 October Outlook15 – 16 ENSO17 – 19 Tropical Storm Imelda Recap20 Climate Primary Site History
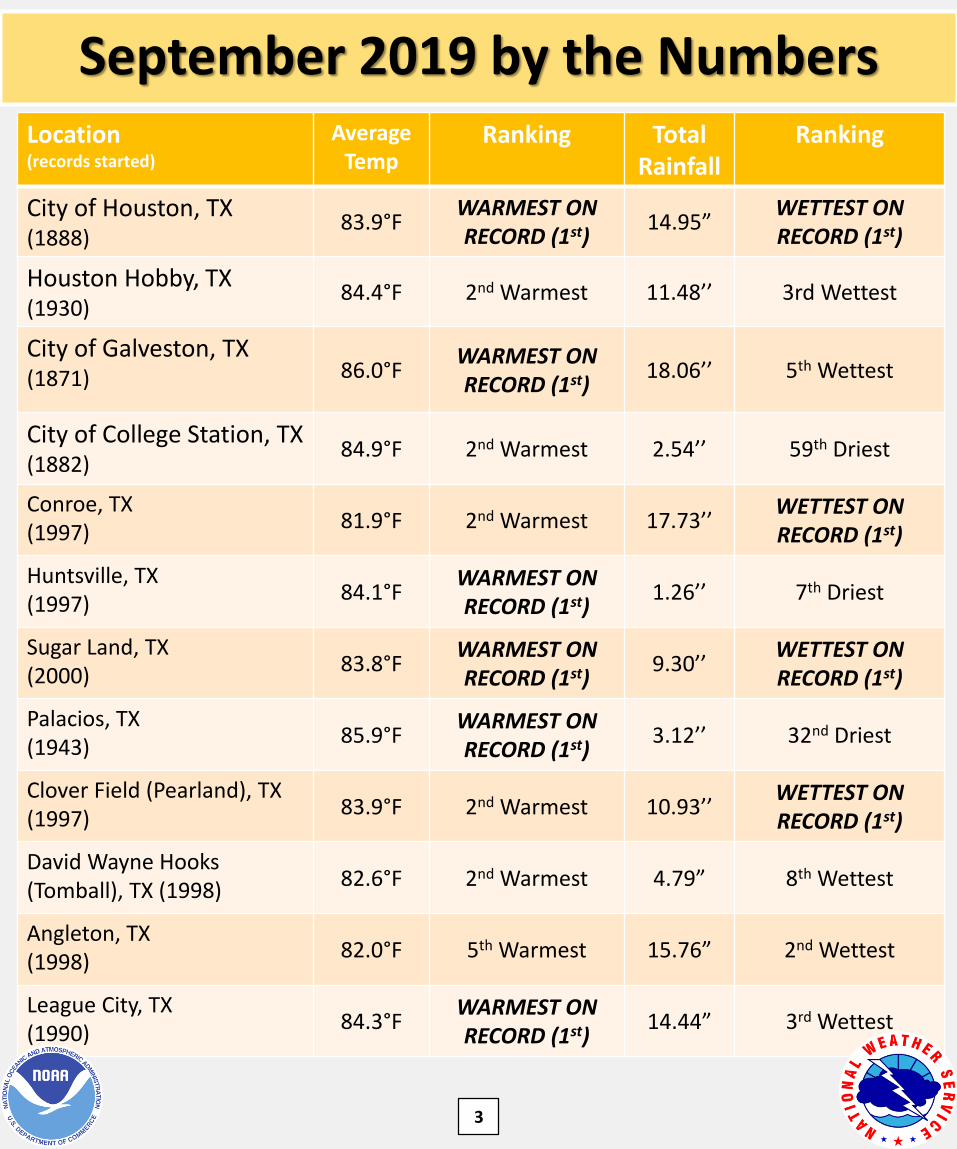
September 2019 by the Numbers
3
Location(records started)
Average Temp
Ranking Total Rainfall
Ranking
City of Houston, TX(1888)
83.9°FWARMEST ON RECORD (1st)
14.95”WETTEST ON RECORD (1st)
Houston Hobby, TX(1930)
84.4°F 2nd Warmest 11.48’’ 3rd Wettest
City of Galveston, TX(1871) 86.0°F
WARMEST ON RECORD (1st)
18.06’’ 5th Wettest
City of College Station, TX(1882)
84.9°F 2nd Warmest 2.54’’ 59th Driest
Conroe, TX(1997)
81.9°F 2nd Warmest 17.73’’WETTEST ON RECORD (1st)
Huntsville, TX(1997)
84.1°FWARMEST ON RECORD (1st)
1.26’’ 7th Driest
Sugar Land, TX(2000)
83.8°FWARMEST ON RECORD (1st)
9.30’’WETTEST ON RECORD (1st)
Palacios, TX(1943)
85.9°FWARMEST ON RECORD (1st)
3.12’’ 32nd Driest
Clover Field (Pearland), TX(1997)
83.9°F 2nd Warmest 10.93’’WETTEST ON RECORD (1st)
David Wayne Hooks (Tomball), TX (1998)
82.6°F 2nd Warmest 4.79” 8th Wettest
Angleton, TX(1998)
82.0°F 5th Warmest 15.76” 2nd Wettest
League City, TX(1990)
84.3°FWARMEST ON RECORD (1st)
14.44” 3rd Wettest

Precipitation
Overall the month of September saw above normal precipitation, but this wasmainly due to the extreme rainfall brought on by Tropical Storm Imelda. Galveston,Houston-Hobby, and the city of Houston all saw above normal precipitation totals,while College Station received slightly below normal monthly totals. This was mainlydue to Imelda impacting the coastal and eastern portions of the region and notreaching into the Brazos Valley as much. Imelda brought daily record rainfallamounts that occurred on the 17th & 18th at Houston-Hobby, on the 18th and 19th atGalveston, and on the 19th for the city of Houston.
4
SiteTotal
Precipitation (in.)Departure from
Normal (in.)Number of
Thunder DaysMaximum Daily
Precipitation (in./date)
Galveston(GLS)
18.06 +12.03 11 6.81September
19th
Houston Hobby(HOU)
11.48 +6.27 7 4.67September
17th
City of Houston
(IAH)14.95 +10.83 8 9.21
September 19th
CollegeStation(CLL)
2.54 -0.64 6 1.08September
11th

Precipitation (Continued)
5

Precipitation (Continued)
6

Temperatures
7
All of the primary climate sites experienced above normal temperatures during themonth of September. The cities of Houston and Galveston experienced their warmestSeptembers on record while College Station and Houston-Hobby ranked at numbertwo. This September in Galveston was so warm it would actually rank as the 9th
warmest August on record. The city of Houston started out the month with its last100°F on the year, while College station reached the threshold twice: Sept. 4th and6th.
SiteAverage
Temp(F)
Average High
Temp (F)
Average Low
Temp (F)
Normal AverageTemp (F)
DepartureFrom
Normal (F)
Maximum Temperature
(F)
Minimum Temperature
(F)
Galveston(GLS)
86.0 91.2 80.8 81.6 +4.496 on Sept.
14th
73 on Sept. 19th
Houston Hobby(HOU)
84.4 92.1 76.7 80.1 +4.398 on Sept.
14th
74 on Sept. 25th & 26th
City of Houston
(IAH)83.9 93.1 74.6 79.9 +4.0
100 on Sept. 1st
71 on Sept. 8th & 26th
CollegeStation(CLL)
84.9 94.9 74.8 80.0 +4.9100 on
Sept. 4th & 6th
72 on Sept. 25th

Monthly Temperature Charts
8
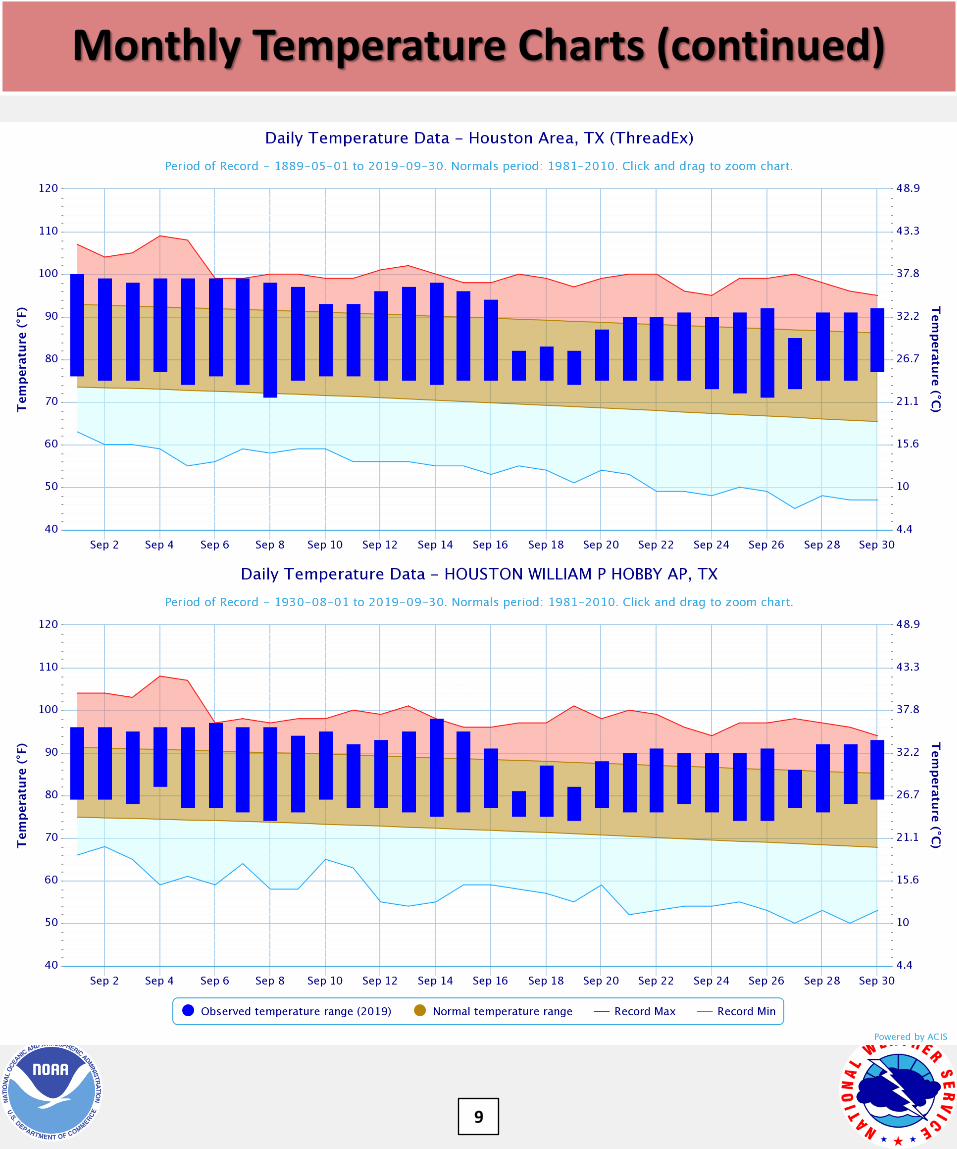
Monthly Temperature Charts (continued)
9

Drought Conditions
10
Source:http://droughtmonitor.unl.edu
Most Recent Drought Map
Posted: September 26th
Drought Conditions (Percent Area)
By the end of the month, D2 severe drought conditions expanded across portions of Madison, Brazos, Grimes, Burleson, and Washington counties. Additionally, improvements were made across the southeastern zones of the forecast area due to the heavy rainfall associated with
Tropical Storm Imelda.

September Daily Record Reports
11
A total of 28 daily records were set across the primary climate sites.
Site Date Record Type New Record Previous Record
Houston HobbySeptember
2nd
High Min Temperature
79° 79° in 2014
Houston HobbySeptember
4th
High Min Temperature
82° 80° in 1989
City of GalvestonSeptember
4th
High Min Temperature
85° 84° in 1989
City of GalvestonSeptember
6th
High Max Temperature
95° 94° in 1912
Houston HobbySeptember
6th
High Max Temperature
97° 97° in 1963
City of HoustonSeptember
6th
High Max Temperature
99° 99° in 1909
City of HoustonSeptember
7th
High Max Temperature
99° 98° in 1963
City of GalvestonSeptember
10th
High Min Temperature
83° 83° in 2014
Houston HobbySeptember
10th
High Min Temperature
79° 79° in 1961
City of GalvestonSeptember
12th
High Min Temperature
84° 83° in 1909
City of GalvestonSeptember
13th
High Max Temperature
95° 93° in 2002
City of GalvestonSeptember
14th
High Max Temperature
96° 93° in 1900

September Daily Record Reports Continued
12
Site Date Record Type New Record Previous Record
Houston HobbySeptember
14th
High Max Temperature
98° 98° in 2011
City of GalvestonSeptember
15th
High Max Temperature
94° 94° in 1900
Houston HobbySeptember
17th Max Rainfall 4.67” 2.59” in 1958
Houston HobbySeptember
18th Max Rainfall 2.68” 2.32” in 1979
City of GalvestonSeptember
18th Max Rainfall 6.20” 2.47” in 1979
City of HoustonSeptember
19th Max Rainfall 9.21” 6.92” in 1979
City of GalvestonSeptember
19th Max Rainfall 6.81” 5.11” in 1979
City of GalvestonSeptember
21st
High Min Temperature
83° 83° in 1992
City of GalvestonSeptember
23rd
High Min Temperature
82° 82° in 2000
City of College Station
September 24th
High Min Temperature
76° 76° in 1984
City of GalvestonSeptember
28th
High Min Temperature
83° 82° in 2005
City of GalvestonSeptember
29th
High Min Temperature
82° 82° in 1986
Houston HobbySeptember
29th
High Min Temperature
78° 77° in 2013

September Daily Record Reports Continued
12
Site Date Record Type New Record Previous Record
City of GalvestonSeptember
30th
High Min Temperature
83° 82° in 1986
City of College Station
September 30th
High Min Temperature
76° 75° in 1986
Houston HobbySeptember
30th
High Min Temperature
79° 77° in 1986

October Outlook
Precipitation Outlook
SiteAverage
Temp(°F)NormalHigh (°F)
Normal Low (°F)
Galveston 74.3 80.6 68.1
Houston Hobby
72.1 81.2 63.1
City of Houston
71.5 82.0 60.9
CollegeStation
70.8 81.4 60.3
SiteNormal Monthly Precipitation (in.)
Galveston (GLS) 5.52
Houston Hobby (HOU) 5.99
City of Houston (IAH) 5.70
College Station (CLL) 4.91
Temperature Outlook
September2019
September2019
For October, the latest outlook from the Climate Prediction Center (CPC) calls for a 55% chance of abovenormal temperatures, 33% near normal temperatures, and a 12% chance for below normal temperaturesacross the area. The precipitation outlook calls for equal chances for above, below, or normal precipitation,across much of Southeast Texas. Across portions of the southeast zones such as Galveston, 31% chance ofabove normal precipitation, 33% near normal precipitation, and a 36% chance for below normalprecipitation.
13

ENSO Observations
14
Sea Surface Temperature Anomalies across the Tropical Pacific Ocean during the month of September
Source: NNVL Current ENSO Phase: Neutral
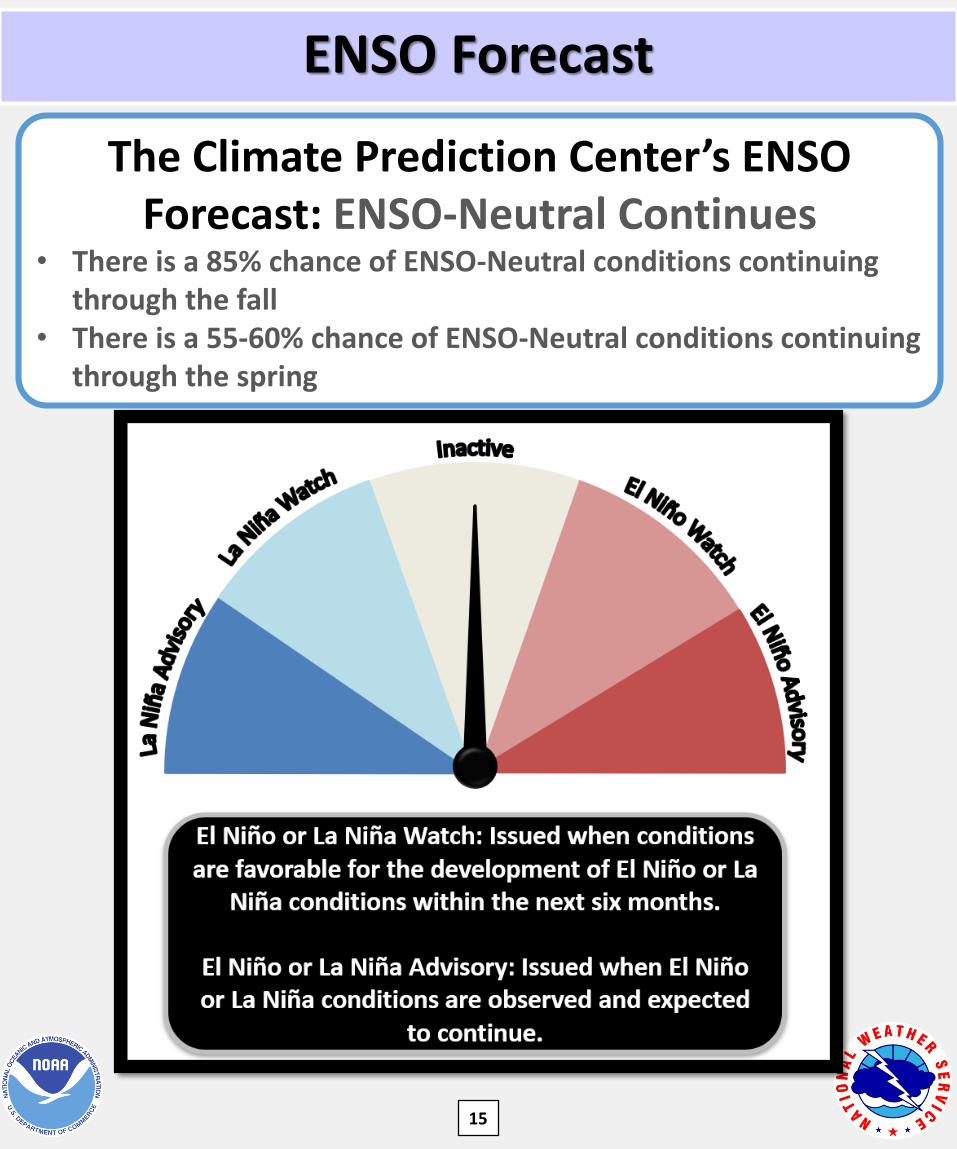
ENSO Forecast
15
The Climate Prediction Center’s ENSO Forecast: ENSO-Neutral Continues
• There is a 85% chance of ENSO-Neutral conditions continuing through the fall
• There is a 55-60% chance of ENSO-Neutral conditions continuing through the spring

On September 17th, an area of low pressure over the northwestern
Gulf of Mexico organized becoming Tropical Depression Eleven
around 12 PM CDT. By 12:45 PM CDT, the National Hurricane
Center issued an update to strengthen the system into Tropical
Storm Imelda. At approximately 1:30 PM CDT that afternoon,
Imelda made landfall near Freeport, Texas with a minimum central
pressure of 1005 millibars (29.68 inches of mercury). This system
was not long lasting and quickly weakened after landfall, becoming
a tropical depression by 7 PM that evening.
Tropical Storm Imelda
16
September 17th, 2019

Tropical Storm Imelda
16
September 17th, 2019
A tornado also occurred associated with a band of
thunderstorms within Tropical Storm Imelda. An EF-1 tornado
with maximum sustained winds of 90 MPH was on the ground for
about 3 miles near Highlands, TX. It brought down large tree
branches, snapped tree trunks, and damaged a few structures.

Tropical Storm Imelda
16
City County Water Level (FT)
Datum Date/Time(UTC)
Manchester Harris 3.50 MHHW 19/1948
Eagle Point Galveston 2.22 MHHW 17/0312
Galveston Pier Galveston 2.08 MHHW 16/2324
Maximum Observed Water Level
City Min Pressure (MB)
Date/ Time(UTC)
Max Sustained (KT)
Date/ Time(UTC)
High Island 997.97 17/1115 135/028 17/2035
Brazos 451 Oil Platform 1005.08 17/1315 180/020 17/1335
Angleton 1007.11 17/1930 200/018 17/2230
Lowest Sea Level Pressure Observations
City/Town County Rainfall (inches)
NW Winnie Chambers 40.79
WNW Devers Liberty 36.26
E Hankamer Chambers 33.15
SE Roman Forest Harris 29.72
Splendora Montgomery 27.04
Sargent Matagorda 23.06
SE Cut And Shoot Montgomery 22.84
N Huffman Harris 22.52
Highest Storm Total Rainfall Amounts
https://forecast.weather.gov/product.php?site=NWS&issuedby=HGX&product=PSH&glossary=1
Source – NWS Houston/Galveston Post Storm Report Imelda:
City/Town County Rainfall (inches)
SW Porter Harris 21.35
NE Crosby Harris 20.76
NNW Dayton Harris 19.99
N Daisetta Liberty 18.86
SE Galveston Scholes Field
Galveston17.72
SSW Kingwood
Harris17.68
SSE Anahuac Chambers 17.08
SW Porter Heights
Harris16.60

Climate Primary Site History
17
Galveston (GLS)
Houston Hobby (HOU)
City of Houston (IAH)
College Station (CLL)
Records for Galveston are from observations at the following locations: 67-69 Strand (April 1, 1871 - Aug 31, 1874); 23rd and the Strand (Sep 1, 1874 - July 29, 1878), 1.75 miles WSW of the previous location; the Custom House at Bath Street and the Strand (July 30, 1878 - May 8, 1882); Colorado and Santa Fe Railroad Building at 25th and the Strand (May 9, 1882 - March 14, 1883); back to the Custom House which later became the Cotton Exchange Building (March 15, 1883 -June 24, 1898), about a 1/3 of a mile E of the previous Custom House location; The Levy Building at 2223 Market Street (June 25, 1898 - Nov 26, 1900); the Trust Building at Tremont and Post Office Streets (Nov 27, 1900 - June 24, 1946), one-quarter mile south of the Levy Building; the U.S. Post Office Building at 601 Rosenberg (June 25, 1946 - 1994); Scholes Field (January 1995 to present).
Records from 1893 through July 1951 are based on observations taken at the Texas Agriculture Experiment COOP Station main farm located 6 miles southwest of College Station. Records from August 1951 through the present are based on observations taken at Easterwood Field. Normal temperatures are calculated from 1981 to 2000 period.
Records are based upon observations beginning in August 1931.
Records for the City of Houston are from observations at the following locations: Cotton Station from July 1881 through September 1909, Stewart Building at Preston and Fannin from September 1909 through February 1926, Shell Building at Texas and Fannin from March 1926 through August 1938, Federal Building at Franklin and Fannin from August 1938 through May 1969, Intercontinental Airport from June 1969 to the present .