nwi webinar starting soon! · (5% growth with no change in los) 4450 4906 5408 5961 6573 7247 6000...
TRANSCRIPT

NWI webinar starting soon! In the meantime, please note…
• We recommend that you close all file sharing applications and streaming music or video.
• Check your settings in the audio pane if you are experiencing audio problems.
• During the presentation, you can send questions to the webinar organizer, but these will be held until the end.
*This webinar and the PowerPoint will be available on the NWI website. http://www.nwi.pdx.edu/webinars.shtml

Costs and Cost-Effectiveness in
Wraparound Programs April 8, 2014
Bruce Kamradt, M.S.W.,
Director, Wraparound Milwaukee
Janet Walker, Ph.D.,
Co-Director, National Wraparound Initiative
Member, Technical Assistance Network
Today’s presentation
Overview of published research and evaluation on costs and cost-effectiveness in wraparound
Focus on Wraparound Milwaukee
Evidence on cost-effectiveness
How that information has been used to sustain and expand the program
Questions

Cost studies of Wraparound
“First-generation” cost studies from 1995-2005 documented savings both per child and system wide while also improving outcomes
Wraparound Milwaukee
Los Angeles County
State of Kansas
Dawn Project-Indianapolis
Do newer studies have similar results?
Four newer studies, documentation on NWI website

PRTF Waiver Demonstration:
Final Evaluation Report (2012)
All nine states executed “some form of wraparound”
Enabled children and youth to either maintain or improve their functional status while in the waiver program:
“most children showed improvements for most domains and most follow-up periods”
Global functioning improved
Mental health improvements greatest for those with highest level of need
Waiver costs were around 20 percent of the average per capita total Medicaid costs for services in institutions, an average per capita saving of $20,000 to $40,000.

MA Mental Health Services
Program for Youth (2011)
Versus matched comparison
Total Medicaid claims expenses were lower by 811/month (9732/year)
Inpatient psychiatry down 74%
ER down 32%
One year pre-/ post-enrollment showed decreases in out-of-home treatment
Hospital admissions down 70%
Long term residential care down 82%
Acute residential down 44%
Foster care down 83%

Wraparound Maine, 2011

Oregon Statewide Children’s
Wraparound Initiative Demonstration
2012 report
Data from three demonstration sites covering eight counties
Served about 550 children and families at the time of the report
Compared costs from SCWI counties to others, regardless of participation in Wraparound

Costs lower than comparison

Changes between intake and
discharge
Intake to discharge improvements:
Children not on psychotropic medications increased from 49% to 59%
Living stability: no moves in prior 90 days increased from 60% to 73%; three or more moves decreased from 11% to 2%
Living in family/long-term non-foster increased from 14% to 51%
Caregivers feel adequate to excellent support to address problematic behavior increased from 49% to 72%
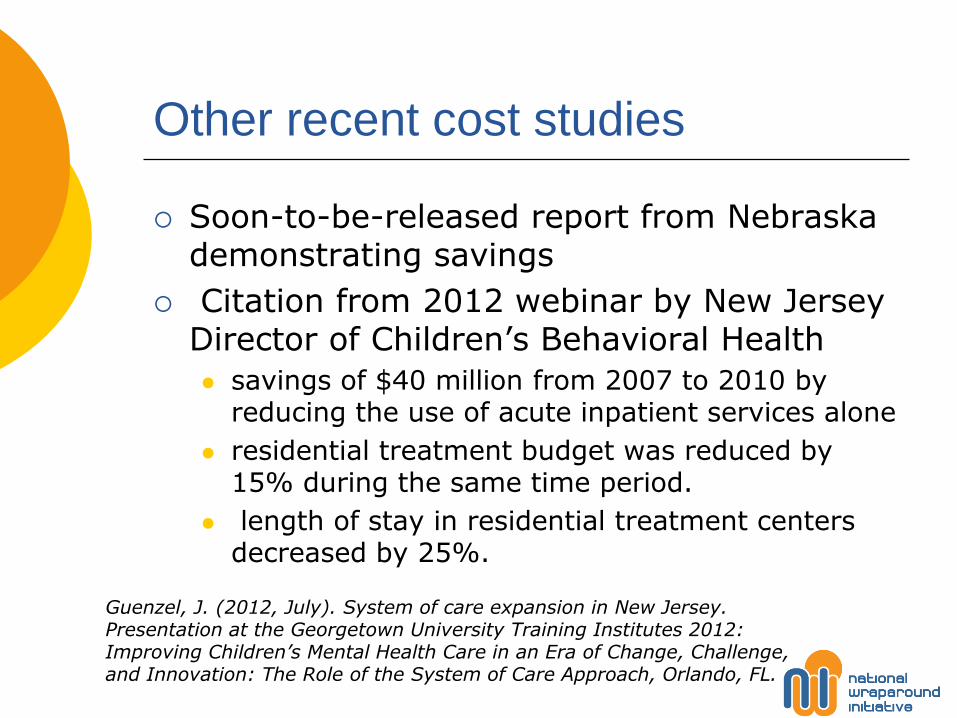
Other recent cost studies
Soon-to-be-released report from Nebraska demonstrating savings
Citation from 2012 webinar by New Jersey Director of Children’s Behavioral Health
savings of $40 million from 2007 to 2010 by reducing the use of acute inpatient services alone
residential treatment budget was reduced by 15% during the same time period.
length of stay in residential treatment centers decreased by 25%.
Guenzel, J. (2012, July). System of care expansion in New Jersey. Presentation at the Georgetown University Training Institutes 2012: Improving Children’s Mental Health Care in an Era of Change, Challenge, and Innovation: The Role of the System of Care Approach, Orlando, FL.

More information
National Wraparound Initiative website www.nwi.pdx.edu
Resources ->library ->financing ->cost studies (or just use site search)
Join the NWI and/or subscribe to our newsletter and we’ll let you know when new items are added.
More information right now from Bruce Kamradt, Director of Wraparound Milwaukee.

The key to the sustainability and tremendous expansion in enrollment and funding in Wraparound Milwaukee has been it’s ability to show how implementation of the model has resulted in positive program outcomes and cost saving to other child serving agencies, particularly Child Welfare, Juvenile Justice and Medicaid
Being able to measure and demonstrate positive program and particularly fiscal outcomes has been the argument to policy makers for continued “investment and reinvestment” of savings from reduced need for institutional care back into the program to expand enrollment from the original 25 youth to now 1075

Milwaukee County consists of a culturally and ethnic diverse population of 1.1 million (230,00 children ages 0-18)
In the mid 1990’s Milwaukee County faced significant clinical, programmatic and fiscal issues related to how care was provided to children with serious emotional and mental health needs
There was over utilization of institutional care for these children in hospitals, residential treatment centers and correctional facilities
The high placement numbers of these youth by mental health, Child Welfare and Juvenile Justice authorities was creating serious fiscal issues

The clinical outcomes were poor and recidivism high
Very little collaboration took place among mental health, Child Welfare and Juvenile Justice systems and this resulted in a fragmented service delivery system
What Milwaukee needed was “Real System Transformation” which opened the door for Wraparound Milwaukee’s Development

A system of care and unique care management entity serving children with serious emotional and mental health needs and their families
Established in 1995 to provide community-based alternatives to youth being placed in institutional placements, juvenile correctional placements and in-patient psychiatric hospitals
Serves all SED youth across child serving systems including Child Welfare, Juvenile Justice and Mental Health and is the single payor of all care for this population
Currently serves 1075 youth/families on a daily basis

Operates as a special manages care entity under a 1915(a) provision and contract between the Wisconsin Medicaid Program and Milwaukee County
Pools monies across child serving systems using various approaches including capitation payments and crisis billing on a fee-for-service basis from Medicaid, a case rate methodology from Child Welfare and both fixed allocation and case rate payment strategy with Juvenile Justice
The current pooled funding is $52 million per year and any annual savings in excess of services paid out is retained in risk reserve (currently about $5 million)

CHILD WELFARE Funds thru Case Rate
(Budget for Institutional Care for Chips Children)
JUVENILE JUSTICE (Funds Budgeted for
Residential Treatment and Juvenile Corrections Placements)
MEDICAID CAPITATION (1923per Month per Enrollee)
MENTAL HEALTH •CRISIS BILLING • HTI GRANT
• HMO COMMERCIAL INSUR
WRAPAROUND MILWAUKEE CARE MANAGEMENT ORGANIZATION
(CMO)
52.0M
CHILD & FAMILY TEAM OR
TRANSITION TEAM
PLAN OF CARE OR
10.0M 10.0M 24.0M 8.0 M
FUTURES PLAN
FAMILIES UNITED
$525,000
18

System of Care
Child Welfare
Alternative to out-of-home care high costs/poor outcomes
Juvenile Justice
Alternative to residential & Correctional placements
Medicaid
Alternative to IP/ER-high cost
Special Education
Reduced alternative school costs

We utilize a wraparound approach with highly individualized, strength-based, family directed care
Care coordinators facilitate the care planning teams with families having access to family advocates and educational advocates through Families United of Milwaukee
Ratio of care coordinators to families is 1:8
Care coordinators have unique legal roles in Wraparound Milwaukee and prepare reports, testify in court, prepare legal documents
Participation in Wraparound Milwaukee for youth adjudicated delinquent or children in need of protection or services is part of the court order (flex orders)

Since Wraparound Milwaukee serves all Milwaukee County youth with serious emotional and mental health needs and is the single payor of care, one of our first studies was to compare the costs of WAM to institutional care
For the past 5 years, as the graph on the next slide shows, the average monthly cost of care for a youth in Wraparound Milwaukee has consistently been less than the average cost for institutional care
6 year average monthly cost comparison ◦ Wraparound Milwaukee $3,545 ◦ Group Home $5,998 ◦ Correctional Facility $8,374 ◦ Residential Treatment $9,116 ◦ Psychiatric Hospital Stay (30 days) $38,130

Cost Effectiveness
Wraparound Milwaukee vs. Institutional Placements
Over Past Six Years
(average monthly cost of service)
$36,200.00
$37,500.00
$38,100.00
$38,500.00
$39,100.00
$39,370.00
$8,120.00
$8,493.00
$9,090.00
$9,863.00
$9,460.00
$9,672.00
$7,850.00
$8,160.00
$8,250.00
$8,790.00
$8,821.00
$8,714.00
$5,925.00
$5,986.00
$5,986.00
$5,995.00
$6,083.00
$5,952.00
$3,878.00
$3,786.00
$3,663.00
$3,485.00
$3,200.00
$3,263.00
$-
$2
,00
0.0
0
$4
,00
0.0
0
$6
,00
0.0
0
$8
,00
0.0
0
$1
0,0
00
.00
$1
2,0
00
.00
$1
4,0
00
.00
$1
6,0
00
.00
$1
8,0
00
.00
$2
0,0
00
.00
$2
2,0
00
.00
$2
4,0
00
.00
$2
6,0
00
.00
$2
8,0
00
.00
$3
0,0
00
.00
$3
2,0
00
.00
$3
4,0
00
.00
$3
6,0
00
.00
$3
8,0
00
.00
$4
0,0
00
.00
2008
2009
2010
2011
2012
2013
Insti
tuti
onal Pla
cem
ents
vs. W
rap
aro
und 2
00
8-2
01
3
Wraparound
Milwaukee
Group Home
Correctional
Residential
Treatment
Inpatient
Hospitalizati
on
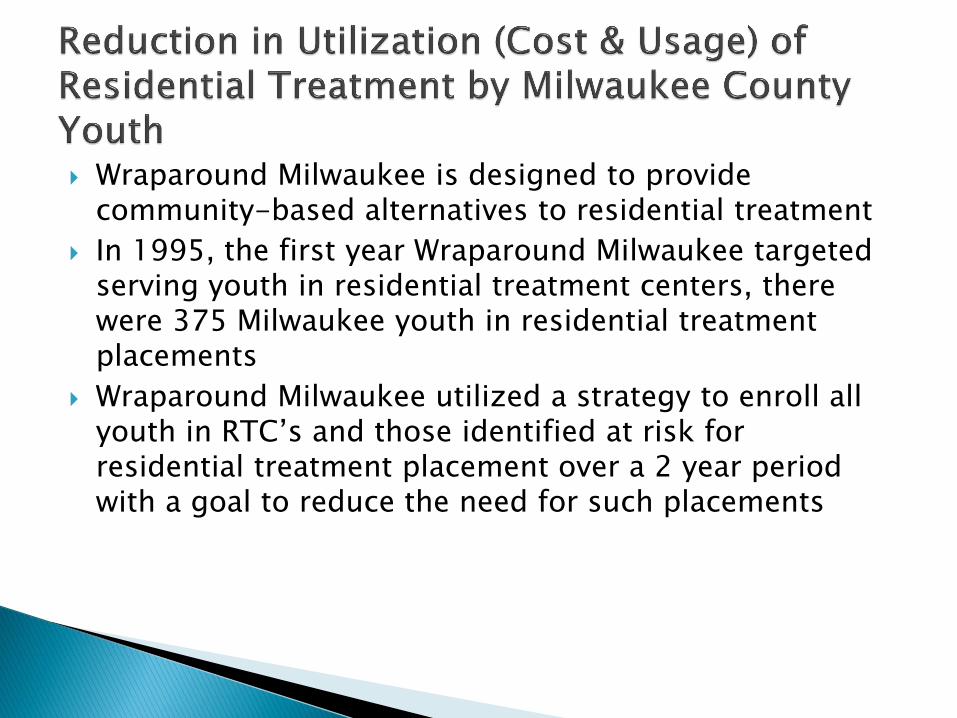
Wraparound Milwaukee is designed to provide community-based alternatives to residential treatment
In 1995, the first year Wraparound Milwaukee targeted serving youth in residential treatment centers, there were 375 Milwaukee youth in residential treatment placements
Wraparound Milwaukee utilized a strategy to enroll all youth in RTC’s and those identified at risk for residential treatment placement over a 2 year period with a goal to reduce the need for such placements
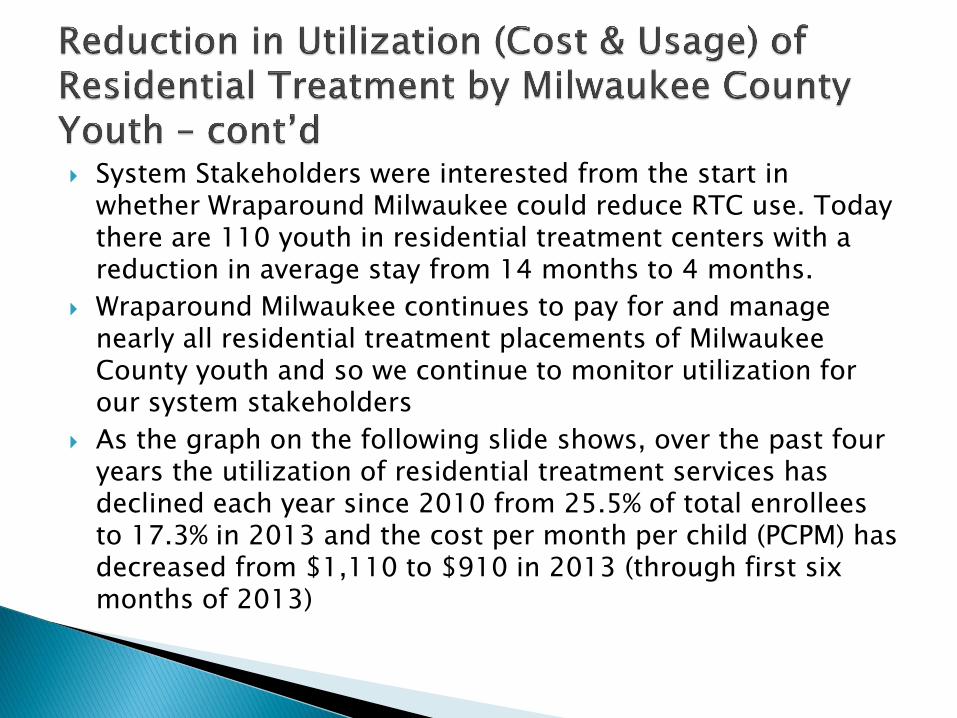
System Stakeholders were interested from the start in whether Wraparound Milwaukee could reduce RTC use. Today there are 110 youth in residential treatment centers with a reduction in average stay from 14 months to 4 months.
Wraparound Milwaukee continues to pay for and manage nearly all residential treatment placements of Milwaukee County youth and so we continue to monitor utilization for our system stakeholders
As the graph on the following slide shows, over the past four years the utilization of residential treatment services has declined each year since 2010 from 25.5% of total enrollees to 17.3% in 2013 and the cost per month per child (PCPM) has decreased from $1,110 to $910 in 2013 (through first six months of 2013)

*2013 (Year-to-Date) Graph 5
Average Utilization Trends (Cost and Usage) of
Residential Treatment by Wraparound Milwaukee
Enrollees (2010-2013)*
*2013 (year-to-date)

Availability of an array of community-based alternatives in the Provider Network such as in-home treatment, crisis 1:1 stabilizers, professional foster homes, etc
Well trained and supervised care coordinators
Prior authorization of RTC care and required progress reports
Specialized Wraparound “coaches” who help teams with very complex youth and where teams get “stuck” with developing effective community plans
Improved transitional planning with the residential treatment centers including educational advocacy/planning
High risk youth i.e. juvenile sex offenders, more violent offender reviewed monthly with psychologist specializing in those more complex youth

Wraparound Milwaukee developed a methodology shown in the graph on the following slide to show what the potential for increase costs may have been to Milwaukee County child serving agencies had the number of RTC placements continued to increase by 5% every year and cost of RTC placements had also increased by the same percentage (as they had in the previous 5 years)
This graph compares the projected costs without Wraparound with the actual expenditures for residential treatment for County youth over the same period
Total projected expenses in 2013 without Wraparound Milwaukee would have been approximately $88.8 million versus $12.5 million in 2013

337 373
410 452
494
545
600
661
729 765
0
100
200
300
400
500
600
700
800
900
1996 1998 2000 2002 2004 2006 2008 2010 2012 2013
No
. of
Pla
cem
en
ts
Average Daily Census of Youth in RTC’s *Actual Number of Placements & Costs for That Year
RTC Placements
Potential Increase in RTC Placements w/o
Wraparound Milwaukee
(5% growth with NO Change in LOS)
44
50
49
06
54
08
59
61
65
73
72
47
79
89
88
08
97
10
96
72
2000
4000
6000
8000
10000
RTC
Rat
e
Average RTC Rate & Total Projected Annual Expenditures
Child Welfare/Juvenile Justice
Expenditures for RTC without
Wraparound Milwaukee RTC Rate Increase of 5%/year
With 5% Increase of No. of Placements
Cost of Doing Nothing Residential Treatment
Placements & Costs Without Wraparound
Milwaukee

Nearly 45% of youth with serious emotional and mental health enrolled in Wraparound Milwaukee are adjudicated delinquent (about 450).
Nearly 45% of youth on probation supervision in Milwaukee County are enrolled in Wraparound Milwaukee
Wraparound Milwaukee and our Judicial and Delinquency System views the collection of recidivism data as an important accountability measure and an outcome that has financial and program importance
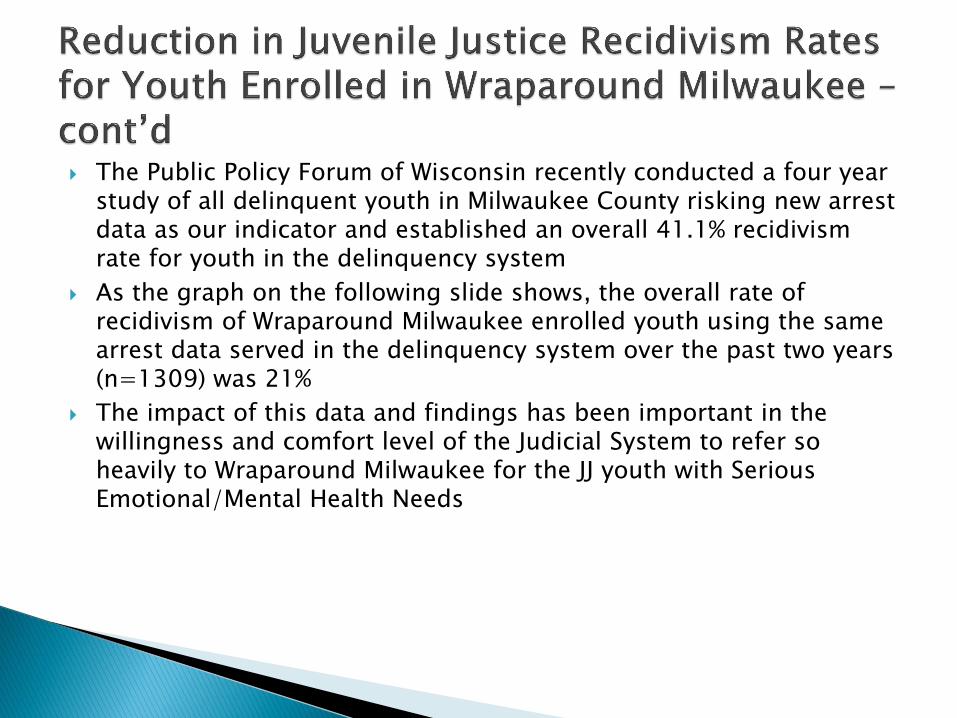
The Public Policy Forum of Wisconsin recently conducted a four year study of all delinquent youth in Milwaukee County risking new arrest data as our indicator and established an overall 41.1% recidivism rate for youth in the delinquency system
As the graph on the following slide shows, the overall rate of recidivism of Wraparound Milwaukee enrolled youth using the same arrest data served in the delinquency system over the past two years (n=1309) was 21%
The impact of this data and findings has been important in the willingness and comfort level of the Judicial System to refer so heavily to Wraparound Milwaukee for the JJ youth with Serious Emotional/Mental Health Needs

21%
79%
Number Re-
Offending
Number with
No Re-Ofense

95%
5% Percentage of Non-
High Risk Youth in
Wraparound
Population
Percentage of High
Risk Re-Offenders

Wraparound Milwaukee needed to show what the direct fiscal impact of the reduction in recidivism had on correctional placements of county youth. In Wisconsin, including Milwaukee County, counties are responsible to pay for the costs of youth committed to the State correctional system (Youth Aids Program)
While counties receive some base level state funding, placement cost in excess of state funding must be absorbed by county funds
But counties also retain savings in excess of their aids base level funding to fund community-based care for delinquent youth if they can reduce juvenile correctional placements
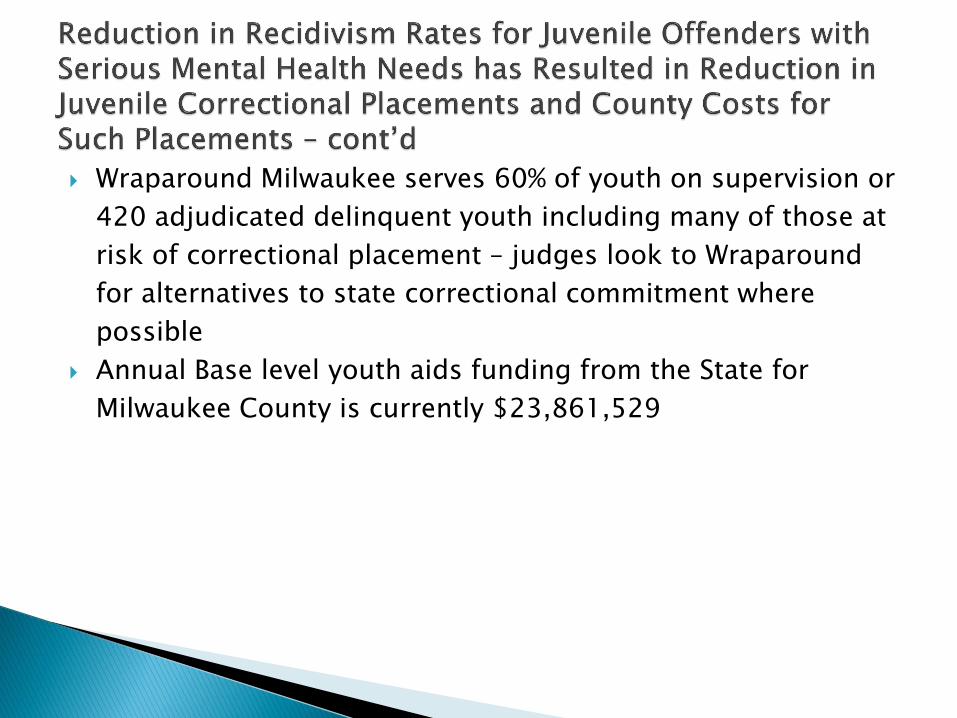
Wraparound Milwaukee serves 60% of youth on supervision or
420 adjudicated delinquent youth including many of those at
risk of correctional placement – judges look to Wraparound
for alternatives to state correctional commitment where
possible
Annual Base level youth aids funding from the State for
Milwaukee County is currently $23,861,529
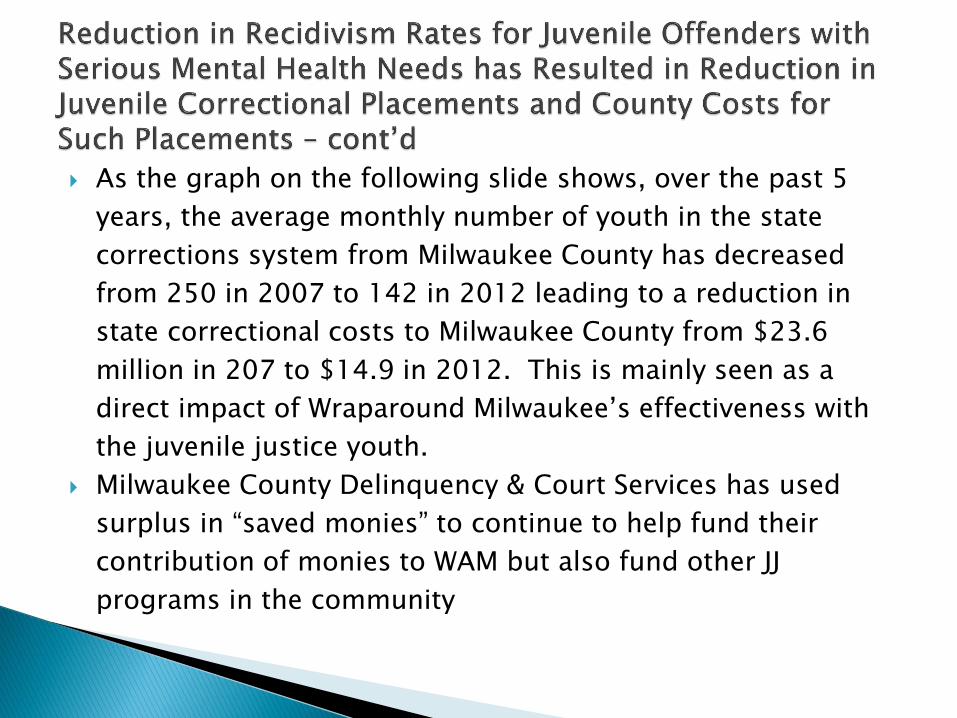
As the graph on the following slide shows, over the past 5
years, the average monthly number of youth in the state
corrections system from Milwaukee County has decreased
from 250 in 2007 to 142 in 2012 leading to a reduction in
state correctional costs to Milwaukee County from $23.6
million in 207 to $14.9 in 2012. This is mainly seen as a
direct impact of Wraparound Milwaukee’s effectiveness with
the juvenile justice youth.
Milwaukee County Delinquency & Court Services has used
surplus in “saved monies” to continue to help fund their
contribution of monies to WAM but also fund other JJ
programs in the community

Wraparound Milwaukee serves 40% of youth in Milwaukee County on probation and most of youths at • immediate risk of residential treatment/correctional placement.

The latest research has shown youth in state correctional placements have higher recidivism rates than youth treated in the community. Youth recidivism rates within states are often reported 50% or higher for incarcerated youth
Youth incarcerated in state juvenile facilities do not develop social skills; such as, self-control and conflict resolution as well as those who remain in the community
Incarcerated youth suffer more mental health issues and are at a higher risk of suicide
Grouping youth in state correctional facilities reduce their educational and vocational outcomes, disrupt their families, introduce them to delinquent peers and expose them to increased likelihood of trauma

Wraparound Milwaukee is a special managed care entity that covers the cost of in-patient psychiatric hospitalization for all members
When Medicaid approved the contract with Milwaukee County in 1996 it was their desire to see better management of and reduced utilization of in-patient psychiatric care days for youth with serious emotional and mental health needs – so we have set up measures to look at the utilization of inpatient psychiatric care for WAM
The graph on the following slide shows utilization (PCPM) of WAM benefit services for 2012 including psychiatric hospitalization
The $51.13 PCPM for in-patient psychiatric care was only 2% of the total average expenditures per member of $3,200 per month in 2012.

$6.47
$762.20
$6.09
$377.42
$16.97
$13.59
$18.25
$255.15
$373.65
$33.02
$182.27
$51.13
$31.16
$18.28
$74.68
$4.61
$922.87
$8.90
$27.34
$15.59
$-
$1
00
$2
00
$3
00
$4
00
$5
00
$6
00
$7
00
$8
00
$9
00
$1
,000
AODA Services
Care Coordination
Child Care
Crisis Services
Day Treatment
Discretionary/Flex funds
Family/Parent Aide and Support
Therapeutic Foster Care
Group Home
Independent Living Apartments
Intensive In-Home Therapy
Inpatient Hospital
Life Skills Training
Medication Management
Outpatient Individual/Office based…
Psychological Assessments
Residential Treatment
Respite
Transportation
Youth Support/Recreation
Serv
ice G
roups
Average Total Paid Per Child (Per Month) for CY 2012 (PCPM)

The graph on the following slide shows for Medicaid that the percentage of Wraparound Milwaukee expenditures on psychiatric in-patient hospitalization over the past ten years from 2003 – 2013 showing that expenditure did not exceed 2.3% of expenditures and averaged about 1.5% of all Wraparound behavioral health spending
Accounting for this low rate of hospital in-patient spending has been the effectiveness of our Mobile Crisis Teams and availability of crisis stabilization services including crisis 1:1 stabilizers and temporary crisis/respite beds

0.0%
0.5%
1.0%
1.5%
2.0%
2.5%
2003 2004 2005 2006 2007 2008 2009 2010 2011 2012 2013
Percent Wraparound Expenditures on Inpatient Hospitalization, by Year
41
Source: Synthesis payment records

Annual Reports
Semi-Annual and Annual QA/QI Reports
Monthly Newsletter
Utilization Review Reports sent to Stakeholders
Meetings of Wraparound Milwaukee Partnership Council and other Stakeholder Meetings
Preparation and Dissemination of Periodic Studies and Reports

It is critical to develop good approaches to measure, monitor and report on fiscal outcomes for Wraparound Programs. The single biggest downfall to sustaining Wraparound Programs has been the lack of good fiscal data and/or ways to present such data to show the fiscal effectiveness of Wraparound Based Systems of Care

The National Wraparound Initiative is funded by the Center for Mental Health Services, Substance Abuse and Mental Health Services Administration, United States Department of Health and Human Services.
The National Wraparound Initiative is based in Portland, Oregon. For more
information, visit our website:
www.nwi.pdx.edu
This webinar was brought to you in partnership with the Technical Assistance Network.
Find us on Facebook at https://www.facebook.com/nwi.pdx!