nutritional evaluation of canola meal produced …
TRANSCRIPT

NUTRITIONAL EVALUATION OF CANOLA MEAL PRODUCED FROM A NEW
VARIETY OF CANOLA SEEDS IN BROILER CHICKENS AND LAYING HENS
BY
MATTHEW FRANCIS GORSKI
THESIS
Submitted in partial fulfillment of the requirements
for the degree of Master of Science in Animal Sciences
in the Graduate College of the
University of Illinois at Urbana-Champaign, 2015
Urbana, Illinois
Adviser:
Professor Carl M. Parsons

ii
ABSTRACT
Four precision-fed rooster assays, two broiler chicken experiments and one laying hen
experiment were conducted. The four precision-fed rooster assays were used to determine the
values of MEn using conventional roosters and ileal digestible amino acid values using
cecectomized roosters. The first experiment evaluated a conventional canola meal (Conv CM) in
broiler chicken diets from 2 to 37 days of age. Treatments were replicated eight times using five
chickens per replicate. Treatment diets were corn and soybean meal based and contained 0, 10,
20, 30 or 40% Conv CM from 2 to 21d of age and 0, 10, 20 or 30% Conv CM from 21 to 37d of
age. In the starter phase (d 2 to 21), there was a significant negative effect (P<0.05) in weight
gain and feed intake for CM levels in excess of 10% CM. The second broiler experiment
evaluated both Conv CM and a new increased protein: reduced fiber Test CM. Seven treatments
were replicated eight times using five chickens per replicate. For the starter phase (2 to 19d), the
Treatment 1 diet contained no CM, Treatment 2-4 diets contained 8% Test CM and Treatment 5-
7 diets contained 8% Conv CM. At day 20, chicks were switched to grower diets which
contained either no CM or 8, 16, or 24% of test CM or Conv CM. These diets were fed until 44
d of age. There were no significant differences among dietary treatments in weight gain, feed
intake, or feed efficiency for either phase of the experiment. The third experiment examined the
effects of the new test CM and Conv CM in laying hen diets from 33 to 49 weeks of age. Seven
treatments were replicated eight times using 14 caged hens per replicate. Corn-soybean meal
diets again contained either no CM or 8, 16, or 24% Test CM or Conv CM. No significant
differences were observed among treatments for feed intake, egg production, egg weight, egg
mass, feed efficiency, or body weight change over the duration of the experiment. The results of
these experiments indicate that a new increased protein; reduced fiber Test CM can be used

iii
effectively in broiler chicken and laying hen diets when diets are formulated to be equal in ME
and digestible amino acids.

iv
ACKNOWLEDGEMENTS
First and foremost, I would like to thank Dr. Carl Parsons for giving me the opportunity
to go to graduate school and helping me along the way. He allowed me to pursue my interests in
poultry research and I am forever grateful. He graciously sent me to many conferences and
conventions to allow me to increase my knowledge of poultry and the industry. I am also
thankful that he spent many hours reading and editing my writing. I could not have gone down
this journey if it was not for his endless support and kindness through the many years of
undergraduate advising as well as graduate school. The next round of golf is on me. Another
thanks to Dr. Ken Koelkebeck and Dr. Hans Stein for being on my committee and guiding me to
the finish.
Next, I would like to thank Pam Utterback for her help and teaching along the way. She
has taught me more about research and poultry than I ever thought there was to learn. I could not
have done my own research if it was not for her countless hours of help. I would also like to
thank the Poultry Farm staff for their help preparing for my experiments and cleaning up after I
was done. The farm would not run as smoothly as it does if it wasn’t for their hard work behind
the scenes. Thank you to all my lab mates, who helped me weigh, move, and feed the birds on
my trials.
I also need to thank my parents for their unending love, support, and guidance throughout
my years of school. I could have never done this journey without you. I know you thought I was
crazy at first for getting involved with chickens but it means the world to me that you have
supported me with all my decisions over the years. Finally, I would like to thank my girlfriend
for loving me and being there for me through all the busy times. I know the future has a lot of
uncertainties, but one thing that is certain, is you. Thank you all!
v
TABLE OF CONTENTS
LIST OF TABLES ........................................................................................................................ vii
CHAPTER 1 INTRODUCTION ................................................................................................... 1
LITERATURE CITED ............................................................................................................... 3
CHAPTER 2 THE NUTRITIONAL VALUE OF CONVENTIONAL AND HIGH-PROTEIN
CANOLA MEAL FED TO POULTRY: A LITERATURE REVIEW .......................................... 5
INTRODUCTION ...................................................................................................................... 5
EFFECTS OF CANOLA MEAL FED TO BROILER CHICKENS .......................................... 8
EFFECTS OF CANOLA MEAL FED TO LAYING HENS ................................................... 12
CONCLUSIONS ...................................................................................................................... 16
LITERATURE CITED ............................................................................................................. 18
CHAPTER 3 NUTRITIONAL EVALUATION OF CONVENTIONAL AND HIGH-PROTEIN
CANOLA MEAL FED TO BROILER CHICKENS.................................................................... 23
ABSTRACT .............................................................................................................................. 23
INTRODUCTION .................................................................................................................... 24
MATERIALS AND METHODS .............................................................................................. 25
RESULTS AND DISCUSSION ............................................................................................... 27
LITERATURE CITED ............................................................................................................. 30
CHAPTER 4 NUTRITIONAL EVALUATION OF CONVENTIONAL AND HIGH-PROTEIN
CANOLA MEAL FED TO LAYING HENS ............................................................................... 44
ABSTRACT .............................................................................................................................. 44
INTRODUCTION .................................................................................................................... 44
MATERIALS AND METHODS .............................................................................................. 46

vi
RESULTS AND DISCUSSION ............................................................................................... 47
LITERATURE CITED ............................................................................................................. 50
CHAPTER 5 CONCLUSIONS ................................................................................................... 55
vii
LIST OF TABLES
TABLE 3.1. Nutrient composition of ingredients used in Experiment 1 (as-fed basis) ............... 33
TABLE 3.2. Nutrient composition of ingredients used in Experiment 2 (as-fed basis) ............... 34
TABLE 3.3. Ingredient and nutrient compositions of the experimental diets provided to chicks
from 2 to 21 d of age for Experiment 1 ........................................................................................ 35
TABLE 3.4. Ingredient and nutrient compositions of the experimental diets provided to chicks
from 21 to 37 d of age for Experiment 1 ...................................................................................... 36
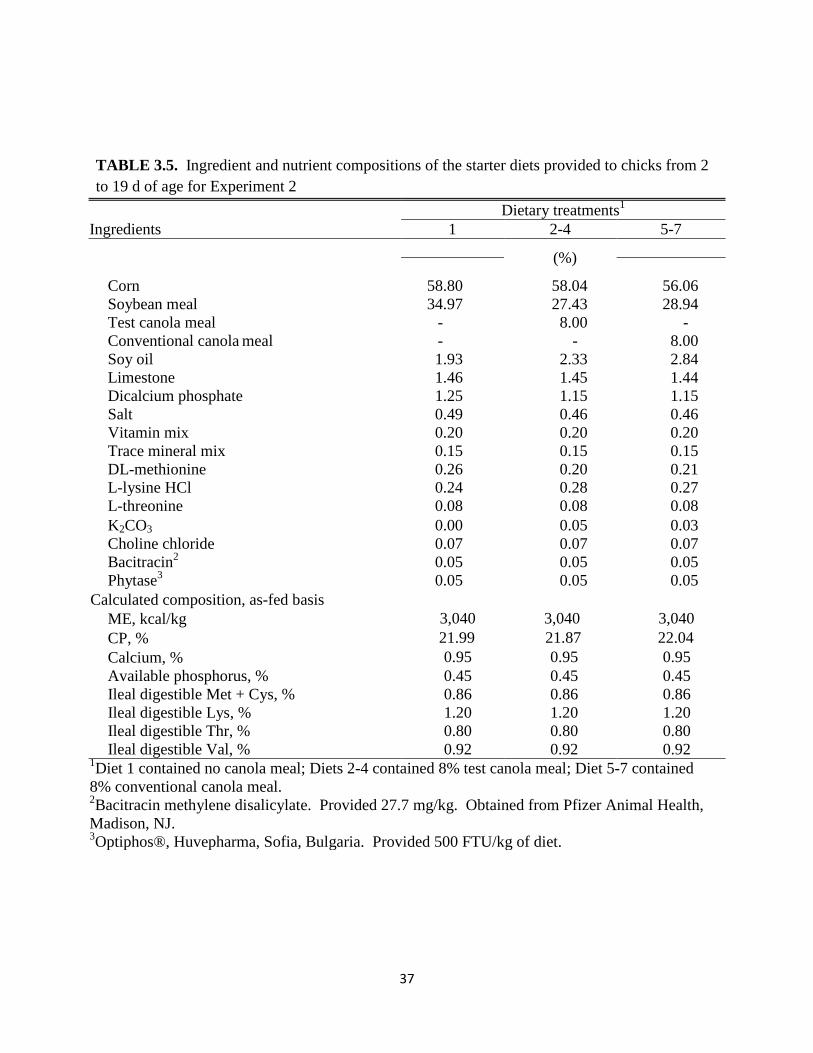
TABLE 3.5. Ingredient and nutrient compositions of the starter diets provided to chicks from 2
to 19 d of age for Experiment 2 .................................................................................................... 37
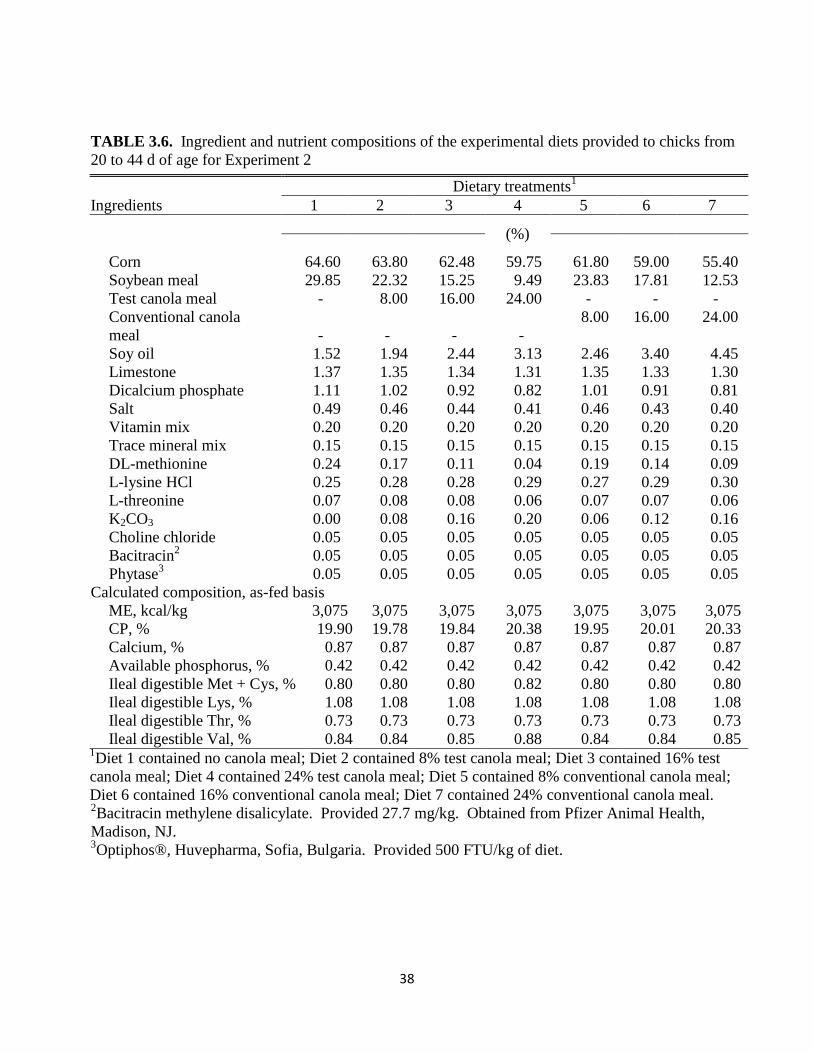
TABLE 3.6. Ingredient and nutrient compositions of the experimental diets provided to chicks
from 20 to 44 d of age for Experiment 2 ...................................................................................... 38
TABLE 3.7. Body weight gain, feed intake and gain:feed for starter phase (2-21 d) for
Experiment 1 ................................................................................................................................. 39
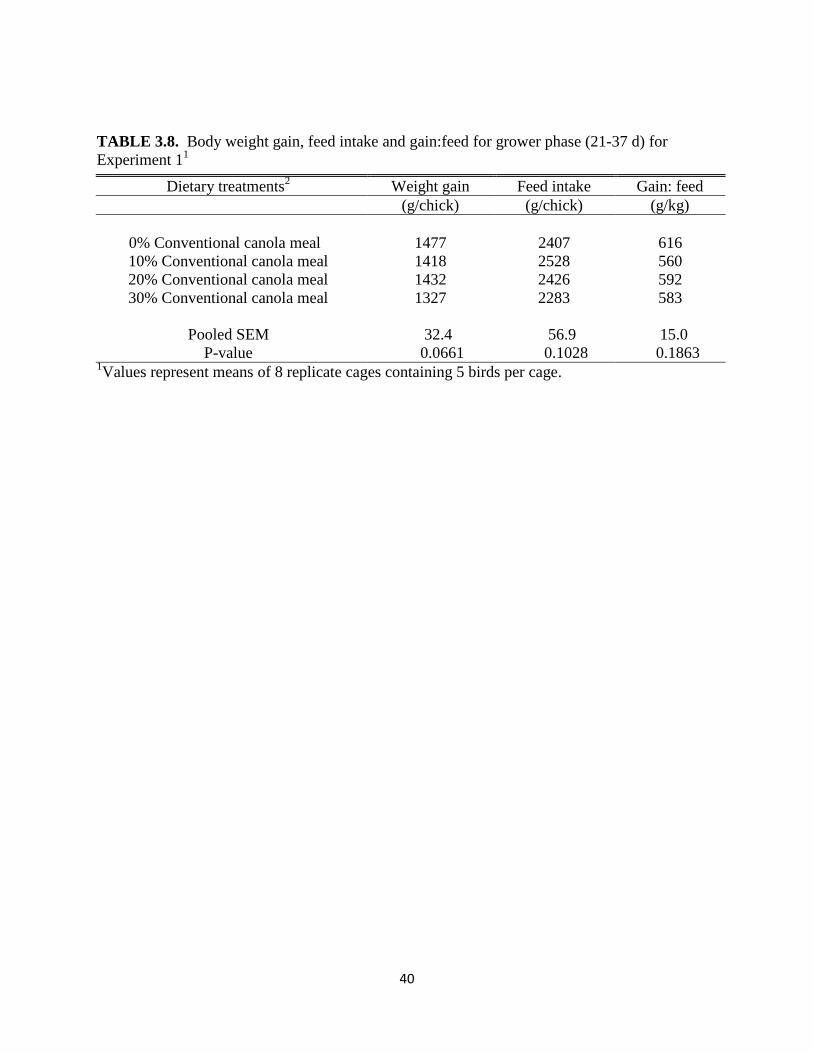
TABLE 3.8. Body weight gain, feed intake and gain:feed for grower phase (21-37 d) for
Experiment 1 ................................................................................................................................. 40
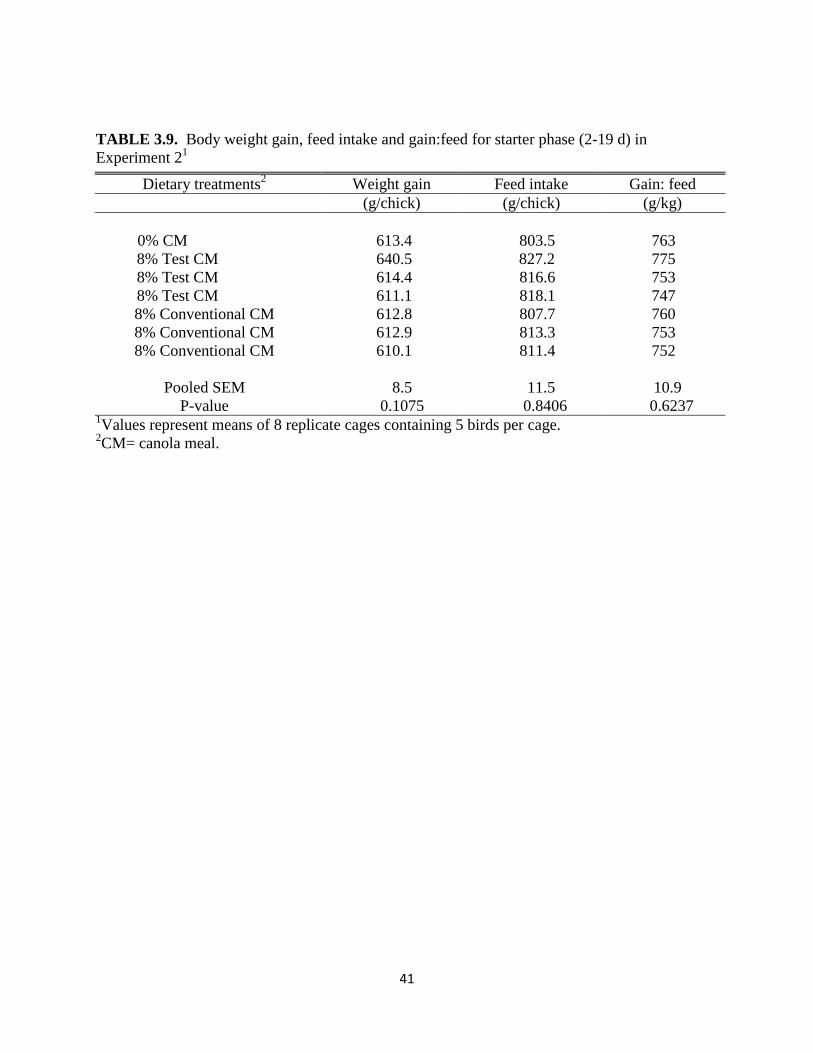
TABLE 3.9. Body weight gain, feed intake and gain:feed for starter phase (2-19 d) in
Experiment 2 ................................................................................................................................. 41
TABLE 3.10. Body weight gain, feed intake and gain:feed for grower phase (20-44 d) in
Experiment 2 ................................................................................................................................. 42
TABLE 3.11. Body weight gain, feed intake and gain:feed for all phases (2-44 d) in Experiment
2..................................................................................................................................................... 43
TABLE 4.1. Ingredient and nutrient compositions of the experimental diets provided to laying
hens for 16 weeks.......................................................................................................................... 52

viii
TABLE 4.2. Effects of dietary canola meal on hen performance ................................................ 53
TABLE 4.3. Influence of dietary canola meal on hen body weights and egg quality measures . 54
1
CHAPTER 1
INTRODUCTION
The term “canola” is used to reference a variety of rapeseed that is low in glucosinolate
content (< 30 µmol/g) and erucic acid (< 2%); (Bell, 1993; Khajali and Slominski, 2012).
Canola seeds vary in size and shape, but are often small and round. Canola is typically grown in
northern areas where soybeans do not mature rapidly and are produced from a yellow-flowering
plant. However, variations among varieties in climatic conditions and harvesting conditions may
affect the concentration of fat, protein, amino acids, and carbohydrates in canola seeds and meals
(Barthet and Duan, 2011; Newkirk, 2011). Canola is the second largest oilseed crop after
soybeans (USDA, 2012) and contributes approximately 13% of the total oilseed meal production
in the world (USDA, 2013). However, the oil content of canola is higher than in soybeans, as a
percentage of the seed, and often considered healthier for human consumption, which makes it
more desirable (Daun, 2011). After the oil has been extracted for the food industry, the resulting
meal is used as a livestock feed ingredient. Traditionally, canola meal has been primarily fed to
ruminant animals due to the high fiber content, which is poorly digested in poultry and swine,
and anti-nutritional factors that can be “detoxified” in the rumen. These anti-nutritional factors,
which include glucosinolates, erucic acid, sinapine, and tannins, make canola meal less desirable
to poultry and swine because they may reduce feed intake and growth performance, as well as
the digestibility of nutrients (Bell, 1993).
In order for canola meal to be utilized by all livestock species, breeding programs have
been established to reduce the anti-nutritional factors, increase the protein content, and reduce
the fiber content to be more competitive with soybean meal (Khajali and Slominski, 2012). For

2
animal diets, the nutritional value of feed ingredients is a function of nutrient composition,
specifically digestible protein and amino acid levels, as well as energy and mineral
concentrations (Arntfeld and Hickling, 2011). Therefore, new, yellow-seeded varieties of canola
have a larger seed with a thinner hull compared to their black-seeded relatives (Thacker, 1990;
Slominski et al., 1994; Khajali and Slominski, 2012). With a thinner hull, there is a reduction in
fiber content and because of this, it is expected that the resulting meal has greater nutritional
value than meal produced from traditional black-seeded varieties. Further research is needed to
determine if new varieties of canola seeds that have reduced fiber and increased protein have
improved nutritional value when fed to poultry compared with the traditional black-seeded
conventional varieties.
3
LITERATURE CITED
Arntfield, S., and D. Hickling. 2011. Meal nutrition and utilization. Pages 281-312 in Canola:
Chemistry, Production, Processing, and Utilization. J. K. Daun, N. A. M. Eskin, D.
Hickling, eds. AOCS Press, Urbana, IL.
Barthet, V. J., and J. K. Daun. 2011. Seed morphology, composition, and quality. Pages 125-145
in Canola: Chemistry, Production, Processing, and Utilization. J. K. Daun, N. A. M.
Eskin, D. Hickling, eds. AOCS Press, Urbana, IL.
Bell, J. M. 1993. Factors affecting the nutritional value of canola meal: A review. Can. J. Anim.
Sci. 73:679-697.
Daun, J. K. 2011. Origin, distribution, and production. In: J. K. Daun, N. A. M. Eskin, and D.
Hickling, editors, Canola: Chemistry, production, processing, and utilization. AOCS
Press, Urbana, IL. p. 1-27.
Khajali, F., and B. A. Slominski. 2012. Review: Factors that affect the nutritive value of canola
meal for poultry. Poult. Sci. 91:2564-2575.
Newkirk, R. 2011. Meal nutrient composition. Pages 229-244 in Canola: Chemistry, Production,
Processing, and Utilization. J. K. Daun, N. A. M. Eskin, D. Hickling, eds. AOCS Press,
Urbana, IL
Slominski, B. A., L. D. Campbell, and W. Guenter. 1994. Carbohydrates and dietary fiber
components of yellow- and brown-seeded canola. J. Agric. Food Chem. 42:704-707.
Thacker, P. A. 1990. Canola meal. In: P. A. Thacker and R. N. Kirkwood, editors, Nontraditional
feed sources for use in swine production. Butterworth Publishers, Stoneham, MA. p. 69-
78.

4
United States Department of Agriculture. 2012. Soybeans and oil crops: Canola. http://www.ers.
usda.gov/topics/crops/soybeans-oil-crops/canola.aspx. (Accessed 12 March 2015.)
United States Department of Agriculture. 2013. Oilseeds: World markets and trade. Available at:
http://www.fas.usda.gov/psdonline/circulars/oilseeds.pdf. (Accessed 12 March 2015.)
5
CHAPTER 2
THE NUTRITIONAL VALUE OF CONVENTIONAL AND HIGH-PROTEIN CANOLA
MEAL FED TO POULTRY: A LITERATURE REVIEW
INTRODUCTION
Rapeseed is an oilseed from the Brassica species that has been produced for centuries all
around the world. Over the years, plant breeding programs for rapeseed have been able to
improve the nutritional quality and content to make it a higher valued feed ingredient for
livestock. Much of this success has come from breeding programs to reduce the anti-nutritional
properties that rapeseed contains. Traditionally, Brassica rapa (rapeseed) contained 25 to 45%
erucic acid and 50 to 100 µmol/g glucosinolates (Bell, 1993). Rapeseed contains an enzyme
called myrosinase that degrades the glucosinolates into toxic metabolites which makes it harmful
to nonruminant species (Fenwick and Curtis, 1980). These toxic metabolites produced from the
glucosinolates may be the cause of reduced feed intake, liver hemorrhages, fish-taint in brown
eggs, and perosis in chicks (Fenwick and Curtis, 1980; Bell, 1993). Genetic breeding programs
have decreased erucic acid levels to below 2% and glucosinolate levels to below 30 µmol/g
resulting in what is referred to as “double-low” or “double zero” rapeseed. “Double-low”
varieties are called “canola” in North America (Bell, 1993).
Phytic acid, fiber, sinapine and tannins are other anti-nutritional factors in canola (Bell,
1993; Khajali and Slominski, 2012). Phytic acid, or phytate, is the primary storage form of
phosphorus (P), which reduces P absorption and utilization by monogastric animals (Nwokolo
and Bragg, 1977; Khajali and Slominski, 2012). Phytate binds Ca, K, Mg, Fe, Mn, and Zn,
which reduces the availability of these minerals (Nwokolo and Bragg, 1977). The addition of
6
phytase in the diets of poultry will hydrolyze part of the phytate binding complexes, resulting is
more available P and Ca for the animal (Simons et al., 1990; Selle et al., 2009). Canola meal has
relatively high levels of fiber because the hulls in the seeds stay with the meal during processing
(Newkirk, 2009; Barthet and Duan, 2011). The new high-protein varieties of canola also contain
less fiber due to the increased seed size which reduces the thickness of the hull. Therefore, the
resulting canola meal from the new varieties contain less fiber compared to conventional canola
and rapeseed products (Spragg and Mailer, 2007).
Tannins are phenolic compounds with varying molecular weights and complexities
(Kozlowska et al., 1990; Jansman, 1993). They are present in the hull portion of canola and
decrease energy and protein digestibility in the diet (Thacker and Petri, 1990; Khajali and
Slominski, 2012). In one study it was observed increased endogenous losses of Met, Lys, and
His when tannic acid was added to the diet (Mansoori and Acamovic, 2007). Met and Lys are
usually the first limiting AA in commercial diets for poultry, the presence of tannins in canola
meal prevents high inclusion of the ingredient. Tannins are removed in the oil extraction process
(Kozlowska et al., 1990), and canola meal usually only contains 1.5% tannins (Mailer, 2004;
Bonnardeaux, 2007). Another compound in canola meal, sinapine, the ester of sinapic acid, may
contribute to the dark color and bitter taste in canola meal (Kozlowska et al., 1990). Sinapine is
believed to be the cause of fishy-tainted eggs in brown egg layers (Perez-Maldonado, 2002).
Sinapine can bind with choline which prevents choline absorption in the small intestine.
Bacterial fermentation of choline in the lower gut causes the production of trimethylamine
(TMA), which is then absorbed into the portal blood. Subsequently, this causes the TMA to be
deposited into the egg yolk, which results in a fishy smell of the eggs (Ward et al., 2009).
Despite the effectiveness of reducing the tainting potential of rapeseed meal by treatment with
7
lime, ammonia, or by micronisation, the effects were not sufficient to prevent inhibition of TMA
oxidation and subsequent egg tainting (Fenwick et al. 1984)
Canola seeds contain 45 to 50% oil depending on the variety, of which about 98% is
removed by the prepress solvent extraction process (Barthet and Duan, 2011). The resulting
material leftover from the processs is canola meal. Canola oil is marketed for human
consumption as the lowest saturated fat containing vegetable oil. It has roughly 50% less
saturated fatty acids than corn and soybean oil (Aukema and Campbell, 2011). The meal
fraction contains 36 to 44% crude protein (CP); (Barthet and Duan, 2011; Khajali and Slominski,
2012; Slominski et al., 2012). The neutral detergent fiber (NDF) values in canola meal range
from 22 to 26% compared with 8 to 12% in soybean meal (Slominski et al., 1994; Khajali and
Slominski, 2012; NRC, 2012).
New yellow-seeded varieties of canola that have been genetically modified through
breeding programs are nutritionally superior to their conventional black-seeded relatives. The
yellow seeds are larger and have a thinner hull, which results in increased crude protein and
decreased fiber compared to darker seeds (Downey and Bell, 1990; Thacker and Petri, 1990;
Khajali and Slominski, 2012). Since most of the protein is stored in the embryo of the seed,
canola meal derived from the larger yellow seeds contains 46 to 50% CP (Simbaya et al., 1995;
Slominski et al., 2012) and therefore contains higher AA concentrations than canola meal
derived from black or dark seeded canola seeds (Slominski et al., 2012). Due to the decreased
hull, dietary fiber concentrations of canola meal derived from yellow-seeded canola is 24 to 27%
compared with 30 to 34% in canola meal from dark-seeded varieties (Slominski et al., 1994;
Simbaya et al., 1995; Slominski et al., 2012). The differences in composition of canola meal
8
derived from yellow and black-seeded canola makes it necessary to conduct research on the
nutritional value of each as a feed ingredient in poultry diets.
EFFECTS OF CANOLA MEAL FED TO BROILER CHICKENS
Slominski et al. (1999) conducted a two week feeding trial to compare yellow-and black-
seeded varieties of Brassica napus. The treatment diets were fed to the chicks from 4 to 18 days
of age. There was no difference in the CP content among the two meals but the yellow-seeded
canola meal had significantly less fiber and fat than the black-seeded canola meal. The
concentration of glucosinolates in the two meals were not different. The inclusion levels of the
black and yellow-seeded canola meal in the experimental diets were 29.7 and 29.5%,
respectively. There were no differences observed in body weight gain between the two canola
meals; however, the chickens fed the diets containing the yellow-seeded canola meal had an
improved feed to gain ratio compared to chickens fed the canola meal derived from black-seeded
canola. Values for feed intake among dietary treatments were not reported, but presumably, feed
intake was less for birds fed diets that consisted of yellow-seeded canola meal. The author
concluded from this study that the yellow-seeded B. napus canola was superior to its black-
seeded counterpart.
Newkirk and Classen (2002) conducted an experiment to determine if eliminating the use
of sparge steam during canola meal processing would prevent toasting and to study the effects of
toasting on broiler chicken performance. The authors hypothesized that the moisture
incorporated into canola meal during desolventization, as sparge steam, promotes toasting and
that nontoasted canola meal would result in higher digestible amino acids. Sparge steaming is
used in canola meal processing to remove the residual hexane solvent from the meal. Dietary
9
treatments consisted of a conventional toasted canola meal or canola meal that had been
desolventized without the use of sparge steam (nontoasted canola meal). The meals were fed to
broiler chickens from 0 to 39 days of age and replaced 0, 20, 40, 60, 80, and 100% of the
soybean meal in wheat-based diets. The authors observed that the elimination of toasting
increased broiler weight when measured at day 19 and 39 as well as feed efficiency from 0 to 19
days of age but toasting had no effect on mortality. Newkirk and Classen (2002) concluded from
this study that desolventization without sparge steam did produce a nontoasted canola meal that
yielded improved broiler growth and feed efficiency in comparison to the chickens whose diets
contained toasted canola meal.
Mushtaq et al. (2007) conducted a growth trial to test the effect of canola meal level on
performance in the diets of broiler chickens from 1 to 42 days of age. The experiment was
divided into a starter phase (2 to 21 d) and a grower phase (22 to 42 d). The dietary treatments
consisted of either 20 or 30% canola meal derived from an unidentified canola species. The
canola meal used was analyzed to contain 38.8, 7.17, 0.58, and 6.74% CP, CF, fat, and ash,
respectively. Glucosinolate contents of the canola meal were not reported. Body weight gain
was significantly reduced when 30% canola meal was added in the diets during the starter phase.
The feed to gain ratio and mortality were also observed to be high at the higher level of canola
meal. When data were combined for the starter and grower periods, no differences in weight
gain and the feed to gain ratio were observed among treatments. Mushtaq et al. (2007)
concluded that diets containing 30% canola meal were not recommended in broiler diets during
the starter phase but could be used during the grower phase.
Min et al. (2011) conducted a similar experiment to evaluate canola meal from biodiesel
production as a feed ingredient for broiler chickens. The experiment used canola meal at 0, 5,
10
10, 15, 20, or 25% of the diet from 1 to 28 days of age. No chemical composition of the canola
meal was reported. No differences were observed among treatments for feed intake, body weight
gain, feed conversion ratio, or mortality. The author concluded that canola meal can be included
in the diets of broilers at 25% without observing any negative effects on growth performance
when the diets are formulated to have equal levels of digestible amino acids.
Thacker and Petri (2011) conducted an experiment to evaluate the nutritional value of
canola protein concentrate for broiler chickens and its effects on nutrient digestibility and growth
performance. The control diet was based on corn and soybean meal and contained 15% canola
meal. The experimental diets contained 3, 6, 9, 12, or 15% canola protein concentrate added at
the expense of canola meal. The diets were formulated to be isocaloric (3,100 kcal/kg) and equal
in digestible amino acids. The composition of the canola meal was 35.19, 3.80, and 25.84% CP,
ether extract, and neutral detergent fiber (NDF), respectively. The canola protein concentrate
had increased NDF (28.34 vs. 25.84) and increased CP (54.37 vs. 35.19) compared with the
canola meal. The digestibility of dry matter, energy, and phosphorus increased linearly with
increasing levels of canola protein concentrate. However, the higher nutrient digestibility of the
diets containing the canola protein concentrate did not translate to improvements in broiler
performance. Weight gain was unaffected by level of canola protein concentrate but feed intake
was significantly increased, with the result that feed conversion tended to be poorer for birds fed
diets containing canola protein concentrate. Thacker and Petri (2011) concluded that although
the digestibility of dry matter, gross energy, and phosphorus were higher for birds fed canola
protein concentrate compared with canola meal, these improvements did not equate to
improvements in broiler performance. The authors offered no further explanation of why these
results may have happened.
11
Jia et al. (2012) conducted an experiment to evaluate the nutritive value of canola meals
derived from black- and yellow-seeded Brassica napus in broiler chickens. Growth performance
was assessed from 3 to 17 days of age. The diets were corn-soybean meal based and contained
either 30% canola meal derived from black- or yellow seeds. The yellow-seeded canola meal
contained more crude protein and less fat, fiber, and glucosinolates than the black-seeded canola
meal (Slominski et al., 2012). No differences among dietary treatments were observed for body
weight gain, feed intake, or the feed-to-gain ratio. The greatest digestibility values for total and
indispensable AA were for diets containing the yellow-seeded canola meal, indicating that
protein from the yellow-seeded canola meal is more digestible than protein from the black-
seeded meal. Additionally, the yellow-seeded canola meal contained the greatest amount of ME
(2,190 vs. 1,904 kcal/kg of diet). Jia et al. (2012) concluded that the yellow-seeded Brassica
napus had superior characteristics in regards to available energy and amino acid content;
however, it is not clear why the broiler chickens fed the yellow-seeded canola meal did not have
superior growth performance over the chickens fed the black-seeded canola meal.
Gopinger et al. (2014) conducted an experiment to compare the effect of different dietary
levels of canola meal on growth performance and nutrient digestibility in broiler chickens from 8
to 35 days of age. Starter diets were used from 8 to 21 days of age followed by a grower diet
from 22 to 35 days. Dietary treatments consisted of canola meal at 0, 10, 20, 30, or 40% as a
substitute for soybean meal. Weight gain and average body weight showed a quadratic response,
decreasing with the addition of 40% canola meal. Apparent nutrient digestibility of DM, CP, and
nitrogen-free extract decreased linearly with increased levels of canola meal. Gopinger et al.
(2014) concluded that canola meal can be fed up to 16.7% in diets for broilers without negatively
12
impacting growth performance, and canola meal can be included up to 20% without negative
effects on the digestibility of CP.
McNaughton et al. (2014) conducted an experiment to compare the use of a genetically
modified, a near-isogenic but not genetically modified, and commercial canola meals on broiler
performance from 1 to 42 days of age. The different canola meals were included at 10% of the
starter diet and at 20% in the grower diet. The CP values of the canola meals derived from
genetically modified canola seeds averaged 48.6% while the CP of the canola meal derived from
non-gentically modified, near-isogenic canola seeds averaged 44.3%. Also, crude fiber content
of the meal from genetically modified canola seeds was lower than the meal derived from non-
genetically modified canola seeds (10.1 vs. 12.0%). All of the dietary treatments were
formulated to be isocaloric and were equal in digestible amino acids for both the starter and
grower phases. No differences were observed among treatments for body weight gain, feed
intake, or mortality for either phase of the experiment. The authors concluded that the meal
derived from genetically modified canola seeds were nutritionally equivalent to meal produced
from non-genetically modified canola seeds.
EFFECTS OF CANOLA MEAL FED TO LAYING HENS
Jackson (1969) studied the toxic effects of rapeseed meal derived from Brassica napus
and its use as a protein supplement in the diets of laying hens. The experimental diets consisted
of 0, 4, 8, 12, 16, or 20% rapeseed meal which was fed to 109 Hyline® light-weight laying hens
for nine 28-day periods starting at 24 weeks of age. The light-weight hens exhibited a high
mortality when fed rapeseed meal in excess of 4% of the diet mainly caused by hemorrhage of
the liver. Mortality for the duration of the trial was 26, 44, 33, and 50% for the levels of 8, 12,
16, and 20% rapeseed meal, respectively. It was also observed that the thyroid weight and liver

13
weight increased linearly with the inclusion of rapeseed meal. Egg production also decreased
when at least 8% rapeseed meal was included in the diet. The author concluded from this study
that the initial effect of the rapeseed thyrotoxins on the thyroid gland are compensated for by
thyroid enlargement and that those birds who survive the initial phase are then capable of normal
physiological function with regard to egg production.
Summers et al. (1971) conducted a similar experiment to obtain information on the
nutritive value of rapeseed meal for laying hens by studying the “toxic factors” at varying levels
of rapeseed meal in the diet. The diets consisted of varying levels of protein obtained by
blending protein sources. All diets contained 5% protein from corn with the remaining dietary
protein coming from either soybean meal, rapeseed meal, or a combination of both. The diets
were formulated so that differences in amino acid composition were due entirely to the two
protein supplements. At the low level of protein (10%), there were no differences in response
due to the type of protein supplement. The authors concluded from this observation that any
toxic effect of rapeseed meal may have been masked due to amino acid deficiencies. It was also
observed that the addition of rapeseed meal resulted in significantly lower egg production, feed
intake, smaller egg size and loss of body weight. In general, the higher the level of rapeseed
meal resulted in decreased egg production and egg weight which is believed to be caused by an
amino acid imbalance because a decrease in production does not usually result in decreased egg
size unless protein is limiting.
March et al. (1975) conduced an experiment to investigate the effects of feeding rapeseed
meal during the growing and/or laying periods on mortality and egg production in laying hens.
White Leghorn pullets were fed soybean or rapeseed meal during either or both the growing
period and laying period in two experiments. In Experiment 1, pullets were reared in batteries
14
from day old to 16 weeks of age. Two starting diets and two growing diets were formulated to
contain soybean meal or rapeseed meal as a supplementary protein source. The starter diets
contained either 11% soybean meal or 17% rapeseed meal while the grower diets contained
either 6% soybean meal or 9.5% rapeseed meal. At 16 weeks of age, the pullets were transferred
to community cages at which point they received the laying diets that contained either 12.5%
soybean meal or 19.6% rapeseed meal. Experiment 2 used the same design as Experiment 1 with
the exception that the birds did not receive the laying diet until 23 weeks of age and treatments
consisted of either 13% soybean meal or 19% rapeseed meal. Egg production was consistently
higher in both experiments when the laying diet contained soybean meal rather than rapeseed
meal and feed efficiency was correspondingly poorer. Hens that received soybean meal during
the growing period and were shifted to laying diets that contained rapeseed meal had the lowest
egg production and the poorest feed efficiency. Liver hemorrhage was the cause of death in 14
birds (5%), all of which were fed rapeseed meal laying diets. March et al. (1975) concluded that
rapeseed meal may cause liver hemorrhage in laying hens; however, the effect was inconsistent
and depended on the level of inclusion, the stage of life of the hen, and possibly the genotype of
the birds.
Smith and Campbell (1976) conducted an experiment to study the effects of rapeseed
meal glucosinolates on the performance of laying hens. Four dietary treatments were fed for
three 28-day periods to Hyline White Leghorn hens. A standard barley-soybean meal diet served
as the control diet. Three sources of rapeseed meal (Bronowski, 1788, and Target) were used in
the experimental diets at an inclusion level of 50%. At the conclusion of the experiment, all
surviving hens were killed and the livers were examined for the presence of non-fatal
hemorrhage. The glucosinolate content of the rapeseed meals were 0.49, 0.34, and 3.62 mg/g for
15
Bronowski, 1788, and Target, respectively. No significant differences were observed among the
treatments in average weight gain or feed consumption; however, hens fed Target rapeseed meal
had lower egg production (P<0.05) than hens fed 1788 or Bronowski rapeseed meals. No
differences in egg production were observed among the groups fed 1788 or Bronowski; however,
the hens fed the control diet had higher egg production (P<0.05) than all other dietary treatments.
There were also no significant differences observed among treatments in the frequency of fatal or
non-fatal liver hemorrhaging.
Leeson et al. (1987) conducted an experiment to investigate the effects of replacing
dietary soybean meal with canola meal in the diets of laying hens with emphasis on efficiency of
mineral utilization. The dietary treatments consisted of 0, 25, 50, or 100% replacement of
soybean meal with canola meal which equated to canola meal levels at 0, 6.32, 12.64, and
25.28% of the diet, respectively. Dietary treatment had no effect on feed intake (P>0.05) even
though the birds fed diets with supplemental canola meal were numerically heavier than those
fed the control diet. This study also observed no effect of the dietary treatments on egg
production, egg weight, and eggshell deformation. Leeson et al. (1987) also observed no
differences among dietary treatments for nutrient retention and bone mineralization and
concluded that canola meal can totally replace soybean meal without any adverse effects on
performance, nutrient retention or mineral metabolism in the diets of laying hens.
Campbell et al. (1999) conducted two experiments to evaluate the nutritional value of
low-glucosinolate canola meal for laying hens. The first study compared a low-glucosinolate
canola meal to a commercial canola meal and a control diet (no canola meal) for a 5 month
period while the second experiment used diets that varied in glucosinolate concentrations among
the canola meals. Production performance as well as organ weights, thyroid hormone levels, and

16
liver enzyme levels were measured to assess the treatment effects. Aside from the control diet,
dietary treatments consisted of either 10 or 20% inclusion of either low-glucosinolate or
commercial canola meal. The glucosinolate content of the low-glucosinolate canola meal was
1.80 F mol/g which is substantially lower than the commercial canola meal (10 – 15 F mol/g).
No differences were observed among dietary treatments for egg production, feed efficiency, or
mortality. The author also observed no differences among dietary treatments for thyroid weight,
liver weight, thyroid hormone levels, or liver enzyme levels. Campbell et al. (1999) concluded
that the low-glucosinolate canola meal may be used in laying hen diets based on its nutritive
value in comparison to other protein sources with no need for an upper-limit constraint.
CONCLUSIONS
It has been shown that canola meals produced from some new varieties of canola seeds
have greater crude protein and decreased fiber content and glucosinolates compared to
conventional canola meal. These improvements through genetic breeding indicate that the
feeding value of canola meal can potentially be improved for poultry and other nonruminant
animals. For example, canola meal produced from yellow-seeded canola not only has increased
protein and reduced fiber, it also has higher levels of methionine than soybean meal which
further adds to its potential value in poultry diets since methionine is usually the first limiting
amino acid. However, canola meal has lower concentrations of lysine than soybean meal which
leads to the frequent necessity of more synthetic lysine being added to the diets for both broiler
chickens and laying hens. The effects of rapeseed meal on the growth and performance of
broiler chickens and laying hens has been well documented; however, more research is needed to
investigate the effects of new high-protein canola meals. Research is also needed to evaluate the
effect of feeding high-protein, reduced fiber canola meal compared with conventional canola
17
meal in poultry diets. Therefore, the objective of this thesis was to evaluate the feeding of
several increasing levels of a new high protein, reduced fiber canola meal to broiler chickens and
laying hens when all diets are formulated to be equal in ME and digestible amino acids.

18
LITERATURE CITED
Aukema, H., and L. Campbell. 2011. Oil nutrition and utilization. In: J. K. Daun, N. A. M.
Eskin, and D. Hickling, editors, Canola: Chemistry, production, processing, and
utilization. AOCS Press, Urbana, IL. p. 245-280.
Barthet, V. J., and J. K. Daun. 2011. Seed morphology, composition, and quality. Pages 125-
145 in Canola: Chemistry, Production, Processing, and Utilization. J. K. Daun, N. A. M.
Eskin, D. Hickling, eds. AOCS Press, Urbana, IL.
Bell, J. M. 1993. Factors affecting the nutritional value of canola meal: A review. Can. J. Anim.
Sci. 73:679-697.
Bonnardeaux, J. 2007. Uses for canola meal. Available at:
http://www.agric.wa.gov.au/objtwr/imported_assets/content/sust/biofuel/usesforcanolame
al_report.pdf Accessed Jan. 28, 2015.
Campbell, L. D., B. A. Slominski, K. C. Falk, & Y. Wang. 1999. Low-glucosinolate canola in
laying hen diets. Mortality (LH/total), 1(1.87), 1-88.
Downey, R. K., and J. M. Bell. 1990. New developments in canola research. In: F. Shahidi,
editor, Canola and rapeseed: Production, chemistry, nutrition and processing technology.
Springer US, New York. p. 37-46.
Fenwick, G. R., and R. F. Curtis. 1980. Rapeseed meal and its use in poultry diets. A review.
Anim. Feed Sci. Technol. 5:255-298.
Fenwick, G. R., C. Curl, A. W. Pearson, and E. J. Butler. 1984. The treatment of rapeseed
meal and its effect on chemical composition and egg tainting potential. J. Sci. Food
Agric. 35:757-761.
19
Gopinger, E., E. G. Xavier, M. C. Elias, A. A. S. Catalan, M. L. S. Castro, A. P. Nunes, and V.
F. B. Roll. 2014. The effect of different dietary levels of canola meal on growth
performance, nutrient digestibility, and gut morphology of broiler chickens. Poult. Sci.
93:1130-1136.
Jackson, N. 1969. Toxicity of rapeseed meal and its use as a protein supplement in the diet of
two hybrid strains of caged laying hens. J. Sci. Fd Agric., 1969, Vol. 20, December.
Jansman, A. J. M. 1993. Tannins in feedstuffs for simple-stomached animals. Nutr. Res. Rev.
6:209-236.
Jia, W., D. Mikulski, A. Rogiewicz, Z. Zdunczyk, J. Jankowski, and B. A. Slominski. 2012.
Low-fiber canola. Part 2. Nutritive value of the meal. J. Agric Food Chem. 60: 12231-
12237.
Khajali, F., and B. A. Slominski. 2012. Review: Factors that affect the nutritive value of canola
meal for poultry. Poult. Sci. 91:2564-2575.
Kozlowska, H., M. Naczk, F. Shahidi, and R. Zadernowski. 1990. Phenolic acids and tannins in
rapeseed and canola. Page 193-210 in Canola and Rapeseed: Production, Chemistry,
Nutrition, and Processing Technology. F. Shahidi, ed. Van Nostrand Reinhold, New
York, NY.
Leeson, S., J. O. Atteh, and J. D. Summers. 1987. The replacement value of canola meal for
soybean meal in poultry diets. Can. J. Anim. Sci. 67:151-158.
Mailer, J. R. 2004. Canola meal: Limitations and opportunities. Available at:
http://www.australianoilseeds.com/__data/assets/pdf_file/0015/1275/RIRDC_report_on_
protein_meal_2002.pdf Accessed Jan. 28, 2015.
20
Mansoori, B., and T. Acamovic. 2007. The effect of tannic acid on the excretion of endogenous
methionine, histidine and lysine with broilers. Anim. Feed Sci. Technol. 134:198-210.
March, B. E., J. Biely, and R. Soong. 1975. The effects of rapeseed meal fed during the growing
and/or laying periods on mortality and egg production in chickens. J. Poult. Sci.
54:1875-1882.
McNaughton, J., M. Roberts, D. Rice, B. Smith, B. Hong, B. Delaney, and C. Iiams. 2014.
Comparison of broiler performance and carcass yields when fed diets containing
genetically modified canola meal from event DP-Ø73496-4, near-isogenic canola meal,
or commercial canola meals. J. Poult. Sci. 93:1-11.
Min, Y., Z. Wang, C. Coto, F. Yan, S. Cerrate, F. Liu, and W. Waldroup. 2011. Evaluation of
canola meal from biodiesel production as a feed ingredient for broilers. Int. J. Poult. Sci.
10:782-785
Mushtaq, T., M. Sarwar, G. Ahmad, M. A. Mirza, H. Nawaz, M. M. Haroon Mushtaq, and U.
Noreen. 2007. Influence of canola meal-based diets supplemented with exogenous
enzyme and digestible lysine on performance, digestibility, carcass, and immunity
responses of broiler chickens. Poult. Sci. 86:2144-2151.
Newkirk, R. W., and H. L. Classen. 2002. The effects of toasting canola meal on body weight,
feed conversion efficiency, and mortality in broiler chickens. Poult. Sci. 81: 815-825.
Newkirk, R. 2009. Canola meal. Feed Industries Guide, 4th edition. Canadian International
Grains Institute, Winnipeg, Manitoba.
NRC. 2012. Nutrient requirements of swine. 11th
rev. ed. Natl. Acad. Press, Washington, DC.
21
Nwokolo, E. N., and D. B. Bragg. 1977. Influence of phytic acid and crude fibre on the
availability of minerals from four protein supplements in growing chicks. Can. J. Anim.
Sci. 57:475-477.
Perez-Maldonado, R. A. 2002. Characterisation of canola meal and cotton seed meal at practical
inclusion levels for use in broiler and layer diets. Available at:
http://www.australianoilseeds.com/_data/assets/pdf_file/0015/1275/RIRDC_report_on_pr
otein_meal_2002.pdf Accessed Mar. 9, 2015.
Selle, P. H., A. J. Cowieson, and V. Ravindran. 2009. Consequences of calcium interactions
with phytate and phytase for poultry and pigs. Livest. Sci. 124:126-141.
Simbaya, J., B. A. Slominski, G. Rakow, L. D. Campbell, R. K. Downey, and J. M. Bell. 1995.
Quality characteristics of yellow-seeded Brassica seed meals: protein, carbohydrates, and
dietary fiber components. J. Agric. Food Chem. 43:2062-2066.
Simons, P. C. M., H. A. J. Versteegh, A. W. Jongbloed, P. A. Kemme, P. Slump, K. D. Bos, M.
G. E. Wolters, R. F. Beudeker, and G. J. Verschoor. 1990. Improvement of phosphorus
availability by microbial phytase in broilers and pigs. Br. J. Nutr. 64:525-540.
Slominski, B. A., L. D. Campbell, and W. Guenter. 1994. Carbohydrates and dietary fiber
components of yellow- and brown-seeded canola. J. Agric. Food Chem. 42:704-707.
Slominski, B. A., J. Simbaya, L. D. Campbell, G. Rakow, and W. Guenter. 1999. Nutritive
value for broilers of meals derived from newly developed varieties of yellow-seeded
canola. Anim. Feed Sci. Technol. 78:249-262.
Slominski, B. A., W. Jia, A. Rogiewicz, C. M. Nyachoti, and D. Hickling. 2012. Low-fiber
canola. Part 1. Chemical and nutritive composition of the meal. J. Agric. Food Chem.
60:12225-12230.
22
Smith, T. K., and L. D. Campbell. 1976. Rapeseed meal glucosinolates: metabolism and effect
on performance in laying hens. J. Poult. Sci. 55:861-867.
Spragg, J. C., and R. J. Mailer. 2007. Canola meal value chain quality improvement: A final
report prepared for AOF and CRC. Project code: 1B-103-0506. Available at:
http://www.porkcrc.com.au/Final_Report_1B-103.pdf Accessed Jan. 28, 2015.
Summers, J. D., G. Rajaratnam, and W. F. Pepper. 1971. Evaluation of rapeseed meal as a
protein supplement for laying hen diets. J. Poult. Sci. 50:1382-1386.
Thacker, P. A., and D. Petri. 2011. Nutritional evaluation of canola protein concentrate for
broiler chickens. Asian-australas. J. Anim. Sci. 24:1607-1614
Ward, A. K., H. L. Classen, and F. C. Buchanan. 2009. Fishy-egg tainting is recessively inherited
when brown-shelled layers are fed canola meal. Poult. Sci. 88:714-721.
23
CHAPTER 3
NUTRITIONAL EVALUATION OF CONVENTIONAL AND HIGH-PROTEIN
CANOLA MEAL FED TO BROILER CHICKENS
ABSTRACT
Four precision-fed rooster experiments and two broiler chicken experiments were conducted to
evaluate the nutritional value and the feeding of increasing dietary levels of conventional canola
meal (Conv CM) and a new increased protein: reduced fiber test CM. The test CM contained
higher levels of MEn and digestible amino acids than the Conv CM as determined in the rooster
assays. All diets in the two broiler experiments were then formulated to be equal in MEn and
digestible amino acids based on the values from the precision-fed rooster assays. The first broiler
experiment evaluated a Conv CM in broiler chicken diets from 2 to 37 days of age. Treatments
were replicated eight times using five chickens per replicate. Treatment diets were corn and
soybean meal based and contained 0, 10, 20, 30 or 40% Conv CM from 2 to 21 d of age and 0,
10, 20 or 30% Conv CM from 21-37 d of age. In the starter phase (d 2-21), there was a
significant negative effect (P<0.05) on weight gain and feed intake for CM levels in excess of
10%. The second broiler experiment evaluated both Conv CM and the new increased protein:
reduced fiber test CM. Seven treatments were replicated eight times using five chickens per
replicate. For the starter phase (2 to 19 d), the Treatment 1 diet contained no CM, Treatment 2-4
diets contained 8% Test CM and Treatment 5-7 diets contained 8% Conv CM. At Day 20, the
chicks were switched to grower diets which contained either no CM or 8, 16, or 24% of test CM
(Diets 2 – 4) or the same levels of Conv CM (Diets 5 – 7). These diets were fed until 44 d of
age. There were no significant differences among dietary treatments in weight gain, feed intake,
24
or feed efficiency for either phase of the experiment. The results of this study indicate that the
new test CM has increased nutritional value compared to Conv CM and that up to 30% of either
type of CM can be fed to broiler chickens during the grower phase if diets are formulated to be
equal in MEn and digestible amino acids.
Key words: Test CM, Conv CM, broiler chicken, precision-fed rooster assay, MEn
INTRODUCTION
Inclusion levels of canola meal (CM) in diets for poultry have often been limited in the
past. The major reason for the latter is the anti-nutritional factors in the CM. The main factors
have been glucosinolates and fiber which reduce the value of the meal for nonruminant animals.
The presence of glucosinolates has been shown to result in reduced growth performance, reduced
feed intake, enlarged thyroids, and mortality in broilers (Khajali and Slominski, 2012; Fenwick
and Curtis, 1980). Feed ingredients with high fiber content have been shown to have decreased
energy value and may also decrease digestibility of various minerals for poultry (Nwokolo and
Bragg, 1977; Bell, 1993). The agricultural industry has developed breeding programs for CM to
reduce these anti-nutritional factors. New yellow-seeded (Brassica napus) varieties contain
lower levels of glucosinolates and fiber as well as having higher levels of protein (Simbaya et al.,
1995; Slominski et al., 1999; Slominski et al., 2012). The new yellow-seeded varieties have a
larger seed and thinner hull, than their traditional black-seeded relatives Brassica napus (Khajali
and Slominski, 2012). With a thinner hull, there is a reduction in fiber which may increase the
digestibility for broiler chickens. The yellow-seeded varieties have not been used substantially
in animal diets because of their inherent agronomic problems (Rakow et al., 2007). Recently, a
new test high protein: low fiber canola seed has been developed. Therefore, the objective of this
25
study was to evaluate a new test higher-protein, reduced fiber CM produced from the newly
developed canola seeds in the diets of broiler chicks.
MATERIALS AND METHODS
All animal procedures were approved by the University of Illinois Institutional Animal
Care and Use Committee (IACUC).
Diets and Experimental Design
Four precision-fed rooster assays (Kim et al., 2010) were conducted to determine TMEn
and digestible amino acid concentrations for the conventional CM, high protein test CM and the
soybean meals used in the broiler experiments. The TMEn values were determined in
conventional roosters and the digestible amino acid values were determined in cecectomized
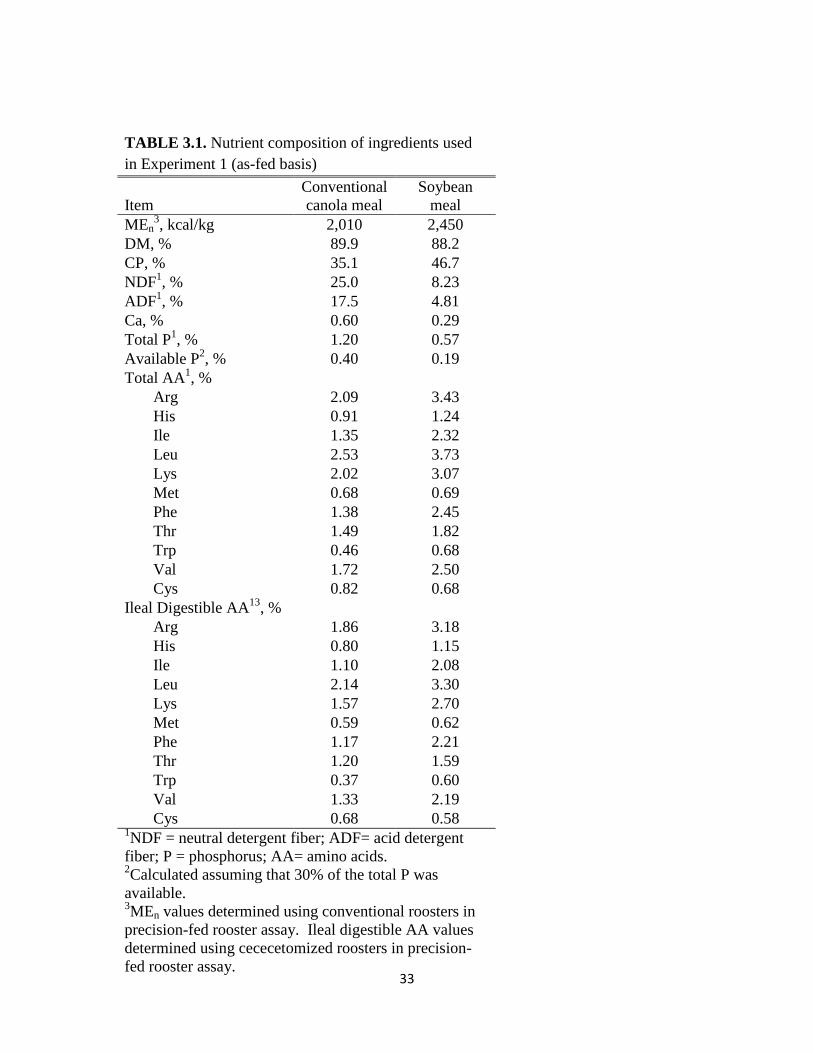
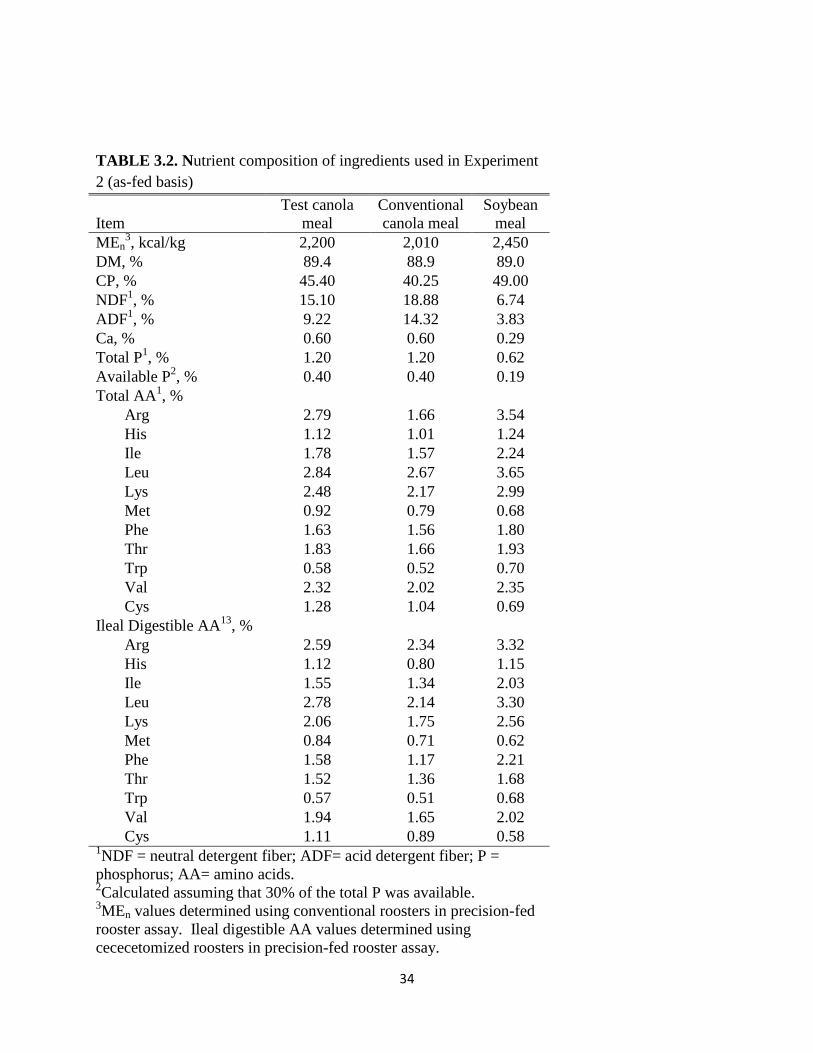
roosters. The composition of the CM and soybean meals are shown in Tables 3.1 and 3.2. Two
additional experiments were conducted to evaluate the nutritional value of CM in broiler chicken
diets. The first broiler experiment evaluated increasing levels of conventional CM to provide
input for the treatments to evaluate in the second experiment. The first experiment used 200
Ross 308 males which were randomly assigned to one of five dietary treatments from 2 to 19 d
of age in which chicks were fed diets containing 0, 10, 20, 30 or 40% conventional CM. The
chickens were then fed diets containing 0, 10, 20 or 30% conventional CM during the grower
phase (20 to 37 d). The dietary treatment that included 40% CM was not included during the
grower phase due to limited grower battery space. The second experiment used 280 Ross 308
males which were randomly assigned to one of seven dietary treatments from 2 to 42 d of age.
These treatments consisted of 0 or 8% test or conventional CM in the starter phase (2 to 19 d)
and 0, 8, 16, or 24% test or conventional CM in the grower phase (20 to 44 d). At the initiation
of each experiment, chicks were weighed, wing banded, and allotted to their dietary treatments
26
via a complete randomized design so that each pen had a similar mean initial body weight.
There were 5 chicks per pen and 8 replicate pens per treatment. During the experiments, chicks
were housed in thermostatically-controlled Petersime starter batteries with raised-wire flooring in
an environmentally controlled room with continuous lighting. Experimental diets and water
were available ad libitum for the duration of the experiments. Feed intake per pen was recorded
and final body weight of each chick was recorded at the conclusion of the experiment. Data
were then summarized to calculate weight gain, feed intake, and gain: feed ratio.
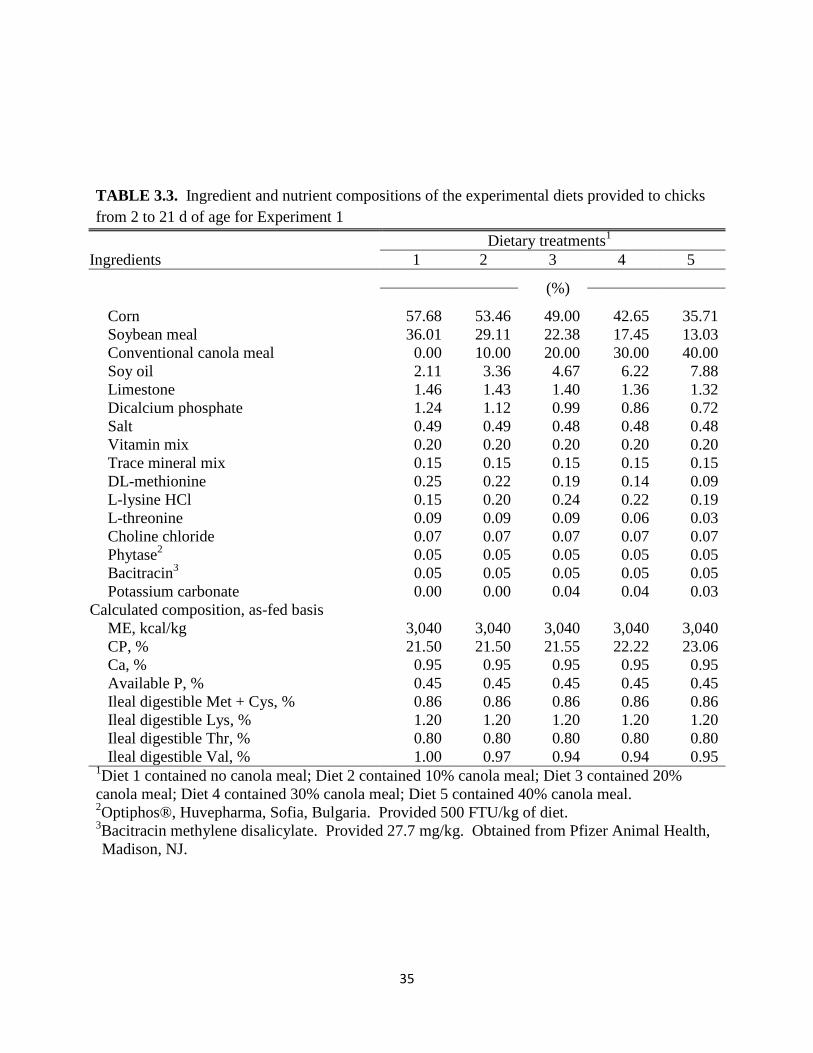
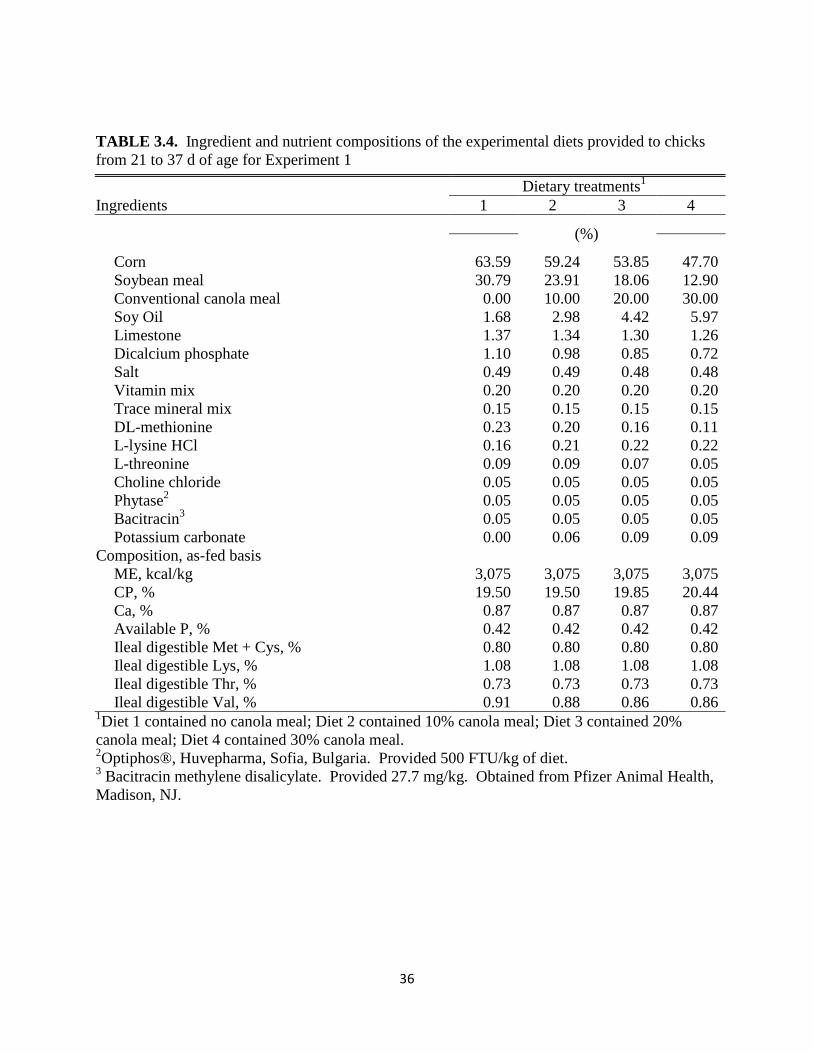
The composition of each diet for the first broiler experiment is provided in Table 3.3 for
the starter phase and in Table 3.4 for the grower phase. The composition of the diets for
Experiment 2 is provided in Table 3.5 for the starter phase and Table 3.6 for the grower phase.
All diets were formulated to be equal in MEn, digestible amino acids, Ca and available P using
the ingredient compostion values shown in Table 3.1. The MEn values were calculated based on
the TMEn values determined in the precision-fed conventional rooster assays and the digestible
amino acid values were determined in the precision-fed cecectomized rooster assays and table
values for corn (National Research Council, 1994).
Nutrient Analysis
Ingredients were analyzed for GE using bomb calorimetry (Model 6300; Parr
Instruments, Moline, IL), CP by combustion (Method 990.03; AOAC International, 2007) using
a Rapid N Cube (Elementar Americas Inc, Mt. Laurel, NJ) with Asp as the standard, and ash
(Method 942.05; AOAC International, 2007). Ingredients were also analyzed for ADF (Method
973.18, AOAC International, 2007), NDF (Holst, 1973), and amino acids (Method 982.30 E [a,
b, and c]; AOAC International, 2007). Ingredient samples were also analyzed for DM by forced
air oven drying for 2 h at 135°C (Method 930.15; AOAC International, 2007), Ca and P using
27
inductively coupled plasma spectroscopy (Method 985.01 A, B, and C; AOAC International,
2007) after wet ashing (Method 975.03 B[b]; AOAC International, 2007).
Statistical Analysis
All data were analyzed by analysis of variance procedures for a one-way completely
randomized design using PROC GLM of SAS® (SAS Institute Inc., Cary, NC). Statistical
significance was determined at P<0.05. When a statistical significance in the model was present,
Fisher’s Least Significant Difference means separation test was used.
RESULTS AND DISCUSSION
In Experiment 1, the growth performance results are shown in Table 3.7 for the starter
phase and Table 3.8 for the grower phase. There was a significant reduction in weight gain and
feed intake at CM levels greater than 10% inclusion in the diet in the starter phase (2 to 21 d).
However, there were no significant differences among treatments for gain:feed ratio indicating
that the primary cause of the reduced weight gain was reduced feed intake. In the grower phase
(21 to 37 d), there were no significant differences at P<0.05 in weight gain, feed intake, or
gain:feed among dietary treatments. However, the effect of CM level approached significance
(P= 0.066) for weight gain, primarily due to the large reduction in weight gain at 30% CM.
The results of Experiment 1 led to the experimental design of Experiment 2. The
significantly reduced growth performance of the chicks in Experiment 1 with CM exceeding
10% of the diet in the starter phase carried over into the grower phase. Due to the large growth
depression at the higher levels of CM in the starter phase, the chickens had reduced performance
throughout the remainder of the trial. Because of the adverse effects at high levels of CM in
Experiment 1, it was decided to limit the inclusion of canola meal in the starter phase of
Experiment 2 to 8%. When the CM inclusion in the starter phase was limited to 8%, no adverse
28
effects on performance were observed from either test or conventional CM (Table 3.9). In
addition, no significant differences were observed from feeding, 8, 16, or 24% of test CM or
conventional CM during the grower phase (Table 3.10) or for the entire experiment (2 – 44
d)(Table 3.11).
Batal and Parsons (2002) showed that MEn and AA digestibility of corn-CM diets
increase with age for young chicks between 0 and 14 d of age. This is one possible explanation
of why the chicks fed the high levels of CM in Experiment 1 had reduced growth and feed intake
when compared to the chicks in Experiment 2. Another study concluded that AMEn values vary
significantly among expeller-extracted CM samples and that the fiber components may have a
considerable effect on AMEn value (Toghyani et al., 2014). These findings could also be an
explanation why the chickens in Experiment 1 had reduced growth and performance and the
chickens in Experiment 2 did not.
The results of studies evaluating the feeding of increasing or high levels of CM have not
been consistent. In the current study, CM levels of 20% or higher could not be fed during the
starter phase without depressing growth. Mushtaq et al. (2007) found similarly reduced body
weight gain, feed conversion, and increased mortality in broiler chicks when 30% CM was added
to the diets during 1 to 21 days of age. Results of another study indicated that CM can be added
up to 16.7% in the diet without affecting growth performance of broiler chickens from 0 to 35 d
of age and up to 20% without any negative effect on the CP digestibility; however, a decrease in
digestibility of DM and nitrogen-free extract at levels exceeding 20% inclusion was observed
(Gopinger, 2014). Only a few studies have been conducted to evaluate the replacement value of
CM for soybean meal in diets for broiler chickens. Newkirk and Classen (2002) studied the
effects of traditional toasted CM versus nontoasted CM as a replacement for soybean meal at

29
varying levels in diets of broiler chickens. Results of their study indicated that nontoasted CM
improved broiler growth and feed efficiency at levels of 0 to 24% from 0 to 39 d of age
compared to toasted CM and further concluded that nontoasted CM could be effectively fed to
broiler chickens. Similarly, Leeson et al. (1987) showed that CM can replace 100% of the
soybean meal in broiler diets from 0 to 21 d of age without any significant effect on feed intake,
weight gain or feed efficiency as well as protein, fat, calcium, phosphorus or magnesium
retention and energy utilization. Jia et al. (2012) fed 30% CM that was derived from either
yellow-seeded Brassica napus or black-seeded Brassica napus canola seeds to broiler chickens
from 3 to 17 d of age. Although the broiler chickens that were fed canola meal derived from
yellow-seeded Brassica napus had better energy utilization than the birds fed black-seeded CM,
there were no observed differences in growth performance.
As can be seen in Table 3.2, the test CM had greater nutritional value than that of the
conventional CM. The test CM had lower fiber values of 15.1 and 9.2% for neutral detergent
fiber and acid detergent fiber, respectively, compared to 25.0 and 17.5% for the conventional
CM used in Experiment 2. Additionally, the test CM had higher CP levels than the conventional
CM (45 vs. 40%) as well as greater levels of digestible amino acids. Due to the superior quality
of the test CM, less soybean meal can be used in the diets of broiler chickens while still
maintaining growth performance which has economic benefits. Because soybean meal is
typically a more expensive feed ingredient, using CM as its replacement can lower feed costs.
Additionally, the use of synthetic methionine would decrease when replacing soybean meal with
CM; however, synthetic lysine supplementation would increase but L-lysine HCl is typically less
expensive than DL-methionine. In conclusion, the new high protein, reduced fiber canola meal
can be included up to at least 8% in broiler starter diets and up to 24% in grower diets without
30
any adverse effects on body weight gain, feed intake, feed efficiency and mortality when the
diets are formulated to be equal in ME and digestible amino acids.
LITERATURE CITED
AOAC International. 2007. Official methods of analysis. 18th
ed. Rev. 2. AOAC Int.,
Gaithersburg, MD.
Batal, A. B., and C. M. Parsons. 2002. Effects of age on nutrient digestibility in chicks fed
different diets. Poult. Sci. 81:400-407.
Bell, J. M. 1993. Factors affecting the nutritional value of canola meal: A review. Can. J. Anim.
Sci. 73:679-697.
Fenwick, G. R., and R. F. Curtis. 1980. Rapeseed meal and its use in poultry diets. A review.
Anim. Feed Sci. Technol. 5:255-298.
Gopinger, E., E. G. Xavier, M. C. Elias, A. A. S. Catalan, M. L. S. Castro, A. P. Nunes, and V.
F. B. Roll. 2014. The effect of different dietary levels of canola meal on growth
performance, nutrient digestibility, and gut morphology of broiler chickens. Poult. Sci.
93:1130-1136.
Holst, D. O. 1973. Holst filtration apparatus for Van Soest detergent fiber analysis. J. AOAC Int.
56:1352-1356.
Jia, W., D. Mikulski, A. Rogiewicz, Z. Zdunczyk, J. Jankowski, and B. A. Slominski. 2012.
Low-fiber canola. Part 2. Nutritive value of the meal. J. Agric Food Chem. 60: 12231-
12237.
Khajali, F., and B. A. Slominski. 2012. Review: Factors that affect the nutritive value of canola
meal for poultry. Poult. Sci. 91:2564-2575.
31
Kim, E. J., C. M. Parsons, R. Srinivasan, and V. Singh. 2010. Nutritional composition,
nitrogen-corrected true metabolizable energy, and amino acid digestibilities of new corn
distillers dried grains with solubles produced by new fractionation processes. J. Poult.
Sci. 89:44-51.
Leeson, S., J. O. Atteh, and J. D. Summers. 1987. The replacement value of canola meal for
soybean meal in poultry diets. Can. J. Anim. Sci. 67: 151-158
Mushtaq, T., M. Sarwar, G. Ahmad, M. A. Mirza, H. Nawaz, M. M. Haroon Mushtaq, and U.
Noreen. 2007. Influence of canola meal-based diets supplemented with exogenous
enzyme and digestible lysine on performance, digestibility, carcass, and immunity
responses of broiler chickens. Poult. Sci. 86:2144-2151.
NRC. 1994. Nutrient requirements of poultry. 9th
rev. ed. National Academy Press.
Washington, DC.
Newkirk, R. W., and H. L. Classen. 2002. The effects of toasting canola meal on body weight,
feed conversion efficiency, and mortality in broiler chickens. Poult. Sci. 81:815-825.
Nwokolo, E. N., and D. B. Bragg. 1977. Influence of phytic acid and crude fibre on the
availability of minerals from four protein supplements in growing chicks. Can. J. Anim.
Sci. 57:475-477.
Rakow, G., J. A. Relf-Eckstein, and J. P. Raney. 2007. Rapeseed genetic research to improve its
agronomic performance and seed quality. HELIA. 30:199-206.
Simbaya, J., B. A. Slominski, G. Rakow, L. D. Campbell, R. K. Downey, and J. M. Bell. 1995.
Quality characteristics of yellow-seeded Brassica seed meals: protein, carbohydrates, and
dietary fiber components. J. Agric. Food Chem. 43:2062-2066.
32
Slominski, B. A., J. Simbaya, L. D. Campbell, G. Rakow, and W. Guenter. 1999. Nutritive value
for broilers of meals dervde from newly developed varieties of yellow-seeded canola.
Anim. Feed Sci. Technol. 78:249-262.
Slominski, B. A., W. Jia, A. Rogiewicz, C. M. Nyachoti, and D. Hickling. 2012. Low-fiber
canola. Part 1. Chemical and nutritive composition of the meal. J. Agric. Food Chem.
60:12225-12230.
Toghyani, M., N. Rodgers, M. R. Barekatain, P. A. Iji, and R. A. Swick. 2014. Apparent
metabolizable energy value of expeller-extracted canola meal subjected to different
processing conditions for growing broiler chickens. Poult. Sci. 93:2227-2236.
33
TABLE 3.1. Nutrient composition of ingredients used
in Experiment 1 (as-fed basis)
Item
Conventional
canola meal
Soybean
meal
MEn3, kcal/kg 2,010 2,450
DM, % 89.9 88.2
CP, % 35.1 46.7
NDF1, % 25.0 8.23
ADF1, % 17.5 4.81
Ca, % 0.60 0.29
Total P1, %
1.20 0.57
Available P2, %
0.40 0.19
Total AA1, %
Arg 2.09 3.43
His 0.91 1.24
Ile 1.35 2.32
Leu 2.53 3.73
Lys 2.02 3.07
Met 0.68 0.69
Phe 1.38 2.45
Thr 1.49 1.82
Trp 0.46 0.68
Val 1.72 2.50
Cys 0.82 0.68
Ileal Digestible AA13
, %
Arg 1.86 3.18
His 0.80 1.15
Ile 1.10 2.08
Leu 2.14 3.30
Lys 1.57 2.70
Met 0.59 0.62
Phe 1.17 2.21
Thr 1.20 1.59
Trp 0.37 0.60
Val 1.33 2.19
Cys 0.68 0.58 1NDF = neutral detergent fiber; ADF= acid detergent
fiber; P = phosphorus; AA= amino acids. 2Calculated assuming that 30% of the total P was
available. 3MEn values determined using conventional roosters in
precision-fed rooster assay. Ileal digestible AA values
determined using cececetomized roosters in precision-
fed rooster assay.
34
TABLE 3.2. Nutrient composition of ingredients used in Experiment
2 (as-fed basis)
Item
Test canola
meal
Conventional
canola meal
Soybean
meal
MEn3, kcal/kg 2,200 2,010 2,450
DM, % 89.4 88.9 89.0
CP, % 45.40 40.25 49.00
NDF1, % 15.10 18.88 6.74
ADF1, % 9.22 14.32 3.83
Ca, % 0.60 0.60 0.29
Total P1, %
1.20 1.20 0.62
Available P2, %
0.40 0.40 0.19
Total AA1, %
Arg 2.79 1.66 3.54
His 1.12 1.01 1.24
Ile 1.78 1.57 2.24
Leu 2.84 2.67 3.65
Lys 2.48 2.17 2.99
Met 0.92 0.79 0.68
Phe 1.63 1.56 1.80
Thr 1.83 1.66 1.93
Trp 0.58 0.52 0.70
Val 2.32 2.02 2.35
Cys 1.28 1.04 0.69
Ileal Digestible AA13
, %
Arg 2.59 2.34 3.32
His 1.12 0.80 1.15
Ile 1.55 1.34 2.03
Leu 2.78 2.14 3.30
Lys 2.06 1.75 2.56
Met 0.84 0.71 0.62
Phe 1.58 1.17 2.21
Thr 1.52 1.36 1.68
Trp 0.57 0.51 0.68
Val 1.94 1.65 2.02
Cys 1.11 0.89 0.58 1NDF = neutral detergent fiber; ADF= acid detergent fiber; P =
phosphorus; AA= amino acids. 2Calculated assuming that 30% of the total P was available.
3MEn values determined using conventional roosters in precision-fed
rooster assay. Ileal digestible AA values determined using
cececetomized roosters in precision-fed rooster assay.
35
TABLE 3.3. Ingredient and nutrient compositions of the experimental diets provided to chicks
from 2 to 21 d of age for Experiment 1
Dietary treatments1
Ingredients 1 2 3 4 5
(%)
Corn 57.68 53.46 49.00 42.65 35.71
Soybean meal 36.01 29.11 22.38 17.45 13.03
Conventional canola meal
0.00 10.00 20.00 30.00 40.00
Soy oil 2.11 3.36 4.67 6.22 7.88
Limestone 1.46 1.43 1.40 1.36 1.32
Dicalcium phosphate 1.24 1.12 0.99 0.86 0.72
Salt 0.49 0.49 0.48 0.48 0.48
Vitamin mix 0.20 0.20 0.20 0.20 0.20
Trace mineral mix 0.15 0.15 0.15 0.15 0.15
DL-methionine 0.25 0.22 0.19 0.14 0.09
L-lysine HCl 0.15 0.20 0.24 0.22 0.19
L-threonine 0.09 0.09 0.09 0.06 0.03
Choline chloride 0.07 0.07 0.07 0.07 0.07
Phytase2
0.05 0.05 0.05 0.05 0.05
Bacitracin3
0.05 0.05 0.05 0.05 0.05
Potassium carbonate 0.00 0.00 0.04 0.04 0.03
Calculated composition, as-fed basis
ME, kcal/kg 3,040 3,040 3,040 3,040 3,040
CP, % 21.50 21.50 21.55 22.22 23.06
Ca, % 0.95 0.95 0.95 0.95 0.95
Available P, % 0.45 0.45 0.45 0.45 0.45
Ileal digestible Met + Cys, % 0.86 0.86 0.86 0.86 0.86
Ileal digestible Lys, % 1.20 1.20 1.20 1.20 1.20
Ileal digestible Thr, % 0.80 0.80 0.80 0.80 0.80
Ileal digestible Val, % 1.00 0.97 0.94 0.94 0.95 1Diet 1 contained no canola meal; Diet 2 contained 10% canola meal; Diet 3 contained 20%
canola meal; Diet 4 contained 30% canola meal; Diet 5 contained 40% canola meal. 2Optiphos®, Huvepharma, Sofia, Bulgaria. Provided 500 FTU/kg of diet.
3Bacitracin methylene disalicylate. Provided 27.7 mg/kg. Obtained from Pfizer Animal Health,
Madison, NJ.
36
TABLE 3.4. Ingredient and nutrient compositions of the experimental diets provided to chicks
from 21 to 37 d of age for Experiment 1
Dietary treatments1
Ingredients 1 2 3 4
(%)
Corn 63.59 59.24 53.85 47.70
Soybean meal 30.79 23.91 18.06 12.90
Conventional canola meal
0.00 10.00 20.00 30.00
Soy Oil 1.68 2.98 4.42 5.97
Limestone 1.37 1.34 1.30 1.26
Dicalcium phosphate 1.10 0.98 0.85 0.72
Salt 0.49 0.49 0.48 0.48
Vitamin mix 0.20 0.20 0.20 0.20
Trace mineral mix 0.15 0.15 0.15 0.15
DL-methionine 0.23 0.20 0.16 0.11
L-lysine HCl 0.16 0.21 0.22 0.22
L-threonine 0.09 0.09 0.07 0.05
Choline chloride 0.05 0.05 0.05 0.05
Phytase2
0.05 0.05 0.05 0.05
Bacitracin3
0.05 0.05 0.05 0.05
Potassium carbonate 0.00 0.06 0.09 0.09
Composition, as-fed basis
ME, kcal/kg 3,075 3,075 3,075 3,075
CP, % 19.50 19.50 19.85 20.44
Ca, % 0.87 0.87 0.87 0.87
Available P, % 0.42 0.42 0.42 0.42
Ileal digestible Met + Cys, % 0.80 0.80 0.80 0.80
Ileal digestible Lys, % 1.08 1.08 1.08 1.08
Ileal digestible Thr, % 0.73 0.73 0.73 0.73
Ileal digestible Val, % 0.91 0.88 0.86 0.86 1Diet 1 contained no canola meal; Diet 2 contained 10% canola meal; Diet 3 contained 20%
canola meal; Diet 4 contained 30% canola meal. 2Optiphos®, Huvepharma, Sofia, Bulgaria. Provided 500 FTU/kg of diet.
3 Bacitracin methylene disalicylate. Provided 27.7 mg/kg. Obtained from Pfizer Animal Health,
Madison, NJ.
37
TABLE 3.5. Ingredient and nutrient compositions of the starter diets provided to chicks from 2
to 19 d of age for Experiment 2
Dietary treatments1
Ingredients 1 2-4 5-7
(%)
Corn 58.80 58.04 56.06
Soybean meal
34.97 27.43 28.94
Test canola meal
- 8.00 -
Conventional canola meal - - 8.00
Soy oil 1.93 2.33 2.84
Limestone 1.46 1.45 1.44
Dicalcium phosphate 1.25 1.15 1.15
Salt 0.49 0.46 0.46
Vitamin mix 0.20 0.20 0.20
Trace mineral mix 0.15 0.15 0.15
DL-methionine 0.26 0.20 0.21
L-lysine HCl 0.24 0.28 0.27
L-threonine 0.08 0.08 0.08
K2CO3 0.00 0.05 0.03
Choline chloride 0.07 0.07 0.07
Bacitracin2
0.05 0.05 0.05
Phytase3
0.05 0.05 0.05
Calculated composition, as-fed basis
ME, kcal/kg 3,040 3,040 3,040
CP, % 21.99 21.87 22.04
Calcium, % 0.95 0.95 0.95
Available phosphorus, % 0.45 0.45 0.45
Ileal digestible Met + Cys, % 0.86 0.86 0.86
Ileal digestible Lys, % 1.20 1.20 1.20
Ileal digestible Thr, % 0.80 0.80 0.80
Ileal digestible Val, % 0.92 0.92 0.92 1Diet 1 contained no canola meal; Diets 2-4 contained 8% test canola meal; Diet 5-7 contained
8% conventional canola meal. 2Bacitracin methylene disalicylate. Provided 27.7 mg/kg. Obtained from Pfizer Animal Health,
Madison, NJ. 3Optiphos®, Huvepharma, Sofia, Bulgaria. Provided 500 FTU/kg of diet.
38
TABLE 3.6. Ingredient and nutrient compositions of the experimental diets provided to chicks from
20 to 44 d of age for Experiment 2
Dietary treatments1
Ingredients 1 2 3 4 5 6 7
(%)
Corn 64.60 63.80 62.48 59.75 61.80 59.00 55.40
Soybean meal
29.85 22.32 15.25 9.49 23.83 17.81 12.53
Test canola meal
- 8.00 16.00 24.00 - - -
Conventional canola
meal - - - -
8.00 16.00 24.00
Soy oil 1.52 1.94 2.44 3.13 2.46 3.40 4.45
Limestone 1.37 1.35 1.34 1.31 1.35 1.33 1.30
Dicalcium phosphate 1.11 1.02 0.92 0.82 1.01 0.91 0.81
Salt 0.49 0.46 0.44 0.41 0.46 0.43 0.40
Vitamin mix 0.20 0.20 0.20 0.20 0.20 0.20 0.20
Trace mineral mix 0.15 0.15 0.15 0.15 0.15 0.15 0.15
DL-methionine 0.24 0.17 0.11 0.04 0.19 0.14 0.09
L-lysine HCl 0.25 0.28 0.28 0.29 0.27 0.29 0.30
L-threonine 0.07 0.08 0.08 0.06 0.07 0.07 0.06
K2CO3 0.00 0.08 0.16 0.20 0.06 0.12 0.16
Choline chloride 0.05 0.05 0.05 0.05 0.05 0.05 0.05
Bacitracin2
0.05 0.05 0.05 0.05 0.05 0.05 0.05
Phytase3
0.05 0.05 0.05 0.05 0.05 0.05 0.05
Calculated composition, as-fed basis
ME, kcal/kg 3,075 3,075 3,075 3,075 3,075 3,075 3,075
CP, % 19.90 19.78 19.84 20.38 19.95 20.01 20.33
Calcium, % 0.87 0.87 0.87 0.87 0.87 0.87 0.87
Available phosphorus, % 0.42 0.42 0.42 0.42 0.42 0.42 0.42
Ileal digestible Met + Cys, % 0.80 0.80 0.80 0.82 0.80 0.80 0.80
Ileal digestible Lys, % 1.08 1.08 1.08 1.08 1.08 1.08 1.08
Ileal digestible Thr, % 0.73 0.73 0.73 0.73 0.73 0.73 0.73
Ileal digestible Val, % 0.84 0.84 0.85 0.88 0.84 0.84 0.85 1Diet 1 contained no canola meal; Diet 2 contained 8% test canola meal; Diet 3 contained 16% test
canola meal; Diet 4 contained 24% test canola meal; Diet 5 contained 8% conventional canola meal;
Diet 6 contained 16% conventional canola meal; Diet 7 contained 24% conventional canola meal. 2Bacitracin methylene disalicylate. Provided 27.7 mg/kg. Obtained from Pfizer Animal Health,
Madison, NJ.
3Optiphos®, Huvepharma, Sofia, Bulgaria. Provided 500 FTU/kg of diet.

39
TABLE 3.7. Body weight gain, feed intake and gain:feed for starter phase (2-21 d) for
Experiment 11
Dietary treatments Weight gain Feed intake Gain: feed
(g/chick) (g/chick) (g/kg)
0% Conventional canola meal 687.9a
874.3a
787
10% Conventional canola meal 684.3a
887.8a
772
20% Conventional canola meal 633.2b
823.1b
769
30% Conventional canola meal 617.3bc
793.8bc
769
40% Conventional canola meal 575.6c
748.4c
769
Pooled SEM 15.7 17.3 16.1
P-value <0.0001 <0.0001 0.9170 a-c
Means within a column with no common superscript are significantly different (P<0.05). 1Values represent means of 8 replicate cages containing 5 birds per cage.
.
40
TABLE 3.8. Body weight gain, feed intake and gain:feed for grower phase (21-37 d) for
Experiment 11
Dietary treatments2
Weight gain
Feed intake Gain: feed
(g/chick) (g/chick) (g/kg)
0% Conventional canola meal 1477
2407
616
10% Conventional canola meal 1418
2528
560
20% Conventional canola meal 1432
2426
592
30% Conventional canola meal 1327
2283
583
Pooled SEM 32.4 56.9 15.0
P-value 0.0661 0.1028 0.1863 1Values represent means of 8 replicate cages containing 5 birds per cage.
41
TABLE 3.9. Body weight gain, feed intake and gain:feed for starter phase (2-19 d) in
Experiment 21
Dietary treatments2
Weight gain Feed intake Gain: feed
(g/chick) (g/chick) (g/kg)
0% CM 613.4 803.5 763
8% Test CM 640.5 827.2 775
8% Test CM 614.4 816.6 753
8% Test CM 611.1 818.1 747
8% Conventional CM 612.8 807.7 760
8% Conventional CM 612.9 813.3 753
8% Conventional CM 610.1 811.4 752
Pooled SEM 8.5 11.5 10.9
P-value 0.1075 0.8406 0.6237 1Values represent means of 8 replicate cages containing 5 birds per cage.
2CM= canola meal.
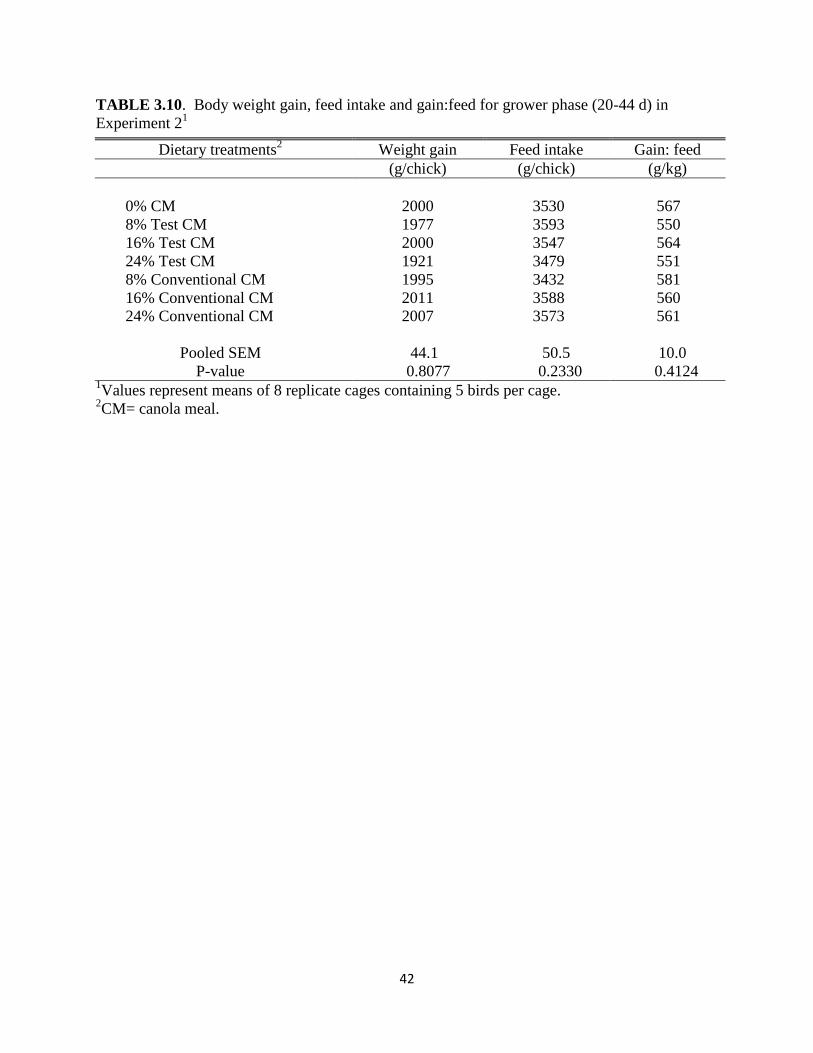
42
TABLE 3.10. Body weight gain, feed intake and gain:feed for grower phase (20-44 d) in
Experiment 21
Dietary treatments2
Weight gain Feed intake Gain: feed
(g/chick) (g/chick) (g/kg)
0% CM 2000 3530 567
8% Test CM 1977 3593 550
16% Test CM 2000 3547 564
24% Test CM 1921 3479 551
8% Conventional CM 1995 3432 581
16% Conventional CM 2011 3588 560
24% Conventional CM 2007 3573 561
Pooled SEM 44.1 50.5 10.0
P-value 0.8077 0.2330 0.4124 1Values represent means of 8 replicate cages containing 5 birds per cage.
2CM= canola meal.
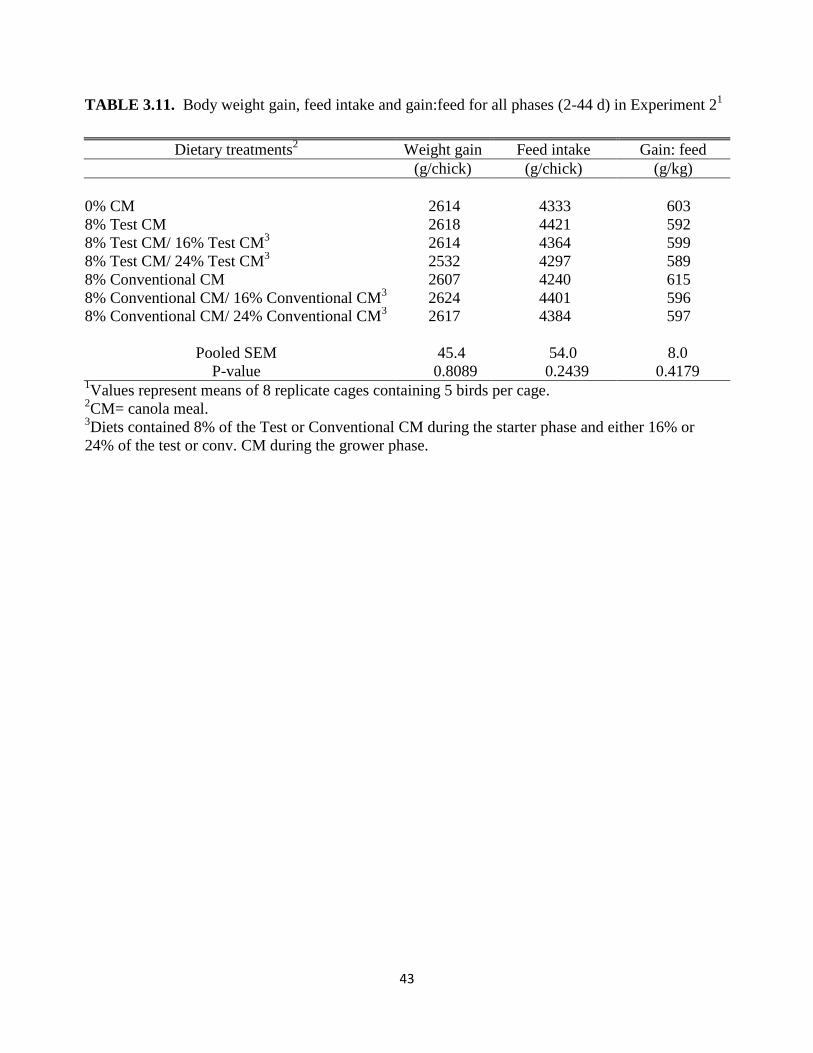
43
TABLE 3.11. Body weight gain, feed intake and gain:feed for all phases (2-44 d) in Experiment 21
Dietary treatments2 Weight gain Feed intake Gain: feed
(g/chick) (g/chick) (g/kg)
0% CM 2614 4333 603
8% Test CM 2618 4421 592
8% Test CM/ 16% Test CM3
2614 4364 599
8% Test CM/ 24% Test CM3
2532 4297 589
8% Conventional CM 2607 4240 615
8% Conventional CM/ 16% Conventional CM3
2624 4401 596
8% Conventional CM/ 24% Conventional CM3
2617 4384 597
Pooled SEM 45.4 54.0 8.0
P-value 0.8089 0.2439 0.4179 1Values represent means of 8 replicate cages containing 5 birds per cage.
2CM= canola meal.
3Diets contained 8% of the Test or Conventional CM during the starter phase and either 16% or
24% of the test or conv. CM during the grower phase.
44
CHAPTER 4
NUTRITIONAL EVALUATION OF CONVENTIONAL AND HIGH-PROTEIN
CANOLA MEAL FED TO LAYING HENS
ABSTRACT
An experiment was conducted to evaluate a new increased protein: reduced fiber test
canola meal compared to conventional canola meal in laying hen diets from 33 to 49 weeks of
age. Seven dietary treatments were replicated eight times using 14 caged hens per replicate.
Corn-soybean meal diets contained either no canola meal or 8, 16, or 24% test canola meal or
conventional canola meal. All diets were formulated to be equal in MEn and digestible amino
acids. No significant differences were observed (P>0.05) among treatments for body weight, egg
production, egg weight, egg mass, feed intake, or feed efficiency when these parameters were
evaluated over the duration of the experiment. These results indicate that diets containing up to
24% test or conventional canola meal can be fed to laying hens without having detrimental
effects on hen performance or egg quality if diets are formulated to be equal in MEn and
digestible amino acids.
Key words: laying hen, test canola meal, conventional canola meal, egg production, egg mass
INTRODUCTION
Canola meal (CM) is a readily available feed ingredient for livestock feeding. However,
in North America, the use of high levels of CM in poultry diets is not prevalent due to past
problems associated with feeding rapeseed meal. Rapeseed meal reduces feed intake (Leslie and
Summers 1972), weight gain (Pekerten and Ergul 1981) and egg production (Leslie and
Summers 1972; Ergun 1983). Jackson (1969) determined that feeding rapeseed meal at levels of
45
up to 20% of the diet produced high mortality as a result of liver hemorrhaging. Summers et al.
(1971) observed that inclusion of rapeseed meal at relatively high levels of 26% in laying hen
diets may be detrimental to the normal physiological function of the hen. However, most of the
work reported above used rapeseed varieties that were high in antinutritional factors such as
erucic acid and goitrogens. The newer varieties of CM do not cause deleterious effects as the
older rapeseed varieties although the ingredient is still rarely used in the diets of brown-shelled
egg layers due to a recessively inherited mutation that causes fishy-egg tainting (Ward et al.,
2009). However, the use of CM rather than rapeseed meal has reduced but not totally eliminated
the liver hemorrhage problem in laying hens (Campbell and Slominski 1991). The results of one
study indicate that there are no negative effects of replacing up to 30% of the dietary soybean
meal with CM in laying hen diets (Albino et al. 1982). In another study that used very low
glucosinolate CM (0.53 µmol/g) in laying hen diets as the sole protein supplement at 24 to 25%
of the diet, a high level of egg production was maintained, which was similar to that obtained
from feeding a soybean meal control diet. Additionally, liver and thyroid sizes remained normal
and mortality due to liver hemorrhage was not observed (Campbell and Slominski, 1991). New
yellow-seeded (Brassica napus) varieties contain lower levels of glucosinolates and fiber as well
as having higher levels of protein (Simbaya et al., 1995; Slominski et al., 1999; Slominski et al.,
2012). The new yellow-seeded varieties have a larger seed and thinner hull, than their traditional
black-seeded relatives Brassica napus (Khajali and Slominski, 2012). The yellow-seeded CM
varieties, however, have not been successful due to their agronomic problems (Rakow et al.,
2007). The current study was undertaken to investigate the effects of a new high protein:
reduced fiber test CM compared to conventional CM on performance and egg quality in laying
hen diets from 33 to 49 weeks of age.
46
MATERIALS AND METHODS
All animal procedures were approved by the University of Illinois Institutional Animal
Care and Use Committee (IACUC).
Diets and Experimental Design
Seven hundred eighty-four Hy-Line® W-36 White Leghorn laying hens were randomly
assigned to one of seven dietary treatments from 33 to 49 weeks of age. The hens were housed
in a completely enclosed, ventilated caged-layer building in which the daily photoperiod was 17
hours of light and 7 hours of dark. The experiment was initiated in December of 2013 and
completed in March of 2014. Hens were assigned to dietary treatments so that mean body
weights were not different for all treatments. Each experimental diet was fed to 8 replicate
groups of 14 hens. A replicate consisted of two adjacent cages of seven hens per cage and each
cage measured approximately 58 x 61 cm. Hens were provided ad libitum access to feed and
water. The composition of each diet is provided in Table 4.1. The first treatment consisted of a
control corn-soybean meal diet with no CM. Treatments 2-4 consisted of the test CM at 8%,
16%, or 24% inclusion in the diet, respectively. Diets 5-7 consisted of conventional CM at 8%,
16%, or 24% inclusion in the diet, respectively. The test CM and conventional CM were the
same as those used in broiler Experiment 2 of Chapter 3. The test CM had a higher ME,
increased crude protein, and reduced fiber compared to that of the conventional CM but both
were lower in energy and crude protein and higher in fiber than soybean meal. The test CM was
also higher in ileal digestible amino acids than the conventional CM. To keep the diets
isocaloric and equal in digestible amino acids, soy oil and synthetic amino acids were used. Soy
oil levels increased as the level of CM increased due to the fact that CM was primarily replacing
47
dietary soybean meal which is higher in energy and protein. In addition, inclusion of synthetic
DL-methionine decreased as CM inclusion increased.
Body weights of the hens were measured at the beginning and end of the experiment.
Egg production and mortality were recorded daily. Egg weight, egg mass (g egg/hen/day), feed
consumption, and feed efficiency (g egg/g feed) were measured every two weeks. Egg specific
gravity was measured using the flotation method every four weeks for all eggs produced by each
replicate group of hens from the previous day. The eggs were submerged in a basket into
varying salt solutions ranging from 1.068 to 1.091 specific gravity. At the end of the experiment,
5 hens from each dietary treatment were randomly selected and euthanized with CO2 gas. The
livers were removed and observed for fatty liver syndrome or liver hemorrhaging.
Statistical Analysis
All data were analyzed by analysis of variance procedures for a one-way completely
randomized design using PROC GLM of SAS® (SAS Institute, 2010). Egg production during
the first two weeks of the experiment for the control diet was found to be 4 percentage units
higher (P<0.05) than that for hens on all other treatments. Therefore, all results were analyzed
using analysis of covariance and all statistical analysis was done on the adjusted means. The egg
production for the first two weeks of the trial was used as the covariate in the statistical model.
RESULTS AND DISCUSSION
Hen performance for the duration of the experiment is shown in Table 4.2. There were
no differences (P>0.05) among treatments for hen-day egg production, egg mass, and feed
efficiency. There were also no differences for feed intake or egg weight among dietary

48
treatments. No differences among treatments for final body weights were observed (Table 4.3).
In addition, dietary treatments had no significant effects on the egg quality measures of Haugh
units and egg specific gravity (Table 4.3).
The results of the this study demonstrated that the production performance of the laying
hens fed diets containing up to 24% CM was not different from that of hens fed a diet containing
no CM. Therefore, CM has the potential to replace soybean meal and corn, primarily soybean
meal, in laying hen diets without the detrimental effects reported previously. For example, the
decrease in feed intake associated with dietary rapeseed and CM (Leslie and Summers 1972;
Clandinin and Robblee 1983) was not seen in this study. The results of the present study,
however, confirm observations of Albino et al. (1982) and Leeson et al. (1987). Leeson et al.
(1987) tested the replacement value of CM for soybean meal in the diets of laying hens. Dietary
CM ranged from 6.32 to 25.28% inclusion in the diet which is similar to the present study.
Leeson et al. (1987) observed no differences among treatments for egg production, egg weight,
eggshell deformation, nutrient retention, or bone mineralization when CM inclusion ranged from
0 to 25% of the diet. Although nutrient retention and bone mineralization were not measured in
the present study, similar results for egg production and egg weight were observed. Campbell et
al. (1999) observed similar results when low-glucosinolate CM was included up to 20% in the
diet for laying hens. No differences were observed among dietary treatments for egg production,
feed efficiency, or mortality. Campbell et al. (1999) also observed no differences for thyroid
weight, liver weight, thyroid hormone levels, or liver enzyme levels and concluded that low-
glucosinolate CM may be used at levels up to 20% in laying hen diets. The results of that study
concerning liver evaluation are quite similar to those observed in the present study. Although no
data were presented in the current study, it should be noted that 5 hens from each dietary
49
treatment were euthanized and necropsied to check the condition of the liver at the end of the
trial. All of the dietary treatments had some degree of fatty liver including the control diet but
there was no observed increase in the severity of fatty liver for hens fed the diets containing
either test or conventional CM. Therefore, it is not assumed the fatty liver was caused by the
inclusion of CM in the present study.
No studies could be found that investigated the effects of feeding high protein: reduced
fiber CM in laying hen diets. Additionally, no studies could be found that compared
conventional CM to the new high-protein test CM. The results of the current study again
document the increased nutritional and economic value of the new test CM compared to the
conventional CM. Due to the higher MEn and digestible amino acid levels in the test CM, diets
containing the test CM had lower levels of supplemental oil and soybean meal than the same
respective diets that contained conventional CM. It is concluded from this study that either test
CM or conventional CM can be included in laying hen diets at levels of 24% or lower without
any detrimental effects on performance, egg quality, or body weight if diets are formulated to be
equal in MEn and digestible amino acids.
50
LITERATURE CITED
Albino, L. F. T., F. T. Michelan, E. T. Fialho, and P. C. Gomes. 1982. Use of rapeseed oil meal
as a substitute for soybean oil meal in rations for broiler chickens. Nutr. Abstr. Tev. 53:
4351.
Campbell, L. D. and B. A. Slominski. 1991. Nutritive quality of low-glucosinolate canola meal
for laying hens. Pages 442 – 447 in Proc. 8th
Int. Rapeseed Congress, Saskatoon, SK.
Campbell, L. D., B. A. Slominski, K. C. Falk, & Y. Wang. 1999. Low-glucosinolate canola in
laying hen diets. Mortality (LH/total), 1(1.87), 1-88.
Clandinin, D. R., and A. R. Robblee. 1983. Canola meal can be good source of high quality
protein for poultry. Feedstuffs 55:36-37.
Ergun, A. 1983. The use of rapeseed meal in layer diets. Nutr. Abstr. Rev. 53:5505.
Jackson, N., 1969. Toxicity of rapeseed meal and its use a protein supplement in the diet of two
hybrid strains of caged laying hens. J. Sci. Food Agr. 20:734-740.
Khajali, F., and B. A. Slominski. 2012. Review: Factors that affect the nutritive value of canola
meal for poultry. Poult. Sci. 91:2564-2575.
Leeson, S., J. O. Atteh, and J. D. Summers. 1987. The replacement value of canola meal for
soybean meal in poultry diets. Can. J. Anim. Sci. 67:151-158.
Leslie, A. J., and J. D. Summers. 1972. Feeding value of rapeseed for laying hens. Can. J. Anim.
Sci. 52:563-566.
Pekerten, B., and M. Ergul. 1981. Rapeseed meal in feeds for chicken. Nutr. Abstr. Rev.
53:1062.
Rakow, G., J. A. Relf-Eckstein, and J. P. Raney. 2007. Rapeseed genetic research to improve its
agronomic performance and seed quality. HELIA. 30:199-206.
51
Simbaya, J., B. A. Slominski, G. Rakow, L. D. Campbell, R. K. Downey, and J. M. Bell. 1995.
Quality characteristics of yellow-seeded Brassica seed meals: protein, carbohydrates, and
dietary fiber components. J. Agric. Food Chem. 43:2062-2066.
Slominski, B. A., J. Simbaya, L. D. Campbell, G. Rakow, and W. Guenter. 1999. Nutritive
value for broilers of meals derived from newly developed varieties of yellow-seeded
canola. Anim. Feed Sci. Technol. 78:249-262.
Slominski, B. A., W. Jia, A. Rogiewicz, C. M. Nyachoti, and D. Hickling. 2012. Low-fiber
canola. Part 1. Chemical and nutritive composition of the meal. J. Agric. Food Chem.
60:12225-12230.
Smith, T. K., and L. D. Campbell. 1976. Rapeseed meal glucosinolates: metabolism and effect
on performance in laying hens. J. Poult. Sci. 55:861-867
Summers, J. D., G. Rajaratnam, and W. F. Pepper. 1971. Evaluation of rapeseed meal as a
protein supplement for laying hen diets. J. Poult. Sci. 50:1382-1386.
Ward, A. K., H. L. Classen, and F. C. Buchanan. 2009. Fishy-egg tainting is recessively
inherited when brown-shelled layers are fed canola meal. Poult. Sci. 88:714-721.
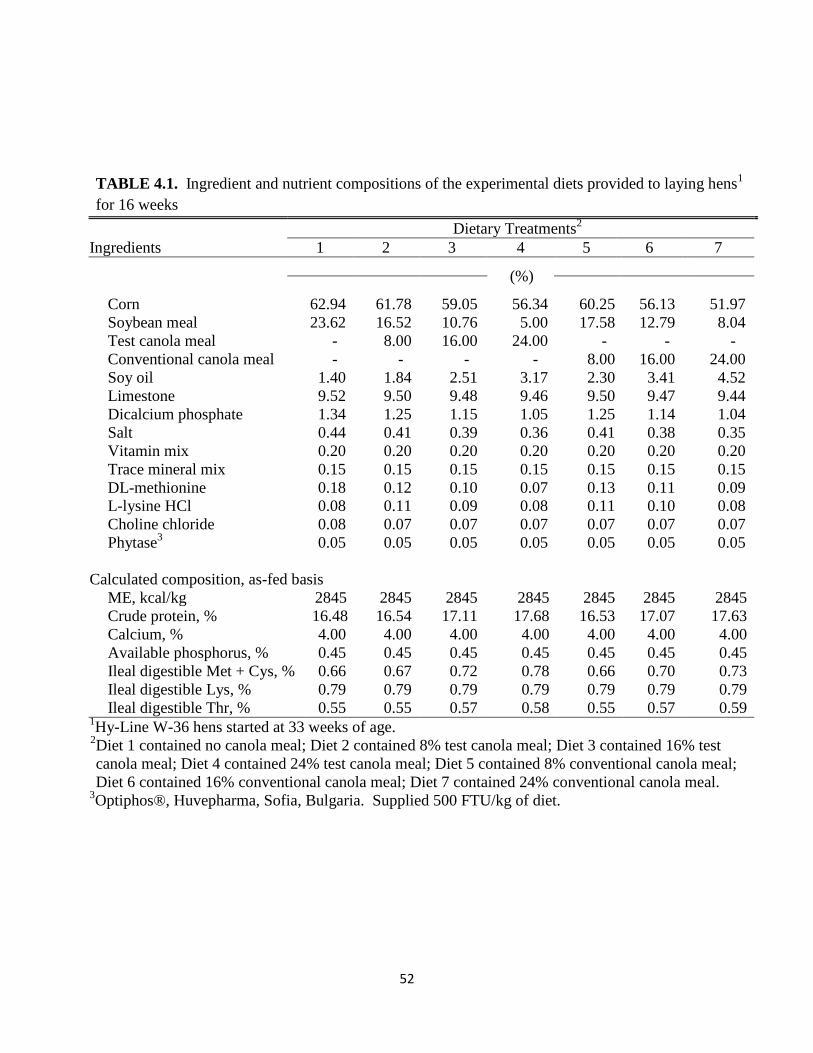
52
TABLE 4.1. Ingredient and nutrient compositions of the experimental diets provided to laying hens1
for 16 weeks
Dietary Treatments2
Ingredients 1 2 3 4 5 6 7
(%)
Corn 62.94 61.78 59.05 56.34 60.25 56.13 51.97
Soybean meal 23.62 16.52 10.76 5.00 17.58 12.79 8.04
Test canola meal - 8.00 16.00 24.00 - - -
Conventional canola meal - - - - 8.00 16.00 24.00
Soy oil 1.40 1.84 2.51 3.17 2.30 3.41 4.52
Limestone 9.52 9.50 9.48 9.46 9.50 9.47 9.44
Dicalcium phosphate 1.34 1.25 1.15 1.05 1.25 1.14 1.04
Salt 0.44 0.41 0.39 0.36 0.41 0.38 0.35
Vitamin mix 0.20 0.20 0.20 0.20 0.20 0.20 0.20
Trace mineral mix 0.15 0.15 0.15 0.15 0.15 0.15 0.15
DL-methionine 0.18 0.12 0.10 0.07 0.13 0.11 0.09
L-lysine HCl 0.08 0.11 0.09 0.08 0.11 0.10 0.08
Choline chloride 0.08 0.07 0.07 0.07 0.07 0.07 0.07
Phytase3
0.05 0.05 0.05 0.05 0.05 0.05 0.05
Calculated composition, as-fed basis
ME, kcal/kg 2845 2845 2845 2845 2845 2845 2845
Crude protein, % 16.48 16.54 17.11 17.68 16.53 17.07 17.63
Calcium, % 4.00 4.00 4.00 4.00 4.00 4.00 4.00
Available phosphorus, % 0.45 0.45 0.45 0.45 0.45 0.45 0.45
Ileal digestible Met + Cys, % 0.66 0.67 0.72 0.78 0.66 0.70 0.73
Ileal digestible Lys, % 0.79 0.79 0.79 0.79 0.79 0.79 0.79
Ileal digestible Thr, % 0.55 0.55 0.57 0.58 0.55 0.57 0.59 1Hy-Line W-36 hens started at 33 weeks of age.
2Diet 1 contained no canola meal; Diet 2 contained 8% test canola meal; Diet 3 contained 16% test
canola meal; Diet 4 contained 24% test canola meal; Diet 5 contained 8% conventional canola meal;
Diet 6 contained 16% conventional canola meal; Diet 7 contained 24% conventional canola meal. 3Optiphos®, Huvepharma, Sofia, Bulgaria. Supplied 500 FTU/kg of diet.
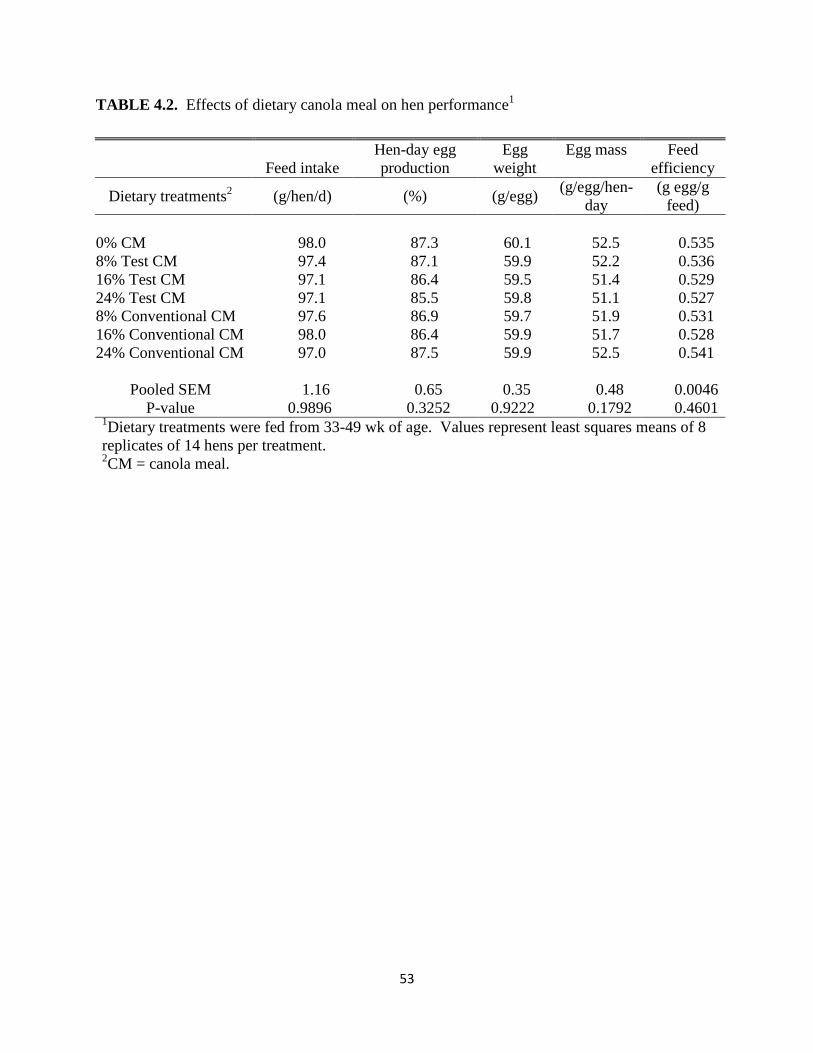
53
TABLE 4.2. Effects of dietary canola meal on hen performance1
Feed intake
Hen-day egg
production
Egg
weight
Egg mass Feed
efficiency
Dietary treatments2
(g/hen/d) (%) (g/egg) (g/egg/hen-
day
(g egg/g
feed)
0% CM 98.0 87.3 60.1 52.5 0.535
8% Test CM 97.4 87.1 59.9 52.2 0.536
16% Test CM 97.1 86.4 59.5 51.4 0.529
24% Test CM 97.1 85.5 59.8 51.1 0.527
8% Conventional CM 97.6 86.9 59.7 51.9 0.531
16% Conventional CM 98.0 86.4 59.9 51.7 0.528
24% Conventional CM 97.0 87.5 59.9 52.5 0.541
Pooled SEM 1.16 0.65 0.35 0.48 0.0046
P-value 0.9896 0.3252 0.9222 0.1792 0.4601 1Dietary treatments were fed from 33-49 wk of age. Values represent least squares means of 8
replicates of 14 hens per treatment.
2CM = canola meal.
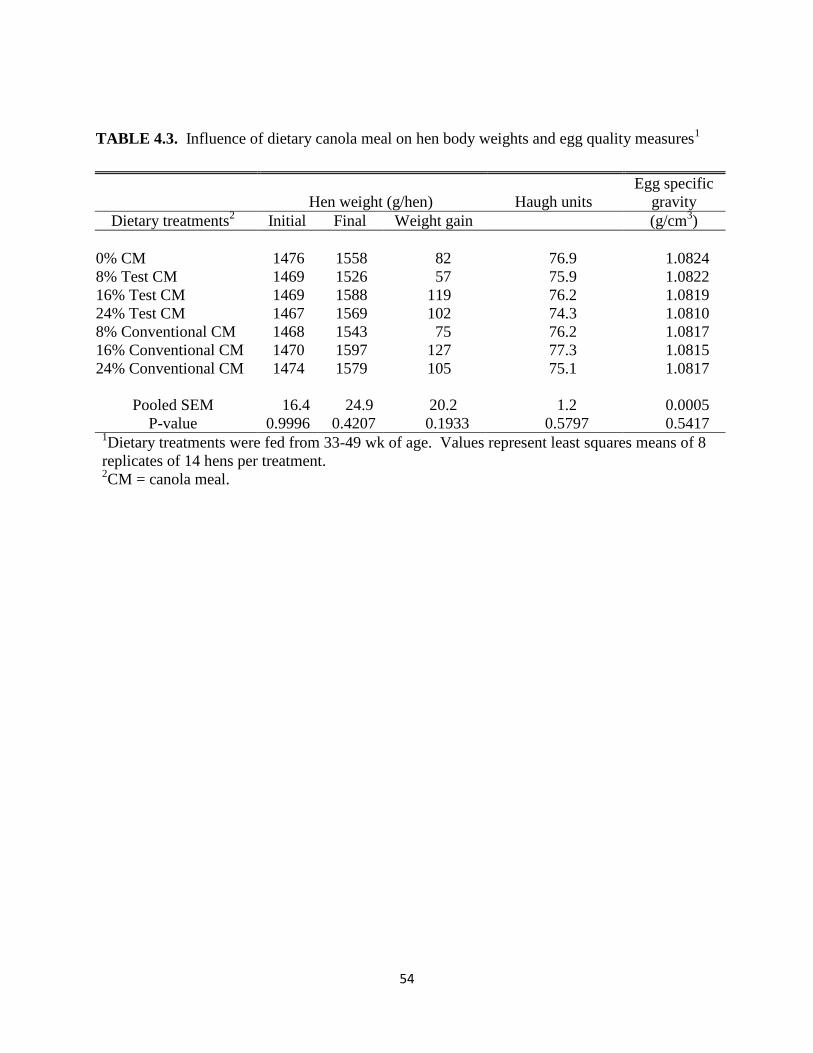
54
TABLE 4.3. Influence of dietary canola meal on hen body weights and egg quality measures1
Hen weight (g/hen) Haugh units
Egg specific
gravity
Dietary treatments2
Initial Final Weight gain (g/cm3)
0% CM 1476 1558 82 76.9 1.0824
8% Test CM 1469 1526 57 75.9 1.0822
16% Test CM 1469 1588 119 76.2 1.0819
24% Test CM 1467 1569 102 74.3 1.0810
8% Conventional CM 1468 1543 75 76.2 1.0817
16% Conventional CM 1470 1597 127 77.3 1.0815
24% Conventional CM 1474 1579 105 75.1 1.0817
Pooled SEM 16.4 24.9 20.2 1.2 0.0005
P-value 0.9996 0.4207 0.1933 0.5797 0.5417 1Dietary treatments were fed from 33-49 wk of age. Values represent least squares means of 8
replicates of 14 hens per treatment. 2CM = canola meal.

55
CHAPTER 5
CONCLUSIONS
The experiments included in this thesis evaluated the nutritional value of a new high-
protein: reduced fiber test canola meal compared with conventional canola meal or soybean meal
in the diets of broiler chickens and laying hens. The test canola meal contained a higher level of
crude protein and less fiber when compared with the conventional canola meal. However, both
canola meals were lower in crude protein and higher in fiber when compared to soybean meal.
From the first experiment, conducted with broiler chickens, it is concluded that canola
meal levels in excess of 10% in the starter diet had negative effects on growth performance. Due
to the large growth depression at the higher levels of canola meal in the starter phase, the
chickens had reduced performance throughout the remainder of the trial. The results of this
experiment led to the experimental design of Experiment 2.
From the second experiment, conducted with broiler chickens, it is concluded that either
the new test or conventional canola meal can be included at up to 8% in the starter diet and up to
at least 24% in the grower diets without any adverse effects on body weight gain, feed intake,
feed efficiency and mortality when the diets are formulated to be equal in MEn and digestible
amino acids. No differences were observed between the birds that received canola meal in the
diet and the control corn-soybean meal diet.
From the third experiment, conducted with laying hens, it is concluded that either test
canola meal or conventional canola meal can be included in laying hen diets at levels of at least
24% without detrimental effects on production, egg quality, or body weight when the diets are
formulated to be equal in digestible amino acids and MEn.
56
Results of these experiments indicate that the new high-protein: reduced fiber test canola
meal has both nutritional and economic value. Equal growth performance in broiler chickens
and production in laying hens can be achieved when using canola meal compared with using
soybean meal. The canola meal can be used as a protein source in the diets of broiler chickens
and laying hens when the diets are formulated to be equal in MEn and digestible amino acids.