nutrition public expenditure review: mainland …...budget execution is a significant constraint to...
TRANSCRIPT
Nutrition Public
Expenditure Review:
Mainland Tanzania and
Zanzibar
PER Report
July 2018

Nutrition Public Expenditure Review: Mainland Tanzania and Zanzibar
Oxford Policy Management Limited Registered in England: 3122495 Level 3, Clarendon House 52 Cornmarket Street Oxford, OX1 3HJ United Kingdom Tel: +44 (0) 1865 207 300 Fax: +44 (0) 1865 207 301 Email: [email protected] Website: www.opml.co.uk Twitter: @OPMglobal Facebook: @OPMglobal YouTube: @OPMglobal LinkedIn: @OPMglobal
About Oxford Policy Management
Oxford Policy Management is committed to helping low- and middle-income countries achieve growth and reduce poverty and disadvantage through public policy reform.
We seek to bring about lasting positive change using analytical and practical policy expertise. Through our global network of offices, we work in partnership with national decision makers to research, design, implement, and evaluate impactful public policy.
We work in all areas of social and economic policy and governance, including health, finance, education, climate change, and public sector management. We draw on our local and international sector experts to provide the very best evidence-based support.

Nutrition Public Expenditure Review: Mainland Tanzania and Zanzibar
© Oxford Policy Management i
Preface
UNICEF Tanzania in partnership with the Ministry of Finance and Planning contracted
Oxford Policy Management (OPM) to conduct a Public Expenditure Review of nutrition
budgets and spending, in mainland Tanzania and Zanzibar.
The Team Leader for this assignment was Tim Cammack. Stephanie Allan was Project
Manager. Other team members included Emmanuel Maliti, Manisha Marulasiddappa,
Ammon Mbelle, Deo Medardi, and Matt Robinson.
Errors and interpretations remain the sole responsibility of the authors.

Nutrition Public Expenditure Review: Mainland Tanzania and Zanzibar
© Oxford Policy Management ii
Acknowledgements
The authors would like to acknowledge the critical inputs provided to this report from
the Government of Tanzania and the Revolutionary Government of Zanzibar, in
particular from members of the PER Steering Committee chaired by Mr Charles
Mwamwaja. Also, we warmly thank everyone who supported our fieldwork, and all
those who provided guidance and information in interviews (see Annex A).
We also thank counterparts at UNICEF Tanzania, including Hayrullo Malikov, Mauro
Brero, Joyce Ngegba and Biram Ndiaye whose diligent engagement over several
months has contributed significantly to this review.
Lastly, we acknowledge the invaluable data cleaning support provided by Diego
Shirima.
Nutrition Public Expenditure Review: Mainland Tanzania and Zanzibar
© Oxford Policy Management 3
Executive summary
Tanzania has made significant progress in improving nutrition in the last 25 years with significant
reduction in the prevalence of stunting, wasting and underweight among children under five. The
prevalence of chronic malnutrition (stunting) among children under five fell from 50% in 1992 to
34% in 2015, while the prevalence of acute malnutrition (wasting) decreased from 8% in 1992 to
4.5% in 2015 (Tanzania Demographic and Health Survey and Malaria Indicator Survey – TDHS-
MIS, 2015-16). Despite this commendable progress, levels of malnutrition remain unacceptable,
and so the Government of Tanzania and Revolutionary Government of Zanzibar (RGZ) have made
improved nutrition a policy priority.
The effective supply and coordination of finance is vital for the nutrition effort. Accordingly, this
Public Expenditure Review (PER) has been commissioned to assess public expenditures on
nutrition and as far as possible to evaluate results against targets in national strategy documents.
Amongst other goals, its findings are expected to identify shortcomings in budgetary processes for
nutrition and to better direct future budgetary support.
The analysis covers two years1 and encompasses spending from government own source funds at
national and local level, as well as on and off budget Official Development Assistance (ODA) for
nutrition. It follows on from an earlier nutrition PER in Tanzania, the first of its kind in the world,
which was concluded in 2014 (Innovex et al., 2014). However, methodological variations and
differences in coverage of the two studies have limited the ability to draw comparisons.2
1. Methodology
The study follows established PER methodologies (World Bank 2009), and embarks on five pillars
of analysis:
(1) A review of the policy and institutional framework for nutrition (sections 2.2 and 9.1 of the main report)
(2) Level and composition of nutrition sector expenditure (sections 4.1 and 9.2) (3) The budget process and performance from a nutrition perspective (sections 4.2 and 9.3) (4) Efficiency and equity of nutrition spending (4.3 and 9.4) (5) Recommendations (6 and 11)
Because within Tanzania, Zanzibar has semi-autonomous status, and nutrition is not deemed a
“union matter” the PER treats the Mainland and Zanzibar separately, and reports on them
sequentially. Indeed, nutrition efforts in the two localities are informed by different policy
frameworks, led by different institutions, and financed through separate budget processes.
The methodology employs two main streams of analysis; quantitative data analysis and key informant interviews. Quantitative data analysis focused on government expenditure data (sourced from the mainland’s and Zanzibar’s integrated financial management systems (IFMS) and the local Government EPICOR system), as well as donor expenditure data (as reported on the budget and via bespoke PER templates). These were analysed against demographic and nutrition outcome data, sourced from official census and household survey datasets.
1 2014/15-2015/16 in the case of the mainland, and 2015/16 -2016/17 in the case of Zanzibar 2 Specifically, the 2014 PER covered the mainland only, and only included 15 LGAs (without attempting to come up with a nationwide estimate). It also utilised a different definition of nutrition, given that the NMNAP was not yet in place, which served as the key guiding document for this PER.

Nutrition Public Expenditure Review: Mainland Tanzania and Zanzibar
© Oxford Policy Management 4
Despite extensive efforts from the PER team and the Governments of Tanzania and Zanzibar, some data gaps and limitations remain at the time of publication. These are documented in full in the report (sections 3.1.4 and 8.1.4), but in summary the most significant gaps are:
incomplete and pervasive quality issues in local government expenditure reporting for the mainland;
partial expenditure reporting for Zanzibar, and
gaps in off-budget ODA reporting (particularly in nutrition-sensitive sectors).
A central aspect of the PER methodology was the criteria for determining if a budget line is nutrition-related. A list of key terms was devised for this purpose, which relates to the areas of nutrition relevance as guided principally by the Tanzania National Multisectoral Nutrition Action Plan (NMNAP). Budget line activity and target descriptions were cross-checked against this list to determine whether or not the line counted as nutrition. When a budget line was deemed to be broader than the nutrition activity alone (for example “provision of medicines, medical supplies and equipment to health facilities”) an apportionment percentage (or weight) was applied. Wherever possible, an objective basis was sought to determine an apportionment percentage between 0-100%, including interview notes and policy documents. In the absence of any objective value , a default value of 10% was applied as a conservative estimate.
Figure A1: Categorisation of nutrition spending
Level 1 Categorisation Level 2 Categorisation
Nutrition specific Maternal, Infant, Young Child and Adolescent Nutrition (MIYCAN)
Prevention and Management of Micronutrient Deficiencies
Integrated Management of Acute Malnutrition (IMAM)
Prevention and Management of Diet-Related Non-Communicable Diseases
unknown / multiple nutrition specific
Nutrition sensitive Nutrition Sensitive
Health
Agriculture
Wash
Education
Social Protection
Environment and climate change
Enabling Environment Nutrition surveillance, surveys and information management
Nutrition governance (Plans, policies, coordination, capacity)
To complement the quantitative expenditure data analysis, interviews were held in July 2017 with representatives from selected LGAs and nutrition relevant MDAs (on the mainland and in Zanzibar) to understand nutrition planning and budgeting processes and the institutional arrangements around these.
2. Findings – mainland Tanzania
2.1 Policy and institutional framework
In mainland Tanzania, the Government’s commitment to nutrition is established various policy
documents including the Food and Nutrition Policy (FNP), which is operationalised through the
NMNAP (and its predecessor, the National Nutrition Strategy (NNS)). The NMNAP sets out a
coordinated multi-sectoral approach to nutrition which encompasses a set of priority nutrition-
specific interventions (maternal, infant, young child and adolescent nutrition (MIYCAN), prevention

Nutrition Public Expenditure Review: Mainland Tanzania and Zanzibar
© Oxford Policy Management 5
and management of micronutrient deficiencies, integrated management of acute malnutrition and
management of diet-related non-communicable diseases) as well as nutrition-sensitive
interventions in the agriculture, health, WASH, education, social protection and environment
sectors, and associated governance and surveillance systems.
A multi-sectoral institutional framework for nutrition was established with the goal of coordinating
the complex network of actors within and outside government and to bring greater accountability
for nutrition outcomes. This coordination structure is headed by the multi-sectoral High Level
Steering Committee on Nutrition (HLSCN), placed in the Prime Minister’s Office which has
convening power to coordinate multi-sectoral activities.
At the local level there are District Nutrition Officers (DNuOs) in a majority of councils whose role it
is and to nutrition budgets for submission to the County Health Management Team. There are also
council steering committees on nutrition in many councils, but not all.
2.2 Level and composition of nutrition spending
i) Aggregate nutrition spending
For mainland Tanzania, total nutrition expenditures are estimated to be TZS 815bn in 2014/15 and
TZS 861bn in 20151/16. This represents a 5% increase overall (just less than inflation). However,
nutrition expenditure rose at a slower rate than overall government expenditure from 2014/15 to
2015/16 and as a result fell slightly as a percentage of total government expenditure (from 4.6% to
3.8%) and as a percentage of GDP (from 1% to 0.9%).
Figure A2: Total nutrition allocations and spending in Mainland Tanzania
Source: PER dataset. Notes: Includes qualifying nutrition specific, sensitive, and enabling environment allocations and
actuals.
Methodological differences make comparison with the PER of 2014 challenging, but estimates
suggest that public spending on nutrition may have increased significantly in recent years.
However, spending levels are far from adequate; as nutrition-specific spending at approximately
USD 0.50 per child under 5, falls far short of the benchmark requirement of USD 8.50 estimated by
the World Bank to reach the 2025 global stunting target
0
200,000
400,000
600,000
800,000
1,000,000
1,200,000
2014/15 2015/16 2014/15 2015/16
Nutrition approvedestimates
Nutrition actuals
TS
Z M
illio
ns
DP (off budget)
LGA budget (estimate)
National budget

Nutrition Public Expenditure Review: Mainland Tanzania and Zanzibar
© Oxford Policy Management 6
ii) Execution of nutrition budgets
Budget execution is a significant constraint to nutrition public expenditures for mainland Tanzania
where expenditure levels in nutrition-relevant ministries varied from 85% to 89% of approved
budgets in 2014/15, and from 62% to 72% of approved budgets in 2015/16. Nutrition-related
budgets performed equally poorly in 2014/15 but significantly better than overall budget execution
in 2015/16, suggesting that nutrition spending was possibly protected or prioritised. Furthermore,
budget execution rates for nutrition-related expenditure varied widely amongst the 22 LGAs making
up our core sample. On the recurrent budget the lowest execution rate was 5%, and the highest
288%; on the development budget the lowest execution rate was 1%, and the highest was 60%.
It has not been possible to say definitively how far the failure of nutrition budget execution results
from inadequate funding, and how far it results from the failure of implementing agencies to absorb
funds provided. We have little information on absorption in Tanzania because information on funds
released - amounts made available to implementing agencies - is limited and piecemeal. However,
although no specific data is available for nutrition-related releases, the balance of evidence
suggests that a significant proportion of budget execution failure results from the insufficient
release of funds. This is for two reasons: first, all LGAs met cited inadequate funding as the reason
for poor budget execution, and none indicated any failure to spend funds provided; and second the
2017 PEFA presents evidence to show that a significant part of the overall budgetary execution
failure (it allocates a “C” score) derives from the cash rationing system, and in particular the failure
of grants to reach their budgeted amounts in 2014/15 and 2015/16. This does not rule out cases of
poor absorption. For a definitive conclusion a fuller, more robust, dataset is required.
iii) Sources of finance for nutrition budgets
Figures from different studies vary, but it is clear that in the mainland nutrition spending continues
to be heavily financed by Development Partners who are estimated to have financed at least 38%
of nutrition-related expenditure in 2014/15.Mmore than 55% of nutrition-related spending comes
through local government budgets (through own source revenue and on budget ODA). This
percentage appears to be increasing although it is not linear, and it fell back in 2015/16.
iv) Spending by nutrition categories
In mainland Tanzania, More than 95% of allocations and expenditures from local and national
budgets pay for nutrition-sensitive interventions. A much smaller share of reported expenditures
(1.9%) go towards nutrition-specific approaches. This is consistent with NMNAP which proposes
only 2% of spending for nutrition-specific interventions.
In 2014/15 and 2015/16, 65% of nutrition-specific interventions were for MIYCAN, with 29% for
micronutrients. IMAM accounted for 5%. ODA provided most finance for MIYCAN (77%) and IMAM
(89%).
Nutrition-sensitive at national level is predominantly WASH, health and Social Protection.
Education is absent for lack of data, and Social Protection is primarily World Bank financed TASAF
cash transfers. Nutrition-sensitive at local level is more mixed. WASH is again the dominant area of
spending, but education nutrition-sensitive spending is higher than expected at more than 20% (the
NMNAP expects only 8%) while health is at 8% where the NMNAP expects 30%.
Enabling environment spending at national level is 68% on nutrition surveillance, surveys and
information management; at local level it is 73% on nutrition governance.

Nutrition Public Expenditure Review: Mainland Tanzania and Zanzibar
© Oxford Policy Management 7
Figure A4: Expenditures by broad nutrition categories (2014/15 – 2015/16)
Source: PER dataset. * unknown/multiple relates to budget lines associated with unspecified medical supplies plus
undefined TFNC expenditures. Data is for 2014/15 and 2015/16 combined.
2.3 The budget process and performance from a nutrition perspective
In mainland Tanzania nutrition budgets are not prioritised at local level because of resource
constraints and lack of awareness amongst councillors; in this context, and DNuO does not have
the position/authority to make the nutrition budget case outside the health budget. As such,
NNS/NMNAP goals cannot be pursued effectively.
Nutrition Steering Committees meet irregularly or not at all, and do not focus on nutrition budget
review or future budget planning.
Transfers from central government are unpredictable both in amount and timing, adversely
affecting planning; some LGAs reported receiving only 30-40% of OC transfers in 2015/16; LGAs
report that they spend all funds received – shortfalls in execution arise from short releases.
However, from 2017/18 MOFP will transfer funds directly to health facilities, and this is expected to
improve health sector nutrition spending.
EPICOR/PO-RALG is not able to produce consolidated LGA financial reports which would enable a
nationwide view of nutrition spending. However, PlanRep was revised in 2017 to introduce nutrition
as a Cost Centre which is expected to make nutrition-specific reporting more effective.
2.4 Efficiency and equity of nutrition spending
A comprehensive efficiency analysis was hindered by a lack of disaggregated SAM treatment
numbers, and sufficiently disaggregated expenditure data. Nonetheless, one area where efficiency
could clearly be enhanced on the mainland is through a more regular and focused review of
nutrition results by local multisectoral nutrition committees.
Regarding equity, it is noted that nutrition spending per child in LGAs does increase broadly with
stunting levels (proportion of malnourished children) but not with absolute numbers of children
suffering from malnutrition. Furthermore, there is significant, historically-based, budget inequity
0.6%
96.2%
1.9% 1.3%
enabling_environment n_sensitive n_specific unknown_multiple

Nutrition Public Expenditure Review: Mainland Tanzania and Zanzibar
© Oxford Policy Management 8
between LGAs particularly in the area of salaries and staffing, and LGA transfers are still made in
an ad hoc manner without regard to variations in need.
3. Recommendations – Mainland Tanzania
R1 (to MoFP, MDAs and LGAs): Address the adequacy of budgets for nutrition
There are many instances throughout this report where critical nutrition plans have not been carried out as a result of resource constraints. The Government of Tanzania plans to significantly increase nutrition-specific spending at LGA level, and this is welcomed. The competing needs of all sectors are recognized. However, dramatic improvements in nutrition funding are needed to meet international benchmarks, and nutrition interventions make excellent investments. To this end, it is recommended that MoFP mobilize additional revenues and allocate a part to nutrition interventions, as well as ensure that where possible LGAs and MDAs also maximise their revenue raising potential.
R2 (to MOFP, PORALG, all implementing agencies): Improve budget management and efficiency
Better budget management and efficiency improvement is critical to securing better nutrition outcomes. The PEFA noted that the PFM system faces challenges in terms of arrears and predictability in availability of funds, which are clearly affecting nutrition outcomes. Relevant recommendations and programmes already exist in the PFM Action Plan whose first three strategic objectives are: for improved macro-economic management to provide the basis for a credible budget; to allocate resources efficiently on a medium term basis in alignment with national priorities (which include nutrition); and for the budget to be executed as planned with timely and accurate reporting. These are major tasks of PORALG and the MOFP which require realistic budgeting and a new approach to cash rationing. It is incumbent upon MDAs and LGAs to engage with the process fully, ensure that the sectoral and sub-national viewpoints are taken into account, and to support agreed initiatives.
R3 (to MoFP, PO-RALG): Improve equity in nutrition (and in LGAs)
LGA transfers are still made in an ad hoc and mostly incremental manner without regard to variations in need, and budgets for salaries and staffing are particularly skewed for mostly historical reasons. Inequities exist specifically within nutrition: spending per child in LGAs does increase broadly with stunting levels (proportion of malnourished children) but not with absolute numbers of children suffering from malnutrition. Measures are required for MOFP and PO-RALG to correct the high level inequities and to overcome the institutional and political challenges involved. At present the PFM Action Plan does not address LGA equity issues, and this omission must be addressed in any revision. Consideration can be given to a supplementary health/nutrition grant for those LGAs with high numbers of children or adults suffering from malnutrition, and such grants can be adjusted as data is improved.
R4 (to MoFP, PO-RALG): Further incentivise nutrition expenditures
The Government of Tanzania currently incentivises nutrition expenditures on the mainland through requiring that there should be a budgetary allocation in each council of TZS 500/= per year for each child under 5, for 2017/18 – 2018/2019 (and rising in future years); and that regions should allocate TZS 5,000,000/= per council. Nutrition expenditures could be further strengthened in by making these increases mandatory and monitoring to ensure effective compliance; as well as by awarding protected status to nutrition-specific and nutrition enabling environment expenditures. Finally, MOFP might consider a matching grant to encourage key nutrition expenditures from own source funds.

Nutrition Public Expenditure Review: Mainland Tanzania and Zanzibar
© Oxford Policy Management 9
R5 (to PO-RALG; RAS; LGAs): Strengthen the nutrition enabling environment at LGA level
Most nutrition expenditures are undertaken at LGA level, but the enabling environment for nutrition at LGA level is not strong. Nutrition committees don’t meet regularly, and in many districts not at all. When they do meet, they do not necessarily monitor progress against the NNS/NMNAP. Furthermore, the DNuO is not always an influential position at the District level.
It is recommended that PO-RALG issue a directive to ensure that multisectoral nutrition committees meet regularly and visibly monitor progress against the NMNAP and that DNuOs are full members of the CHMT. TFNC and development partners should support sensitization of key personnel (DHO, responsible sector staff, Council chair, Council members) on nutrition imperatives and NMNAP.
R6 (to PO RALG, LGAs, UNICEF, Development Partners): Improve sensitisation at the community level
One of the reasons that councillors do not prioritise nutrition (apart from lack of budget) is that communities do not prioritise nutrition due to lack of awareness. There is a need for Government and development partners to improve sensitisation, and to find new channels of communication. For instance, Southern Highlands regions are among the biggest producers of food crops in Mainland, yet have some of the highest stunting rates among children under five years.
R7 (to MoFP, PO-RALG): Improve the financial management to better monitor nutrition spending
A major limitation of this exercise has been the incompleteness of the underlying financial data and the lack of interconnected financial systems. The challenges faced include lack of data; poor quality of data; and lack of linkages between financial documents and/or systems. They are particularly severe at the LGA level. The introduction of a nutrition cost centre is welcomed but is not a panacea. It will need proper introduction if it is to be widely used in nutrition-relevant ministries, and it may not easily capture nutrition-sensitive activities outside the health sector.
Donor-financed programmes to support nutrition at the subnational level should include a governance component to support financial management initiatives. At the same time, PO-RALG should monitor and maximise the use of the nutrition Cost Centre, and across Government there should be a consolidated effort in support of PFM Action Plan Strategic Objective 3 for the budget to be executed as planned with timely and accurate reporting. TFNC and HLSCN should strengthen their nutrition budget monitoring capacity. It may also be necessary to modify the mechanisms for reporting and accountability through DNuO; RNuO; RAS; PORALG; and MDAs. Finally, Government should plan for a new nutrition PER in 2020 to cover 2016/17; 2017/18 and 2018/19.
R8 (to HLSCN): Establish a cross sectoral financing mechanism for nutrition
Coordination and monitoring is always a problem for cross sectoral budgets. With time, GoT (or RGZ) may wish to explore possibilities for devising a cross-sectoral financing mechanism for nutrition. This could be in the form of a converged budget programme for nutrition, under which multiple agencies can bid for funds; or budget programmes can remain under the purview of a single MDA, but with more formalised arrangements to enable other MDAs to contribute to how those funds are implemented and managed.
R9 (to HLSCN, MoHSW and TFNC): Collect and collate SAM treatment data
RNuOs and DNuOs should be provided with the necessary guidance (from MOHSW and/or TFNC) and resources to collect and collate SAM treatment data so that technical efficiency of LGAs can be assessed. Where appropriate, this could draw on data already collected for the nutrition bottleneck analysis.

Nutrition Public Expenditure Review: Mainland Tanzania and Zanzibar
© Oxford Policy Management 10
R10 (to development partners) Adhere to recent PORALG guidelines on reporting on nutrition allocations and expenditures to local governments
ODA reporting is incomplete and fragmented. PO-RALG has recently issued a directive to development partners concerning the timely reporting on ODA allocations and expenditures to local governments. Development partners should aim to meet this directive in a timely manner. These reports should be compiled by PORALG and made available for other analyses as required (including future PERs).
4. Findings – Zanzibar
4.1 Policy and institutional framework
In Zanzibar the first plan to be developed which takes into account the fully multidimensional
nature of nutrition was the Multi-sectoral National Nutrition Strategy and Costed Implementation
Plan in 2013 (ZNNS). This strategy and implementation plan aims to foster multi-sectoral
collaboration and coordination and outlining well-defined roles and responsibilities and actions to
address the immediate. However, it has remained in draft form and has never been officially
endorsed by the government.
The lack of an endorsed multi-sectoral plan and the coordination mechanisms envisaged under the
ZNNS, means that the ministries involved in nutrition related activities tend to coordinate within
their own sector only. Most of the nutrition expertise in RGZ sits within MOH-RGZ, in the nutrition
unit. No nutrition focal persons or nutritionists were noted in other MDAs. At the district level,
DNuOs are in place in all districts but only a minority of them are qualified nutritionists. There are
currently no coordination structures in place specifically for nutrition at the district level.
4.2 Level and composition of nutrition spending
i) Aggregate nutrition spending
In Zanzibar RGZ allocations to nutrition have grown by an estimated 77% over the two year period,
from TZS 36bn to TZS 63bn. Actual expenditures, while significantly lower than allocated
amounts, have also grown considerably (more than doubling between the two years), however
incomplete reporting muddies the picture of actual expenditures. Interviewees reported that the
Government was giving growing fiscal priority to nutrition, due to increased awareness amongst
political leadership and senior civil servants. This is borne out by these data, which show nutrition
spending is accounting for a modest but growing share of public expenditure (growing from 0.7% in
2015/16 to 1.5% in 2016/17). By contrast, allocations to nutrition from the District Health Services
Basket Fund have fallen over the same period by 49%.

Nutrition Public Expenditure Review: Mainland Tanzania and Zanzibar
© Oxford Policy Management 11
Figure A3: Total nutrition allocations and spending in Zanzibar (2015/16 and
2016/17)
Source: PER dataset. Notes: “Other donor” figures to for 2015/16 include UNICEF nutrition-specific contribution only;
2016/17 allocations include all donor sources in the Plan of Action, however expenditure information was not available.
Despite the growing fiscal priority being afforded to nutrition, there is evidence to suggest that
current spending resourcing is far from adequate. There is a long way to go until Zanzibar is likely
to meet the World Bank nutrition-specific benchmark of USD 8.5 per child under 5, with just USD
0.55 per child under 5 recorded in 2015/16. There was however notable improvement in 2016/17,
with reported data indicating spend of just over USD 1 per child under 5.
ii) Execution of nutrition budgets
Budget execution is a significant constraint to nutrition public expenditures for mainland Tanzania,
but the data suggest that the problem may be even more stark in Zanzibar, where Ministerial level
nutrition budget execution rates were below 10% in a number of MDAs. Evidence on key factors
underlying budget execution challenges is only anecdotal, but includes reported delays in
completion of infrastructure projects, procurement issues, irregularity of aid inflows and timeliness
of disbursements from MOFP-RGZ, as well as incomplete or delayed reporting from MDAs to
MOFP-RGZ (which impacts on subsequent releases). Execution challenges are not unique to
government spending; Zonal Medical Officers in Pemba and Unguja reported total Basket Fund
expenditures of just 46% and 36% of their respective zonal allocations. There is also cause to
believe that the low execution levels reported reflect poor reporting in addition to poor execution.
iii) Sources of finance for nutrition budgets
In Zanzibar the vast majority of nutrition spending (94%) flows through the RGZ budget
(underscoring the importance of national budget processes for nutrition outcomes). This includes
own source funds and on-budget ODA. Off budget aid accounted for 5.4% of 2016/17 nutrition
allocations. The share of Basket Fund nutrition-related spending appears to be relatively modest
(0.25% in 2016/17).
In contrast to the distribution of spending on the mainland, 98% of nutrition spending in Zanzibar is
planned and budgeted for at the national level. This is not surprising, as Zanzibar was fully
centralised in the years under review. This is set to change with the introduction of fiscal
decentralisation, and some new sector grants being issued to local Governments in the agriculture,
education and health sectors, from 2016/17 onwards.
0
10,000
20,000
30,000
40,000
50,000
60,000
70,000
80,000
2015/16 2016/17 2015/16 2016/17
Nutrition approvedestimates
Nutrition actuals
TZ
S M
illio
ns
RGZ Basket Fund Other donor*

Nutrition Public Expenditure Review: Mainland Tanzania and Zanzibar
© Oxford Policy Management 12
iv) Spending by nutrition categories
In Zanzibar over 90% of allocations and expenditures go towards nutrition-sensitive interventions
whereas only 7% of allocations and 5% of expenditures go towards nutrition-specific activities. In
the (draft) ZNNS costing around half of the total budget over 5 years was expected to be nutrition-
specific, therefore this heavy skew towards nutrition sensitive interventions is not in line with the
vision of the ZNNS.
Analysis of nutrition-specific funding in Zanzibar is hindered by the fact that no breakdown of
allocations to the MOH-RGZ nutrition unit was available (it is budgeted for under a single activity
called “nutritional services”). However, in interviews, unit officials clarified that their focus was on
nutrition specific interventions including salt iodisation, vitamin A distribution, exclusive
breastfeeding campaigns and growth monitoring. Donor support to nutrition-specific interventions is
focused on MIYCAN and Prevention and Management of Micronutrient Deficiencies
Similar to the mainland, nutrition sensitive budget allocations in Zanzibar are dominated by the
WASH sector, followed by the health sector and then the agricultural. The education sector
(through pre-primary school feeding) accounts for just 0.17% of identified nutrition-sensitive
allocations. Relative to the draft costing of the ZNNS this is unexpected, with education and
agriculture allocated the largest amounts of funding, followed by social protection and finally
WASH.
Enabling environment allocations are very modest (accounting for only 2% of nutrition spending)
and are predominantly for nutrition governance, with smaller amounts going to surveillance,
surveys and information management.
Figure A4: Expenditures by broad nutrition categories (2015/16 – 2016/17)
Source: PER dataset. * unknown/multiple relates to budget lines associated with unspecified medical supplies. Data is
for 2015/16 and 2016/17 combined.
91.61%
5.31%2.91% 0.17%
Nutrition-sensitive Nutrition-specific
Enabling Environment Unknown/multiple*

Nutrition Public Expenditure Review: Mainland Tanzania and Zanzibar
© Oxford Policy Management 13
4.3 The budget process and performance from a nutrition perspective
Central budgeting processes in Zanzibar do not incentivise nutrition spending proposals as MDAs
do not receive any directive to prioritise nutrition interventions in the budget guidelines issued by
MOFP-RGZ, nor is it a focus for budget officers scrutinising MDA submissions. This means that
nutrition is prioritised within the budget, only where individual ministries see it as a priority.
Regarding the Basket Fund, nutrition-specific interventions are not explicitly mentioned in the fund
planning guidelines, although they could fit within some of the specified strategies.
However, it is primarily challenges in budget execution impede the ability of ministries to provide
nutrition related services. As noted above, the precise nature of the blockages is unclear but
anecdotal evidence suggests that the timeliness of transfers from MOFP-RGZ is a primary factor.
The Basket Fund also suffers from execution challenges, and when funds are insufficient, DHMTs
reported that they reallocate funds from areas including preventative services budget, to cover
basic running costs of health facilities.
All budget programmes are required to have associated performance indicators at the output and
outcome level. However, examples of nutrition related budget programme performance indicators
were few and far between; – identified only in the monitoring frameworks of MOH-RGZ and
MOANLF-RGZ. This may be a reflection of the fact that many of the nutrition-sensitive
interventions identified were not conceived of as nutrition interventions or designed with their
potential nutrition outcomes in mind. The implication of this may be that the nutrition results of the
programmes are not maximised.
Lastly, from 2017/18, significant decentralisation by devolution (DbyD) transfers will be going to
districts in Zanzibar for services in nutrition-related sectors. DbyD poses significant opportunities
and risks for nutrition funding. A lot of nutrition-sensitive and -specific expenditure in the education,
health and agriculture sectors is set to be decentralised under the new system. Consequently,
ensuring local government’s ability to plan and budget for the new transfers, and to prioritise
nutrition expenditures within the resource envelope, is of paramount importance.
4.4 Equity of nutrition spending
In Zanzibar the equity sensitivity of individual nutrition related programmes varies. For example,
Basket Fund allocations are determined through a formula which takes poverty and other
dimensions of deprivation into account, whereas the pre-primary school feeding grant is an equal
per capita allocation. Sectoral M&E systems mostly support equity analysis but could be
strengthened. For example, most of the datasets are disaggregated to district level, but
disaggregation by gender and (dis)ability are not always possible. This limits the ability to monitor
how nutrition inequities converge with other vectors of inequity.
5. Recommendations – Zanzibar
R11 (to RGZ and Development Partners): Consider developing (or refreshing) an overarching nutrition policy and coordination architecture to give strategic direction to nutrition interventions and strengthen accountability for results
Currently, Zanzibar does not have an operational overarching nutrition policy, as the ZNNS was never endorsed. In its absence there is no single document which strategically directs or coordinated nutrition activities across the different sectors and different funders. If there is political appetite and RGZ support, a consultation around and refresh of the ZNNS should be considered.
Following policy development, RGZ should establish and convene an appropriate coordination structure whose responsibilities would include: i) overseeing implementation of the nutrition policy, ii) monitoring the flow of funds to priority programmes, iii) strengthening cross-sectoral

Nutrition Public Expenditure Review: Mainland Tanzania and Zanzibar
© Oxford Policy Management 14
collaboration on nutrition interventions including ensuring the nutrition-sensitive interventions are maximising nutrition outcomes, and iv) to improve the monitoring of nutrition-related results on priority interventions. With time, RGZ may wish to look possibilities for devising a cross-sectoral financing mechanism for nutrition.
R12 (to RGZ): Following the development of a nutrition policy, address the (likely) shortfall of nutrition-specific spending
Currently on 7% of nutrition-related allocations directly address malnutrition through nutrition-specific approaches, and 5% of expenditures. In the (draft) ZNNS costing nutrition-specific interventions comprise around half of the total budget over 5 years. With the possibility of a new/refreshed nutrition policy, there is an opportunity to review whether nutrition-specific activities are similarly underfunded against the new plan and to take appropriate corrective measures. Possible pathways include additional domestic revenue dedicated to a particular purpose (through inter and intra sectoral reallocations, or additional revenues raised), additional foreign grants, additional borrowing or efficiency gains. They all have ramifications for fiscal sustainability, and warrant careful consideration.
R13 (to MOFP-RGZ, TFNC, UNICEF): Consider integrating nutrition priorities into budget guidelines
Currently, central PFM process operating in a way which purposefully supports nutrition spending. Therefore, whether or not nutrition features in an MDA budget is primarily determined by sectoral strategic priorities. MOFP-RGZ should consult around including nutrition as a strategic priority in 2019/2020 budget guidelines, where necessary drawing support from TFNC. Subsequent to this, MOFP-RGZ should be given training on how to identify nutrition-relevant activities during budget scrutiny processes, which could potentially be provided by TFNC and/or UNICEF.
R14 (to MOH-RGZ, Basket Fund Contributors): Explore means through which the health basket fund resources can more purposefully be mobilised to support nutrition (specific) activities.
Budget allocations from the basket fund for nutrition-related activities are notably modest,
particularly in the case of nutrition-specific activities, and have fallen over the reporting period by
49%. Planning guidelines for the Basket Fund direct DHMTs towards a number of priority
strategies but nutrition-specific interventions are not explicitly mentioned, and there is no
earmarked allocation to nutrition in the Basket Fund. Basket Fund stakeholders should consult and
consider revising the guidelines to include a stronger directive on nutrition spending.
R15 (to MOFP-RGZ and partners): Conduct an in-depth assessment of budget execution procedures and timelines and design appropriate, targeted measures to improve execution performance
Whilst poor execution performance is not unique to nutrition, preliminary data suggests that
nutrition expenditures are not protected from these, and that this impedes the ability of the
ministries to provide nutrition related services. It was beyond the scope of this PER to conduct the
detailed analysis to identify blockages with certainty. Anecdotal evidence gleaned through
interviews suggest the delay is primarily in relation to transfers from MOFP-RGZ to MDAs, which
often arrived towards the end of the quarter, but a multitude of reasons could be behind this
(including, for instance, poor revenue forecasting, unrealistic activity costing or planning, in-efficient
cash management processes, extensive arrears, overly strenuous procurement procedures,
lagging capacity, etc.). The planned PEFA for Zanzibar should be given a mandate to focus on
budget execution challenges. Subsequent recommendations should be implemented by RGZ, and
the impact on nutrition expenditure monitored through the nutrition coordination architecture.

Nutrition Public Expenditure Review: Mainland Tanzania and Zanzibar
© Oxford Policy Management 15
R16 (to RGZ, TFNC): Strengthen nutrition capacity within RGZ (beyond MOH-RGZ) including at the local level in light of DbyD
Most of the nutrition expertise in RGZ currently sits within MOH-RGZ, within the nutrition unit. A commonly adopted model for building and spreading nutrition capacity amongst SUN member countries is to assign a nutrition focal person in all relevant ministries to advise on the design and implementation of nutrition-sensitive programmes under their purview and to facilitate cross ministerial coordination. Ideally, they should combine nutrition and sector specific expertise. Their recruitment and training could be supported by TFNC. At the local level, there is cause for strengthening the role of the nutrition focal by ensuring the posts are filled with individuals with appropriate educational backgrounds, and with enough seniority to engage proactively with District Management Teams. It might also make sense for the district nutrition officer to report to the District/Municipality Executive Director, particularly as DbyD will means that a lot of the nutrition budgeting decisions are being decentralised down to the local level.
R17 (to RGZ and Development Partners): Improve the timeliness and comprehensiveness of expenditure reporting
Monitoring public expenditure for nutrition and ensuring accountability around commitments, is entirely dependent on the timeliness and completeness of expenditure data. At present, expenditure reporting is patchy and delayed, and would benefit from more robust quality assurance processes. MOFP-RGZ (through the Accountant General’s office) should seek to enforce timely reporting by MDAs through the IFMS system. Typically, a schedule of one month after quarter end is a reasonable target to aim for. Where reported figures are widely differing from allocated amounts, a brief justification should be provided by the MDA. Reporting expenditures against on-budget aid commitments should also adhere to these timeframes. In the case of the basket fund, it is recommended that the fund operational guidelines be revised to necessitate expenditure reporting against specific activities as well as by overall cost category.

Nutrition Public Expenditure Review: Mainland Tanzania and Zanzibar
© Oxford Policy Management 16
Table of contents
Preface .......................................................................................................................... i
Acknowledgements ....................................................................................................... ii
Executive summary ....................................................................................................... 3
List of tables, figures, and boxes ................................................................................. 19
List of abbreviations .................................................................................................... 22
1 Introduction and context ................................................................................... 24
1.1 PER Objectives ............................................................................................. 24
1.2 Country context ............................................................................................. 24
1.3 Nutrition global landscape ............................................................................. 26
1.3.1 Efficacy of nutrition interventions and rates of return on investment .......... 29
1.3.2 International policies and institutional architecture ..................................... 29
1.4 The format of this report ................................................................................ 30
2 Mainland Tanzania: context .............................................................................. 31
2.1 Nutrition landscape ....................................................................................... 31
2.2 Policy and institutional framework for nutrition .............................................. 32
2.2.1 Government commitment to nutrition ......................................................... 32
2.2.2 Nutrition policy framework ......................................................................... 33
2.2.3 Nutrition institutional framework ................................................................. 35
2.3 PFM landscape ............................................................................................. 37
2.3.1 The formal budget process and budget guidelines .................................... 37
2.3.2 Performance of the PFM system ............................................................... 38
2.3.3 Public expenditure trends .......................................................................... 39
2.4 Fiscal Decentralization .................................................................................. 40
2.4.1 Fiscal decentralisation and intergovernmental fiscal transfers ................... 40
3 Mainland Tanzania: methodology ..................................................................... 44
3.1 Data analysis and data availability ................................................................ 44
3.1.1 Years of analysis ....................................................................................... 44
3.1.2 Sources of data ......................................................................................... 44
3.1.3 Data collection, consolidation, classification and cleaning processes ........ 45
3.1.4 Data coverage, gaps, and limitations ......................................................... 48
3.2 Field work and interviews .............................................................................. 50
4 Mainland Tanzania: analysis ............................................................................ 51
4.1 Level and composition of nutrition spending ................................................. 51
Nutrition Public Expenditure Review: Mainland Tanzania and Zanzibar
© Oxford Policy Management 17
4.1.1 Aggregate nutrition spending ..................................................................... 51
4.1.2 Nutrition allocations and expenditures by economic classification ............. 55
4.1.3 Sectoral distribution ................................................................................... 58
4.1.4 Execution of nutrition budgets ................................................................... 59
4.1.5 Sources of Finance for nutrition budgets ................................................... 62
4.1.6 Nutrition allocations and spending by level of government ........................ 63
4.1.7 Expenditure by nutrition categories ........................................................... 65
4.1.8 Estimation of the financing gap for the NNS and the NMNAP .................... 72
4.2 Budget process and performance for nutrition .............................................. 73
4.2.1 National level ............................................................................................. 73
4.2.2 Local level ................................................................................................. 74
4.3 Technical efficiency and equity ..................................................................... 81
4.3.1 Technical efficiency ................................................................................... 81
4.3.2 Equity ........................................................................................................ 81
5 Conclusions for Mainland Tanzania .................................................................. 85
5.1.1 Limitations of analysis pertinent to these conclusions ................................ 85
5.1.2 Conclusions ............................................................................................... 85
6 Recommendations for Mainland Tanzania........................................................ 87
7 Zanzibar: context .............................................................................................. 91
7.1 Nutrition landscape ....................................................................................... 91
7.2 PFM landscape ............................................................................................. 92
7.2.1 Planning and budgeting processes ............................................................ 92
7.2.2 Budget execution....................................................................................... 93
7.2.3 Budget structure ........................................................................................ 94
7.2.4 Decentralisation by devolution ................................................................... 94
8 Zanzibar: methodology ..................................................................................... 96
8.1 Methodology and data availability ................................................................. 96
8.1.1 Years of analysis ....................................................................................... 96
8.1.2 Sources of data ......................................................................................... 96
8.1.3 Data collection, consolidation, classification and cleaning processes ........ 97
8.1.4 Data coverage and gaps ........................................................................... 98
8.2 Field work and interviews ............................................................................ 100
9 Zanzibar: Analysis .......................................................................................... 101
9.1 Policy and institutional framework for nutrition ............................................ 101

Nutrition Public Expenditure Review: Mainland Tanzania and Zanzibar
© Oxford Policy Management 18
9.1.1 Government commitment to Nutrition ...................................................... 101
9.1.2 Nutrition policy framework ....................................................................... 101
9.1.3 Nutrition institutional framework ............................................................... 103
9.2 Level and composition of nutrition spending ............................................... 105
9.2.1 Aggregate nutrition spending ................................................................... 105
9.2.2 Sectoral distribution ................................................................................. 108
9.2.3 Execution of nutrition budgets ................................................................. 111
9.2.4 Sources of Finance for nutrition budgets ................................................. 113
9.2.5 Nutrition allocations and spending by level of government ...................... 114
9.2.6 Expenditure by nutrition categories ......................................................... 116
9.3 Budget process and performance for nutrition ............................................ 123
9.3.1 Planning and budgeting processes for nutrition ....................................... 123
9.3.2 Executing nutrition budgets ..................................................................... 125
9.3.3 Monitoring of nutrition spending ............................................................... 126
9.3.4 Implications of DbyD on nutrition ............................................................. 126
9.4 Efficiency and equity ................................................................................... 128
10 Conclusions for Zanzibar ................................................................................ 130
10.1.1 Limitations of analysis pertinent to these conclusions .............................. 130
10.1.2 Conclusions ............................................................................................. 130
11 Recommendations Zanzibar ........................................................................... 132
References ............................................................................................................... 136
Glossary of key public finance management terminology .......................................... 138
Annex A List of People Met.................................................................................... 140
Annex B Development Partner data request and template .................................... 143
Annex C Mainland Tanzania and Zanzibar draft data requests .............................. 146
Annex D Rationale for the selection of chosen LGAs for fieldwork ......................... 153
Annex E Rationale for the LGAs in data collection sample .................................... 154
Annex F Budget Cycle mainland Tanzania ............................................................ 155
Annex G Nutrition identification and classification guidelines ................................. 157
G.1 Key terms ................................................................................................... 157
G.2 Classification .............................................................................................. 162
Annex H Plan of Action .......................................................................................... 166
H.1 Mainland Tanzania Plan of Action ............................................................... 166
H.2 Zanzibar Plan of Action ............................................................................... 168

Nutrition Public Expenditure Review: Mainland Tanzania and Zanzibar
© Oxford Policy Management 19
List of tables, figures, and boxes
Tables
Table 1. Trends of Key Nutritional Indicators for mainland Tanzania ......................................... 31
Table 2. Key Target Groups and Focus Areas of the NNS and NMNAP .................................... 34
Table 3. Changes between 2013 and 2017 PEFA assessments ............................................... 38
Table 4. Areas of PFM improvement/ deterioration from 2013 to 2017 ...................................... 38
Table 5. Data sources - Mainland Tanzania .............................................................................. 44
Table 6. Data coverage, gaps and limitations – Mainland Tanzania .......................................... 49
Table 7. Mainland Tanzania: total nutrition allocations and spending (TZS Million) ................... 51
Table 8. Estimated aggregates from 2014 Nutrition PER (TZS millions).................................... 53
Table 9. Mainland Tanzania: nutrition expenditure against government-wide aggregates (TZS millions) .................................................................................................................................... 53
Table 10. Nutrition-specific expenditure in Mainland Tanzania per child under 5......................... 54
Table 11. Estimated nutrition spending by broad economic classification (2014/15 – 2015/16) ... 55
Table 12. Nutrition budgets by level of government and by broad economic classification (2014/15 - 2015/16) ................................................................................................................................ 56
Table 13. National nutrition budgets by broad economic classification: 2014/15 only, excluding ODA ................................................................................................................................ 56
Table 14. Recurrent nutrition expenditures by level of Government (2014/15 – 2015/16) ............ 57
Table 15. Mainland Tanzania: comparison of nutrition budget execution rates and total budget execution rates for 2014/15 and 2015/16 ...................................................................................... 60
Table 16. Sources of nutrition spending (2014/15) ...................................................................... 62
Table 17. Nutrition allocations by level of Government ................................................................ 64
Table 18. Nutrition expenditures by level of Government ............................................................ 65
Table 19. Sources of funding for nutrition specific expenditures (2014/15 – 2015/16) ................. 68
Table 20. Trends of Key Nutritional Indicators for Zanzibar ......................................................... 91
Table 21. Service delivery transfers to LGAs under DbyD (2017/18) ........................................... 94
Table 22. Data sources - Zanzibar .............................................................................................. 96
Table 23. Data coverage and gaps - Zanzibar ............................................................................ 99
Table 24. Total nutrition allocations and spending in Zanzibar .................................................. 106
Table 25. Nutrition actual expenditures in Zanzibar against government-wide aggregates ........ 107
Table 26. Nutrition-specific expenditure in Zanzibar per child under 5 ....................................... 108
Table 27. Sectoral distribution of nutrition expenditures in Zanzibar .......................................... 109
Table 28. Budget execution rates in nutrition related MDAs in Zanzibar .................................... 112
Table 29. Zanzibar nutrition budget allocations by level of government (2016/17) ..................... 115
Table 30. Zanzibar’s nutrition-specific allocations (2015/16 - 2016/17) ..................................... 117
Table 31. Breakdown of Zanzibar’s nutrition-sensitive budget allocations and expenditures (2015/16 - 2016/17) .................................................................................................................... 118
Nutrition Public Expenditure Review: Mainland Tanzania and Zanzibar
© Oxford Policy Management 20
Table 32. Zanzibar’s enabling environment budget allocations and expenditures (2015/16 - 2016/17) .......................................................................................................................... 121
Figures
Figure A1: Categorisation of nutrition spending ............................................................................... 4
Figure A2: Total nutrition allocations and spending in Mainland Tanzania ...................................... 5
Figure A4: Expenditures by broad nutrition categories (2014/15 – 2015/16) .................................. 7
Figure A3: Total nutrition allocations and spending in Zanzibar (2015/16 and 2016/17) ................ 11
Figure A4: Expenditures by broad nutrition categories (2015/16 – 2016/17) ................................. 12
Figure 1. Share of local resources in the development budget (2010/11 – 2017/18) .................. 25
Figure 2. Conceptual framework of the determinants of child undernutrition (UNICEF 1990) ..... 27
Figure 3. Framework for actions to achieve optimum foetal and child nutrition and development 28
Figure 4. NMNAP coordination structure .................................................................................... 36
Figure 5. Proportions of public spending by economic classification ........................................... 39
Figure 6. Central Government Operations: revenues and expenditures 2013/14-2015/16 .......... 40
Figure 7. LGAs - Approved Budget vs Actual Collection – TZS million ....................................... 41
Figure 8. Fiscal transfers in Tanzania ......................................................................................... 43
Figure 9. Mainland Tanzania: total nutrition allocations and spending (TZS Million) ................... 52
Figure 10. Sectoral distribution of expenditures by level of government, 2014/15 – 2015/16 (excluding civil servant salaries) .................................................................................................... 58
Figure 11. Sectoral distribution of allocations 2011/12 to 2014/15 ............................................ 59
Figure 12. LGA budget execution rates for nutrition-related expenditure................................... 61
Figure 13. Nutrition allocations by source (2014/15) ................................................................. 63
Figure 14. Nutrition allocations, by level of government ............................................................ 64
Figure 15. Nutrition expenditures, by level of government ........................................................ 64
Figure 16. Allocations and expenditures by broad nutrition categories (2014/15 - 2015/16) ...... 66
Figure 17. Nutrition-specific expenditures 2014/15 – 2015/16 .................................................. 67
Figure 18. Sources of funding for nutrition specific allocations (2014/15 – 2015/16) ................ 68
Figure 19. Nutrition sensitive national budget allocations and expenditures 2014/15 – 2015/16 .. ................................................................................................................................ 69
Figure 20. Breakdown of nutrition sensitive local budget allocations and expenditures 2014/15 – 2015/16 ................................................................................................................................ 70
Figure 21. Nutrition sensitive local budget allocations and expenditures 2014/15–2015/16 (excluding water supply infrastructure) .......................................................................................... 71
Figure 22. Nutrition enabling environment allocations 2014/15 to 2015/16 ............................... 71
Figure 23. Flow of funds to health facilities ............................................................................... 78
Figure 24. Supply of medicines to health facilities ..................................................................... 78
Figure 25. Proportion of stunted children plotted against nutrition spending per child U5 .......... 82
Figure 26. Number of stunted children plotted against nutrition spending per child U5 ............. 83
Figure 27. Nutritional status of children under 5 in Zanzibar ..................................................... 92

Nutrition Public Expenditure Review: Mainland Tanzania and Zanzibar
© Oxford Policy Management 21
Figure 28. Summary of budget process in Zanzibar .................................................................. 93
Figure 29. Proposed Nutrition coordination in Zanzibar .......................................................... 103
Figure 30. Total nutrition allocations and spending in Zanzibar ............................................... 107
Figure 31. Sectoral distribution of nutrition expenditures in Zanzibar ...................................... 109
Figure 32. Breakdown of Zanzibar nutrition budget allocations by funding source (2016/17) .. 114
Figure 33. Distribution of Zanzibar nutrition budget allocations by source (2016/17) ............... 115
Figure 34. Allocations and expenditures by broad nutrition categories (2015/16 – 2016/17) .. 116
Figure 35. Zanzibar’s nutrition-specific allocations (2015/16 – 2016/17) ................................ 117
Figure 36. Breakdown of nutrition-sensitive allocations and expenditures (Zanzibar).............. 119
Figure 37. Nutrition-sensitive allocations and expenditures (Zanzibar) 2015/16- 2016/17 ....... 120
Figure 38. Breakdown of nutrition sensitive local budget allocations and expenditures 2014/15 – 2015/16 (excluding water supply infrastructure) .......................................................................... 121
Figure 39. Breakdown of enabling environment allocations (Zanzibar) 2015/16 – 2016/17 ..... 122
Boxes
Box 1. Key nutrition terminology ................................................................................................ 28
Box 2. Evidence-based high impact nutrition specific interventions (Lancet 2013) ..................... 29
Box 3. Role of the District Nutrition Officers ............................................................................... 37
Box 4. LGA sources of funding .................................................................................................. 42
Box 5. Note on the use of budget line weights in the methodology ............................................ 46
Box 6. Nutrition categorisation (levels 1 and 2) .......................................................................... 46
Box 7. LGAs in the data analysis sample ................................................................................... 47
Box 8. IT systems at LGA level .................................................................................................. 79
Box 9. Goals of the Zanzibar Food and Nutrition Security Programme .................................... 101
Box 10. Focus of the draft Multi-sectoral National Nutrition Strategy and Costed Implementation Plan .................................................................................................................................. 102
Box 11. Basket Fund: Priority Strategies and Objectives ........................................................ 124
Box 12. Budgeting for shared outcome areas: some international experience ........................ 125

Nutrition Public Expenditure Review: Mainland Tanzania and Zanzibar
© Oxford Policy Management 22
List of abbreviations
BG Budget guidelines
BMI Body Mass Index
CAN Compendium of Actions for Nutrition
CCM Chama Cha Mapinduzi (Party of the Revolution)
CSO Civil Society Organisation
DbyD Decentralisation by Devolution
DFID Department for International Development (of the UK government)
DHIS District Health Information System
DHS Demographic and Health Survey
DNuO District Nutrition Officer
FNP Food and Nutrition Policy
FYDP Five Year Development Plan
GDP Gross Domestic Product
GFS Government Financial Statistics
GNR Global Nutrition Report
HMIS Health Management Information System
ICN2 Second International Conference on Nutrition
IFMS Integrated Financial Management System
IMF International Monetary Fund
IMTC Inter – Ministerial Technical Committee
IYCF Infant and Young Child Feeding
JICA Japan International Cooperation Agency
LGA Local Government Authorities
LGDG Local Government Development Grant
MAM Moderate Acute Malnutrition
MDA Ministries, Departments and Agencies
MIYCAN Maternal, Infant, Young Child and Adolescent Nutrition
MKUZA Mkakati wa Kukuza Uchumi na Kupunguza. Umasikini Zanzibar (Zanzibar Strategy for Growth and Reduction of Poverty)
MLEEYWC-RGZ Ministry of Labour, Empowerment, Elders, Youth, Women and Children (Zanzibar)
MLWEE-RGZ Ministry of Land, Water, Energy and Environment (Zanzibar)
MOAFSC Ministry of Agriculture, Food Security and Cooperatives
MOANLF-RGZ Ministry of Agriculture, Natural Resources, Livestock and Fisheries (Zanzibar)
MOEVT Ministry of Education and Vocational Training
MOEVT-RGZ Ministry of Education and Vocational Training (Zanzibar)
MOFP Ministry of Finance and Planning
MOFP-RGZ Ministry of Finance and Planning – Revolutionary Government of Zanzibar
MOH-RGZ Ministry of Health (Zanzibar)
MOHSW Ministry of Health and Social Welfare
MOWI Ministry of Water and Irrigation
MTEF Medium-Term Expenditure Framework
N4G Nutrition for Growth
NMNAP National Multi-sectoral Nutrition Action Plan

Nutrition Public Expenditure Review: Mainland Tanzania and Zanzibar
© Oxford Policy Management 23
NNS National Nutrition Strategy
OC other charges
ODA Official Development Assistance
OPM Oxford Policy Management
OSR Own-source revenue
PE Personal Emoluments
PEFA Public Expenditure and Financial Accountability
PER Public Expenditure Review
PFM Public Financial Management
PFMRP PFM reform programme
PLANREP Planning, Budgeting, and Reporting system
PMO Prime Minister’s Office
PO President’s Office
PO-RALG President’s Office – Regional Administration and Local Government
PORALGSD President’s Office - Regional Administration, Local Government and Special Departments (RGZ)
RAS Regional Administrative Secretariat
REACH Renewed Efforts Against Child Hunger and Undernutrition
RG Regional Government
RGZ Revolutionary Government of Zanzibar
RNuO Regional Nutrition Officer
SAM Severe Acute Malnutrition
SDG Sustainable Development Goals
SUN Movement Scaling Up Nutrition Movement
SWASH School Wash
TASAF Tanzania Social Action Fund
TDHS Tanzania Demographic and Health Survey
TDHS-MIS Tanzania Demographic and Health Survey and Malaria Indicator Survey
TDV Tanzania Development Vision
TFNC Tanzania Food and Nutrition Centre
TFNP Tanzania Food and Nutrition Policy
TZS Tanzanian Shilling
UNICEF United Nations Children’s Fund
USD United States Dollar
ZFSN Zanzibar Food Security and Nutrition
ZFSNSA Zanzibar Food Security and Nutrition Situation Analysis
ZNNS Zanzibar Multi-sectoral National Nutrition Strategy & Costed Implementation Plan 2014-18 (Draft)
ZSGRP Zanzibar Strategy for Growth and Reduction of Poverty

Nutrition Public Expenditure Review: Mainland Tanzania and Zanzibar
© Oxford Policy Management 24
1 Introduction and context
1.1 PER Objectives
The original objectives of this PER were to:
i. Analyse the level and composition of public expenditure3 on nutrition in Mainland Tanzania
and Zanzibar over three fiscal years (2013/14, 2014/15, and 2015/16).
ii. Provide a baseline of spending against which an independent assessment of progress in
implementing the NMNAP (2016-21) can be made.
iii. Assess whether resources were allocated in accordance with the stated policy priorities as
articulated in the NNS (2011-16).
iv. To the extent possible, assess the efficiency and equity of spending priorities.
v. Assess the institutional mechanisms for the management of public finances for nutrition.
vi. Propose actionable recommendations for targeted improvements in sector expenditure and
budget management performance.
However, data and methodological constraints (see Table 6 and Table 23), have required these objectives to be modified. In particular:
Regarding objective i, the years of analysis were adjusted to 2014/15 and 2015/16 for
mainland Tanzania, and 2015/16 and 2016/17 for Zanzibar.
Regarding objective iii, the PER did not cover the full years for the NNS (namely 2011 –
2016), and
Efficiency and equity analyses (objective iv) were limited by the lack of district level
outcome data.
1.2 Country context
The economy of Tanzania is growing strongly with past and projected annual GDP growth rates of just under 7% (GoT, 2018/19 Budget Guidelines). Economic growth is attributed to advances in mining and quarrying; information and communication; transport and storage; and construction. Inflation is under control. It is projected to run at 4.8% in 2018 against a target of 5%. The current account deficit, which stood at 5.6% of GDP in 2015/16, fell significantly in 2016/17 (from USD 2,954.2 million to USD 1,353.3 million) owing to a substantial decline in imports of goods and services (GoT, 2018/19 Budget Guidelines).
Public debt has risen to 38 percent of GDP at the end of FY 2016/17, up from 21 percent a decade ago. Three quarters of this is external debt. Nonetheless, the IMF reports that fiscal revenue and deficit outturns have been broadly in line with program targets and Tanzania maintains a low risk of debt distress (IMF, January 2018, Country Report no. 18/11).
In common with many of the other countries of the region, recent budgets have been marked by external financial shortfalls and a steady decline in grants. The projected overall fiscal deficit (including grants) is 2.5% of GDP for 2018/19 (cf. 3.8% in 2017/18).
3 Public expenditure is defined as expenditure from Government of Tanzania’s own source revenue, as well as official development assistance. The PER does not attempt to capture or quantify private expenditure (from households and firms) on nutrition.

Nutrition Public Expenditure Review: Mainland Tanzania and Zanzibar
© Oxford Policy Management 25
Political priorities of the administration include the following:
Moving the seat of Government to Dodoma: The idea was first mooted in the early
1970s, but, lack of sufficient political will and money have previously prevented this move.
The move currently underway was announced in July 2016 by President Magufuli. It is
estimated to cost around USD 500 million and should be completed before 2020.4
Fighting corruption and investing in industrialization are key manifesto commitments of
the current government, which wants to ensure that manufacturing accounts for about 40%
of employment by 2020 (Ikulu 2015). With this in mind, the current administration has
committed to a tighter fiscal policy implemented through cut backs on civil service
overheads and tax evaders to accommodate the planned infrastructure improvements.
These are set out in the Tanzania Development Vision (TDV) 2025 which is detailed in five-
year development plans (FYDPs). The current FYDP (2015/16-2020/21)5 is themed
“Nurturing Industrialization for Economic Transformation and Human Development” and
includes major infrastructural developments.
Reducing donor dependency: Tanzania has historically depended on donors for
development assistance. In a renewed push for self-reliance, the 2015/16 and 2016/17
budgets emphasise internal revenue raising and increased efficiency in revenue collection.
The share of the development budget funded from own source revenues (as opposed to
foreign contributions) has risen steadily since the start of this decade (see Figure 1). In
2016/17 approximately 24% of the development budget came from foreign sources.
Figure 1. Share of local resources in the development budget (2010/11 – 2017/18)
Source: MoFP 2017/18 Budget Speech
In a corresponding development, grants fell from 4.7% of GDP in 2010/11 to 1.2% of GDP in 2014/15.
Public financial management reform agenda and fiscal decentralisation: A detailed
account of the PFM landscape in Tanzania is provided in Section 2 (Mainland) and Section
5 (Zanzibar). Tanzania has a mature broadly-focussed PFM Reform Programme. The fifth
phase of this programme (PFMRP V, 2017 – 2022) was launched in July 2017. The most
4 Cost estimate is sourced from Capital Development Authority (CDA), as reported in various news outlets. 5 National Five Year Development Plan (2016/17-2020/21).

Nutrition Public Expenditure Review: Mainland Tanzania and Zanzibar
© Oxford Policy Management 26
recent PFM diagnostic (Ministry of Finance and Planning, 2017) concludes that changes in
public financial management are broadly positive. It highlights achievements in the
comprehensiveness of the budget, the budget preparation process and in transfers to sub-
national governments. At the same time, the assessment identifies challenges in relation to
the level and timing of budget disbursement. It suggests that a significant cause of these
challenges is the failure of grant income to reach budgeted amounts: “a considerable part of
the difference between budget and execution can be explained by the variance in the grants
items, where actual receipts have always been less than 70% of budget and in 2015/16
were less than 35% of budget, due to the suspension of all programme grants (Budget
Support). On average, grants have represented 13% of total revenue, although their
significance has been decreasing over time, largely due to the sharp decline in Budget
Support disbursements.”
Tax revenues in Tanzania have historically been lower than the regional average, but it is a
government priority to improve tax collection. The Budget Outlook for 2018/19 (Ministry of
Finance and Planning, 2018) reports that there has been some recent improvement, and
collections in 2016/17 returned to a level of 14.2% of GDP after dipping to 13.2% in
2015/16.
In Tanzania PFM reform goes hand in hand with significant progress in decentralisation by
devolution (DbyD) both on the mainland and in Zanzibar. The mainland has transferred
powers to locally elected urban and rural councils to manage manpower, revenue
generation, planning and budgeting. Zanzibar has historically operated a centralised budget
system but is now piloting DbyD in the 2017/18 budget in three subsectors (primary
education, primary health, and agricultural extension services). This is elaborated further at
section 7.2.4 below.
1.3 Nutrition global landscape
Malnutrition is a complex issue with many determinants. It is influenced by three broad factors that
cut across sectors: food, health, and care as outlined in the UNICEF Conceptual Framework in
Figure 2 below. These in turn are affected by social, economic and political factors. The
combination and relative importance of these factors differ from country to country. Therefore,
understanding the specific drivers of malnutrition in a given context is critical to delivering
appropriate, effective and sustainable solutions and adequately meeting the needs of the most
vulnerable people. These drivers of malnutrition include immediate causes such as inadequate
dietary intake and infectious disease which are affected by underlying causes such as access to
food, inadequate care, an unhealthy household environment and a lack of health services. These
are in turn shaped by economic and social conditions, national and global contexts, availability of
resources, and governance.
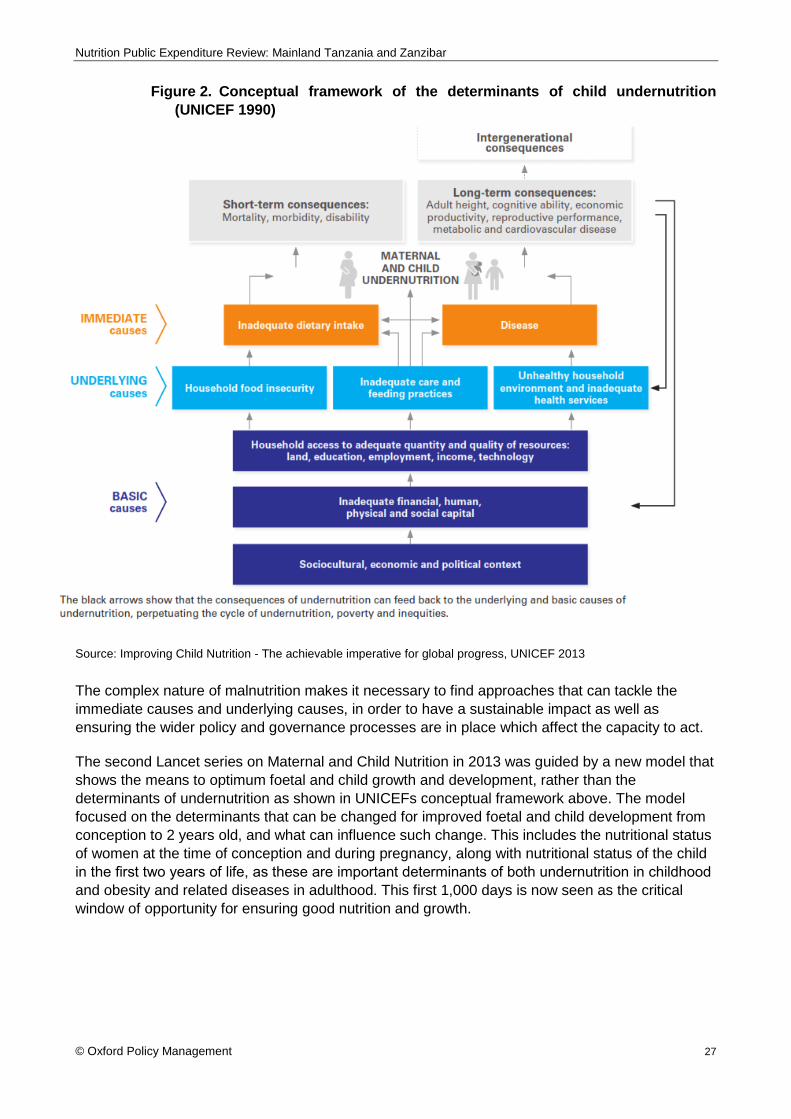
Nutrition Public Expenditure Review: Mainland Tanzania and Zanzibar
© Oxford Policy Management 27
Figure 2. Conceptual framework of the determinants of child undernutrition
(UNICEF 1990)
Source: Improving Child Nutrition - The achievable imperative for global progress, UNICEF 2013
The complex nature of malnutrition makes it necessary to find approaches that can tackle the
immediate causes and underlying causes, in order to have a sustainable impact as well as
ensuring the wider policy and governance processes are in place which affect the capacity to act.
The second Lancet series on Maternal and Child Nutrition in 2013 was guided by a new model that
shows the means to optimum foetal and child growth and development, rather than the
determinants of undernutrition as shown in UNICEFs conceptual framework above. The model
focused on the determinants that can be changed for improved foetal and child development from
conception to 2 years old, and what can influence such change. This includes the nutritional status
of women at the time of conception and during pregnancy, along with nutritional status of the child
in the first two years of life, as these are important determinants of both undernutrition in childhood
and obesity and related diseases in adulthood. This first 1,000 days is now seen as the critical
window of opportunity for ensuring good nutrition and growth.

Nutrition Public Expenditure Review: Mainland Tanzania and Zanzibar
© Oxford Policy Management 28
Figure 3. Framework for actions to achieve optimum foetal and child nutrition and
development
Source: Black et al. Maternal and child undernutrition and overweight in low-income and middle-income countries,
Maternal and Child Nutrition, the Lancet, Series on Maternal and Child Nutrition 2013
The model splits interventions to address the influencing factors into nutrition specific, nutrition
sensitive and enabling environment approaches in order to address the immediate and underlying
causes of malnutrition as well as the supportive governance structures. It is recommended that
these are implemented together in order to achieve the greatest impact on nutritional status of key
target groups.
Box 1. Key nutrition terminology
Nutrition Specific: Nutrition-specific interventions and programmes address the immediate
determinants of foetal and child nutrition and development including inadequate dietary intake and
disease.
Nutrition Sensitive: Nutrition-sensitive interventions and programmes address the underlying
determinants of foetal and child nutrition and development – food security; adequate caregiving
resources at the maternal, household and community levels; and access to health services and a safe
and hygienic environment.
Enabling environment: Nutrition governance and policy process studies broadly concur on three
factors that shape enabling environments: a) knowledge and evidence, b) politics and governance and
c) capacity and resources. This includes developing the structures which facilitate and support the
necessary cross-sectoral cooperation and coordination.

Nutrition Public Expenditure Review: Mainland Tanzania and Zanzibar
© Oxford Policy Management 29
1.3.1 Efficacy of nutrition interventions and rates of return on investment
Good nutrition is not just an outcome of development, but also a driver of economic growth and
human development. A growing body of research shows that the 1,000 days from conception to a
child’s second birthday is the most critical period to intervene to ensure that a child grows to their
full potential physically and cognitively, and so they can contribute fully to the economic and social
development of their community and country. A failure to address nutritional needs at this stage
leads to long term individual consequences. Undernourished children are likely to complete fewer
years of school and have a reduced earning potential of at least 10 percent of their lifetime
earnings. They are also more likely to become overweight and suffer from non-communicable
diseases later in life such as diabetes and heart disease. Annual GDP losses in Africa and Asia are
estimated to average 11 percent per year due to malnutrition (IFPRI 2016).
The Global Nutrition Report (GNR) 2014 described the cost-benefit of scaling up the ten high
impact nutrition specific interventions in the paper by Bhutta et al. in the Lancet 2013 Maternal and
Child Nutrition 2 series (Box 1). They found that scaling up those interventions to 90 percent
coverage would lead to a 20 percent decrease in the rate of stunting. Using the methodology
developed by Hoddinott et al. (2014), which estimated the country-specific benefit-cost ratios for
investments that reduce stunting in 17 high-burden countries, the authors developed country
estimates. They found that the median cost-benefit ratio for achieving this 20 percent reduction in
stunting across 40 countries (including the 17 analysed by Hoddinott et al.) with high levels of
stunting was 16 – i.e. for every dollar invested in nutrition, more than USD 16 would be returned.
Box 2. Evidence-based high impact nutrition specific interventions (Lancet 2013)
The Copenhagen Consensus 2012 identified treating undernutrition as a key global priority. For
about USD 100 per child, a bundle of interventions (including micronutrient provision, and also
complementary foods, treatments for worms and diarrheal diseases, and behaviour change
programs) could reduce chronic undernutrition by 36 percent in developing countries. In very poor
countries, and using very conservative assumptions, the authors found that each dollar spent on
reducing undernutrition could have at least a USD 30 payoff (Hoddinott et al. 2012).
1.3.2 International policies and institutional architecture
Investing in nutrition is increasingly being seen as a key development priority, driven by the
broadening evidence base on the cost of not taking action and the evidence on what works. The
G8 Nutrition for Growth (N4G) commitments in 2013 included greater commitments to improving
the nutrition of pregnant women and young children, reducing stunting and the number of lives lost
due to malnutrition by 2020. The Second International Conference on Nutrition (ICN2) in November
2014 endorsed a Framework for Action, built on existing commitments, frameworks and targets,
and reaffirmed countries’ commitments to reducing malnutrition.
Salt iodisation
Multiple micronutrient supplementation in pregnancy (includes iron-folate)
Calcium supplementation in pregnancy
Energy-protein supplementation in pregnancy
Vitamin A supplementation in childhood
Zinc supplementation in childhood
Breastfeeding promotion
Complementary feeding education
Complementary food supplementation
Severe Acute Malnutrition management
Nutrition Public Expenditure Review: Mainland Tanzania and Zanzibar
© Oxford Policy Management 30
Recent efforts have also been made to set more comprehensive targets for reducing malnutrition.
These include the 2012 World Health Assembly Comprehensive Implementation Plan on Maternal,
Infant and Young Child Nutrition, which specified six global nutrition targets to be reached by 2025
in the areas of: improving stunting; anaemia; low birth weight; exclusive breastfeeding; reducing
wasting; and maintaining levels of childhood overweight. The SDGs capture nutrition directly under
SDG2 - ‘End hunger, achieve food security and improved nutrition and promote sustainable
agriculture’. However at least 12 of the 17 goals contain indicators highly relevant to nutrition.
In support of the ICN2 and the SDGs, the UN General Assembly proclaimed 2016–2025 the UN
Decade of Action on Nutrition for Governments. They asked nutrition stakeholders to unite around
a common programme of work; and to increase visibility, coordination, efficiency and effectiveness
of nutrition action at all levels worldwide with the aim of achieving the existing Global Nutrition
Targets by 2025 and the nutrition-related targets in the Agenda for Sustainable Development by
2030. Tanzania has endorsed the ICN2 outcomes and the SDGs and, through the development of
policies and plans, has started to prioritise nutrition.
1.4 The format of this report
Within Tanzania, Zanzibar has semi-autonomous status. Certain components of government such
as say, defence are Union matters, but others like nutrition are not. In non-Union areas, Zanzibar
pursues its own strategy and policies. Institutions differ between Zanzibar and the mainland, and
so do budgetary arrangements. For instance, there is extensive fiscal decentralisation in mainland
Tanzania, but virtually none in Zanzibar (for the years under consideration).
In recognition of this, our report treats the Mainland and Zanzibar sequentially. Sections 2, 3, and 4
respectively present Context, Methodology, and Analysis for the Mainland; sections 7, 8, and 9
cover the same topics in respect of Zanzibar. This has resulted in some repetition of text across
the two sections, but it enables each to stand alone. Sections 5 and 6, and 10 and 11 present
conclusions and recommendations specific to the Mainland and Zanzibar.

Nutrition Public Expenditure Review: Mainland Tanzania and Zanzibar
© Oxford Policy Management 31
2 Mainland Tanzania: context
2.1 Nutrition landscape
Despite Tanzania’s progress in the reduction of the rates of undernutrition since the early 1990’s,
when the first Tanzania Food and Nutrition Policy (TFNP) was developed, the prevalence and the
burden of undernutrition remains high. Table 1 below shows the trends in key nutrition indicators
between 1992 and 2016 based on the Tanzania Demographic Health Survey (TDHS).
Table 1. Trends of Key Nutritional Indicators for mainland Tanzania
Nutrition Indicator Status (%) Sources
1991-92 2015-16 Trend
Stunting (children (0-59 months) 50 34 ▼ TDHS 2015/16
Wasting (children (0-59 months) 7 5 ▼ TDHS 2015/16
Underweight (children 0-59 months) 24 14 ▼ TDHS 2015/16
Exclusive breastfeeding (children 0-6
months)
26 59 ▲ TDHS 2015/16
Vitamin A deficiency (children 6-59
months)
24
(1997)
33
(2010)
▲ National Vitamin A Survey 1997
TDHS Micronutrient Survey 2010
Anaemia (children 6-59 months) 72
(2004/05)
58 ▼ TDHS 2015/16
Underweight - Body Mass Index <18.5
(women of reproductive age)
10 10 ▬ TDHS 2015/16
Anaemia (women of reproductive age) 48
(2004/05)
45 ▼ TDHS 2015/16
Overweight - Body Mass Index =>25
(women of reproductive age)
11 28 ▲ TDHS 2015/16
Notes: ▼ indicates decrease, ▲ indicates increase, ▬ indicates no change; green indicates favourable
trend, red indicates unfavourable trend.
The level of stunting has declined significantly during this period although there are still significant
regional differences. Figures from the TDHS-MIS 2015-16 show that the percentage of stunted
children under 5 in mainland Tanzania ranged from 28 percent in Shinyanga and Tabora regions to
56 percent in Rukwa region (excluding Dar es Salaam). Underweight shows a similar trend with a
significant decline nationally from 24 to 14 percent over the same period. However again regional
disparities exist. Kilimanjaro has the lowest prevalence of underweight children at 9.2 percent and
Rukwa has the highest level at 23 percent (excluding Dar es Salaam). Wasting has stayed
relatively steady, showing a small overall decline but also with regional differences ranging from
Iringa at 1.2 percent and Arusha at 9.5 percent. In contrast, the level of undernutrition among
women aged 15-49 years old (BMI <18.5) has changed little from 1991 to 2015 and is currently at
9.5 percent
Overnutrition is an issue of growing relevance, particularly in Tanzania’s urban areas as more
sedentary lifestyles take hold and diets change. The prevalence of obesity and overweight

Nutrition Public Expenditure Review: Mainland Tanzania and Zanzibar
© Oxford Policy Management 32
increased from 11 percent in 1991 to 28 percent in 2015-16. Women are as twice as likely to be
overweight if they are from urban areas (42 percent) than those from rural areas (21 percent).
Whilst levels of stunting and underweight have been declining and the rate of wasting is steady,
the same cannot be said for levels of micronutrient deficiencies. Levels of anaemia are particularly
concerning. Although prevalence of anaemia in children declined substantially between 2004-05
and 2010 from 72 percent to 59 percent, from 2010 to 2015 the rate stagnated (59 percent and 58
percent respectively). Anaemia levels in women of reproductive age have actually increased in the
last 5 years from 40 to 45 percent.
The prevalence of vitamin A deficiency in children below 5 years is rising. It was 24 percent in 1997
according to a National Vitamin A survey, but when the last micronutrient survey was carried out in
2010 it had risen to 33 percent. The level of vitamin A deficiency in women is 37 percent (2010).
Exclusive breastfeeding up to 6 months is recommended as breastmilk contains all of the nutrients
that the child needs at that age and is important for a child’s survival and well-being. In Tanzania,
rates of exclusive breastfeeding have been steadily increasing from 41 percent in 2004-05, to 59
percent in 2015.
Overall, it is clear that although progress has been made in the last two and a half decades, there
is still a long way to go. The rate of stunting among under 5 children has dropped significantly
since 2010 but underweight has only declined marginally during the same period. Over half of
under five children still suffer from anaemia. Among women of reproductive age, levels of
underweight have stagnated, whilst the percentage overweight has dramatically increased. Rates
of anaemia have also stagnated. For all of these figures there are striking differences between
regions in prevalence rates. Inequities in child nutrition are also evident with children in the lowest
household wealth quintile recording the stunting levels twice as high (40 percent) compared with
children from the highest wealth quintile (19 percent). There is a need for a renewed focus on
nutrition in order to improve the recent trends and ensure that each individual and Tanzania as a
whole reaches their full potential.
2.2 Policy and institutional framework for nutrition
2.2.1 Government commitment to nutrition
Nutrition has been a policy issue in Tanzania for a number of decades. The Tanzania Food and
Nutrition Act, 1973, paved the way for setting up the Tanzania Food and Nutrition Centre (TFNC).
This was followed by the development of the Tanzania Food and Nutrition Policy (TFNP) in 1992
which guided the nutrition response in the country over the following two and a half decades and
sought to improve the nutritional situation of the Tanzanian community, especially children and
women. Various guidelines for direct nutrition interventions followed including the Policy Guidelines
for Micronutrient Supplementation in 1997, the Tanzania National Strategy on Infant and Young
Child Nutrition in 2004 and National Policy Guidelines on Infant and Young Child Nutrition in 2008.
Nutrition was also being mainstreamed in sectoral policies such as Health, Agriculture, Social
Welfare and Food Security.
The combined evidence base on the impact of malnutrition on individual and national level growth
and what works to significantly reduce the burden have been key drivers in Tanzania’s renewed
commitment to tackling malnutrition (see section 1.3). Tanzania is also a signatory to commitments
at the regional and global level linked to the improvement of nutrition. At the global level the
government signed up to the Sustainable Development Goals, the World Health Assembly
Nutrition Targets 2025, the WHO Global Non-Communicable Disease (NCD) Targets 2025; the

Nutrition Public Expenditure Review: Mainland Tanzania and Zanzibar
© Oxford Policy Management 33
2013 Nutrition for Growth commitments and the East Africa Food and Nutrition Security Policy.
Tanzania is also a member of the Scaling Up Nutrition (SUN) Movement. At the national level,
greater focus has been placed on the development of national level strategies and plans focused
on nutrition, and at the legislative level, the parliamentarian group on nutrition influenced the
incorporation of nutrition in the manifesto of political parties during the 2015 election. Overall, these
actions suggest that nutrition is moving up the political agenda.
2.2.2 Nutrition policy framework
The national nutrition response in mainland Tanzania is guided by the Food and Nutrition Policy
(FNP) which was first developed in 1992 and updated in 2016 to accommodate the multi-sectoral
nature of nutrition with a ten-year implementation strategy. The growing importance of nutrition is
reflected in the TDV 2025, the overarching National Strategy for Growth and Reduction of Poverty
(MKUKUTA) which includes a target of reducing the prevalence of stunting from 42 percent in 2010
to 15 percent by 2025. The national FYDP 2016/17-2020/21 reflects MKUKUTA and includes key
nutrition targets to reach by 2020 and a summarised costing to reach these goals. This
commitment to nutrition is also reflected in the Health Sector Strategic Plans III (2010/11-2014/15)
and IV (2015-2020), the NNS 2011/12-2015/16 and now the NMNAP.
The NNS and Implementation Plan were developed as the first coordinated multi-sectoral
approach to nutrition in Tanzania and included aspects of a Common Results Framework. The
NMNAP covers the five-year period between 2016/17 and 2020/21. It is the current costed
implementation plan for the updated TFNP and is anchored in FYDP II. The approach is consistent
with the 2008 and 2013 Lancet series on Maternal and Child Nutrition. It was also informed by the
international development agenda, particularly on nutrition, including Tanzania’s international
commitments outlined above.
Nutrition interventions are also being incorporated into local government plans, as well as sectoral
policies and strategies in Health, Agriculture, Social Welfare and Food Security and also
programmes including the Tanzania’s Agriculture and Food Security Investment Plan and the
Productive Social Safety Net (PSSN) under the Tanzania Social Action Fund (TASAF).
Both the NNS and the NMNAP are key documents informing this PER. The 3 years covered by the
PER (2013/14 – 2015/16) correspond to the last 3 years of the NNS. However, the PER will also
assess forward budget projections for the following financial year for nutrition relevant
interventions; the first year of the NMNAP. Therefore, the structure and targets of both the NNS
and the NMNAP are key elements to assess the findings of the PER against to understand
whether the focus of finance for nutrition is aligned with the national nutrition plans.
The NMNAP seeks to build on the NNS, further developing and strengthening the multi-sectoral
approach, including the governance structures. Table 2 below outlines the key target groups and
intervention areas for the NNS and the NMNAP. The NMNAP includes a greater focus on
adolescents, adds environment and climate change interventions relevant to nutrition and also
incorporates WASH infrastructure development. Although improved water supply and sanitation
infrastructure can positively affect nutritional outcomes by addressing both immediate and
underlying causes of malnutrition, they are usually considered outside of the remit and scope of
national nutrition plans due to the large investments required. However, costed water supply and
sanitation infrastructure development have been included in the NMNAP.

Nutrition Public Expenditure Review: Mainland Tanzania and Zanzibar
© Oxford Policy Management 34
Table 2. Key Target Groups and Focus Areas of the NNS and NMNAP
NNS NMNAP
Primary Target Groups Women of reproductive age Women of reproductive age
Children under 5 years old Children under 5 years old
Adolescent girls
Nutrition Specific Focus Areas
Infant and Young Child Feeding (IYCF)
Maternal, Infant, Young Child and Adolescent Nutrition (MIYCAN)
Micronutrient Deficiencies Prevention and Management of Micronutrient Deficiencies
Managing Maternal and Child Malnutrition
Integrated Management of Acute Malnutrition (IMAM)
Diet-Related Non-communicable Diseases
Prevention and Management of Diet-Related Non-Communicable Diseases (DRNCDs)
Nutrition Sensitive Focus Areas
Agriculture & food security Agriculture and food security
Health and HIV Health and HIV
WASH WASH
Education Education
Social protection (most vulnerable children)
Social Protection
Environment and climate change
Coordination / M&E Establishing governance structures within and between sectors
Strengthening Multi-sectoral Nutrition Governance
Nutritional Surveillance, Surveys and Information Management
Establishing a Multi-sectoral Nutrition Information System
For any national nutrition plan to be effective, ensuring that it works at an operational level is key.
In Tanzania, it is at the district level where major spending decisions are made, with guidance from
the central and regional levels. Therefore, ensuring that the capacity is in place and sensitisation
activities are carried out in full on nutrition goals at the district level is extremely important for
progress to be made in improving nutritional status of key target groups.
Nutrition activities are incorporated into LGAs’ plans, with District Nutrition Officers (DNuOs) key in
ensuring that nutrition is on the agenda of those working at the community level. However, DNuOs
in most cases have only been in place for the last 1-2 years. To date their ability to significantly
influence the Comprehensive Council Health Plan (CCHP) is limited as the DNuO is only an
observing member of the CHMT. However, there are a number of policy documents in place at the
district level to support the nutrition agenda. These include:
Guideline for Councils for the Preparation of Plan and Budget for Nutrition, Second Edition, October 2012
Allocation of funds for nutrition interventions in the plans and budget of regions, towns, municipal and district councils for the financial year of 2016/17 – 2018/19 (Guidance from PO-RALG)
Nutrition Public Expenditure Review: Mainland Tanzania and Zanzibar
© Oxford Policy Management 35
Minimum nutrition activities to include in district/municipal council and regional secretariat plans - Planning guideline for FY 2016 – 2017
The first document importantly outlines why it is important for districts to prioritise nutrition, how
they can develop a plan, and outlines which sectors can support nutrition activities and what they
should be doing. This includes the health, agriculture, livestock and fisheries, education and
community development sectors. It also specifies entry points to planning for nutrition including the
NNS, national budget guidelines and sector specific planning and budgeting guidelines.
The Ministry of Finance’s national planning and budgeting guidelines stipulate that “councils are
instructed to allocate sector-specific Block Grant, General Purpose Grant, Basket Funds, local own
source revenues and other relevant development grants to locally prioritized interventions for
nutrition, in line with the National Nutritional Strategy”. However, these guidelines were not familiar
to the district officers interviewed for this PER. This could partly be due to the guidelines being
more than 5 years old and staff being more recently appointed to their posts, particularly the
DNuOs.
The second of these documents is a recent letter outlining to district councils that they should
allocate 500 shillings to nutrition interventions aimed at children under 5 in the financial years
2016/17 and 2017/18. It includes a list of key nutrition relevant activities which should be
undertaken including:
Increase knowledge on Infant and Young Child Feeding
Strengthen management of Severe Acute Malnutrition (SAM) and Moderate Acute
Malnutrition (MAM)
Control deficiencies of vitamins and minerals
Strengthen program management
The first 3 of these are in line with both key nutrition specific intervention areas outlined in both the
NNS and the NMNAP, showing where focus should be placed and the most likely areas that
budget allocations and expenditures may be found moving forwards. The third document on
minimum nutrition activities outlines in more detail the sub activities to be implemented under the 4
areas outlined above.
Districts were aware of the requirement to allocate 500 shillings per child for nutrition, but
implementation varied between councils, with some already implementing and others seeing it as
an aspiration as finances at the district level are constrained due to a low revenue base and
insufficient block grants to cover all needs. In other districts it was stated that the budget for
nutrition was already greater than 500 shillings and therefore the instruction had little impact on
existing allocations. This is exacerbated by the generally low priority given to nutrition, with DNuOs
only in position for the last 1-2 years.
2.2.3 Nutrition institutional framework
A multi-sectoral institutional framework for nutrition in mainland Tanzania was established for
implementation of the NNS. Its goal is to coordinate the complex network of actors within and
outside government and to bring greater accountability for nutrition outcomes. This coordination
structure is headed by the multi-sectoral High Level Steering Committee on Nutrition (HLSCN),
placed in the PMO which has convening power to coordinate multi-sectoral activities.

Nutrition Public Expenditure Review: Mainland Tanzania and Zanzibar
© Oxford Policy Management 36
During development of the NMNAP, this basic structure was maintained but adjusted to ensure full
coordination structures and capability from the national to community levels and establishing
stronger links with MDAs and development partners (Figure 4).
Figure 4. NMNAP coordination structure
A number of Government stakeholders are engaged in nutrition, including the following:
PMO (including through the SUN Movement focal person),
President’s Office - Regional and Local Government (PO-RALG)
Ministry of Health, Community Development, Gender, Elderly and Children
Ministry of Agriculture, Livestock and Fisheries
Ministry of Education, Science, Technology and Vocational Training
Ministry of Industry, Trade and Investment
Ministry of Water and Irrigation
Tanzania Food and Nutrition Centre (TFNC)
In the Ministry of Health, Community Development, Gender, Elderly and Children a dedicated
Nutrition Section has recently been created. There is also a parliamentary group on nutrition which
aims to influence policy. Development partners engage and coordinate through a Development
Partners Group and CSOs are engaged through PANITA. The private sector participates in the
dialogue platforms through the Global Alliance for Improved Nutrition (GAIN) network. USAID and
Irish Aid are SUN conveners.
PO-RALG is seen as a crucial link between the Ministries and the Regions and Districts. A PO-
RALG Nutrition Section was created in FY 2016-17 to ensure effective decentralization of nutrition
actions and resources. At the regional level, Regional Nutrition Officers are in place. The role of the
Regional Nutrition Officer (RNuO) includes (i) sensitizing the RAS and Regional Commissioner on
nutritional issues, (ii) coordinating and supporting DNuOs and (iii) acting as a link between PO-
RALG and the DNuOs. It is not clear in how many regions multi-sectoral steering committees,
mirroring the national level, have been set up and are functional.

Nutrition Public Expenditure Review: Mainland Tanzania and Zanzibar
© Oxford Policy Management 37
There are DNuOs in a majority of councils (Box 3) and council steering committees on nutrition
have been set up in many cases but not all. It is the DNuOs responsibility to convene the
meetings. However, as the DNuOs are relatively new and have little decision-making power, it is
difficult for them to carry out this convening role and work with coordinators from other sectors.
Therefore, these committees currently have limited effectiveness in many cases.
Box 3. Role of the District Nutrition Officers
DNuOs come under health and work through the Council Health Management Team (CHMT) when
it comes to planning and budgeting for nutrition activities. However, in many cases the DNuO is not
a core member of that team and has little decision-making power, meaning that nutrition is often
not taken as a priority. There was some evidence to suggest that at the district level, engagement
is taking place with NGOs and CSOs on nutrition activities whether this is coordination of activities
or the NGOs/CSOs are supporting district council led activities.
2.3 PFM landscape
2.3.1 The formal budget process and budget guidelines
The formal budget process and calendar for Mainland Tanzania are set out at Annex F. It follows
an orthodox procedure which begins with the Development of a Macro-Fiscal Framework and 3-
year rolling Medium Term Expenditure Framework. The economic outlook and detailed budget
instructions are set out in the MOFP’s annual Budget and Planning Guidelines.
The budget guidelines elaborate broad spending priorities to be reflected in agency budgets. They
require MDAs and LGAs to “focus on projects and programs with higher multiplier effects as
articulated in the five-year development plans” (MOFP, 2015). For the years of the PER, this
directive led to prioritisation of projects identified under the Big Results Now initiative, which for two
of those years had six National Key Result Areas; energy, water, agriculture, transport, education
and resource mobilization. In 2015/16 health care and the business environment were introduced
as National Key Result Areas.
Budget guidelines specify additional priorities which should be taken into account when preparing
MTEFs. The following are relevant to this PER:
MDAs, RASs and LGAS that implement specific and sensitive nutrition interventions are
required to allocate resources for interventions in accordance with the NNS and the
Implementation plan. LGAs are also called on to ensure a functioning Council Multi-Sectoral
Nutrition Steering Committee and submit quarterly performance reports to PMO-RALG for
consolidation.
RASs and LGAs are also called on to direct resources towards construction, rehabilitation,
maintenance and equipping of social and economic infrastructure, especially in education,
water, health, agriculture, livestock, fisheries and roads sectors in line with national
standards; and to continue to strengthen coordination and attainment of targets set for food
To coordinate all nutrition related activities
Report nutrition activity progress to District Executive Director
To prepare nutrition budgets for submission to the CHMT and coordinate planning with all head of departments
To organise steering committee meetings
To follow up with head of departments on the status of implementing nutrition related activities that were approved.

Nutrition Public Expenditure Review: Mainland Tanzania and Zanzibar
© Oxford Policy Management 38
crop production with special emphasis on the investment projects under Southern
Agricultural Growth Corridor of Tanzania and Tanzania Agriculture and Food Security
Investment Plan
2.3.2 Performance of the PFM system
The 2017 PEFA
In 2017 a national level PEFA assessment (Ministry of Finance and Planning, 2017) was carried out using the new 2016 methodology. The assessment includes regional administrations, but expressly excludes LGAs (although it includes financial and institutional relationships of the national government with LGAs, such as intergovernmental transfers). To make comparison possible, the PEFA authors re-scored the 2017 indicators using the 2011 methodology and developed the following tables:
Table 3. Changes between 2013 and 2017 PEFA assessments
Changes between 2013 and 2017 PEFA assessments (2011 methodology)
Decline by more than 1 score
Decline by 1 score or less
No Change Improved by 1 score or less
Improved by more than 1 score
1 9 9 7 2
Source: PEFA, MOFP 2017 Note: “One score” represents a difference of only one letter, e.g. C→B, whereas C→C+ would be a difference of half a score, and C→B+ would be a difference of one score and a half.
Table 4. Areas of PFM improvement/ deterioration from 2013 to 2017
Areas of improvement 2013-2017 Areas of deterioration 2013-2017
PI-4 (Monitoring of) Expenditure Arrears PI-1 Aggregate Expenditure Out-turn
PI-7 CG Operations outside financial reports PI-3 Revenue Out-turn
PI-8 Transfers to SN Governments PI-5 Budget Classification
PI-9 Oversight of aggregate Fiscal Risk of Public Sector
PI-6 Budget Documentation
PI-11 Orderliness & Participation in Budget process
PI-13 Transparency of Taxpayer Obligations
PI-18 Payroll Controls PI-16 Predictability in the availability of funds for commitment of expenditures
PI-19 Competition, value for money & controls in Procurement
PI-23 Availability of information on resources received by Service Delivery units
PI-26 External Audit PI-24 In-year Budget Report
PI-28 Legislative scrutiny of External Audit reports
Source: PEFA, MOFP 2017
Effective budgets for nutrition can only exist within a strong public financial management system. Consequently, almost all issues raised in the PEFA affect the delivery of nutrition services.
The PEFA noted that the PFM system faces challenges in terms of arrears and predictability in availability of funds. Arrears now represent 10% of total expenditure and a significantly higher

Nutrition Public Expenditure Review: Mainland Tanzania and Zanzibar
© Oxford Policy Management 39
proportion of development and goods and services spending6. Settlement of arrears undermines in-year availability of funds and the implementation of plans and service delivery. In the context of nutrition, it is significant that the PEFA did not cover local government spending which is responsible for approximately two thirds of nutrition-related expenditures. Nonetheless, it is understood that significant arrears also exist at the local level7.
The PEFA identifies weakness in revenue out-turns and administration as a key concern and further details are presented at 2.3.3 below. Greater mobilisation of domestic resources is key in the generation of financial sustainability and fiscal space for nutrition interventions. More than that, it is much easier to secure more funding for activities where tax revenues are rising than where they are stagnant.
A fifth area of comment is on transfers to subnational governments which is noted as an area of improvement in the PEFA. However, at the same time it reports that the system for allocating transfers uses “administratively determined norms, which since 2013/14 have been adopted in a relatively ‘ad hoc’ manner” and awards it a “D” score. This has serious implications for equity and for efforts to ensure that provision of budget for nutrition interventions responds to need. It is elaborated at Section 4.3.
2.3.3 Public expenditure trends
The 2017 PEFA reports data analysed by economic classification as follows: –
Figure 5. Proportions of public spending by economic classification
Source: based on IMF staff report following article for consultation, July 2016, reproduced from PEFA 2017. NB Slight
differences caused by rounding.
6 57% of identified arrears are for construction, and 30% for Goods and Services (MoFP, 2017). Very little relates to staff costs. 7 The Local Government report of the Auditor General for 2016/17 indicated that “long outstanding payables” at LGAs amounted to TZS 166 billion against total expenditures of TZS 2,185 billion (Development TZS 471 billion and Recurrent TZS 1,714 billion) or about 7.5%.
28% 32% 28% 32%
38% 34%34%
32%
7% 9%8% 9%
26% 25% 30% 27%
0%
10%
20%
30%
40%
50%
60%
70%
80%
90%
100%
2012/13Actual
2013/14Actual
2014/15Actual
2015/16Projection
Capital expenditure
Current – Interest payments
Current – Goods and services including transfers
Current – Wages and salaries

Nutrition Public Expenditure Review: Mainland Tanzania and Zanzibar
© Oxford Policy Management 40
Of the expenditures, around three quarters are for recurrent expenditure (salaries, goods and
services) and the remaining quarter is for investment. However, policy is to increase the
investment proportion significantly.
Figure 6 below shows central government revenues and expenditures for the period of the PER.
Average public expenditure over the period has been 18% of GDP, and revenues have moved
slightly above and below 14%, with minimal changes between the years.
Tax revenues in Tanzania have historically been lower than the regional average, although it is a
priority of the Government to improve tax collection The Budget Outlook for 2018/19 (Ministry of
Finance and Planning, 2018) reports that there has been some improvement, and collections in
2016/17 returned to a level of 14.2% of GDP after dipping to 13.2% in 2015/16. PEFA 2017 scores
revenue administration at “C+” noting that the system falls short of the high standards required of a
modern tax administration. External financing shortfalls in 2016/17 meant that development
expenditure was lower than programmed, and budget execution was slower in 2016/17 (IMF
2017).
Figure 6. Central Government Operations: revenues and expenditures 2013/14-
2015/16
Source: MoFP
2.4 Fiscal Decentralization
2.4.1 Fiscal decentralisation and intergovernmental fiscal transfers
Mainland Tanzania is fiscally decentralised, with certain service delivery functions and expenditure responsibilities devolved to the local level. Most nutrition spending is found at the LGA level. Analysis in UNICEF Budget Briefs estimated that 70% of Government nutrition expenditures are made by LGAs, and this analysis supports that conclusion. LGAs continue to be highly dependent on central government. For the last three years LGAs’ own source revenue has covered only 11% of recurrent expenditure, with central government covering the other 89% (United Republic of Tanzania, 2018:20).
Own source revenue is small in proportion, and generally under collected. Figure 7 below shows
the three-year trend of approved budgets versus actual collections for LGAs’ own source revenue:
15.6
12.8
14.4
18.517.1
18.3
0
2
4
6
8
10
12
14
16
18
20
2013/14 2014/15 2015/16
% o
f G
DP
revenues expenditures

Nutrition Public Expenditure Review: Mainland Tanzania and Zanzibar
© Oxford Policy Management 41
Figure 7. LGAs - Approved Budget vs Actual Collection – TZS million
Source: National Audit Office. United Republic of Tanzania, 2018
The under collection for 2016/17 is greater than either of the previous two years at 16.6%, although this was against an increasingly ambitious target. In absolute terms, the revenue collection levels have increased year on year over the period of analysis.
Box 4 summarises key transfers from the central government to the LGAs and composition of spending of own-source revenue.
471,192
536,204
628,045
409,100
482,899
523,565
-20%
-16%
-12%
-8%
-4%
0%
0
100,000
200,000
300,000
400,000
500,000
600,000
700,000
2014/15 2015/16 2016/17
Approved Budget
Actual Collection
Variance %

Nutrition Public Expenditure Review: Mainland Tanzania and Zanzibar
© Oxford Policy Management 42
Box 4. LGA sources of funding
Source: Sub-national PEFA Assessment in Tanzania (2016); author’s adaptation from key interviews at LGAs
The three main types of financial transfer for service delivery in LGAs (ODI, 2014) are shown in Figure 8. They are:
recurrent block grants (composed of specific allocations for Personal Emoluments (PE) and others for other charges (OC)),
subventions (including basket funds), and
capital development grants (fund LGA infrastructure and include the discretionary Local Government Development Grant (LGDG) and sector development grants).
Every LGA has two main sources of revenue: transfers from the central government and own source
revenues. Transfers from the central government can be further classified into:
Capital Development Grant (which does not include any restrictions on expenditure, bar that it must be for capital expenditure)
Recurrent Block Grant covering operating charges for different departments
Subventions or donor interventions (health basket fund, TASAF, water and sanitation programmes)
LGAs rely heavily on transfers from the central government. In 2013/14, 93% of LGA’s total revenues were financed from central government grants (sub-national PEFA, 2016) although this has reduced to 70% in FY 2015/16 (PEFA, 2017).
Every LGA is required to maintain eight bank accounts into which funds are transferred: personal emolument account, operating charges, own source, development, health sector, water sector, education, road fund and other miscellaneous account.
Sources of funding to the local health sector: The HBF constitutes the most reliable source of funding to the health sector. The formula for allocation of the HBF to different LGAs is based on three variables: number of health facilities (HC, dispensary, hospital), data related to disease prevalence and population. Other sources of funding include:
Health OC from the central government: used to meet basic administrative expenses of health care facilities and dispensaries
CDG (construction activities)
Community Health Fund (CHF): collected and used by health facilities
National Insurance Fund (NIF): collected and used by health facilities
Other donor programmes

Nutrition Public Expenditure Review: Mainland Tanzania and Zanzibar
© Oxford Policy Management 43
Figure 8. Fiscal transfers in Tanzania
Source: ODI 2014.
In 2004/05, GoT introduced a system of formula-based allocations to make them more transparent and needs based. Formulas were developed for each sector block grant as well as for the development grants under the LGDG system. However, it was not possible to include PE allocations as part of the formula-based system because the LGA staff allocation system is centralised.
Since 2013/14 the formula approach has largely fallen away (Ministry of Finance and Planning, 2017). Personnel Emoluments are allocated to correspond with staff deployment and OC allocations are now primarily administratively determined. Allocations for Development spending come from two sources: (i) project allocations decided through the submission of project proposals by LGAs to PO-RALG and MoFP, as well as external funding agencies, and (ii) the Local Government Capital Development Grant (LGCDG) scheme.
Capital Development Grants are routinely not released in full. The National Audit Office reports that under-releases as a percentage of approved CDG budget were as follows: 2016/17: 51%; 2015/16: 61% and 2014/15: 52% (National Audit Office, 2018:23).

Nutrition Public Expenditure Review: Mainland Tanzania and Zanzibar
© Oxford Policy Management 44
3 Mainland Tanzania: methodology
This chapter sets out the methodology for data analysis and fieldwork, as it was applied to the mainland Tanzania component of this PER.
3.1 Data analysis and data availability
3.1.1 Years of analysis
Whilst the initial plan was to cover years 2013/14 – 2015/16, the final analysis for mainland Tanzania instead covers fiscal years 2014/15 and 2015/16. The reason for the adjustment was that at the LG level, expenditure files were not available for 2013/14 by the time PER data analysis was conducted Without these it was not possible to identify the object of expenditures, and therefore whether or not a particular line related to nutrition.
3.1.2 Sources of data
The table below summarises the sources of data for the mainland Tanzania element of the PER.
Table 5. Data sources - Mainland Tanzania
Level of Government Source
National level data Expenditure data covering all relevant MDAs was sourced from the
national IFMS (through MOFP)
The chart of accounts code descriptors (which were required to
understand the nature of expenditures in the IFMS report) were
sourced from MDA MTEFs, which were provided by individual MDAs.
Local level data Historical itemized commitment and expenditure reports for sample
LGAs were sourced from the LG EPICOR system (through
PORALG).
The chart of accounts code descriptors (which were required to
understand the nature of expenditures in the LGA expenditure
reports) were sources from LGA performance budget framework
chapter of LGA MTEFs, which were generated from the PLANREP
system (also under the purview of PORALG).
Donor data On budget aid data was provided as part of the above reports
Off budget aid data was collected through a separate template and
data request issued to development partners (see Annex B)
Demographic data Sourced from National Bureau of Statistics; 2012 census and
subsequent projections
Nutrition outcome data TDHS 1991/92, TDHS 2004/05, TDHS 2015/16, National Vitamin A
Survey 1997, TDHS Micronutrient Survey 2010

Nutrition Public Expenditure Review: Mainland Tanzania and Zanzibar
© Oxford Policy Management 45
3.1.3 Data collection, consolidation, classification and cleaning processes
At the time that the analysis was conducted, Tanzania’s financial management information systems had no dedicated marker – be it a cost centre or other means – through which nutrition could be identified. This meant that the tracing of nutrition budget lines was a manual process.
For national-level data, the collection, consolidation, cleaning and classification process consisted of the following steps:
1. Collection of expenditure reports and medium-term expenditure frameworks (MTEFs): An expenditure report was generated by MOFP from the IFMS, to the PER specifications (see data request in Annex C). However, a considerable limitation of the IFMS system in Tanzania is its inability to generate reports which include text descriptions of chart of account code segments, in particular segment 2 which specifies the nature of the objective, target and activity, of the associated expenditure line. In lieu of such text descriptions (such as “build 3 school pit latrines”), the report only provide a six digit code. Identifying the meaning behind each segment 2 code, required cross referencing against the segment 2 descriptions contained in ministry MTEF documents.
2. Identification of relevant expenditure lines: A central aspect of the PER methodology was how to determine whether or not a budget line should be considered nutrition-related. A full account of the approach adopted is set out in Annex H.
In short, a list of key terms was devised which related to the areas of nutrition relevance, as derived from the Tanzania National Multisectoral Nutrition Action Plan (NMNAP), the Compendium of Actions for Nutrition (CAN) developed by the SUN UN Network / REACH, the SUN 3-Step Approach guidelines for Tracking Government Investments for Nutrition at Country Level, and the Budget Analysis for Nutrition: guidance note for countries.
These terms were used as a guide to identify nutrition-related activities; pragmatic variations on the terms were still included, and not all budget lines including these terms were deemed nutrition-related. Nevertheless, the identification of key terms was used to bring some objectivity and consistency to the process.
In the case of national level expenditure, this identification process was initially done against the MTEF, and then mapped over to the expenditure file. Because of the nature of nutrition being a widely dispersed, cross-sectoral activity, the identification process necessitated a systematic review of the entire MTEF of all relevant MDAs; there were no significant “shortcuts” to this process.
3. Categorisation of relevant expenditure lines: A full account of the categorisation approach is set out in the second part of Annex H. Two levels of categorisation were undertaken according to the groups and subgroups set out in the NNS and NMNAP (see Box 6).
In addition, it was necessary for some budget lines, to assign an apportionment percentage. This is an estimate of what portion of a budget line is associated with nutrition, in instances where a line was deemed to be broader than the nutrition activity alone. For example “provision of medicines, medical supplies & equipment to health facilities”, is likely to include nutrition (specific and sensitive) related supplies, but not all supplies would be nutrition related. The approach for apportionment is described in full in Annex H. In summary, wherever possible, an objective basis was sought to determine an apportionment percentage between 0-100%, including interview notes and policy documents. In other instances, the activity description was used (for example, 33% apportionment percentage was applied to the budget line “support education service to special school for deaf on meals, electricity and transport” because the school feeding component is nutrition sensitive, but electricity and transport are not). The basis for this estimate is noted against each relevant budget line in the database. Where an objective basis for arriving at this

Nutrition Public Expenditure Review: Mainland Tanzania and Zanzibar
© Oxford Policy Management 46
apportionment value could not be identified, a default value of 10% was applied. This is a conservative estimate and is open to revision upon the identification of better evidence.8
Box 5. Note on the use of budget line weights in the methodology
4. Consolidation and consistency check: the data sets for all MDAs were then consolidated to form a single national level dataset of 14,000 lines, and consistency checks taken out (concerning, for instance, standardisation in categorisations, and standardisation in apportionment of salaries).
Box 6. Nutrition categorisation (levels 1 and 2)
Level 1 Categorisation Level 2 Categorisation
Nutrition specific Maternal, Infant, Young Child and Adolescent Nutrition (MIYCAN)
Prevention and Management of Micronutrient Deficiencies
Integrated Management of Acute Malnutrition (IMAM)
Prevention and Management of Diet-Related Non-Communicable Diseases
unknown / multiple nutrition specific
Nutrition sensitive Nutrition Sensitive
Health
Agriculture
Wash
Education
Social Protection
Environment and climate change
8 NB some nutrition budget analysis methodologies have sought to “weight” nutrition- sensitive expenditure to make it more comparable to nutrition specific expenditure. This is not the objective here. Rather the apportionment percentage implies what portion of the budget line is associated with nutrition (be it specific or sensitive) and does not give apply any greater intrinsic value to nutrition specific over nutrition sensitive.
The goal of nutrition specific interventions is to directly impact on nutrition outcomes. On the other hand, nutrition sensitive interventions, which address the underlying determinants of nutrition, are often achieved by incorporating nutrition-relevant actions and goals into larger programmes which have much broader aims. Hence, some nutrition budget analysis methodologies have sought to “weight” nutrition-sensitive expenditure to make it more comparable to nutrition specific expenditure. However, the evidence base on what values these weights should take is limited (Greener et al., 2016), likely to vary by operating context and programme design, and the value that this process adds is questionable.
The most recent guidelines from the SUN Movement proposes an approach which is based on two steps (identification and categorisation) with one optional step (weighting). It clarifies the optional step by stating that it is not recommended to go through the process of weighting unless it can be informed by within project level analysis (Fracassi et al, 2017).
The NMNAP opted not to weight nutrition sensitive spending in its costing, for pragmatic purposes (the full cost of a nutrition sensitive programme would need to be covered for the nutrition-related outcomes to be registered). For the same reason and based on the latest international evidence presented above, this PER does not weight nutrition-sensitive spending in such a manner. Rather the apportionment percentage which has been employed and is described here, relates to what portion of the budget line is associated with nutrition (be it related to specific or sensitive interventions), and does not give any greater intrinsic value to nutrition specific over nutrition sensitive interventions.
Fracassi P, Picanyol C, Knechtel W, D’Alimonte M, Gary A, Pomeroy-Stevens A, Watts R
“Budget Analysis for Nutrition: guidance note for countries (update 2017)”, available at http://docs.scalingupnutrition.org/wp-content/uploads/2017/10/2017-Guidance-for-Budget-Analysis_EN.pdf

Nutrition Public Expenditure Review: Mainland Tanzania and Zanzibar
© Oxford Policy Management 47
Enabling Environment Nutrition surveillance, surveys and information management
Nutrition governance (Plans, policies, coordination, capacity)
For the subnational-level data, the process was similar but more extensive, primarily because of the need to employ a sampling approach, the non-consolidated nature of local government expenditure files, and issues around data quality which required more extensive cleaning. In brief, the collection, consolidation, cleaning and classification processes at the subnational level consisted of the following steps:
1. Identification of a sample: A sample of 22 LGAs was selected to conduct data analysis on. A full account of the rationale for the selection of the LGAs is given in Annex E, and the resulting distribution of the sample is summarised in the box below.
Box 7. LGAs in the data analysis sample
2. Collection of expenditure reports and performance budget frameworks: historical itemized commitment and expenditure reports for sample LGAs were generated from the EPICOR system. However, in line with the national level experience, understanding the nature of activity codes in these reports required cross referencing against individual LGA performance budget frameworks (which form part of the local government MTEF).
Upon reviewing these reports, a significant number of them were either corrupt or mislabelled (for a different year than indicated, or a different LGA altogether). As a result, some LGAs were removed from the sample and replaced with others where the correct files were available.
3. Consolidation: Expenditure reports and performance budget frameworks which were issued from the EPICOR and PLANREP systems, cannot be generated in a consolidated format (i.e. a single file). Therefore, for each LGA and for each year of analysis, a consolidation process was undertaken which matched expenditure lines from the expenditure report, to the objective and activity descriptors from the performance budget framework, using the chart of account code as the basis for matching. However in the case
For the mainland data analysis, a sample of 22 LGAs were selected for detailed budgetary analysis. These were selected on the basis of data availability, ensuring regional spread, variation in stunting levels, and a mix of rural and urban councils. Other factors such as ensuring some overlap with districts visited in fieldwork and lower MTEF/expenditure file “unmatch rates” also informed the selection process. In practice the data availability was the predominant selection factor due to significant constraints around unavailable or incomplete expenditure and Planrep files.
The full list of sampled LGAs is presented in Annex E. The sample has the following distributional features:
32% urban councils and 68% rural (population: 22% urban, 78% rural)
Mean stunting prevalence rate: 36.7 (population: 34%)
Coverage of 12 regions in 4 Zones:
o Southern Highlands: Iringa (2), Mbeya (3), Njombe (2), Ruvuma (2)
o Coastal: Pwani (1), Mtwara (1), Morogoro (3)
o Central: Dodoma (2), Singida (1), Tabora (2)
o Northern: Tanga (1), Kilimanjaro (2)

Nutrition Public Expenditure Review: Mainland Tanzania and Zanzibar
© Oxford Policy Management 48
of most LGAs, there were a portion of budget lines which couldn’t be matched; i.e. lines in the expenditure files, for which there was no discernible equivalent line in the performance budget framework. This was likely due to miscoding in LG accounts, and was problematic as it meant the team had limited ways determining what those lines relate to, and whether it is nutrition. Given that the team were unable to go to individual LGAs to understand the nature of every unmatched budget line, those local governments in the subnational sample which had a high proportion (>40%) of unmatched lines were replaced in the sample.
4. Identification of relevant expenditure lines: This process mirrored the approach adopted for the national level dataset, set out above, using the key terms list in in Annex G. Given the disparate and multisectoral nature of nutrition activities, this involved a systematic and comprehensive review of over 65,000 lines of budget data.
5. Categorisation of relevant expenditure lines: the approach adopted was identical to that which is set out above (for the national level), using the categories set out in Box 6.
6. Consistency check: a final consistency check across the whole subnational data set sought to maximise standardisation in the identification and categorisation process.
3.1.4 Data coverage, gaps, and limitations
The table below provides a summary of the data which is included in the Mainland Tanzania PER dataset, as well as known gaps.
From these, the most significant data issues are considered to be:
Pervasive quality issues in local government expenditure reporting;
The 52 non-sample LGAs for which there was no credible basis, in the form of a total expenditure figure, on which to estimate nutrition spending;
Within the sample, the budget lines for which we could not identify objective and activity descriptions in corresponding MTEFs (which could account for up to 40% of LG expenditure).
Readers should be cognisant of these gaps when reviewing the analysis in chapter 4 below.

Nutrition Public Expenditure Review: Mainland Tanzania and Zanzibar
© Oxford Policy Management 49
Table 6. Data coverage, gaps and limitations – Mainland Tanzania
Source Coverage Gaps and limitations
National -
government
The following MDAs are included in the analysis:
Ministry of Health and Social Welfare (MOHSW) (including
TFNC)
Ministry of Agriculture, Food Security and Cooperatives
(MOAFSC)
Prime Minister’s Office (specifically, vote 37)
Ministry of Water and Irrigation (MOWI)
Tanzania Social Action Fund
The following are excluded from the dataset because requests for MTEFs were not available
by the time analysis was conducted, or they were not part of the IFMS dataset provided by
MOFP, and are expected to include some nutrition-sensitive expenditures:
Ministry of Education, and Vocational Training (MOEVT)
Ministry of Livestock and Fisheries
Regional
government
All Regional Administrative Secretariats are excluded because the MTEFs required to
analyse their IFMS data records were not available centrally.
Local
government
Data was collected for a sample of 22 districts (see Annex E)
For an additional 89 LGAs, estimates of nutrition expenditure
were arrived at by multiplying total LGA expenditure, by the
average share of expenditure found to be nutrition related in
sample LGAs of the same type (rural/urban), for the year in
question.
Within the sample 22 districts, there were a portion of budget lines in all bar one district
which could not be matched to objective and activity descriptors, and therefore it could be
ascertained as to whether or not these related to nutrition.
There were concerns about the quality of LG expenditure reporting, in particular due to the
high frequency of significant negative expenditures, and some instances where
unrealistically high execution rates (over 200%) were being reported. LGAs whose datasets
were most beset by these data quality issues were removed from the dataset and replaced
with estimates based on a straight average of nutrition spending of LGAs in the dataset
For 52 LGAs, total expenditure figures were not available or were inaccurate, and so there
was no obvious basis on which to estimate their nutrition expenditure. To account for this
gap, some of the analysis in chapter 4 includes estimates for the 52 LGAs, based on a
straight average nutrition expenditure from the sample.
Development
partners
On budget aid and some off budget is included (specifically, off-
budget programmes managed by Catholic Relief Services, Pact,
CUAMM, International Potato Centre, Helen Keller International,
The Centre for Counseling, Nutrition and Health care, and
UNICEF).
Other off-budget development partners were unresponsive to repeated data requests. As a
result, significant off budget nutrition sensitive ODA has not been captured.
Cross-cutting A large number of lines were identified as partially nutrition related, but there was no
objective basis by which to assign an apportionment percentage. For these, a conservative
estimate of 10% was applied.

Nutrition Public Expenditure Review: Mainland Tanzania and Zanzibar
© Oxford Policy Management 50
3.2 Field work and interviews
In addition to an inception visit, two phases of fieldwork were conducted.
The first involved two-day training for key central and local government officials in advance
of the main fieldwork. This served the dual purpose of sensitising a broader group of key
government stakeholders on the purpose and value of the PER and facilitated preparation
for the subsequent interviews and data collection.
Following this, the main phase of fieldwork was conducted over two weeks in July 2017. The
primary purpose of this was to interview key informants in selected LGAs and nutrition
relevant MDAs to understand nutrition planning and budgeting processes and related
institutional arrangements. An additional intention for the fieldwork had been to validate the
expenditure data with government to understand emerging trends. However, the team’s
ability to do so was negated by the fact that delivery of the data was significantly delayed,
and the fieldwork could not be postponed. However, the report has benefitted from
reflections provided by stakeholders during validation meetings held in July 2018.
Annex A presents a list of the institutions and individuals met during the fieldwork. Three teams composed of OPM consultants and government officials worked simultaneously to conduct interviews with central level GOT, six LGAs9 and key development partners. The LGAs visited in fieldwork were selected based on an agreed set of criteria in order to capture geographic, nutritional status and funding differences among others. The chosen LGAs and the full rationale are outlined in Annex D.
9 Five LGAs on mainland Tanzania were visited during the fieldwork in addition to the first LGA covered in inception.

Nutrition Public Expenditure Review: Mainland Tanzania and Zanzibar
© Oxford Policy Management 51
4 Mainland Tanzania: analysis
4.1 Level and composition of nutrition spending
4.1.1 Aggregate nutrition spending
Table 7 below indicates that estimated nutrition allocations in Tanzania grew by 19%, from
TZS 905bn to TZS.1,082bn between 2014/15 and 2015/16. Both figures are likely to be
underestimated as a result of remaining data gaps including off-budget grants, MOE, and
Regional Secretariats. However, some allocations were significantly underspent. Actual
expenditures grew by a more modest 5% overall between 2014/15 and 2015/16, mostly as a
result of a 12% increase in central government spending on nutrition.
By contrast, LGA spending was almost unchanged between the two years in nominal terms
– a reduction in real terms10. The substantial growth in off-budget donor funds is due to an
increase of partners spending on large scale stunting reduction programmes.
Table 7. Mainland Tanzania: total nutrition allocations and spending (TZS Million)
TZS 2014/15 2015/16
Source Nutrition approved
estimates Nutrition
actuals Nutrition approved
estimates Nutrition
actuals
Central government 384,230.9 340,735.3 457,480.4 381,971.1
LGAs estimate 514,041.5 469,768.9 614,234.4 469,488.4
Off-budget donors 6,454.1 4,966.0 10,401.8 9,231.1
Grand Total 904,685.0 815,470.2 1,082,116.6 860,690.6
Source: PER dataset. Notes: Includes qualifying nutrition specific, sensitive, and enabling environment allocations
and actuals. The LGAs Estimate includes the 22 LGAs for which actual data was reviewed; 89 LGAs for which
global spending data was available and the nutrition proportion was pro-rated; and 52 LGAs for which no data was
available which were assumed to have spent at the average rate of the other 111 (22+89) LGAs.
However, these figures include on-budget aid, and disguise a worsening trend of
government spending on nutrition from its own sources. In particular, central government
spending above includes World Bank funding for the TASAF cash transfer, which grew from
TZS 49 bn in 2014/15, to TZS 221 bn in 2015/16. Stripping TASAF out of the figures below
reveals a decline in central government nutrition expenditure of 45%, from TZS 291.7 bn to
TZS 160.9bn.
In 2015/16 only 83.5% of central government nutrition budgets were spent, and only 76.4%
of the LGA nutrition budgets. This shortfall of actual spending against budget is consistent
with the issue of approved budgets not being released in full or on time. A full analysis
requires an understanding of how far the underspends result from the lack of funds (short or
late releases from central government, or under collection of own source funds, especially by
LGAs) and how far they arise because implementing agencies failed to spend available
10 Inflation hovered around 6% for most of the period under review. As a result, even the 5% overall increase did not keep pace with inflation.
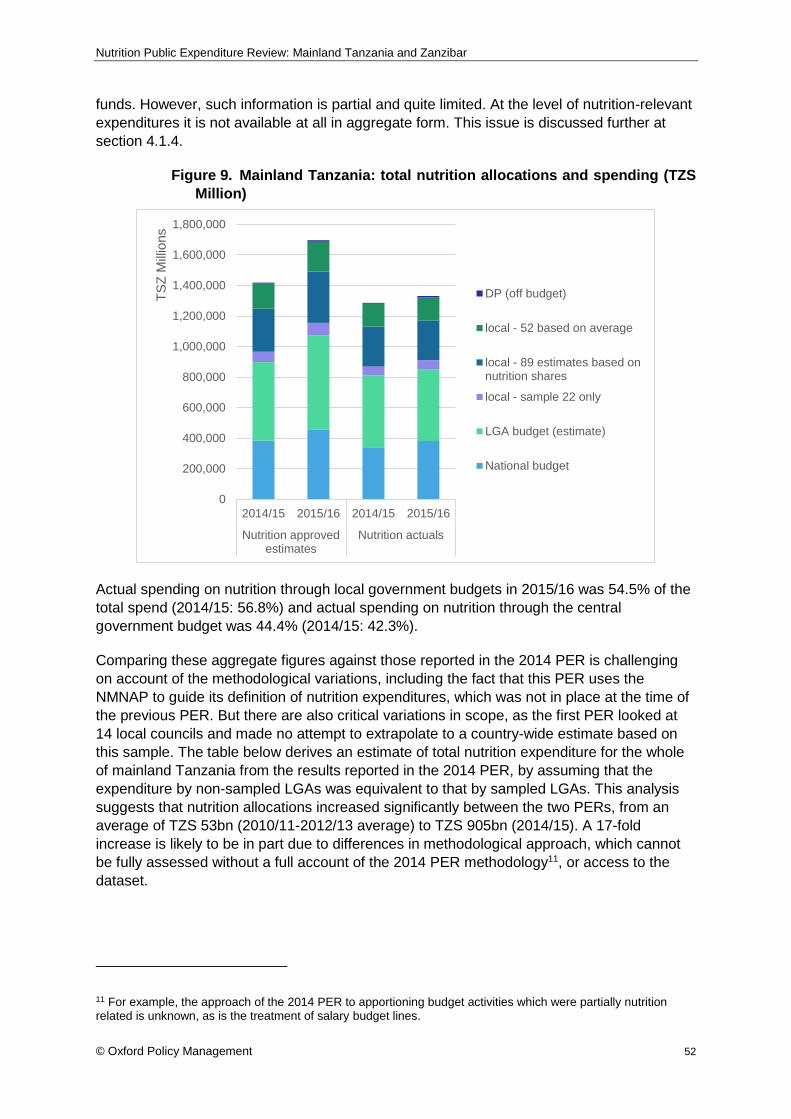
Nutrition Public Expenditure Review: Mainland Tanzania and Zanzibar
© Oxford Policy Management 52
funds. However, such information is partial and quite limited. At the level of nutrition-relevant
expenditures it is not available at all in aggregate form. This issue is discussed further at
section 4.1.4.
Figure 9. Mainland Tanzania: total nutrition allocations and spending (TZS
Million)
Actual spending on nutrition through local government budgets in 2015/16 was 54.5% of the
total spend (2014/15: 56.8%) and actual spending on nutrition through the central
government budget was 44.4% (2014/15: 42.3%).
Comparing these aggregate figures against those reported in the 2014 PER is challenging
on account of the methodological variations, including the fact that this PER uses the
NMNAP to guide its definition of nutrition expenditures, which was not in place at the time of
the previous PER. But there are also critical variations in scope, as the first PER looked at
14 local councils and made no attempt to extrapolate to a country-wide estimate based on
this sample. The table below derives an estimate of total nutrition expenditure for the whole
of mainland Tanzania from the results reported in the 2014 PER, by assuming that the
expenditure by non-sampled LGAs was equivalent to that by sampled LGAs. This analysis
suggests that nutrition allocations increased significantly between the two PERs, from an
average of TZS 53bn (2010/11-2012/13 average) to TZS 905bn (2014/15). A 17-fold
increase is likely to be in part due to differences in methodological approach, which cannot
be fully assessed without a full account of the 2014 PER methodology11, or access to the
dataset.
11 For example, the approach of the 2014 PER to apportioning budget activities which were partially nutrition related is unknown, as is the treatment of salary budget lines.
0
200,000
400,000
600,000
800,000
1,000,000
1,200,000
1,400,000
1,600,000
1,800,000
2014/15 2015/16 2014/15 2015/16
Nutrition approvedestimates
Nutrition actuals
TS
Z M
illio
ns
DP (off budget)
local - 52 based on average
local - 89 estimates based onnutrition shares
local - sample 22 only
LGA budget (estimate)
National budget

Nutrition Public Expenditure Review: Mainland Tanzania and Zanzibar
© Oxford Policy Management 53
Table 8. Estimated aggregates from 2014 Nutrition PER (TZS millions)
TZS Nutrition allocations
Source 2010/11 2011/12 2012/13 Average
Central government 17,8000 27,6000 33,300 26,233
LGAs estimate (all) 28,965.0 9,655.0
LGAs (14 council sample) 2,487.8 829,263.4
Off-budget donors 10,830.1 18,755.8 21,972.3 17,186.1
Grand Total 53,074.4
Source: Innovex, UNICEF and Irish Aid, 2014.
Table 9 shows the total nutrition expenditure above in relation both to total government
expenditure (recurrent and development) and to GDP. In the first analysis nutrition
expenditure falls from 4.6% of total expenditure in 2014/15 to only 3.8% in 2015/16. This fall
is a result of the 29% increase in total government expenditure (mostly recurrent) which
outstripped the more modest growth (5%) in government nutrition expenditure.
Table 9. Mainland Tanzania: nutrition expenditure against government-wide aggregates (TZS millions)
TZS Millions 2014/15 2015/16
Total expenditure 17,488,626 22,543,664
recurrent 13,778,397 18,204,111
development 3,710,228 4,339,553
Total nutrition expenditure excl. off-budget ODA 810,504 851,459
Nutrition expenditure as % total govt expenditure 4.6% 3.8%
GDP at market prices 85,153,090 97,304,216
Total nutrition expenditure incl. off-budget ODA 815,470 860,691
Nutrition expenditure as % GDP 1.0% 0.9%
Source: PER dataset; 2017/18 Budget Speech Tables
Nutrition expenditures as a percentage of GDP show a similar but less dramatic result,
falling from 1% of GDP in 2014/15 to 0.9% in 2015/16. The nutrition expenditures in the GDP
calculation are slightly higher because it includes the off-budget ODA related to nutrition,
which was necessarily excluded for the first analysis.
Comparison against a sector benchmark can help to place these figures in context. The
World Bank and others estimate that meeting the 2025 global stunting target (reducing the
number of stunted under 5 children by 40%) will cost approximately an additional USD 8.50
per child under 5 per year. This covers the scale-up of high-impact, proven nutrition-specific
interventions focused on the 1,000-day window from conception to age two years including
improving maternal nutrition, infant and young child feeding practices, and child nutrition
through micronutrient supplementation (World Bank 2015). This is a global target, which
should be adjusted to reflect the varying nutrition burden of specific countries. Nonetheless,
Table 10 below indicates that Mainland Tanzania fell far short of meeting this benchmark in
2014/15 and in 2015/16, with just 51 cents and 50 cents respectively, per child under 5
recorded as spent on nutrition-specific interventions.

Nutrition Public Expenditure Review: Mainland Tanzania and Zanzibar
© Oxford Policy Management 54
This analysis is based solely on nutrition-specific expenditures which accounted for 0.92% of
recorded nutrition-related expenditures in 2014/15, and only 1.56% in 2015/1612. There are
intrinsic challenges in recognising the full cost of nutrition-specific interventions. For
example, the cost of interventions such as promotion of breastfeeding is low and typically
includes only the salary and transport costs of the health workers or may be done by
community health workers.
Table 10. Nutrition-specific expenditure in Mainland Tanzania per child under 5
2014/15 2015/16
Nutrition-specific expenditure (USD) 3,874,188 3,929,914
Estimated population under 5 7,593,655 7,933,801
Nutrition specific spending per child under 5 (USD) $0.51 $0.50
Source: expenditure taken from PER dataset (NB includes data from the 22 LGAs for which actual data was reviewed; estimates for 89 LGAs for which global spending data was available and the nutrition spending proportion was pro-rated; and estimates for 52 LGAs for which no data was available which were assumed to have spent at the average rate of the other 111 (22+89) LGAs); population projections from NBS (using total population projections and the population percentage under 5 from 2012 census). Exchange rates are from oanda.com.
12 These percentages include sampled LGAs only. They may be understated. A small portion of the “unknown multiple” may be nutrition specific expenditures. This includes general medicine expenditures, which might include things such as vitamin A or therapeutic products to treat severe acute malnutrition, although much of that is separately identifiable in the budget lines or through donor contributions. Some generic budget lines for TFNC were also coded as “unknown multiple” because the nature of the activity was not specified but was assumed to be fully nutrition related given the mandate of the centre.

Nutrition Public Expenditure Review: Mainland Tanzania and Zanzibar
© Oxford Policy Management 55
4.1.2 Nutrition allocations and expenditures by economic classification
By economic classification we mean the analysis by type of spending e.g. whether spending
is Capital or Recurrent; and whether it is for Personal Emoluments, Goods and Services,
Maintenance, etc. An appropriate balance of capital and recurrent expenditure is important
for effective service delivery.
The Development budget comprises predominantly, but not exclusively, capital
expenditures. Table 11 below sets out estimated proportions of Development and Recurrent
nutrition expenditures for mainland Tanzania. It is an estimate because it is based on the
LGA expenditure assumptions described above and set out in the note accompanying the
table. It shows a relatively even split between development and recurrent budgets.
Table 11. Estimated nutrition spending by broad economic classification (2014/15 – 2015/16)
Nutrition approved estimates Nutrition actual expenditure
Development 56% 49%
Recurrent 44% 51%
Source: PER dataset. NB results are for 2014/15 and 2015/16 combined. Includes data from the 22 LGAs for which actual data was reviewed; estimates for 89 LGAs for which global spending data was available and the nutrition spending proportion was pro-rated; and estimates for 52 LGAs for which no data was available which were assumed to have spent at the average rate of the other 111 (22+89) LGAs. Excludes off budget ODA as this was not categorised by budget economic classification.
Table 12 breaks this down by level of Government. It indicates that 88% of national level
spending on nutrition is from the Development budget - and this requires some explanation.
One factor is that nutrition is ODA heavy, and all on-budget ODA is required to be recorded
Key findings:
Actual expenditures grew by 5% overall between 2014/15 and 2015/16 (just less than inflation) mostly as a result of a 12% increase in central government spending on nutrition
The increase in spending through central government is largely due to on-budget aid which disguises a worsening trend of government spending on nutrition from its own sources. In particular, it includes World Bank funding for the TASAF cash transfer, which grew from TZS 49 bn in 2014/15, to TZS 221 bn in 2015/16. Stripping out TASAF reveals a huge decline in central government nutrition expenditure of 45%, from TZS 291.7 bn to TZS 160.9bn.
In 2015/16 only 83.5% of central government nutrition budgets were spent, and only 76.4% of LGA nutrition budgets.
Nutrition expenditure rose at a slower rate than overall government expenditure from 2014/15 to 2015/16 and as a result fell slightly as a percentage of total government expenditure and as a percentage of GDP.
Methodological differences make comparison with the PER of 2014 challenging, but estimates suggest that public spending on nutrition may have increased significantly in recent years.
Nutrition-specific spending at approximately USD0.50 per U5 child falls far short of the benchmark of USD 8.50 per U5 child estimated to reach the 2025 global stunting target
Links to relevant recommendations:
R1 (to MoFP, MDAs and LGAs) Address the adequacy of budgets for nutrition
R2 (to MOFP, PORALG, all implementing agencies) Better budget management and efficiency
R4 (To MoFP, PO-RALG): Further incentivise nutrition expenditures

Nutrition Public Expenditure Review: Mainland Tanzania and Zanzibar
© Oxford Policy Management 56
in the Development budget, even when financing recurrent expenditures. Table 13 seeks to
adjust for this by removing on budget ODA (account code 202) and the balance shifts more
towards recurrent. Unfortunately, this analysis is only possible for 2014/15.
Table 12. Nutrition budgets by level of government and by broad economic classification (2014/15 - 2015/16)
National Level Nutrition approved estimates Nutrition actual expenditure
Development 88% 87%
Recurrent 12% 13%
Local Level
Development 32% 19%
Recurrent 68% 81%
Source: PER dataset. NB data is for the two years combined. It includes data from the 22 LGAs for which actual data was reviewed; estimates for 89 LGAs for which global spending. Excludes off budget ODA as this was not categorised as per the budget economic classification.
Table 13. National nutrition budgets by broad economic classification: 2014/15 only, excluding ODA
Economic Classification
Nutrition approved estimates
Nutrition actual expenditure
Development 60.5% 57.1%
Recurrent 39.5% 42.9%
Source: PER dataset; Note: in 2014/15 the coding structure distinguished between own funds and foreign funds and enabled this analysis to be carried out for that financial year. However, it was not possible for 2015/16.
As expected, the proportion of expenditures coming from the Development budget is less
pronounced after this adjustment, but development expenditures still predominate. This
brings us to a second factor driving development expenditures in nutrition: major
infrastructure spending in agriculture and WASH. These items are recognised as nutrition-
related spending in the NMNAP classification but tend to skew the results. For instance, of
TZS 292,517m identified as 2014/15 national level nutrition expenditures at Table 13 above,
TZS 53,306m is own-source development expenditure, of which TZS 49,621m93%) can be
identified as water projects.
It is assumed to be primarily because of the inclusion of these large WASH infrastructure
investments, that we see a different pattern in the economic distribution of national level
expenditures when compared to the previous nutrition PER (Innovex et al 2014)13. It found
that at the national level, 3.6% of agency spending and 8.6% of ministry expenditure was of
a capital nature (ibid). However, the last PER defined relevant expenditures differently
because the NMNAP was not in place. This variation in scope is most stark in the WASH
sector. In the 2014 PER the only nutrition-relevant activity identified under the Ministry of
Water was “providing special food allowances for people living with HIV”. This is perhaps
appropriate, as it was guided by the NNS rather than NMNAP, which notably did not include
13 As mentioned at 2.2.2 above, large scale water supply (and sanitation) is usually considered outside of the remit and scope of national nutrition plans due to the large investments required but has been included in the NMNAP.

Nutrition Public Expenditure Review: Mainland Tanzania and Zanzibar
© Oxford Policy Management 57
WASH in its priority intervention areas. The current PER includes all WASH activities
identified in the NMNAP including programmes related to water supply, sanitation, solid
waste management, hygiene promotion, latrine construction, community-led total sanitation
(CLTS), handwashing education, (household) water treatment, and (safe) water storage, as
well as (often costly) water supply infrastructure. It is this last item which is pushing up the
share of nutrition spending coming from the development budget at the national level.
Nonetheless, the majority of local level expenditure (which accounts for most nutrition
spending, see 4.1.6) is financed from the recurrent budget. On this point, the findings
between the two PERs are broadly similar, with the 2014 analysis identifying 80% of local
spending on recurrent items (compared to 81% in the current PER). Table 14 shows
recurrent expenditure by salary and non-salary. It reveals that at the local level, over 90% of
nutrition-related recurrent expenditures were on salaries, and 83% of allocations. At the
national level, non-salaries dominate the recurrent expenditure on nutrition, accounting for
56% of nutrition related recurrent expenditures and 60% of the equivalent allocations. This
appears to be both plausible and acceptable. Non-salary nutrition relevant recurrent
expenditures comprise vitamins, vaccines and other items which are often procured centrally
and do not appear in Council budgets. The local level provides the staff to implement
nutrition programmes, often using donated or centrally procured goods in the process.
The 2014 PER found that most of the nutrition-relevant recurrent expenditure was on goods
and services, with a smaller portion going to salaries, at both levels of Government. Without
a full account of the methodology used in the previous PER, this variation between the two
assessments cannot be explained. For example, it is unclear how salary bill was apportioned
to estimate the percentage which was related to nutrition; or whether only the salaries of
staff working exclusively on nutrition was included. The approach adopted in this PER is set
out in detail in Annex G and provides a sound basis for future assessments.
Table 14. Recurrent nutrition expenditures by level of Government (2014/15 – 2015/16)
local (sample LGAs only) Nutrition expenditures Nutrition allocations
Total recurrent 94,971,744,141 103,074,359,352
of which is salaries 90.2% 83.2%
of which is non-salaries 9.8% 16.8%
national
Total recurrent 90,353,786,226 103,935,952,306
of which is salaries 44.5% 40.2%
of which is non-salaries 55.5% 59.7% Source: PER dataset
Key findings:
The Development budget accounts for 57% of national level nutrition spending after ODA is excluded, and 88% when ODA is included. WASH infrastructure spending is a key factor.
Local nutrition spending is predominantly recurrent. Recurrent accounts for 81% of the local spending identified in this Review, and 80% of the spending in the 15 Councils examined in the 204 PER.
Only 10% of local nutrition spending is non-salary, versus 56% of central nutrition spending. This is likely to reflect central procurement practices.

Nutrition Public Expenditure Review: Mainland Tanzania and Zanzibar
© Oxford Policy Management 58
4.1.3 Sectoral distribution
Nutrition is a multisectoral issue, and the response to malnutrition in Tanzania is similarly
multisectoral, as depicted in Figure 10 below. There are a number of observations to be
made. First, the national distribution presented here covers only agriculture, health, WASH,
social protection and (to a lesser extent) environment. It tends to exaggerate each of them
because education data is missing at this level and is undoubtedly significant. Nonetheless,
it demonstrates the significance especially of health, WASH and social protection in central
government nutrition budgets. Health spending at this level focuses on funding for TFNC,
and for medicines, vaccines and family planning. WASH spending focuses on the
development of water supply for urban and rural areas as well as water quality testing.
Social Protection spending is almost entirely the cash transfer element of TASAF.
Agriculture spending focuses on research and development of new varieties of crops as well
as diversification, and training of farmers and extension workers in these methods.
Local level data is more complete than that at the central level subject to the caveats given
above, especially those relating to estimated data. As with the national level, WASH
spending predominates taking up just over half of all budgets (approved estimates) and
more than 60% of all spending. Education is responsible for approximately 20% of budgets
and an equivalent proportion of spending. Health represents just over 10% of local budgets
and a similar proportion of spending. Social Protection and Agriculture budgets are both
seriously underspent. Nutrition-related spending in agriculture at the local level fell from
10.7% of the local budget to only 2.4% of actual expenditures.
Figure 10. Sectoral distribution of expenditures by level of
government, 2014/15 – 2015/16 (excluding civil servant salaries)
Source: PER dataset Note: the distribution above excludes enabling environment expenditures which are generally cross sectoral; and off-budget ODA which is not easily assigned to a level. On budget ODA is captured in figures of the level of budget on which it appeared.
The PER of 2014 did not provide a sectoral distribution analysis of nutrition spending. However, there was such an analysis in the Nutrition Budget Brief covering allocations only for the years 2011/12 to 2015/16 (UNICEF, 2016). The Budget Brief allocation percentages were as follows:
0% 10% 20% 30% 40% 50% 60% 70% 80% 90% 100%
Local: Actuals
Local: Approved estimates
National: Actuals
National: Approved estimates
Agriculture Education Health* Social Protection Wash Environment and Climate change

Nutrition Public Expenditure Review: Mainland Tanzania and Zanzibar
© Oxford Policy Management 59
Figure 11. Sectoral distribution of allocations 2011/12 to 2014/15
Source: Nutrition Budget Brief: FY 2011/12-FY 2015/16
The two sets of data are not comparable for two reasons. One is that the Budget Brief used the definitions of the old National Nutrition Strategy (NNS) and the present review uses the definitions of the NMNAP. One consequence is that WASH spending predominates in the current dataset, but in the Budget Brief health spending was dominant. This reflects changes in the way the NNS and the NMNAP regard WASH sector interventions which was indicated above. The NNS focused on incorporating nutrition-relevant content into existing interventions whereas the NMNAP includes key water sector programmes such as clean water infrastructure development. Another factor affecting comparability is the different methodologies. The Budget Brief was based upon JMNR data collected by survey using Nutrition Officers at LGA level who are health sector employees. It became clear from interviews conducted during this study that Nutrition Officers have much better access to health sector data than data from other sectors.
4.1.4 Execution of nutrition budgets
The picture painted by the 2017 PEFA (Ministry of Finance and Planning, 2017) is broadly positive. However, this assessment identified budget execution as one of the more challenging areas. It pointed out that continued discrepancies between budgets and actual expenditures are associated with either budget disbursement in time or absorbing capacity of budget recipients. Some of this can be laid at the door of widespread cash rationing which the PEFA notes “has undermined the system of commitment controls resulting in expenditure arrears and unpredictable budgets”. The inevitable consequence of this chain of events has been to weaken the strategic resource allocation process and with it, service delivery.
This section of the PER compares execution rates of nutrition budgets (spending as a percentage of the approved budget) against the overall budget execution rates. It does this for both national and local levels.
In this PER we refer to spending as a percentage of budget as budget or budgetary
execution. Spending as a percentage of funds received is referred to as absorption.
Frequently, poor budgetary execution may be caused by short or delayed funding, poor
revenue collection, or both. However, where poor budgetary execution is caused by poor
absorption of available funds, both the implications and the remedies are different. In
0% 10% 20% 30% 40% 50% 60% 70% 80% 90% 100%
Approved estimates
Agriculture and food security Education Health and social welfare WASH Others
Key findings:
Even without education, the national level sectoral analysis of nutrition spending shows the significance of health, WASH and social protection (primarily cash transfers).
Local level nutrition spending is dominated by WASH which accounts for more than 60%. Nutrition budgets for agriculture are only 10% of the total but are seriously underspent.

Nutrition Public Expenditure Review: Mainland Tanzania and Zanzibar
© Oxford Policy Management 60
general, we have little information on absorption in Tanzania because information on funds
released - amounts made available to implementing agencies - is limited and piecemeal.
Although no specific data is available for nutrition-related releases, the balance of evidence
suggests that a significant proportion of the budget execution failure results from the
insufficient release of funds. This is for two reasons: first, all LGAs met (see “budget
execution” at 4.2.2 below) cited inadequate funding as the reason for poor budget execution,
and none indicated any failure to spend funds provided; and second the 2017 PEFA
presents evidence to show that a significant part of the overall budgetary execution failure (it
allocates a “C” score) derives from the cash rationing system, and in particular the failure of
grants to reach their budgeted amounts in 2014/15 and 2015/16 (cited elsewhere in this
report). This does not rule out cases of poor absorption. For any definitive conclusion a
fuller, more robust, dataset is required.
Table 15 presents the overall budget execution rate (spending as a percentage of budget) for 2014/15 and 2015/16 and compares this with the budget execution rate for nutrition-related expenditures at national level and in the 22 LGAs that make up our core sample.
Table 15. Mainland Tanzania: comparison of nutrition budget execution rates and total budget execution rates for 2014/15 and 2015/16
TZS 2014/15 2015/16
Source nutrition budget execution rate
total budget execution rate
nutrition budget execution rate
total budget execution rate
Government 88.3% 87.0% 81.6% 66.3%
national 88.7% 85.9% 83.5% 62.5%
local 85.8% 89.0% 70.9% 72.6%
Off-budget grants 76.9% NA 88.7% NA
Source: PER dataset
The table reveals poor performance in overall budget execution which is consistent with the findings of the national 2017 PEFA, and a similarly poor performance in execution of nutrition-related budgets.14 Both overall budget execution and nutrition-related budget execution deteriorate in 2015/16 as compared to 2014/15.
Comparison against the previous PER is challenging for the methodological and coverage variations raised previously. Nonetheless, the 2014 PER reported a surprisingly low nutrition execution rate of 12.9% for Ministries, and a more plausible 99.8% for Agencies (Innovex et al 2014); if the execution rate for Ministries is taken at face value, it suggests significant progress on their part. In the 15 councils it covered, the 2014 PER registered an overall nutrition budget execution rate of 80% (varying from 53% in Babati to 169% in Pangani), again suggesting possible progress to 2014/15 but a deterioration in 2015/16 (ibid).
Significantly, execution rates for nutrition-related expenditures are very close to overall budget execution rates in 2014/15 and better than overall budget execution rates in 2015/16. This suggests that during a period of relative austerity, nutrition-related expenditure had a degree of protection.
14 Under PEFA scoring a “D” is awarded if aggregate expenditure outturn is less than 85% or more than 115% of the approved aggregate budgeted expenditure in at least two of the last three years.

Nutrition Public Expenditure Review: Mainland Tanzania and Zanzibar
© Oxford Policy Management 61
Figure 12 shows the position for the councils in our core sample comparing the Development Budget and the Recurrent Budget execution rates, for nutrition related expenditures only. They diverge significantly. It shows also that at the local level there is significant variation between LGAs. This may be an indication of the problematic expenditure reporting rather than (or in addition too) weak execution; where execution rates are greater than 100% this could indicate weak fiscal discipline or possibly, challenges with financial reporting. Reasons for the challenges in execution are reported in 4.2 but in summary include the fact that GoT does not provide local Governments with a disbursement or transfer schedule at the beginning of the FY and as such there is uncertainty around magnitude and timing of transfers especially relating to operating transfers; the general lack of awareness amongst local level officials around the use of formulas used as the basis for allocation of recurrent grants to each LGA; and the multiple spending directives received by LGAs as priorities change during the financial year rendering budgets not credible.
Figure 12. LGA budget execution rates for nutrition-related
expenditure
Source: PER dataset
0%
50%
100%
150%
200%
250%
300%
LGA recurrent nutrition budget execution rate
0%
10%
20%
30%
40%
50%
60%
70%
80%
90%
100%
LGA development nutrition budget execution rate

Nutrition Public Expenditure Review: Mainland Tanzania and Zanzibar
© Oxford Policy Management 62
4.1.5 Sources of Finance for nutrition budgets
The 2014 PER recommended that for sustainability, Government should increase the level of funding going to nutrition, both in real terms and as a share relative to development partner financing. The authors of that PER reported at the time that the aggregate budget allocation at national level for the 3 years (2010/11, 2011/12, and 2012/13) was funded 77% by the donor community and 23% by the Government of Tanzania.
The analysis at Table 16 and Figure 13 is for 2014/15 only. It relies on estimated data especially at the LGA level. It shows that an estimated 46% of nutrition allocations and 38% of nutrition expenditures were funded by the donor community in 2014/15. It is not surprising that it shows a lower percentage than reported in the 2014 PER since that review drew its conclusions from the national level only, where most external support is recorded (data for 2014/15 indicate that, taking the national level only, development partners are responsible for 69.2% of all nutrition funding, which is directly comparable with 77.7% reported in the 2014 PER).
The Nutrition Budget Briefs also reported on 2014/15 using JMNR survey data and budget allocations rather than spending. They found that development partners accounted for 55.8% of total nutrition spending in that year (UNICEF, 2016). The comparable figure in Table 16 is 46.4%. One reason for the discrepancy might be that there is a significant omission of off-budget ODA in the dataset of this PER, which would mean that the proportion shown here as development partners is understated.
Table 16. Sources of nutrition spending (2014/15)
Source nutrition allocations
nutrition expenditures
Government own sources 53.6% 61.8%
Identified in PER 13.3% 11.5%
Estimated for non-sample LGAs 40.3% 50.3%
Development partners 46.4% 38.2%
Development partners – on budget 29.2% 30.3%
Development partners – on local budget 16.5% 7.3%
Development partners – off budget 0.7% 0.6%
Total 100.0% 100.0%
Key findings:
Budget execution in nutrition-relevant ministries is poor - consistent with the findings of the national 2017 PEFA; it varied from 85-89% in 2014/15 and from 62% to 72% in 2015/16
Nutrition-related budgets performed equally poorly in 2014/15 but significantly better than overall budget execution in 2015/16 suggesting that nutrition spending was protected or prioritised.
Budget execution rates for nutrition-related expenditure varied widely amongst the 22 LGAs making up our core sample. On the recurrent budget the lowest execution rate was 5%, and the highest 288%; on the development budget the lowest execution rate was 1%, and the highest was 60%.
Links to relevant recommendations:
R2 (to MOFP, PORALG, all implementing agencies) Better budget management and efficiency
R5 (To PO-RALG; RAS; LGAs) Strengthen the nutrition enabling environment at LGA level

Nutrition Public Expenditure Review: Mainland Tanzania and Zanzibar
© Oxford Policy Management 63
Figure 13. Nutrition allocations by source (2014/15)
Source: PER dataset. The analysis is for 2014/15 only. Notes: the LGAs includes the 22 LGAs for which actual
data was reviewed; 89 LGAs for which global spending data was available and the nutrition spending proportion was pro-rated; and 52 LGAs for which no data was available which were assumed to have spent at the average rate of the other 111 (22+89) LGAs.
4.1.6 Nutrition allocations and spending by level of government
This section of the report presents both nutrition allocations and nutrition actual expenditures by level of government and by each of the 2 years under review. This analysis has no counterpart in the 2014 PER which made no attempt to calculate an aggregate nutrition budget for the local level. Analysis of the PER dataset at Figure 14 shows that 57% of nutrition funding was allocated to the local level in 2014/15 and 2015/16.
national government
local government
on national budget
on local budget
off budget
0
100,000
200,000
300,000
400,000
500,000
600,000
Government - own sources Development partners
TS
h M
illio
ns
Key findings:
Figures from different studies vary, but it is clear that nutrition spending continues to be heavily financed by Development Partners who are estimated to have financed at least 38% of nutrition-related expenditure in 2014/15.
Links to relevant recommendations:
R1 (to MoFP, MDAs and LGAs) Address the adequacy of budgets for nutrition

Nutrition Public Expenditure Review: Mainland Tanzania and Zanzibar
© Oxford Policy Management 64
Figure 14. Nutrition allocations, by level of government
Source: PER dataset
Table 17. Nutrition allocations by level of Government
Nutrition approved estimates 2014/15 2015/16
national 384,189,317,143 457,480,423,636
local 514,041,536,618 614,234,401,140
local - sample (x 22) 67,717,977,562 83,248,236,195
local - estimate based on expenditure (x 89 LGAs) 282,334,847,988 335,034,086,054
local - average (x52 LGAs) 163,988,711,068 195,952,078,891
898,230,853,761 1,071,714,824,776
Source: PER dataset. Note: excludes off-budget ODA
An examination of actual nutrition expenditures shows a further shift towards the local level in 2015/16 when it accounted for 58% of expenditures, before falling to 55% in 2015/16. This result is similar to the analysis of the UNICEF Nutrition Budget Briefs (UNICEF, 2016) which calculated that districts and municipalities accounted for 52.1% of all nutrition expenditures in the period 2011/12 to 2014/15. The indication is that over time the local level is responsible for an increasing proportion of nutrition expenditure, in spite of the pull back in 2015/16.
Figure 15. Nutrition expenditures, by level of government
Source: PER dataset
0% 20% 40% 60% 80% 100%
2014/15
2015/16
local national
0% 20% 40% 60% 80% 100%
2014/15
2015/16
local national

Nutrition Public Expenditure Review: Mainland Tanzania and Zanzibar
© Oxford Policy Management 65
Table 18. Nutrition expenditures by level of Government
Nutrition actual expenditures 2014/15 2015/16
national 340,735,278,942 381,971,126,860
local 469,768,869,874 469,488,365,687
local - sample (x 22) 58,106,658,726 59,010,978,818
local - estimate based on expenditure (x 89 LGAs)
261,797,295,605 260,701,957,325
local - average (x52 LGAs) 149,864,915,542 149,775,429,544
810,504,148,815 851,459,492,548
Source: PER dataset. Notes: the LGAs includes the 22 LGAs for which actual data was reviewed; 89 LGAs for which global spending data was available and the nutrition spending proportion was pro-rated; and 52 LGAs for which no data was available which were assumed to have spent at the average rate of the other 111 (22+89) LGAs.
This analysis relates specifically to the source of spending and not the beneficiary level. Much of the spending at central level benefits the local level.
4.1.7 Expenditure by nutrition categories
The nutrition policy framework for Tanzania emphasises a combination of nutrition-specific
and nutrition-sensitive approaches, as well as strengthening the enabling environment in
terms of the wider policy and governance processes around nutrition.
Figure 16 shows the relative share of spending against these broad categories. Salaries have been excluded from this analysis because of the blunt way in which they were aligned to spending categories and sectors.15 A continuing caveat is that the analysis in this section uses a “tier 3” estimate of nutrition expenditure which, as explained in the methodology section above, include some major assumptions about nutrition expenditure in a significant portion of LGAs.
As would be expected, the vast majority (over 96%) of allocations and expenditures from local and national budgets are going towards nutrition-sensitive interventions, which seek to address the underlying causes of malnutrition, across a range of sectors. A much smaller share of reported allocations (1.2% of the local budget and 0.13% of the national budget) directly addresses malnutrition through nutrition-specific approaches. This distribution is typical, given that nutrition-specific interventions are much more contained and targeted (although may include costly acute malnutrition interventions), and nutrition-sensitive investments span a wide range of sectoral programmes, including, in the case of Tanzania, some costly infrastructure (e.g. water supply)16. Similarly, expenditure data from 41
15 See Annex G 16 Water supply infrastructure, whilst included in the NMNAP is not typically considered nutrition-sensitive in the global literature. Excluding it from the data set has an impact on the distribution of nutrition sensitive expenditures, discussed below, and reduces slightly the share of all nutrition spending which is nutrition sensitive, from 96% to 93%.
Key findings: The local level is responsible for more than 50% of nutrition-related spending. This percentage appears to be increasing although it is not linear, and it fell back in 2015/16.

Nutrition Public Expenditure Review: Mainland Tanzania and Zanzibar
© Oxford Policy Management 66
countries in the Global Nutrition Report 2017 show that the vast majority of expenditure was on nutrition-sensitive interventions, with very few exceptions (Development Initiatives 2017).
The NMNAP costing has approximately 2% of the budget for nutrition specific activities, and 97% focused on nutrition sensitive interventions. Spending is therefore closely aligned to this costing. Internationally, approaches to reduce the burden of malnutrition vary by country in national nutrition plans, mainly due to the differing levels of emphasis put on nutrition sensitive approaches. This in turn affects the percentage of the total plan cost associated with nutrition specific activities. As an example, 81.2% of the costed plan for nutrition in Mozambique is for nutrition specific interventions with nutrition sensitive interventions focused only on some WASH and health interventions. Therefore, focus should not be placed on the percentage of the national nutrition plan costing allocated to nutrition specific interventions. Rather, emphasis should be placed on costing those nutrition specific interventions identified as having the greatest impact on stunting for all relevant target groups and ensuring that the required funds are budgeted for each year to implement. In this regard, Tanzania needs to continue its focus of emphasising allocation of funding for the scale-up of nutrition specific interventions at the district level.
Off-budget ODA appears to have a very different distribution. The ODA data captured through the donor reporting template is predominantly (over 68%) for nutrition-specific interventions. Although global evidence on donor disbursements between 2010-2015 for nutrition shows that they tend to provide a larger proportion of the funding for nutrition specific interventions, the figure ranged from 13 percent to 22 percent during this time period (Development Initiatives 2017).
Just 0.89% of recorded allocations from the local budget, and just 0.02% of the national budget, are supporting the governance and policy processes around nutrition.
Figure 16. Allocations and expenditures by broad nutrition categories
(2014/15 - 2015/16)
Source: PER dataset. Notes: data is for both years combined. * unknown multiple relates to budget lines
associated with unspecified medical supplies, plus undefined TFNC expenditures.
0%
10%
20%
30%
40%
50%
60%
70%
80%
90%
100%
local national DP (off budget) local national DP (off budget)
nutrition allocations Nutrition expenditures
enabling_environment n_sensitive n_specific unknown_multiple

Nutrition Public Expenditure Review: Mainland Tanzania and Zanzibar
© Oxford Policy Management 67
Nutrition Specific
Within this the following paragraphs provide further analysis of each category of nutrition expenditures, beginning with nutrition specific expenditures. Figure 17 below provides a breakdown of nutrition-specific expenditures. The largest shares go to micronutrients and MIYCAN, with less on IMAM and very little on the prevention and management of diet related NCDs. There is very little obesity-focused expenditure, at local level. The NNS set out these key priority areas for direct nutrition interventions but the associated costing did not give a breakdown for each one. Therefore, it is not possible to say whether the expenditure breakdown below is in line with expectations of the NNS.
By contrast, the NMNAP was costed and a breakdown given for each of the nutrition specific categories outlines in Figure 17. Largely in line with the NMNAP costing a large portion of expenditure is on MIYCAN (costing - 40.4%), followed by micronutrients (costing - 24.8%). What is slightly surprising is the low level of expenditure on IMAM (costing – 20.0%) as well as the almost complete lack of expenditure on prevention and management of diet-related non-communicable diseases (costing – 14.8%).
Figure 17. Nutrition-specific expenditures 2014/15 – 2015/16
Source: PER dataset. Notes: Data is for both years, combined and for all levels of government combined. The estimate of local government expenditures are derived from the 22 LGAs for which actual data was reviewed; 89 LGAs for which global spending data was available and the nutrition spending proportion was pro-rated; and 52 LGAs for which no data was available which were assumed to have spent at the average rate of the other 111 (22+89) LGAs.
Table 19 below sets out the values associated with each category and indicates the funding source. IMAM and MYICAN are both heavily reliant on off budget ODA. Micronutrients are primarily financed at the local level, and the little amount going to DRNCD is exclusively from local level.
5.1%
65.1%
0.2%
29.6%
Integrated Management ofAcute Malnutrition (IMAM)
Maternal, Infant, Young Childand Adolescent Nutrition(MIYCAN)
Prevention and Management ofDiet-Related Non-Communicable Diseases
Prevention and Management ofMicronutrient Deficiencies

Nutrition Public Expenditure Review: Mainland Tanzania and Zanzibar
© Oxford Policy Management 68
Table 19. Sources of funding for nutrition specific expenditures (2014/15 – 2015/16)
Nutrition specific expenditure and source allocations expenditures
Integrated Management of Acute Malnutrition (IMAM) 890,621,872 756,327,325
of which is funded at the national level 0% 0%
of which is funded by LGs 24% 11%
of which is funded through off budget ODA 76% 89%
Maternal, Infant, Young Child and Adolescent Nutrition (MIYCAN) 11,046,742,581 9,725,324,292
of which is funded at the national level 0% 0%
of which is funded by LGs 14% 23%
of which is funded through off budget ODA 86% 77%
Prevention and Management of Diet-Related Non-Communicable Diseases
67,313,717 32,239,500
of which is funded at the national level 0% 0%
of which is funded by LGs 100% 100%
of which is funded through off budget ODA 0% 0%
Prevention and Management of Micronutrient Deficiencies 5,088,371,353 4,414,990,848
of which is funded at the national level 20% 23%
of which is funded by LGs 80% 77%
of which is funded through off budget ODA 0% 0%
total 17,093,049,524 14,928,881,966
Source: PER dataset. NB data is for both years combined. The estimate of local government expenditures are derived from the 22 LGAs for which actual data was reviewed; 89 LGAs for which global spending data was available and the nutrition spending proportion was pro-rated; and 52 LGAs for which no data was available which were assumed to have spent at the average rate of the other 111 (22+89) LGAs.
Figure 18. Sources of funding for nutrition specific allocations
(2014/15 – 2015/16)
0
2,000
4,000
6,000
8,000
10,000
12,000
Integrated Managementof Acute Malnutrition
(IMAM)
Maternal, Infant, YoungChild and AdolescentNutrition (MIYCAN)
Prevention andManagement of Diet-
Related Non-Communicable
Diseases
Prevention andManagement of
MicronutrientDeficiencies
TZ
S M
illio
ns
National budget Local budget Off-budget ODA

Nutrition Public Expenditure Review: Mainland Tanzania and Zanzibar
© Oxford Policy Management 69
Nutrition sensitive
The next paragraphs present four pie diagrams presenting nutrition sensitive allocations and spending. In this analysis salaries were removed because of the heavy use of estimates used to incorporate them, so that the charts effectively represent an analysis of non-salary nutrition sensitive spending. At the national level both allocations and expenditure are predominantly WASH, social protection and health, confirming the sector breakdown above.
Figure 19. Nutrition sensitive national budget allocations and
expenditures 2014/15 – 2015/16
Source: PER dataset. Data is for both years, combined.
At the local level it is much more mixed. WASH spending dominates, with significant expenditure also on nutrition-relevant education. Health, agriculture and social protection make up less than a quarter of nutrition-relevant expenditures. In the NMNAP costing, health (30.1%) and WASH (26.5%) are the dominant areas for nutrition sensitive interventions, followed by social protection (18.5%), agriculture (16.7%), education (8.1%) and environment (0.04%). Therefore, the findings are somewhat surprising in that the share of nutrition-relevant health expenditure is far lower than expected and the share of education is double the expected share. The fact that social protection spending is more dominant at the national level, is a reflection of the on-budget ODA for the TASAF cash transfer, which appears on the national budget.
7.29%
25.16%
33.79%
33.76%
Nutrition allocations
Agriculture EducationHealth Social ProtectionWash Environment& cc
4.77%
29.07%
40.18%
25.97%
Nutrition expenditures
Agriculture EducationHealth Social ProtectionWash Environment& cc

Nutrition Public Expenditure Review: Mainland Tanzania and Zanzibar
© Oxford Policy Management 70
Figure 20. Breakdown of nutrition sensitive local budget allocations
and expenditures 2014/15 – 2015/16
Source: PER dataset. Data is for both years, combined.
The dominance of WASH sector spending, particularly at the local level, follows directly from the definition of nutrition-sensitive activities in the NMNAP, and in particular the inclusion of water supply infrastructure. This is the main way in which the Tanzanian policy framework deviates from the global literature, which does not typically define water supply infrastructure as nutrition sensitive (for example the Compendium of Actions for Nutrition (CAN) developed by the SUN UN Network / REACH).
The charts below exclude all budget lines associated with water supply infrastructure. The impact on the distribution of local level nutrition-sensitive spending is dramatic, with the WASH sector accounting for just 8% of nutrition-sensitive allocations and 14% of expenditures (compared to 54% and 65% when water supply is included). Education becomes the dominant sector.
10.98%
20.81%
8.30%
5.83%
54.09%
Nutrition allocations
Agriculture Education
Health Social Protection
Wash
2.48%
20.65%
7.24%
4.24%
65.39%
Nutrition expenditures
Agriculture Education
Health Social Protection
Wash

Nutrition Public Expenditure Review: Mainland Tanzania and Zanzibar
© Oxford Policy Management 71
Figure 21. Nutrition sensitive local budget allocations and
expenditures 2014/15–2015/16 (excluding water supply infrastructure)
Source: PER dataset. Data is for both years, combined.
Nutrition enabling environment
Allocations and expenditures in respect of the nutrition enabling environment are focused on nutrition governance at the local level (where it constitutes over 73% of enabling environment spending). At the national level, enabling environment expenditures focus on nutrition surveillance, surveys, and information management (68%).
Figure 22. Nutrition enabling environment allocations 2014/15 to
2015/16
Source: PER dataset. . Data is for both years, combined.
21.97%
41.66%
16.61%
11.67%
8.08%
Nutrition allocations
Agriculture Education
Health Social Protection
Wash
6.13%
51.10%17.92%
10.50%
14.35%
Nutrition expenditures
Agriculture Education
Health Social Protection
Wash
0% 20% 40% 60% 80% 100%
local level
national level
Nutrition governance (Plans, policies, coordination, capacity)
Nutrition surveillance, surveys and information management

Nutrition Public Expenditure Review: Mainland Tanzania and Zanzibar
© Oxford Policy Management 72
The NMNAP costing outlines expenditure on nutrition surveillance, surveys and information management as double that of nutrition governance. At the local level, nutrition governance spending is more than double spending on nutrition surveillance, surveys and information management. This may result from DNuOs being relatively new in their positions and therefore likely little focus on nutrition surveillance until recently at the district level.
4.1.8 Estimation of the financing gap for the NNS and the NMNAP
Financing gaps can be developed for broad areas where there are relevant norms, or for those specific things which can be costed. In the first category, as indicated at section 4.2.1 above, analysis by the World Bank and others estimates that reducing the number of stunted under 5 children by 40% will cost approximately an additional USD 8.50 per child under 5 per year. This global target must be adjusted to suit the circumstances of each country. Unadjusted it suggests that spending per child under 5 in 2015/16 was USD 0.70, a deficit of USD 7.80 per child under 5. When multiplied by the estimated number of under 5 children in 2015/16 (7.9 million) gives a financing gap of USD 61.62 million.
This is interesting, but in our view not helpful since it is not customised to Tanzania. A manageable approach would be to carry out an up-to-date costing of only nutrition-specific and enabling environment interventions as set out in the NMNAP. This means the Nutrition Specific Focus Areas of Infant and Young Child Feeding (IYCF); Micronutrient Deficiencies; Managing Maternal and Child Malnutrition; and Diet-Related Non-communicable Diseases; and the elements of Coordination/M & E. The summarised costing of nutrition in the national FYDP 2016/17-2020/21 would serve as a guide, but on its own it is not sufficient to effectively monitor nutrition expenditures. An expansion of the costing to incorporate nutrition-sensitive expenditures would render the exercise unmanageable. That said, it would be possible to make reference to any nutrition-sensitive sectoral costings or financing gap calculations that exist.
Key findings:
More than 95% of allocations and expenditures from local and national budgets pay for nutrition-sensitive interventions. This is consistent with NMNAP which proposes only 2% of spending for nutrition-specific interventions.
Nutrition-specific: in 2014/15 and 2015/16 65% of nutrition-specific interventions were for MIYCAN, with 29% for micronutrients. IMAM took 5%. ODA provided most finance for MIYCAN (77%) and IMAM (89%).
Nutrition-sensitive at national level: is predominantly WASH, health and Social Protection. Education is absent for lack of data, and Social Protection is primarily World bank financed TASAF cash transfers.
Nutrition-sensitive at local level: this is more mixed. WASH is again the dominant area of spending, but education nutrition-sensitive spending is higher than expected at more than 20% (the NMNAP expects only 8%) while health is at 8% where the NMNAP expects 30%.
Enabling environment: spending at national level is 68% on nutrition surveillance, surveys and information management; at local level it is 73% on nutrition governance.
Links to relevant recommendations:
R1 (to MoFP, MDAs and LGAs) Address the adequacy of budgets for nutrition
R7 (To MoFP, PO-RALG): Improve the financial management to better monitor nutrition spending

Nutrition Public Expenditure Review: Mainland Tanzania and Zanzibar
© Oxford Policy Management 73
4.2 Budget process and performance for nutrition
4.2.1 National level
Nutrition is emphasised in key documents at the national level and is separately identified in the current FYDP as indicated above. At national level, nutrition budgets processes conform to the wider national budget process described above and set out at Annex F, although there are some additional features. For instance, institutionally, MDAs with nutrition-related expenditures have nutrition focal points who communicate with and support TFNC. However, nationally developed directives on budgeting for nutrition are primarily focused on the subnational level which is responsible for the majority of nutrition-related spending and where nutrition activities take place.
Consequently, national budget guidelines require MDAs, RASs and LGAs that implement specific and sensitive nutrition interventions to allocate resources for interventions in accordance with the NNS/NMNAP and the Implementation plan. LGAs are also called on to ensure a functioning Council Multi-Sectoral Nutrition Steering Committee and submit quarterly performance reports to PMO-RALG for consolidation, and to prepare and implement a comprehensive nutrition programs which will enable provision of school meals to all students in day primary and secondary schools.
RASs and LGAs are also called on to direct resources towards construction, rehabilitation, maintenance and equipping of social and economic infrastructure, especially in education, water, health, agriculture, livestock, fisheries and roads sectors in line with national standards; and to continue to strengthen coordination and attainment of targets set for food crop production with special emphasis on the investment projects under Southern Agricultural Growth Corridor of Tanzania and Tanzania Agriculture and Food Security Investment Plan. Some ministries set out sectoral budget guidelines that affect nutrition and give direction to both national and local levels. In this respect the MoHSW through the CCHP provides guidelines on the proportion of total health budget to be allocated toward different types of health services, including nutrition services. This is elaborated at 4.2.2 below.
Two additional national guidelines relate directly to budgeting for nutrition. The PMO prepared guidelines for planning and budgeting for nutrition (PMO 2012). They discuss nutrition challenges and interventions to address them. However, they do not provide a template or a tool to plan and budget for nutrition. Also, in 2016 PORALG issued instructions to RASs setting out minimum amounts to be allocated to nutrition specific and enabling environment activities in the budgets of all regions and councils (PORALG 2016) and discussed below.
Reporting and accountability:
National level MDAs with nutrition responsibilities report periodically to the HLSCN. Also, as indicated above, MDAs that implement specific and sensitive nutrition interventions are required to allocate resources for interventions in accordance with the NNS/NMNAP and the Implementation plan. One of the budget scrutiny criteria in the budget formulation process is to ensure that budgets conform to these guidelines. All national level MDAs submit financial information to MoFP through Epicor – Annex F.
At national level some of the major nutrition-sensitive activities such as TASAF are financed by IFIs or Development Partners. Many of these projects and programmes have their own internal reporting and performance assessment processes which strengthen accountability at the same time as they place additional burdens on government.

Nutrition Public Expenditure Review: Mainland Tanzania and Zanzibar
© Oxford Policy Management 74
Key accountability and control mechanisms include internal and external audit, but they are not nutrition specific and generally not-performance oriented. All MDAs have internal audit units, which are overseen by the Internal Auditor General. External audit reports are produced in a timely manner. External audit was rated a “B” in the 2017 PEFA for its scope, standards, timeliness and effectiveness of follow-up.
4.2.2 Local level
Use of budget guidelines:
At the level of LGAs and regions, allocation to nutrition activities are governed by planning and budgeting guidelines issued by the MOFP, PO-RALG and some individual ministries e.g. MoHSW. Specifically, budgeting guidelines in FY 2014/15 and 15/16 require LGAs to budget for nutrition specific and sensitive interventions in accordance with the NNS, and develop comprehensive nutrition plans to implement during the year. LGAs are required to ensure the functioning of a Multi-Sectoral Nutrition Steering Committee17 chaired by the District Executive Director whilst the District Nutrition Officer (DNuO) constitutes the Secretariat to the Committee.
In 2016, PO RALG issued instructions to RASs, setting out minimum amounts to be allocated in all regional and council budgets for specified eligible expenditures drawn from the NMNAP18 (PO RALG 2016). The expenditures include nutrition specific interventions and investments in the enabling environment. The objective is to gradually increase this minimum allocation from TZS 500 in 2016/17 to TZS 20,000 by 2025/26. In FY 2017/18, LGAs were required to budget TZS 1,000 for each child19.
Regions are required to allocate TZS 10mn for each LGA within the region to carry out supervision and coordination of nutrition activities across LGAs. Additionally, from FY 2016/17 onwards, the MoH issues a detailed CCHP matrix outlining 13 priority areas20 along with activities to guide budgeting processes of LGA health departments. Although nutrition is not a key priority and there are no specific directives on spending on nutrition specific activities from the Health Basket Fund (HBF), 4 of the 13 priority areas make specific mention of nutrition-relevant interventions: ‘prevention of non-communicable diseases’, ‘maternal, new-born and child health’, ‘communicable diseases’, and ‘health promotion’.
17 The committee is constituted by representative of all nutrition specific and sensitive departments, civil society groups, private sector and religious groups. 18 Specifically, promotion of Maternal Infant and Young Child Feeding practices, Integrated Management of Acute Malnutrition, prevention of micronutrient deficiencies, prevention of Anaemia, Vitamin A supplementation and deworming, and promotion of Universal Salt Iodization. 19 after signature of a Nutrition Compact between all regional Commissioners in the 26 regions in mainland and the Minister of State PORALG, the minimum budget allocations have been made mandatory. PORALG should now ensure that the Compact is regularly monitored and the Regions are held accountable for compliance. 20 13 priority areas include: 1. medicines, medical equipment, medical supplies, diagnostic reagents and management system, 2. maternal, new-born and child health, 3. prevention of communicable diseases, 4. non-communicable diseases (acute and chronic respiratory diseases, diabetes mellitus, cardiovascular diseases, neoplasms/ cancers, anaemia & nutritional disorders, injuries, mental health), 5. treatment and care of other common disease of local priority, 6. environmental health and sanitation in health facilities, 7. strengthen social welfare and social protection services, 8. strengthening human resources for health and social welfare management capacity improved health services delivery, 9. strengthen organization structures and institutional management at all levels, 10. emergency preparedness and response, 11. health promotion, 12. traditional medicine and alternative healing, 13. construction, rehabilitation and planned preventive maintenance of physical infrastructure of health facilities and staff housing

Nutrition Public Expenditure Review: Mainland Tanzania and Zanzibar
© Oxford Policy Management 75
Budget preparation:
The timeline for preparing nutrition budgets mirrors broader preparation of council budgets. The central government issues budgeting guidelines in September-October. A preliminary meeting is convened at the regional level in November by the PORALG, TFNC and the RNuO, with UNICEF’s support, to guide the process of developing nutrition specific priorities. It is attended by the District Medical Officer, Health Secretary, District Planning Officer and selected nutrition sensitive officials. Following this, the DNuO develops a nutrition plan21
which is reviewed by the RNuO. However, the MOFP only issues ceilings in March and as a result, the DNuOs work on assumptions based on the previous financial year. This can result in plans that are unrealistic and only partially financed.
The DNuO submits the plan to the Health Secretary who incorporates it into budget submissions of the health department. Since the DNuO is not a core member of the CHMT, (s)he is not involved in consultations with the DPO when allocations to different departments are finalised before submitting the council’s budget to the PO-RALG through the RAS.
At the same time, council strategic plans and budgets are prepared based on a bottom-up budgeting process with councillors working in their wards to produce ward level budgets. This is consolidated into a council budget and approved by the council22. The budgets are submitted to PO-RALG (where significant revisions are made) and then to the Parliamentary Budget Committee. After revision in accordance with changes suggested and to fit within the latest budget ceiling issued, the budget is re-submitted to PO-RALG and MOFP.
Nutrition is an increasing priority for the central government. However, it is less of a priority at the community or ward level and ultimately, for councillors approving the council budget. This can be for two reasons: other pressing and more tangible services relating to provision of infrastructure, sanitation, health and education facilities are prioritized over nutrition; and/or lack of awareness of the importance of good nutrition. Therefore, there is a disparity between priorities of technical staff at the council level and directives from the central government that have both focused on improving allocations to nutrition, and political priorities of councillors which reflect the needs of the communities they represent.
Financing of nutrition activities and adequacy of budget allocation:
Nutrition specific activities are mainly financed from central government transfers (specifically from the Health Basket Fund and health Other Charges) and from donor interventions (see 4.1.5). In the LGAs visited, activities most commonly funded from central government transfers included distribution of vitamin A supplements and deworming tablets, and sensitisation on infant and young child feeding practices. In some cases, LGAs have received funding to convene the Nutrition Steering Committee and carry out outreach activities. Procurement of anthropometric equipment at health centres, provision of F75 and F100 tablets remain important priorities which are severely under-financed. Nutrition supervision is usually carried out jointly with health supervision activities carried out by the vaccination officer and RCHO.
Although recent initiatives from the central government (budgeting for TZS 1000 and CCHP guidelines) has brought the importance of good nutrition to the forefront, one of the key issues remains lack of funds to budget adequately based on the needs of the LGA23.
21 The budget submitted by DNuO in Makete includes activity along with details on inputs and unit cost 22 The council is constituted by representatives of every ward councillor. 23 For instance, one of the LGAs reported that although they had budgeted for TZS 500/child in the previous FY, these funds did not come through during the FY. Another LGA reported that although there are many children identified as severely malnourished within the LGA, they do not have funds to provide necessary treatment and supplements

Nutrition Public Expenditure Review: Mainland Tanzania and Zanzibar
© Oxford Policy Management 76
Operating transfers from the central government are both unpredictable and barely adequate to meet the departments core mandates (explained further below). LGAs rely heavily on donors for supply of vitamin A and other nutrition supplements. LGAs without donor support have bare minimum allocations channelled towards basic supervision visits which limits the extent of nutrition activities. For instance, a budget for distribution of vitamin A supplements is rendered unusable in the absence of a donor providing vitamin A supplements. Resource constraints also affect nutrition sensitive LGA departments which are often forced to rely on own source revenues. There is very little consultation between the DNuO and officers from nutrition sensitive departments during the process of budget preparation.
Given resource constraints and lack of training, the NNS and NMNAP do not guide budget preparation processes, and LGAs are unable to budget adequately for priority areas identified in these strategy documents. Even if they do, there are significant variations between submitted budgets and approved budgets. In two of the six districts visited, the Nutrition Steering Committee had never met. In another two they met quarterly and in two others, they met once or twice a year. The Committee is used as a platform to review implementation of activities during the financial year and not as much as a platform to consult with members during budget preparation. One of the reasons for irregular meetings of the steering committee is the lack of budget to finance such meetings24.
Fund flow to LGAs:
Once the budget is approved, the Health Secretary informs the DNuO of total budget allocated. Whilst there is limited fiscal space to carry out nutrition related activities and significant differences between the submitted budget and approved budget, LGAs do not face delays in transfer of funds approved for nutrition specific activities (distribution of supplements) since most of them are financed from the Health Basket Fund transferred regularly every quarter.
Nutrition sensitive activities, on the other hand, are financed from operating transfers from the central government to nutrition sensitive departments such as agriculture, education and community development. In the face of severe delays and irregularities in transfers from the central government (United Republic of Tanzania, sub-national PEFA,2016:41), LGA’s own source revenues are sometimes used to finance operating expenses of nutrition sensitive departments.25 However, own source revenues constitute only 30% of LGA total revenues (United Republic of Tanzania, PEFA, 2017:56) and much spending is prescribed. For example, central government guidelines require LGAs to spend 40% on development activities and 60%26 on recurrent activities. Further to this, LGAs receive numerous ad-hoc guidelines issued during the financial year requiring LGAs to implement new initiatives27. This further draws down on existing resources-both operating transfers and own sources. As a result of these challenges and given competing priorities, nutrition sensitive departments do not have adequate fiscal space and autonomy to promote nutrition sensitive interventions. Their immediate priority remains to meet basic operating needs and mandate of the departments. Despite these challenges, a lot of interventions funded at the local level
24 DNuO from one LGA indicated that it costs approximately TZS 750,000 to convene one meeting and more to convene steering committee meeting at the regional level. 25 Most LGAs reported that only 30-40% of approved budget is executed/transferred to the LGA during the year. 26 Although for the time period that this study covers-FY 2014/15 and 2015/16-LGAs were required to budget 60% for development activities and 40% for recurrent activities. 27 One LGA reported that the Planning Office received 15 directives in FY 2016/17 requiring the district to finance these activities from own source revenues. In FY 2016/17, all LGAs were required to procure school desks in all classroom which required re-allocation of resources. Similarly, in order to budget for nutrition, the LGA has had to reduce allocation to other activities relating to HIV AIDS.

Nutrition Public Expenditure Review: Mainland Tanzania and Zanzibar
© Oxford Policy Management 77
are nutrition sensitive (more by default than by design), including improving agricultural produce of food crops, providing clean drinking water and sanitation facilities.
The level of consultation and coordination between health department and other nutrition sensitive department varies from one LGA to another. In some cases, there is significant coordination between the DNuO, community development and health officer in carrying out sensitization activities and similarly between the agriculture and health officer. In others, the steering committee is not functional and there is very little coordination with the nutrition officer sometimes. This can be partly attributed to protocol issues given the nutrition officer is lower in rank to heads of other departments. Within the health department, the DNuO works with the District Vaccination Officer, Pharmacist and the RCHO (R Community Health Officer) to distribute nutritional supplements-Vitamin A and Mebendazole twice in a year (June and December). These visits are combined with other agenda relating to supervision and sensitisation activities28. Funds for distribution are transferred from the central government to the health sector account as a part of the HBF and health O.C; the DNuO requests for withdrawal of funds which is released after approval by the Treasury and DED within a week’s time from requesting for release of funds. UNICEF supplies nutrition supplements directly to the medical store department for onwards transfer to health facilities. (See Figure 24 below)
The Health Basket Fund is channelled to meet priorities and targets set out in the CCHP guidelines aimed at improving quality and access to health care. Key priorities for the health department relevant to provision of good nutrition include provision of medicines (constitutes 33% of HBF spending), immunisation services, treatment of non-communicable diseases. The CCHP provides guidelines on proportion of total health budget to be allocated towards different types of health services: CHMT (15-20%), Council hospitals (25-30%), Agency hospitals (10-15%), health centres (15-20%), dispensaries (20-25%) and community health initiatives (2-5%). Every spending unit has a separate budget and ceiling. Previously, funds were transferred to health care facilities through the LGA. From FY 2017/18 onwards, funds are transferred directly from the MoHSW to the health care facilities. Funds to procure medicines are transferred to the MSD which is required to procure required medicines and supply to health facilities. This is managed through the Integrated Logistics System wherein each facility’s allocation is earmarked; this is managed by the MoH and by the DMO at the LGA level. Figure 23 and Figure 24 below illustrate the flow of funds and medicines to health facilities.
Most LGAs visited remarked that the direct transfer of funds from MOFP to health facilities will improve efficiency of spending since first, it will now be fully spent on expenses of the health facilities without any re-allocation at the LGA level; and second, it will improve timeliness of transfers. However, health facilities will need training on managing and reporting expenditure.
28 Most nutrition officers remarked that they usually work closely with vaccination and health officer to cover all wards within the LGA. They divide up the wards to be covered among themselves. Supervision and sensitization relate to infant and child health feeding practices, prevention of NCD, assisting health workers with using anthropometric equipment along with broader health supervision visits.

Nutrition Public Expenditure Review: Mainland Tanzania and Zanzibar
© Oxford Policy Management 78
Figure 23. Flow of funds to health facilities
Figure 24. Supply of medicines to health facilities
Source: authors adaptation based on key informant interviews
Challenges in budget execution:
Budget execution challenges are demonstrated in section 4.1.4. Some of the potential reasons behind the issues faced by LGAs during the financial year include:
GoT does not provide LGAs with a disbursement or transfer schedule at the beginning of the FY (United Republic of Tanzania, sub-national PEFA,2016:39). There are some sector-specific guidelines (e.g. CCHP guidelines for health) but there are no overarching guidelines relating to timeline for transfers and priorities making it challenging for LGAs to predict flow of funds;
Apart from the Health Basket fund, there is uncertainty around magnitude and timing of transfers especially relating to operating transfers.
Sector officials in LGAs were largely unaware of allocation formulas used as the basis for allocation of recurrent grants to each LGA
There is ambiguity around how program funds should be re-allocated in the event of unavailability of funds allocated by the central government and on re-allocating to finance additional priorities to be implemented during the financial year;
LGAs receive multiple spending directives as priorities change during the financial year. As a result, plans and budget formulated at the beginning of the year cannot be implemented as planned;

Nutrition Public Expenditure Review: Mainland Tanzania and Zanzibar
© Oxford Policy Management 79
All LGAs reported that they can spend all funds received LGAs account given the small scale of transfers; reports indicate a low execution rate, but this is owing to disparities between the approved budget and funds released by the MoF. In most LGAs visited, only 30-40% of allocations were transferred in the previous year and in some instances, funds were transferred only once in six months.
Specifically relating to nutrition specific interventions, the most critical issue relates to lack of fiscal space resulting in unavailability of key medicines and supplies in health facilities.
The CCHP matrix introduced in FY 2016/17 sets out clearer priority areas along with activities. However, it runs the risk of prescribing specific proportions of expenditure to different health services without regard to the different needs of LGAs. For instance, some LGAs would prefer to invest more than 5% in community health initiatives and a lesser proportion to dispensaries especially if donors are already supporting these facilities.
In relation to nutrition sensitive interventions, there is a clear commitment to improving nutrition
standards. However, current levels of funding barely enable departments to meet their core
mandate.
Box 8. IT systems at LGA level
Source: Authors
IT systems at the LGA level
PlanRep is used at the national and LGA level to prepare annual budgets (both revenue forecasts and budget allocation) and MTEFs. Each spending unit is required to prepare their budgets on PlanRep and submit it to the MoFP or PO-RALG in the case of LGAs. This was introduced from FY 2013/14 onwards.
Approved budgets are uploaded to EPICOR 9.0, GoT’s financial management information system. Each spending unit is required to manage spending and report on expenditure through EPICOR. Quarterly and annual expenditure reports can be run on the EPICOR. The PO-RALG can access every LGA’s expenditure reports. In theory, the system is integrated with systems across all LGAs. A small number of LGAs do not have EPICOR or at all. They are mostly LGAs which have recently been established.
The financial statements reviewed by the National Audit Office may be prepared using EPICOR
data, but they are actually prepared in MS Word. Hence, it is perfectly possible for almost all
LGAs to have submitted financial statements for audit in a timely manner (as is the case), while
at the same time EPICOR data submitted to PO-RALG may not be up-to-date.
Expenditure reports can be extracted from EPICOR at the LGA level. However, PO-RALG was
unable to produce a consolidated execution report for all LGAs, presumably because they do
not have a complete set, or because quality issues for some submissions are unresolved.
The PlanRep was revised in 2017 to include nutrition as a cost centre. The nutrition priorities
in the PlanRep are in line with the NMNAP. Inclusion of a nutrition cost in PlanRep it expected
to make local government nutrition spending analysis much easier from FY 2018/19.

Nutrition Public Expenditure Review: Mainland Tanzania and Zanzibar
© Oxford Policy Management 80
Reporting and accountability:
Quarterly and annual expenditure reports can be generated through EPICOR both at LGAs and by the PO-RALG. However, these reports do not feed into the planning processes in the following financial year. This can be attributed to ad-hoc spending during the year which means that priorities change from one year to another. For instance, in 2016/17, a majority of expenditure was on procuring school desks as this was a priority for the central government. However, this did not guide allocations in 2017/18.
The DNuO is required to report quarterly to the CHMT and to the RNuO on implementation of activities. Expenditure on nutrition specific activities relating to distribution of nutrition supplements is recorded in EPICOR. However, it has not been possible to distinguish expenditure since nutrition was not a separate cost centre but embedded within the health department. Spending on nutrition activities can be identified if EPICOR expenditure reports are merged with activities listed in MTEF (extracted from PlanRep).
Data collected through the DHIS are aggregated at the regional level. This makes it impossible for LGAs to track SAM and MAM cases by wards. As a result, LGAs are unable to identify regions within LGA that require more supplements and outreach services.
Health workers have received training in using anthropometric equipment in last two years resulting in better quality data. Also, the technology has resulted in more cases being recorded over this time period and should not be taken to mean that there is an actual increase in SAM and MAM cases.
Key findings:
Nutrition budgets not prioritised at local level because of resource constraints and lack of awareness amongst councillors; and DNuO does not have the position/authority to make the nutrition budget case. NNS/NMNAP goals cannot be pursued effectively.
Nutrition Steering Committees meet irregularly or not at all, and do not focus on nutrition budget review or future budget planning.
DNuO has little influence on nutrition-sensitive budgets outside health
Transfers from central government are unpredictable both in amount and timing, adversely affecting planning; some LGAs reported receiving only 30-40% of OC transfers in 2015/16; LGAs report that they spend all funds received – shortfalls in execution arise from short releases.
EPICOR is still unable to produce LGA financial statements which are produced in MSWord.
EPICOR/PO-RALG is not able to produce consolidated LGA financial reports which would enable a nationwide view of nutrition spending
From 2017/18 MOFP will transfer funds directly to health facilities, and this is expected to improve health sector nutrition spending
PlanRep was revised in 2017 to introduce nutrition as a Cost Centre which is expected to make nutrition-specific reporting more effective
Links to relevant recommendations:
R2 (to MOFP, PORALG, all implementing agencies) Better budget management and efficiency
R5 (To PO-RALG; RAS; LGAs) Strengthen the nutrition enabling environment at LGA level
R6 (To PO RALG, LGAs, UNICEF, Development Partners) Improve sensitisation at the community level
R7 (To MoFP, PO-RALG): Improve the financial management to better monitor nutrition spending
Nutrition Public Expenditure Review: Mainland Tanzania and Zanzibar
© Oxford Policy Management 81
4.3 Technical efficiency and equity
4.3.1 Technical efficiency
The inception mission confirmed that the data required to look at relative cost efficiencies
(including accurate SAM treatment numbers, and sufficiently disaggregated expenditure
data) is not readily available. Both of these will be required in order to carry out reviews in
future years, and we recommend that RNUOs and DNuOs are issued guidance, from
MoHSW or TFNC, and the necessary support to gather this data on a regular basis. Analysis
of technical efficiency can also be supported by data generated through the six-monthly
Bottleneck Analysis now being carried out.
Nonetheless, we comment in the report on the shortcomings of the enabling environment at
the LGA level which include the infrequent meetings of multisectoral nutrition committees. It
is likely that technical efficiency at the council level could be enhanced through a regular and
focused review of nutrition results by this committee.
4.3.2 Equity
A complete benefit incidence analysis is beyond the scope of this PER. Nonetheless in order to generate preliminary insights into equity in nutrition spending, nutrition spending data from the 22-district core sample is plotted against proportions of stunted children in those districts. Figure 25 below plots the proportion of stunted children against nutrition spending per child under the age of 5 years.

Nutrition Public Expenditure Review: Mainland Tanzania and Zanzibar
© Oxford Policy Management 82
Figure 25. Proportion of stunted children plotted against nutrition
spending per child U5
Source: PER dataset, DHS 2016. Spending is calculated as average of 2015 and 2016; Only nutrition specific
interventions and enabling environment are included in spending, nutrition sensitive is excluded. DHS does not
provide stunting by LGA. It is aggregated at region level. Stunting value for the region is used as a proxy for
stunting proportion in an LGA
In Figure 25, most values are clustered in the lower half of the graph. This indicates that, irrespective of the stunting proportion, nutrition spending per child U5 is not very high, with only 7 of 22 LGAs spending more than TZS 1000 per capita under 5. Spending appears to increase broadly with stunting levels; both Makete DC and Njombe TC have a high stunting rate and the highest nutrition spending per child. At least in Makete, this can be attributed to donor interventions.
Figure 26 considers numbers of stunted children, rather than the proportion of stunted children. The graph indicates that there is no correlation between the number of stunted children and the nutrition spending per stunted child. For instance, many LGAs with a relatively high number of stunted children (right side of the graph) spend lower amounts on nutrition (below average). Further, Moshi DC has one of the highest number of stunted children and yet one of the lowest nutrition spending per stunted child.
Chunya DC
Dodoma MC
Iringa MC
Kilolo DC
Kisarawe DC
Kongwa DC
Kyela DC
Lushoto DC
Makete DC
Manyoni DC
Masasi DC
Mbeya CC
Morogoro DC
Morogoro MC
Moshi DC
Namtumbo DC
Njombe TC
Same DCSikonge DC
Songea MC
Tabora MC
Ulanga DC
0.00
200.00
400.00
600.00
800.00
1000.00
1200.00
1400.00
1600.00
1800.00
2000.00
25.00 30.00 35.00 40.00 45.00 50.00 55.00
nu
trit
ion
sp
en
din
g p
er
ca
pit
a U
5 (
TZ
S)
stunting (%)
avg spending per capita U5 Linear (avg spending per capita U5)
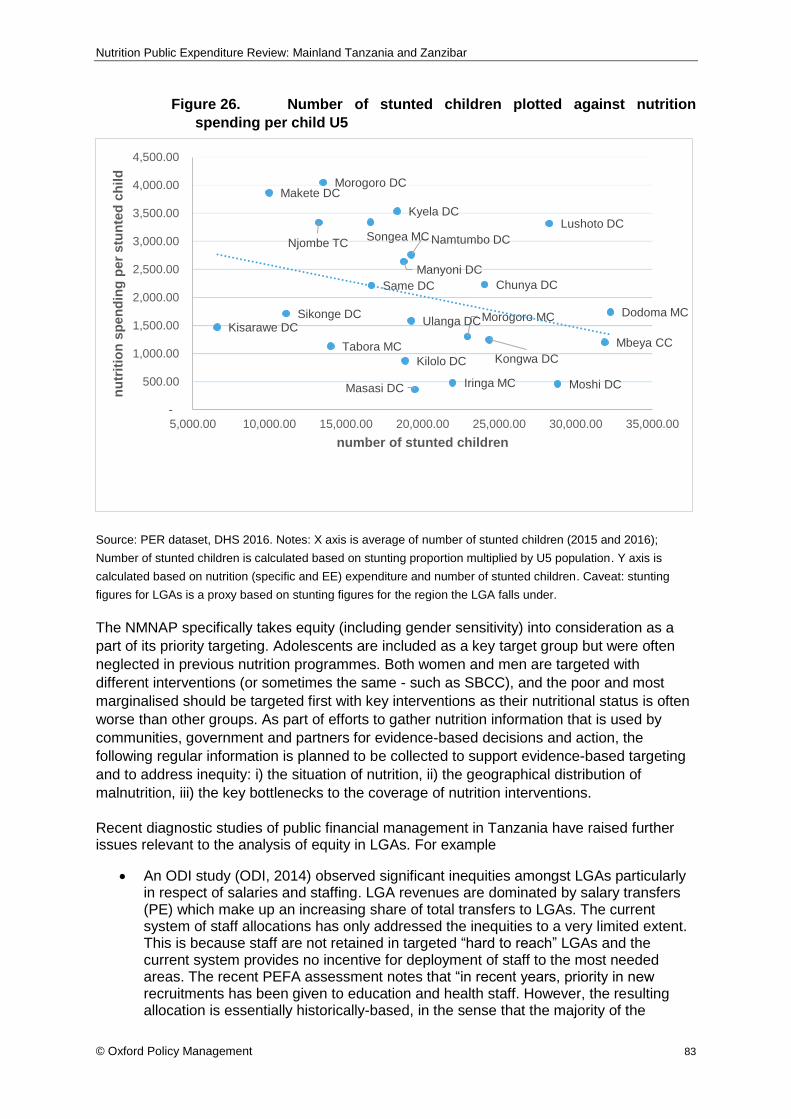
Nutrition Public Expenditure Review: Mainland Tanzania and Zanzibar
© Oxford Policy Management 83
Figure 26. Number of stunted children plotted against nutrition
spending per child U5
Source: PER dataset, DHS 2016. Notes: X axis is average of number of stunted children (2015 and 2016);
Number of stunted children is calculated based on stunting proportion multiplied by U5 population. Y axis is
calculated based on nutrition (specific and EE) expenditure and number of stunted children. Caveat: stunting
figures for LGAs is a proxy based on stunting figures for the region the LGA falls under.
The NMNAP specifically takes equity (including gender sensitivity) into consideration as a
part of its priority targeting. Adolescents are included as a key target group but were often
neglected in previous nutrition programmes. Both women and men are targeted with
different interventions (or sometimes the same - such as SBCC), and the poor and most
marginalised should be targeted first with key interventions as their nutritional status is often
worse than other groups. As part of efforts to gather nutrition information that is used by
communities, government and partners for evidence-based decisions and action, the
following regular information is planned to be collected to support evidence-based targeting
and to address inequity: i) the situation of nutrition, ii) the geographical distribution of
malnutrition, iii) the key bottlenecks to the coverage of nutrition interventions.
Recent diagnostic studies of public financial management in Tanzania have raised further issues relevant to the analysis of equity in LGAs. For example
An ODI study (ODI, 2014) observed significant inequities amongst LGAs particularly in respect of salaries and staffing. LGA revenues are dominated by salary transfers (PE) which make up an increasing share of total transfers to LGAs. The current system of staff allocations has only addressed the inequities to a very limited extent. This is because staff are not retained in targeted “hard to reach” LGAs and the current system provides no incentive for deployment of staff to the most needed areas. The recent PEFA assessment notes that “in recent years, priority in new recruitments has been given to education and health staff. However, the resulting allocation is essentially historically-based, in the sense that the majority of the
Chunya DC
Dodoma MC
Iringa MC
Kilolo DC
Kisarawe DC
Kongwa DC
Kyela DCLushoto DC
Makete DC
Manyoni DC
Masasi DC
Mbeya CC
Morogoro DC
Morogoro MC
Moshi DC
Namtumbo DCNjombe TC
Same DC
Sikonge DC
Songea MC
Tabora MC
Ulanga DC
-
500.00
1,000.00
1,500.00
2,000.00
2,500.00
3,000.00
3,500.00
4,000.00
4,500.00
5,000.00 10,000.00 15,000.00 20,000.00 25,000.00 30,000.00 35,000.00
nu
trit
ion
sp
en
din
g p
er
stu
nte
d c
hild
number of stunted children

Nutrition Public Expenditure Review: Mainland Tanzania and Zanzibar
© Oxford Policy Management 84
allocation is determined by the numbers in post and no specific priority is given to LGAs with greater staff shortages” (MOFP, 2017). Anecdotal evidence suggests that staff numbers maybe a driver of nutrition inequities; community workers do not receive hard to reach allowances except in districts with donor interventions aimed at reducing intra-LGA inequity. However, coverage of donor funded top-ups is not nationwide: Sumbawanga is a district with some of the highest stunting rates and yet receives very little support from donors. Although some DNuOs have made an effort to budget for outreach activities, these reportedly cut during the budget approval process.
The 2017 PEFA observes that there is still no transparent and accountable formula for financial transfers to LGAs, but rather transfers are based on administratively determined norms, which since 2013/14 have been adopted each year in a relatively ad hoc manner. With LGA reliance on transfers from central government (which accounted for 70% of local government revenues in FY 2015/16 (MOFP, 2017)) the fact that these are not equity sensitive is likely to have ramifications for the availability of funding for nutrition spending at the local level, particularly in those localities where own-source revenues are scarce.
Key findings:
SAM Treatment data not collected and collated
Nutrition spending per child in LGAs does increase broadly with stunting levels (proportion of malnourished children) but not with absolute numbers of children suffering from malnutrition.
The NMNAP takes equity into account on several levels
There is significant, historically-based, budget inequity between LGAs particularly in the area of salaries and staffing
LGA transfers are still made in an ad hoc manner without regard to variations in need Links to relevant recommendations: R3 (To MoFP, PO-RALG) Improve equity in nutrition (and in LGAs) R9 (to HLSCN, MoHSW and TFNC) Collect and collate SAM treatment data

Nutrition Public Expenditure Review: Mainland Tanzania and Zanzibar
© Oxford Policy Management 85
5 Conclusions for Mainland Tanzania
5.1.1 Limitations of analysis pertinent to these conclusions
Assessment of nutrition expenditures has proved difficult as a result of the non-
availability or poor quality of nutrition financial data. These limitations are widely
referenced throughout the text. They arise in part because nutrition is multi sectoral in nature,
and the collection of financial data across several ministries is complex. They also arise
because most nutrition spending is at LGA level, which is where financial management
systems are least well developed. However, the analysis has also suffered from generic
challenges faced in public financial management and financial reporting in Tanzania, many of
which are noted in reports of the National Audit Office, the 2017 PEFA, the 2016 subnational
PEFA, and earlier diagnostics. In saying this, the PER team acknowledges the PFM reform
efforts being made by GoT, and the PFM Plan of Action.
An additional data challenge, relevant mostly for cross-sectoral analysis, is that budget
execution reports from EPICOR do not indicate the activities and objective identified in
the MTEF against which an expenditure is made; this makes it challenging to track cross-
sectoral expenditure.
The assessment of nutrition expenditure is further limited where responses to requests for
financial information from development partners have been incomplete. This is especially
important because the sector receives external support in excess of 40% of total spending.
5.1.2 Conclusions
Clear progress has been made in nutrition in the last two and a half decades, but
there is still a long way to go. The rate of stunting among under 5 children has dropped
significantly since 2010 but underweight has only declined marginally during the same
period. Over half of under five children still suffer from anaemia. Among women of
reproductive age, levels of underweight have stagnated, whilst the percentage overweight
has dramatically increased. Rates of anaemia have also stagnated. For all of these figures
there are striking differences between regions in prevalence rates. Inequities in child nutrition
are also evident with children in the lowest household wealth quintile recording stunting
levels twice as high (40 percent) as for children from the highest wealth quintile (19 percent).
A comprehensive costed policy document (NMNAP) has been developed and adopted.
Nutrition is a priority for the central government and technical staff at the council level,
but not always for decision makers at the council level who face many competing
demands for funding. Some of these decision-makers are not fully briefed on NMNAP and the
critical importance of nutrition spending. One of the reasons that councillors do not prioritise
nutrition (apart from lack of fiscal space) is that communities do not prioritise nutrition due to
lack of awareness. So, there isn’t much political traction-won’t win them votes.
The adequacy and effective operation of nutrition budgets are hampered by national
level challenges in PFM: stagnation in the levels of tax collection curbs the development of
fiscal space needed for nutrition; also, the unreliability of budgets demonstrated in the 2017

Nutrition Public Expenditure Review: Mainland Tanzania and Zanzibar
© Oxford Policy Management 86
PEFA together with cash rationing represent a challenge for all service delivery, not just
nutrition.
The nutrition enabling environment at LGA level requires strengthening. In particular:
Multisectoral committees don’t meet regularly. When they do meet, they do not
necessarily monitor progress against the NNS/NMNAP – a key role.
The DNuO is not influential at the District. She/he should be full member of CHMT,
and a fully/partly trained nutritionist, rather than reassigned from health.
Key personnel are not fully sensitized on nutrition imperatives and NMNAP.
The DNuO currently puts together a nutrition workplan without a ceiling; more broadly, ceilings are issued much later in the process of budget preparation which undermines the planning process at the LGA level. In all LGAs visited, unless there are other donor interventions, the only nutrition specific & EE activities financed by government include distribution of vitamin A supplements, Mebendazole, sensitisation activities and nutrition steering committee meetings (in about half of the LGAs visited).
Our assessment of nutrition expenditures is based on assumptions and estimates to
account for data limitations which include: the absence of data from some central ministries,
particularly Education; incomplete information on off-budget grants; very patchy or absent data
for LGAs; the total absence of financial information for 52 LGAs; and the difficulties of linking
LGAs’ EPICOR/IFMIS budget lines to MTEF activities. Nonetheless:
Actual spending on nutrition in LGAs is estimated as 56.8% of the total in
2014/15 and 54.5% in 2015/16. 2015/16 needs careful interpretation because
government funding from own sources nutrition fell sharply, but central government
spending as a whole rose because of the commencement of TASAF, a major cash
transfers programme. It is difficult to compare this finding with years 2011/12 to
2013/14 reported in the 2014 PER because of the different methodologies involved.
However, this is an increase on the proportion indicated in the UNICEF Nutrition
Budget Briefs (UNICEF, 2016) which calculated that districts and municipalities
accounted for 52% of all nutrition expenditures in the period 2011/12 to 2014/15.
Nutrition expenditure is estimated to have fallen from 4.5% of total government
expenditure in 2014/15 to 3.8% in 2015/16. This fall is a combined result of a 5%
increase in nominal nutrition expenditures highlighted above, against a 29% increase
in total government expenditure (mostly recurrent).
The vast majority (over 95%) of allocations and expenditures go towards nutrition-
sensitive interventions, which seek to address the underlying causes of malnutrition, across
a range of sectors. A much smaller share of reported allocations (2%) directly address
malnutrition through nutrition-specific approaches, and a further 2% of funds support the
governance and policy processes around nutrition.

Nutrition Public Expenditure Review: Mainland Tanzania and Zanzibar
© Oxford Policy Management 87
6 Recommendations for Mainland Tanzania
This section presents recommendations which are made in the light of the evidence presented
above. These were discussed with the PER steering committee in July 2018, and the Plan of
Action which was subsequently agreed is presented in Annex H.
R1. (to MoFP, MDAs and LGAs) Address the adequacy of budgets for nutrition
Rationale: There are many instances throughout this report where critical nutrition plans have not been carried out as a result of resource constraints. The Government of Tanzania plans to significantly increase nutrition-specific spending at LGA level, and this is welcomed. The competing needs of all sectors are recognized. However, dramatic improvements in nutrition funding are needed to meet international benchmarks, and nutrition interventions make excellent investments.
Implementation: MoFP to implement the PFM Action Plan; to mobilize additional revenues to reach at least regional averages and allocate a part to nutrition interventions; to ensure that where possible LGAs and MDAs also maximise their revenue raising potential. The major task falls to the MoFP, but Development Partners and UNICEF may be able to support the process with relevant analyses of fiscal space availability and sectoral needs.
R2. (to MOFP, PORALG, all implementing agencies) Better budget management and efficiency
Rationale: Better budget management and efficiency improvement is critical to securing better nutrition outcomes. The PEFA noted that the PFM system faces challenges in terms of arrears and predictability in availability of funds. All affect nutrition outcomes. They are closely linked and require a central and multisectoral response which is indicated in the PFM Action Plan.
Implementation: recommendations and programmes already exist in the PFM Action Plan whose first three strategic objectives are: for improved macro-economic management to provide the basis for a credible budget; to allocate resources efficiently on a medium term basis in alignment with national priorities (which include nutrition); and for the budget to be executed as planned with timely and accurate reporting. These are major tasks of PORALG and the MoFP which require realistic budgeting and a new approach to cash rationing. It is incumbent upon MDAs and LGAs to engage with the process fully, ensure that the sectoral and sub-national viewpoints are taken into account, and to support agreed initiatives.
R3. (To MoFP, PO-RALG) Improve equity in nutrition (and in LGAs)
Rationale: LGA transfers are still made in an ad hoc and mostly incremental manner without regard to variations in need, and budgets for salaries and staffing are particularly skewed for mostly historical reasons. Also, inequities exist specifically within nutrition: spending per child in LGAs does increase broadly with stunting levels (proportion of malnourished children) but not with absolute numbers of children suffering from malnutrition. The good news is that the NMNAP takes equity into account on several levels.
Implementation: The task is primarily for MoFP and PO-RALG to correct the high level inequities and to overcome the institutional and political challenges involved. At present the PFM Action Plan does not address LGA equity issues, and this omission must be addressed in any revision. Consideration can be given to a supplementary health/nutrition grant for those LGAs with high numbers of children or adults suffering from malnutrition, and such grants can be adjusted as data is improved.

Nutrition Public Expenditure Review: Mainland Tanzania and Zanzibar
© Oxford Policy Management 88
R4. (To MoFP, PO-RALG): Further incentivise nutrition expenditures
Rationale: The Government of Tanzania currently incentivises nutrition expenditures on the mainland through requiring that there should be a budgetary allocation in each council of TZS 500/= per year for each child under 5, for 2017/18 – 2018/2019 (and rising in future years); and that regions should allocate TZS 5,000,000/= per council. Nutrition expenditures could be further strengthened in two ways: by making these increases mandatory and monitoring to ensure effective compliance; and secondly by awarding protected status to nutrition-specific and nutrition enabling environment expenditures.
Implementation: Nutrition-specific spending has now been made mandatory, but it must also be accountable. The PO-RALG review of submissions (or potentially the NAO audit process) will be required to verify. MOFP approval will be required for any national level nutrition allocations to be awarded protected status. The exact allocations would need to be specified. Finally, MOFP might consider a matching grant to encourage key nutrition expenditures from own source funds.
R5. (To PO-RALG; RAS; LGAs) Strengthen the nutrition enabling environment at LGA level
Rationale: Most nutrition expenditures are undertaken at LGA level, but the enabling environment for nutrition at LGA level is not strong. Nutrition committees don’t meet regularly, and in many districts not at all. When they do meet, they do not necessarily monitor progress against the NNS/NMNAP. The DNuO is not influential at the District. She/he should be full member of CHMT, and a fully/partly trained nutritionist, rather than a reassigned health officer. Finally, key personnel are not fully sensitized on nutrition imperatives and NMNAP.
Implementation: Ensure that multisectoral nutrition committees meet regularly and visibly monitor progress against the NMNAP as part of the revision of TORs. A directive from PO-RALG to that effect may have some influence. Training DNuOs in nutrition may be attractive to some development partners; however, ensuring that DNuOs are full members of the CHMT will require PO-RALG authorization; sensitization of key personnel (DHO, responsible sector staff, Council chair, Council members) on nutrition imperatives and NMNAP is a task for TNFC, and one which partners may again be willing to support.
R6. (To PO RALG, LGAs, UNICEF, Development Partners) Improve sensitisation at the community level
Rationale: One of the reasons that councillors do not prioritise nutrition (apart from lack of fiscal space) is that communities do not prioritise nutrition due to lack of awareness. So, there isn’t much political traction – nutrition won’t win votes.
Implementation: There is a need for Government and development partners to improve sensitisation, and to find new channels of communication etc. For instance, Southern Highlands regions are among the biggest producers of food crops in Mainland, yet are among the regions with the highest stunting rates among children under five years.
R7. (To MoFP, PO-RALG): Improve the financial management to better monitor nutrition spending
Rationale: a major limitation of this exercise has been the incompleteness of the underlying financial data and the lack of interconnected financial systems. The challenges faced include lack of data; poor quality of data; and lack of linkages between financial documents and/or systems. Many of these limitations have been recognised in National Audit Office reports, other diagnostics, and in PFMRP V. They are particularly severe at the LGA level. The introduction of a nutrition cost centre is welcomed but is not a panacea. It will need proper

Nutrition Public Expenditure Review: Mainland Tanzania and Zanzibar
© Oxford Policy Management 89
introduction if it is to be widely used in nutrition-relevant ministries, and it may not easily capture nutrition-sensitive activities outside the health sector.
Implementation: ensure that where possible, donor-financed programmes to support nutrition at the subnational level include a governance component to support financial management initiatives; monitor and maximise the use of the nutrition Cost Centre; support PFM Action Plan Strategic Objective 3 for the budget to be executed as planned with timely and accurate reporting. Strengthen the budget monitoring capacity of TFNC and agree their role in monitoring the recommendations of this PER; re-emphasise role of HLSCN in nutrition budget monitoring.
Review and if needed, modify the mechanisms for reporting and accountability for nutrition budgets, spending and results including the nutrition budget/performance roles of DNuO; RNuO; RAS; PORALG; and MDAs. Review and if needed, modify the mechanisms for reporting and accountability for nutrition budgets, spending and results including the nutrition budget/performance roles of DNuO; RNuO; RAS; PORALG; and MDAs. Finally, plan for a new nutrition PER in 2020 to cover 2016/17; 2017/18 and 2018/19. This PER should build on the present one with more in-depth efficiency and effectiveness analysis, and could also seek to capture costs associated with treatment of over-nutrition. This could draw on data from the bottleneck analysis which reviews barriers to nutrition outcomes (related to the availability of inputs).
R8. (to HLSCN) Establish a cross sectoral financing mechanism for nutrition
Rationale: coordination and monitoring is always a problem for cross sectoral budgets.
Implementation: with time, GoT (or RGZ) may wish to explore possibilities for devising a cross-sectoral financing mechanism for nutrition. This could be in the form of a converged budget programme for nutrition, under which multiple agencies can bid for funds; or budget programmes can remain under the purview of a single MDA, but with more formalised arrangements to enable other MDAs to contribute to how those funds are implemented and managed. This can be done using the Common Results, resources and Accountability Framework (CRRAF) of the NMNAP.
R9. (to HLSCN, MoHSW and TFNC) Collect and collate SAM treatment data
RNuOs and DNuOs to be provided with the necessary guidance (from MOHSW and/or TFNC) and resources to collect and collate SAM treatment data so that technical efficiency of LGAs can be assessed. Where appropriate, this should draw on data already collected for the nutrition bottleneck analysis.
R10. (to development partners) Adhere to recent PORALG guidelines on reporting on nutrition allocations and expenditures to local governments
Rationale: reporting of nutrition ODA in Tanzania is fragmented and incomplete. This was evidenced by the need to issue a reporting template to development partners in order to compile for this PER. Local governments require accurate and timely information on ODA to ensure their medium term expenditure frameworks are comprehensive and represent the most efficient and effective use of scarce resources. Donor reporting should be systematic and harmonised to meet this need, whilst also limiting the administrative burden placed on development partners.
Implementation: PO-RALG has recently issued a directive to development partners concerning the timely reporting on ODA allocations and expenditures to local governments. Development partners should aim to meet this directive in a timely manner. These reports

Nutrition Public Expenditure Review: Mainland Tanzania and Zanzibar
© Oxford Policy Management 90
should be compiled by PORALG and made available for other analyses as required (including future PERs).

Nutrition Public Expenditure Review: Mainland Tanzania and Zanzibar
© Oxford Policy Management 91
7 Zanzibar: context
7.1 Nutrition landscape
Zanzibar has made good progress in reducing rates of undernutrition since the early 1990’s. However, the prevalence and the burden of undernutrition remain high. Table 20 below shows the trends in key nutrition indicators between 1992 and 2016 based on the Tanzania Demographic Health Survey (TDHS).
Table 20. Trends of Key Nutritional Indicators for Zanzibar
Nutrition Indicator Status (%) Trend Sources
1991-92 2015-16
Stunting (children (0-59
months)
48 24 ▼ TDHS 2015-16 / TDHS 1991-92
Wasting (children (0-59
months)
10 7 ▼ TDHS 2015-16 / TDHS 1991-92
Underweight (children 0-59
months)
41 14 ▼ TDHS 2015-16 / TDHS 1991-92
Exclusive breastfeeding
(children 0-6 months)
--- 20 NNS 2014
Vitamin A deficiency (children
6-59 months)
---
(1997)
38
(2010)
National Vitamin A Survey 1997
TDHS Micronutrient Survey
2010
Anaemia (children 6-59
months)
75
(2004/05)
65 ▼ TDHS 2015-16 / TDHS 2004-05
Underweight - Body Mass
Index <18.5 (women of
reproductive age)
12 12 ▬ TDHS 2015-16
Anaemia (women of
reproductive age)
63
(2004/05)
60 ▼ TDHS 2015-16 / TDHS 2004-05
Overweight - Body Mass
Index =>25 (women of
reproductive age)
27
(2004/05)
39 ▲ TDHS 2015-16 / TDHS 2004-05
Source: authors. Notes: ▼ indicates decrease, ▲ indicates increase, ▬ indicates no change; green
indicates favourable trend, red indicates unfavourable trend.
The level of stunting declined by half between 1991-92 and 2015-16 in Zanzibar but significant regional differences exist with rates lowest in Mjini Magharibi (17 percent) and highest in Kaskazini Pemba (34 percent). Underweight shows an even larger improvement from 41 to 14 percent over the same time period although regional disparities persist. Wasting dropped from 10 percent to 7 percent (Figure 27), with some regional differences seen. In contrast, the level of undernutrition among women aged 15-49 years old (BMI <18.5) at 12 percent is virtually unchanged between 1991 and 2015. Overnutrition is an issue of growing relevance, as more sedentary lifestyles take hold and diets change. The

Nutrition Public Expenditure Review: Mainland Tanzania and Zanzibar
© Oxford Policy Management 92
prevalence of obesity and overweight amongst women of reproductive age stood at 39 percent in 2015-16.
Figure 27. Nutritional status of children under 5 in Zanzibar
Source: Based on TDHS data
Levels of stunting, underweight and wasting amongst children under 5 have shown marked improvement over the last 2 and a half decades, but the same cannot be said for micronutrient deficiencies. Levels of anaemia are particularly concerning. Among children under 5 rates have only declined 10 percent, and among women of reproductive age even less progress has been seen with rates virtually identical with 2004-05. The 2010 TDHS micronutrient survey reports prevalence of vitamin A deficiency in children below 5 years as slightly higher than mainland Tanzania at 38 percent.
Exclusive breastfeeding up to 6 months is recommended as breastmilk contains all of the nutrients that the child needs at that age and is important for a child’s survival and well-being. However, in Zanzibar, the 2014 National Nutrition Survey found that only 20 percent of children under 6 months were exclusively breastfed.
Overall, progress has been made particularly to reduce the rate of stunting and underweight. However, micronutrient deficiencies and exclusive breastfeeding rates remain a concern. Also, differences in nutritional status between urban and rural areas and among different wealth quintiles persist and need to be considered in interventions.
7.2 PFM landscape
7.2.1 Planning and budgeting processes
The timeline for budget preparation in Zanzibar (Figure 28) mirrors that of mainland
Tanzania. September and October mark the beginning of the budget cycle in Zanzibar, with
the preparation and release of macroeconomic projections. Budget guidelines are issued in
March to guide MDAs in their Medium Term Expenditure Framework (MTEF) submissions.
48
3736
26
30
23.5
41
35
27
1819.9
13.8
10.2 10.58 7.8
12
7.1
0
10
20
30
40
50
60
Pre
va
ele
nc
e (
%)
1992 1996 1999 2004 2010 2016
Stunting Underweight Wasting (acute)

Nutrition Public Expenditure Review: Mainland Tanzania and Zanzibar
© Oxford Policy Management 93
Within MDAs, individual departments prepare budgets based on projected needs (as
emerging from sectoral management information systems and surveys). Once a ceiling is
issued to the MDA, the Accounting Officer in the Ministry prepares ceilings for each
department, upon which basis departmental budgets are recompiled. These are then
consolidated and deliberated in Ministerial management meetings, before being submitted to
MOFP-RGZ.
Budget guidelines instruct line ministries to align their budgets to the objectives of the Vision
2020, MKUZA and the Ministries’ sector strategic plan. MDAs are also instructed to include
all budget support contributions from Development Partners with the same level of detail as
other expenditure estimates i.e., all detailed GFS codes relevant for activities of the project
must be indicated.
Budget hearings between MDAs and MOFP-RGZ take place in February and March. In
practice, these dialogues are sometimes compressed or missed altogether, as was
reportedly the case in the post-election government restructure. However, when they take
place, discussions focus on whether planned expenditures are within ceilings, and if
activities are aligned with MKUZA priorities. Civil society or development partner inputs into
discussion of budget priorities are reportedly minimal, except where ODA contributions
require counterpart financing from RGZ.
Deliberations on sectoral budgets by parliamentary committees and the House of
Representatives, including their final approval, take place between April and June.
Figure 28. Summary of budget process in Zanzibar
Source: UNICEF, 2017.
7.2.2 Budget execution
RGZ has historically suffered from challenges in budget execution, particularly in the
development budget, for which only 57% and 60% of approved allocations were spent in
2012/13 and 2013/14. The challenges were largely due to delays in completion of
infrastructure projects, procurement issues and irregularity of aid inflows (UNICEF 2017).
Performance has improved in recent years, with development budget execution standing at
82% in 2016/17.29 However, problems do persist. There are continuing challenges in
29 According to provisional actual as presented in the budget speech FY 2017/18

Nutrition Public Expenditure Review: Mainland Tanzania and Zanzibar
© Oxford Policy Management 94
timeliness of disbursements from MOFP, with quarterly transfers coming towards the end of
the period. Also, some MDAs find difficulty in meeting donor requirements for disbursement
of on-budget ODA.
7.2.3 Budget structure
In 2013/14, RGZ began to transition from a line item budget structure, to a programme-
based budget. Piloted initially in a subset of MDAs, and for preparation purposes only, in
2015/16 it was rolled out across government, as the basis for planning and execution. This
shift was intended to support a change in focus from inputs to intended outcomes, or results
of spending. Programmes were created according to core functions of each vote, with sub-
programmes largely reflecting the different departments in the MDAs. There are no cross-
ministerial programmes in the budget, as this was deemed unimplementable for
accountability purposes (having multiple entities responsible for implementing a particular
programme makes attribution of performance issues challenging). However, interagency
collaboration can and does occur, albeit under distinct budget programmes.
All programmes have associated financial and non-financial performance indicators, with the
second drawn from MKUZA and sectoral strategic plans.
7.2.4 Decentralisation by devolution
For the years under consideration the budget process in Zanzibar is largely centralised. MDAs
are responsible for service delivery and hence, are each department is required to plan and
budget for activities to be implemented in the regions and districts. With the exception of the
health Basket Fund and payment of staff salaries in regions and districts, the MOFP-RGZ and
MDAs did not make any inter-governmental fiscal transfers to the regions and districts for the
purpose of service delivery. Local levels revenue collection is limited (for example, garbage
collection fees), and whilst there are no constraints around how it is spent, they are rarely
reported in full to the central government.
This is set to change from the FY 2017/18 onwards through a gradual process, as the RGZ
has embarked on the process of ‘decentralisation by devolution’ (DbyD). As initial steps certain
services have been decentralised from FY 2017/18: services related to provision of pre-
primary education; primary health care; and extension services under the agriculture sector.
Transfers have been made for these purposes (but with no mandatory stipulations defined by
RGZ regarding LGA budgeting in these sectors). The transfers are budgeted for under
PORALGSD (totals in Table 21below) but will be sent directly from MOFP-RGZ to the districts
(passing through the regions).
Table 21. Service delivery transfers to LGAs under DbyD (2017/18)
Sector Approved allocation of transfers to LGAs
(TZS)
Agriculture 375,000,000
Health 2,486,630,002
Education 1,721,291,243
Total 4,582,921,245
Source: data provided by PORALGSD

Nutrition Public Expenditure Review: Mainland Tanzania and Zanzibar
© Oxford Policy Management 95
At the time of the fieldwork it was too early in the lifespan of these transfers to pass judgement
of their utility or impact on service delivery. However, it was noted that the nature of the
activities implemented has not changed much; in the absence of strong local planning and
budgeting processes around these transfers, the districts management teams have tended to
implement the same set of activities as was previously being planned and financed from the
central level. Some concerns have been raised around PFM capacity at the local level; there
is no IFMS at the district level, and development partner-supported training is at an embryonic
stage. Also, district level staffing constraints exist, since historically these positions have not
been considered desirable.

Nutrition Public Expenditure Review: Mainland Tanzania and Zanzibar
© Oxford Policy Management 96
8 Zanzibar: methodology
This chapter sets out the methodology for data analysis and fieldwork, as it was applied to the
Zanzibar component of this PER.
8.1 Methodology and data availability
8.1.1 Years of analysis
Whilst the initial plan was to cover years 2013/14 – 2015/16, the final analysis for Zanzibar instead covers 2015/16 and 2016/17. The rationale for the shift was as follows:
Firstly, RGZ expressed the view that covering the most recent years for which full allocation and expenditure data is available, would be more policy relevant.
Secondly, RGZ moved from a line item budget to a programme and activity based budget in 2015/16. This new structure was more amenable to the identification of nutrition-relevant expenditures, as under the line item budget, the object of spending was not visible from the expenditure report.
Last, in 2015/16, to coincide with the introduction of the programme-based budget, MOFP-RGZ introduced a new version of its accounting software – EPICOR. Previous years’ data was not transferred to the new system, and access to data for years prior to 2015/16 was therefore problematic.
8.1.2 Sources of data
The table below summarises the sources of data for the Zanzibar element of the PER.
Table 22. Data sources - Zanzibar
Type of data Source
Government expenditure data Data on RGZ allocations and expenditures on nutrition was
sourced from the integrated financial management system
(IFMS) which is controlled by the accountant general’s
department in MOFP-RGZ.
Donor expenditure data Data for donor allocations on nutrition was sourced from the
Ministry of Health (MOH-RGZ), specifically through the
consolidated health sector Plan of Action, and detail on nutrition-
specific contributions from the nutrition unit.
An effort to collect data on allocations and expenditures through
a development partner data request and questionnaire (see
Annex 2) did not prove fruitful in the case of Zanzibar, as
responses were for the mainland only.
Demographic data Sourced from National Bureau of Statistics; 2012 census and
subsequent projections
Nutrition outcome data DHS 2015/16, HMIS reports from MOH-RGZ

Nutrition Public Expenditure Review: Mainland Tanzania and Zanzibar
© Oxford Policy Management 97
8.1.3 Data collection, consolidation, classification and cleaning processes
For Zanzibar, the collection, consolidation, cleaning and classification process consisted of the following steps:
1. Collection of expenditure reports: An expenditure report was generated by MOFP-RGZ from the IFMS, to the PER specifications (see data request in Annex C). In addition, information about the District Health Basket Fund, and other health sector ODA, was provided by MOH-RGZ.
2. Identification of relevant expenditure lines: A central aspect of the PER methodology was the criteria for determining if a budget line is nutrition-related. A full account of the approach adopted is set out in Annex H.
In short, a list of key terms was devised which related to the areas of nutrition relevance. In the absence of a nutrition policy framework for Zanzibar (see section 9.1), this list was derived from the Tanzania National Multisectoral Nutrition Action Plan (NMNAP), the Compendium of Actions for Nutrition (CAN) developed by the SUN UN Network / REACH, the SUN 3-Step Approach guidelines for Tracking Government Investments for Nutrition at Country Level, and the Budget Analysis for Nutrition: guidance note for countries.
These terms were used as a guide to identify nutrition-related activities; pragmatic variations on the terms were still included, and not all budget lines including these terms were deemed nutrition-related. Nevertheless, the identification of key terms was used to bring some objectivity and consistency to the process.
3. Categorisation of relevant expenditure lines: A full account of the categorisation approach is set out in in the second part of Annex H. Two levels of categorisation were undertaken according to the groups and subgroups set out in the NMNAP and the draft ZNNS (see Box 6, p.46). As with the mainland data, it was necessary for some budget lines, to assign an apportionment percentage. This was used to estimate what portion of a budget line was associated with nutrition, in instances where a line was deemed to be broader than the nutrition activity alone (for example, HMIS related activities include some surveillance of nutrition indicators, however the indicator set is much broader than nutrition alone). The approach for apportionment is described in full in Annex H. In summary, wherever possible, an objective basis was sought to determine an apportionment percentage between 0-100%, including interview notes and policy documents. For example, for broader health activities such as mother and child health care services, the team looked at the programme targets and what portion of those which were related to MIYCAN and nutrition sensitive areas, to arrive at an estimate for the apportionment percentage to apply to the spending line. The basis for this estimate is noted against each relevant budget line in the database. Where an objective basis for apportionment could not be identified, a default value of 10% was applied. This is a conservative estimate and is open to revision with better evidence.
It should be noted that the PER did not attempt to weight nutrition-sensitive budget lines to make them more comparable to nutrition-specific budget lines (in terms of the impact on nutrition outcomes). This is discussed in Box 5, p.46.
4. Consolidation and consistency check: the data sets for all MDAs, the basket fund, and donors, were then consolidated to form a single Zanzibar dataset of 1,900 lines, and consistency checks taken out (concerning, for instance, standardisation in categorisation approaches).

Nutrition Public Expenditure Review: Mainland Tanzania and Zanzibar
© Oxford Policy Management 98
8.1.4 Data coverage and gaps
The table below provides a summary of data included in the Zanzibar PER dataset, as well
as known gaps. The most significant data gaps and issues are:
RGZ actual expenditures: in the dataset provided, MOH-RGZ, MOEVT-RGZ and MOANLF-RGZ, have reported expenditures equivalent to less than 42% of allocations, and as low as 4.5%, which probably goes beyond issues of poor execution and is likely associated with incomplete expenditure reporting for some MDAs (see further discussion under 9.2.3).
Nutrition-sensitive off-budget donor allocations, beyond the health sector, are missing from the dataset.
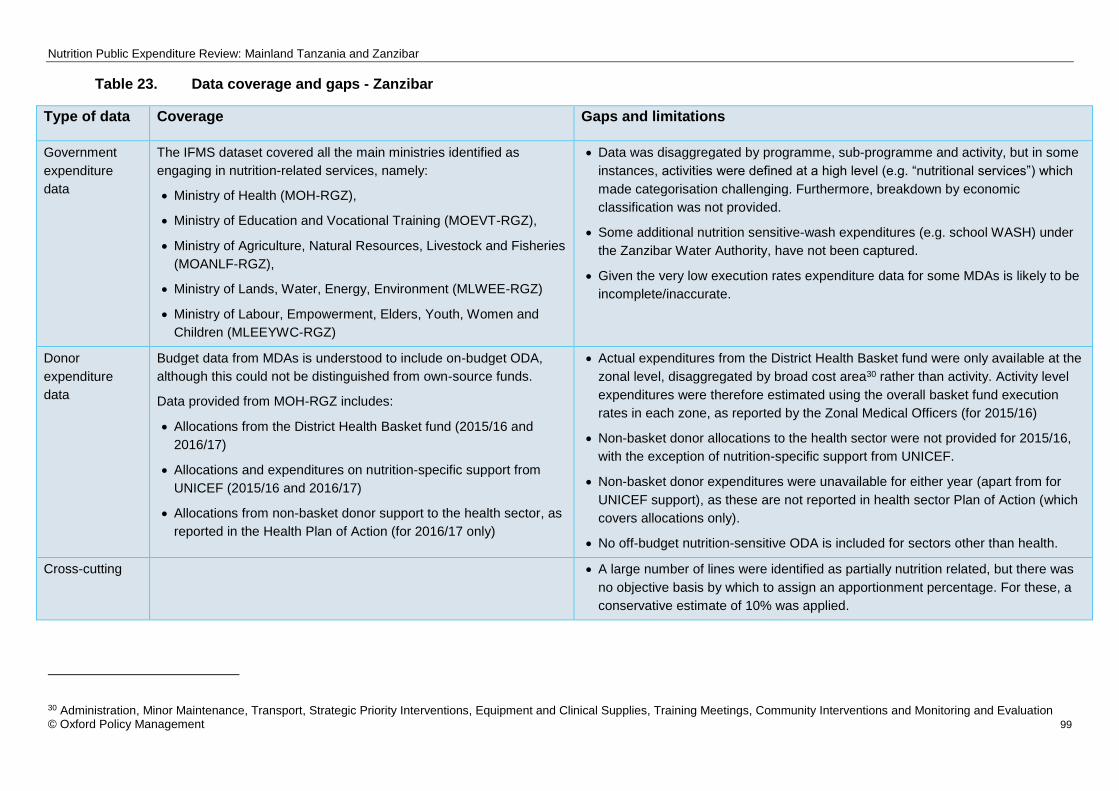
Nutrition Public Expenditure Review: Mainland Tanzania and Zanzibar
© Oxford Policy Management 99
Table 23. Data coverage and gaps - Zanzibar
Type of data Coverage Gaps and limitations
Government
expenditure
data
The IFMS dataset covered all the main ministries identified as
engaging in nutrition-related services, namely:
Ministry of Health (MOH-RGZ),
Ministry of Education and Vocational Training (MOEVT-RGZ),
Ministry of Agriculture, Natural Resources, Livestock and Fisheries
(MOANLF-RGZ),
Ministry of Lands, Water, Energy, Environment (MLWEE-RGZ)
Ministry of Labour, Empowerment, Elders, Youth, Women and
Children (MLEEYWC-RGZ)
Data was disaggregated by programme, sub-programme and activity, but in some
instances, activities were defined at a high level (e.g. “nutritional services”) which
made categorisation challenging. Furthermore, breakdown by economic
classification was not provided.
Some additional nutrition sensitive-wash expenditures (e.g. school WASH) under
the Zanzibar Water Authority, have not been captured.
Given the very low execution rates expenditure data for some MDAs is likely to be
incomplete/inaccurate.
Donor
expenditure
data
Budget data from MDAs is understood to include on-budget ODA,
although this could not be distinguished from own-source funds.
Data provided from MOH-RGZ includes:
Allocations from the District Health Basket fund (2015/16 and
2016/17)
Allocations and expenditures on nutrition-specific support from
UNICEF (2015/16 and 2016/17)
Allocations from non-basket donor support to the health sector, as
reported in the Health Plan of Action (for 2016/17 only)
Actual expenditures from the District Health Basket fund were only available at the
zonal level, disaggregated by broad cost area30 rather than activity. Activity level
expenditures were therefore estimated using the overall basket fund execution
rates in each zone, as reported by the Zonal Medical Officers (for 2015/16)
Non-basket donor allocations to the health sector were not provided for 2015/16,
with the exception of nutrition-specific support from UNICEF.
Non-basket donor expenditures were unavailable for either year (apart from for
UNICEF support), as these are not reported in health sector Plan of Action (which
covers allocations only).
No off-budget nutrition-sensitive ODA is included for sectors other than health.
Cross-cutting A large number of lines were identified as partially nutrition related, but there was
no objective basis by which to assign an apportionment percentage. For these, a
conservative estimate of 10% was applied.
30 Administration, Minor Maintenance, Transport, Strategic Priority Interventions, Equipment and Clinical Supplies, Training Meetings, Community Interventions and Monitoring and Evaluation
Nutrition Public Expenditure Review: Mainland Tanzania and Zanzibar
© Oxford Policy Management 100
8.2 Field work and interviews
Fieldwork was conducted over two weeks in July 2017. Its primary purpose was to interview
key informants in selected LGAs and nutrition relevant MDAs to understand nutrition
planning and budgeting processes and related institutional arrangements. An additional goal
of the fieldwork had been to validate the expenditure data with government to understand
emerging trends. However, the team’s ability to do so was negated by significant delays in
the delivery of the data, and the fieldwork could not be postponed. However, the report has
benefitted from reflections provided by stakeholders during validation meeting held in July
2018.
Annex A presents a list of the institutions and individuals met during the fieldwork. A team composed of OPM consultants and government officials from TFNC and MOH-RGZ conducted interviews with RGZ MDAs and two LGAs (Michewani, Pemba, and Magharibi B, Ugunja). These were selected based on an agreed set of criteria in order to capture geographic, nutritional status and funding differences among others. The full rationale for LGA selection is outlined in Annex D.
Nutrition Public Expenditure Review: Mainland Tanzania and Zanzibar
© Oxford Policy Management 101
9 Zanzibar: Analysis
9.1 Policy and institutional framework for nutrition
9.1.1 Government commitment to Nutrition
Zanzibar, as part of the United Republic of Tanzania, is committed to implementing a number of international conventions which include nutrition and/or food security goals as key targets. These include the MDGs, and more recently the SDGs. As a result, since the start of the 21st century in particular, Zanzibar, due to its semi-autonomous status, develops separate overarching and sectoral policies and programmes from mainland Tanzania. This includes actively developing national policy frameworks, programmes and initiatives which would help to reduce food and nutrition insecurity.
Like mainland Tanzania, an overarching strategic development plan is in place (Zanzibar Vision 2020), setting out broad development goals. In accordance with Zanzibar Vision 2020 and the first generation of the Zanzibar Poverty Reduction Paper, RGZ developed and endorsed the Agricultural Sector Policy and Agricultural Sector Strategic Plan, which focused on agricultural productivity as a key aspect of food security.
However, under the Zanzibar Strategy for Growth and Reduction of Poverty I 2007-2010 (also known by its Kiswahili acronym MKUZA I), the RGZ acknowledged the multidimensional nature of food security and nutrition, focusing on linkages between food security, nutrition and poverty reduction in terms of: i) food production, ii) food access (including safety nets), iii) adequate food utilisation (importance of nutrition). The 2006 Zanzibar Food Security and Nutrition Situation Analysis (ZFSNSA) also stressed the need for a comprehensive and multi-sectoral food security and nutrition policy framework. This recognition of the importance of nutrition and its multidimensional nature laid the groundwork for the development of nutrition focused policies, strategies and plans.
9.1.2 Nutrition policy framework
Under the MKUZA I, a Zanzibar Food Security and Nutrition (ZFSN) Policy was developed
and endorsed in 2008 in parallel with a ZFSN Programme. The Policy represents a tool for
prioritization, coordination, monitoring and evaluation of food security issues, while the
Programme is a comprehensive multi-sectoral plan to attain the food security and nutrition
goals and targets as set out in MKUZA as well as in the Policy. Together these aim to
ensure that the population has access to safe, nutritious and adequate food to meet their
nutritional requirements (Box 9). These rights were also enshrined in the Food Security and
Nutrition Act 2011.
Box 9. Goals of the Zanzibar Food and Nutrition Security Programme
Improved food availability through enhanced domestic food production.
Improved access to food through enhanced purchasing power of all resource poor households.
Improved utilisation of adequate, nutritious, and quality food to all members the household.
Strengthened social safety nets and emergency preparedness and response.

Nutrition Public Expenditure Review: Mainland Tanzania and Zanzibar
© Oxford Policy Management 102
However, the first plan to be developed which takes into account the fully multidimensional
nature of nutrition was the Multi-sectoral National Nutrition Strategy and Costed
Implementation Plan in 2013 (ZNNS). This was developed in line with the MKUZA II. This
strategy and implementation plan was designed to run from 2014-18, with the aim of
fostering multi-sectoral collaboration and coordination and outlining well-defined roles and
responsibilities and actions to address the immediate, underlying and basic causes of
malnutrition and to increase capacity Box 10. However, it has remained in draft form and has
never been officially endorsed by the government. The development of this National Nutrition
Strategy was potentially major step to RGZ’s commitment to scaling up nutrition as one of
the SUN early riser countries in line with mainland Tanzania’s commitment as an early
adopter of the SUN framework.
Box 10. Focus of the draft Multi-sectoral National Nutrition Strategy and Costed
Implementation Plan
The RGZ has recently developed the third version of the Zanzibar Strategy for Growth and
Reduction of Poverty running from 2016/17-2020/21 (MKUZA III). This version
acknowledges that maternal and child health (MCH) and nutrition have a direct link to health,
development and economic growth, and it aims to attain national and household food
security and nutrition for all. Despite this, the draft ZNNS developed in 2013 has not been
revived as a key planning document to reach the nutrition targets outlined in the ZSGRP.
Therefore, although there is a policy framework for nutrition in Zanzibar, at present there is
no active unifying nutrition plan being implemented beyond the Food Security and Nutrition
Policy and Programme. Even these are not being fully implemented as some Ministries
involved have not completely bought into them as it is not seen as a key priority area for
Strategic Objective 1: Systems strengthening
Nutrition is integrated in relevant policies, strategies and plans
Investment by government and partners in nutrition are increased and tracked.
Strengthened operational capacity of multi-sectoral and multi-stakeholder coordination structures for nutrition
Improved partnerships with the civil society, private sector, media and other stakeholders to scale up nutrition.
Strengthened nutrition information systems for effective decision making at all levels.
Improved use of evidence to inform the design and implementation of nutrition-specific and nutrition-sensitive policies, strategies and programs.
Strategic Objective 2: Direct Nutrition Interventions
Human resources for nutrition at all levels increased and their technical capacity is enhanced, prioritizing the health sector.
Improved utilization of quality maternal, child health and nutrition services.
Improved nutrition-related behaviours, practices and prevailing social norms.
Improved and expanded supply chain management of nutrition-related commodities, supplies and equipment within the health sector and within other key sectors.
Strategic Objective 3: Nutrition Sensitive Development (sectors)
Agriculture and food security,
Livestock and Fisheries
Education
Water, Sanitation and Hygiene
Social Welfare/Protection

Nutrition Public Expenditure Review: Mainland Tanzania and Zanzibar
© Oxford Policy Management 103
Zanzibar. Resource constraints are also a factor in lack of implementation and only 2
districts have Food Security and Nutrition plans.
9.1.3 Nutrition institutional framework
In Zanzibar, the number of government and non-government actors involved in nutrition is relatively few. Most of the nutrition expertise in RGZ sits within MOH-RGZ, in the nutrition unit, and there is additionally a nutrition unit within MOANLF-RGZ, but it struggles to exert influence over other priorities of the ministry. No nutrition focal persons or nutritionists were noted in other MDAs, and in some instances this is reflected in the design of sector programmes, with missed opportunities to maximise the nutrition sensitivity of programme design (see discussion of pre-primary school feeding, later in the chapter).
The lack of an endorsed multi-sectoral plan and the coordination mechanisms envisaged under the ZNNS, means that as result the ministries involved in nutrition related activities tend to coordinate within their own sector only. The Ministry of Health, through its Health Sector Strategic Plan (HSSP) focuses mainly on micronutrient and Infant and Young Child Feeding (IYCF) activities. The Ministry of Agriculture develops Agriculture Sector Strategic Plans (ASSP) which includes implementation of its mandate on food security and nutrition – with most activities focused on improving food security. Also, the Ministry of Education through its Education Development Plan (EDP) is to some extent engaged in school feeding and school health programmes. Amongst donors and development partners, UNICEF strongly supports the nutrition agenda and there is some engagement from USAID, DFID, FAO, and the Global Fund. There is also limited engagement through CSOs and foundations including Save the Children and the Agha Khan Foundation.
An elaborate coordination mechanism for nutrition was outlined in the 2013 ZNNS, but it has never been operationalised as the ZNNS has not been officially endorsed. The coordination mechanism was expected to have three levels providing i) oversight, ii) technical and policy coordination, and iii) operational support, as summarised in Figure 29.
Figure 29. Proposed Nutrition coordination in Zanzibar
•Cabinet Committee on Nutrition (Ministerial level) - this would be the existing committee for Food Security and Nutrition
•Steering Committee on Nutrition (Principal Secretary level) - this would be the existing committee for Food Security and Nutrition
Oversight
•Multi-sectoral Technical Committee on Nutrition •Secretariat (Dept Preventive services/Dept Food Security and Nutrition •Relevant sectoral departments•Development partners•Civil Society organisations•Private sector
Technical & Policy
Coordination
•District Assemblies•Shehia Nutrition Officers•Civil Society Organisations •Shehia /Development Committee/Area Executive Committee
Operational Support

Nutrition Public Expenditure Review: Mainland Tanzania and Zanzibar
© Oxford Policy Management 104
Out of the proposed coordination structures, the oversight mechanisms are in place,
including the Cabinet Committee and the Steering Committee, as these were existing
mechanisms for overseeing implementation of the Food Security and Nutrition Programme.
However, it was noted that these are not well functioning (due to a lack of resources, time
and staff shortages).
There is also some coordination through the Planning Commission committees which oversee the development plans (Zanzibar Vision 2025 and the 5-year development plans). Ministries may be called to present on nutrition for which they will prepare research, but they lack the funds to do as much as they would like. Some ad hoc coordination of nutrition interventions exists, but primarily on a project basis, and for projects which are in receipt of donor support. For instance, MOANLF-RGZ and MOH-RGZ are engaged in the steering committee of the DFID-support primary school feeding project.
At the district level, DNuOs are in place in all districts but resource constraints meant that only two additional qualified nutritionists were employed, the rest of the positions were filled with reassigned health officers who underwent some nutrition training from MOH-RGZ. They are expected to take on the following roles:
To provide education on nutrition issues
Collect data for SAM for health facilities
Supervision of health providers – including SAM and MAM treatment in clinics
Ensure supplies for treatment of SAM
Supervise growth monitoring.
Supervise community health volunteers who deal with child nutrition issues –
volunteers will look at child health, WASH, family planning – and refer to health
facility.
Check iodine in salt levels in markets and production
In terms of district level coordination, there are currently no coordination structures in place
specifically for nutrition. Nutritional issues are discussed at the DHMT and may be included
to an extent in the CDHP, dependent on available funding and what are seen as priority
areas across the health sector. Interventions more likely to be included are vitamin A
campaigns and breastfeeding campaigns. The DHMT also coordinates with other sectors
through a quarterly multi-sectoral meeting and the heads of sectors meet at the district
commissioner’s office to discuss current issues. The DMHT is now accountable to the
municipality rather than the MOH which may further facilitate cross-sectoral coordination
moving forwards in general, although the DNuOs are still accountable to the MOH which
may further constrain their engagement or coordination with other district sectoral officers.

Nutrition Public Expenditure Review: Mainland Tanzania and Zanzibar
© Oxford Policy Management 105
9.2 Level and composition of nutrition spending
Bearing in mind the gaps and limitations of the dataset addressed in the previous chapter,
some tentative findings as to the level and composition of nutrition spending in Zanzibar are
presented here. The aggregated nature of the data which was provided meant that some of
the intended analyses have not been possible, including a breakdown of spending by
economic classification, and by input type.
9.2.1 Aggregate nutrition spending
Table 24 provides a summary of the nutrition spending identified in the PER. It is a clear
reflection of the data issues faced in the PER analysis, including concerns around the
completeness of RGZ expenditure data (which stands at just 11% of nutrition allocations in
2015/16, and 16% of nutrition allocations in 2016/17) as well as gaps in the non-basket
donor dataset. These limit the ability to draw robust conclusions about overall levels of
Key findings:
The first plan to be developed which takes into account the fully multidimensional nature of nutrition was the Multi-sectoral National Nutrition Strategy and Costed Implementation Plan in 2013 (ZNNS). This strategy and implementation plan aims to foster multi-sectoral collaboration and coordination and outlining well-defined roles and responsibilities and actions to address the immediate. However, it has remained in draft form and has never been officially endorsed by the government.
Most of the nutrition expertise in RGZ sits within MOH-RGZ, in the nutrition unit, and there is additionally a nutrition unit within MOANLF-RGZ, but it struggles to exert influence over other priorities of the ministry. No nutrition focal persons or nutritionists were noted in other MDAs.
The lack of an endorsed multi-sectoral plan and the coordination mechanisms envisaged under the ZNNS, means that the ministries involved in nutrition related activities tend to coordinate within their own sector only.
An elaborate coordination mechanism for nutrition was outlined in the 2013 ZNNS, but it has never been operationalised. Some ad hoc coordination exists, but primarily on a project basis, and for projects which are in receipt of donor support.
At the district level, DNuOs are in place in all districts but resource constraints meant that only two additional qualified nutritionists were employed, the rest of the positions were filled with reassigned health officers who underwent some nutrition training from MOH-RGZ.
In terms of district level coordination, there are currently no coordination structures in place specifically for nutrition. Nutritional issues are discussed at the DHMT and may be included to an extent in the CDHP, dependent on available funding and what are seen as priority areas across the health sector.
The DHMT is now accountable to the municipality rather than the MOH which may further facilitate cross-sectoral coordination moving forwards in general, although the DNuOs are still accountable to the MOH which may further constrain their engagement or coordination with other district sectoral officers.
Links to relevant recommendation(s):
R11 (to RGZ and Development Partners): Consider developing (or refreshing) an overarching nutrition policy and coordination architecture to give strategic direction to nutrition interventions and strengthen accountability for results.
R16 (to RGZ, TFNC): Strengthen nutrition capacity within RGZ (beyond MOH-RGZ)

Nutrition Public Expenditure Review: Mainland Tanzania and Zanzibar
© Oxford Policy Management 106
spending on nutrition and are discussed in more detail in the section on budget execution
performance (9.2.3 and 9.3.2). Nonetheless, some key trends are tentatively discernible.
Firstly, RGZ allocations to nutrition have grown by an estimated 77% over the two year
period, from TZS 36 bn to TZS 63 bn. Interviewees reported that the Government was
giving growing fiscal priority to nutrition, due to increased awareness amongst political
leadership and senior civil servants. This is borne out by this data, and further supported by
the data in Table 25 which shows nutrition spending is accounting for a modest but growing
share of public expenditure overall, and of Zanzibar’s GDP.
By contrast, allocations to nutrition from the District Health Services Basket Fund (“the
Basket Fund”) have fallen over the same period by 49%. Expenditures are also likely to have
fallen, but this assessment assumes that Basket Fund monies applied to nutrition related
activities were spent at the same rate as the basket overall.31 Decisions around how Basket
Fund monies are allocated and spent sit primarily with the District Health Management
teams. Section 7.3 discusses how far these local level planning processes do or do not
prioritise nutrition.
It is not possible to draw conclusions about trends in non-basket donor funding, due to the
changes in the dataset between years (see 8.1.4).
Table 24. Total nutrition allocations and spending in Zanzibar
TZS 2015/16 2016/17
Source Nutrition approved
estimates Nutrition actuals Nutrition approved
estimates Nutrition
actuals
RGZ 35,711,929,200 3,842,128,408 63,306,652,857 10,123,980,932
Basket Fund 326,008,950 120,177,059 165,912,546 65,747,342
Other donor 352,921,250 352,921,250 3,595,726,421 1,140,658,121
Grand Total 36,390,859,400 4,315,226,717 67,068,291,824 11,330,386,396
Source: PER dataset. Notes: “Other donor” figures to for 2015/16 include UNICEF nutrition-specific contribution
only; 2016/17 allocations include all donor sources in the Plan of Action; however expenditure information was not
available.
31 See data coverage and gaps in 8.1.4; Basket Fund expenditures are not recorded by activity.

Nutrition Public Expenditure Review: Mainland Tanzania and Zanzibar
© Oxford Policy Management 107
Figure 30. Total nutrition allocations and spending in Zanzibar
Source: PER dataset. Notes: “Other donor” figures to for 2015/16 include UNICEF nutrition-specific contribution
only; 2016/17 allocations include all donor sources in the Plan of Action; however expenditure information was not
available.
Table 25. Nutrition actual expenditures in Zanzibar against government-wide aggregates
TZS Billions 2015/16 2016/17
Total RGZ expenditure 516 687
Total RGZ nutrition expenditure* 3.8 10.1
Nutrition expenditure as % total govt expenditure 0.7% 1.5%
GDP at market prices 2,308 2,628
Total RGZ + donor-funded nutrition expenditure 4.3 11.3
Nutrition expenditure as % GDP 0.2% 0.4%
Source: PER dataset, preliminary outturns and GDP estimates from 2016/17 and 2017/18 budget speeches.
*Excludes off budget ODA.
Comparison against sector benchmarks can help put these figures into context. Analysis by
the World Bank and others estimates that meeting the 2025 global stunting target (reducing
the number of stunted under 5 children by 40%) will cost approximately an additional USD
8.50 per child under 5 per year. This covers the scale-up of high-impact, proven nutrition-
specific interventions focused on the 1,000-day window from conception to age two years
including improving maternal nutrition, infant and young child feeding practices, and child
nutrition through micronutrient supplementation (World Bank 2015). The utility of such global
targets is questionable, as it does not reflect the varying nutrition burden of specific
countries. Nonetheless, the table below indicates that Zanzibar fell far short of meeting this
benchmark in 2015/16, with just 55 cents per child under 5 recorded as spent on nutrition-
specific interventions. If the analysis were to use nutrition specific allocations as opposed to
expenditures, the benchmark result improves to 75 cents, but still reaches less than 10% of
0
10,000
20,000
30,000
40,000
50,000
60,000
70,000
80,000
2015/16 2016/17 2015/16 2016/17
Nutrition approved estimates Nutrition actuals
TZ
S M
illio
ns
RGZ Basket Fund Other donor*

Nutrition Public Expenditure Review: Mainland Tanzania and Zanzibar
© Oxford Policy Management 108
the recommended level. There was notable improvement in 2016/1732, with reported data
indicating spend of just over USD 1 per child under 5, but clearly there is still some way to go
if this benchmark is deemed a useful indicator of nutrition spending adequacy.
Table 26. Nutrition-specific expenditure in Zanzibar per child under 5
2015/16 2016/17
Nutrition-specific expenditure (USD) 125,959 544,939,042
Estimated population under 5 228,926 239,773
Nutrition specific spending per child under 5 (USD) 0.55 1.02
Source: expenditure taken from PER dataset, population projections from NBS (using total population projections
for 2016 and the population percentage under 5 from 2012 census). Exchange rates of 0.00045 (2015/16) and
0.00044 (2016/17) are used (OANDA).
9.2.2 Sectoral distribution
Nutrition is multisectoral. The response to malnutrition in Zanzibar is similarly multisectoral,
as depicted in Table 27 and Figure 31 below.
32 Figures for 2016/17 are likely to be an underestimate because expenditure data is not available for non-basket donors (bar UNICEF), and the MOH-RGZ nutrition unit (the government funders of nutrition specific activity) reported zero expenditure in 2016/17 (which may not be a true reflection).
Key findings:
In Zanzibar RGZ allocations to nutrition have grown by an estimated 77% over the two year period, from TZS 36bn to TZS 63bn.
Interviewees reported that the Government was giving growing fiscal priority to nutrition, due to increased awareness amongst political leadership and senior civil servants. This is borne out by these data, which show nutrition spending is accounting for a modest but growing share of public expenditure, and of Zanzibar’s GDP. However actual expenditures remain substantially below allocated amounts.
Despite the growing fiscal priority being afforded to nutrition, there is evidence to suggest that current spending resourcing is far from adequate. There is a long way to go until Zanzibar is likely to meet the World Bank nutrition-specific benchmark of USD 8.5 per child under 5, with just USD 0.55 per child under 5 recorded in 2015/16. There was however notable improvement in 2016/17, with reported data indicating spend of just over USD 1 per child under 5.
Allocations to nutrition from the District Health Services Basket Fund have shown the opposite trend, falling between 2015/16 and 2016/17 by 49%.
Links to relevant recommendation(s):
R11 (to RGZ and Development Partners): Consider developing (or refreshing) an overarching nutrition policy and coordination architecture to give strategic direction to nutrition interventions and strengthen accountability for results
R12 (to RGZ): Following the development of a nutrition policy, address the (likely) shortfall of nutrition-specific spending
R13 (to MOFP-RGZ, TFNC, UNICEF): Consider integrating nutrition priorities into budget guidelines

Nutrition Public Expenditure Review: Mainland Tanzania and Zanzibar
© Oxford Policy Management 109
Table 27. Sectoral distribution of nutrition expenditures in Zanzibar
TZS Approved estimates Actual expenditures
Sector 15/16 16/17 15/16 16/17
Agriculture 8,692,848,500 10,292,166,200 847,426,613 2,159,025,500
Education 23,401,500 138,713,857 1,922,641 16,236,996
Health* 14,476,730,255 21,508,858,980 1,391,674,956 2,496,573,785
Social Protection 2,171,568,000 4,356,476,500 1,363,009,390 4,246,398,096
Wash 9,731,414,000 25,607,923,131 462,642,117 1,464,242,160
Environment and CC 0 3,860,473,000 0 192,084,260
Grand Total 35,095,962,255 65,764,611,669 4,066,675,717 10,574,560,796
Source: expenditure taken from PER dataset. NB: Excludes enabling environment spending which is multisectoral.
* Health sector includes nutrition specific and health related nutrition sensitive spending.
Figure 31. Sectoral distribution of nutrition expenditures in Zanzibar
Source: expenditure taken from PER dataset. NB: Excludes enabling environment spending which is multisectoral.
* Health sector includes nutrition specific and health related nutrition sensitive spending.
Unsurprisingly, the health sector accounts for the largest share of nutrition allocations and
expenditures overall, with allocations from the sector growing by 49% between 2015/16 and
2016/17.33 This is predominantly composed of a range of nutrition sensitive health sector
activities, primarily financed by the Basket Fund, but also by MOH-RGZ and other donors.
Nutrition sensitive activities identified include reproductive health care and family planning,
child immunization, and malaria prevention. A smaller portion relates to nutrition-specific
activities, including vitamin A supplementation, deworming, treatment of acute malnutrition,
and promotion of breastfeeding. The analysis also took a portion (10%) of budget lines
associated with the supply of (unspecified) medicines and medical supply budget lines,
assuming that some of these relate to nutrition specific and sensitive supplies (like vaccines,
food supplements, or family planning).
33 This is in part because a wider range of health sector ODA was captured in 2016/17 allocations.
0% 20% 40% 60% 80% 100%
15/16 Approved estimates
16/17 Approved estimates
15/16 Actuals
16/17 Actuals
Agriculture
Education
Health*
Social Protection
Wash
Environment and CC

Nutrition Public Expenditure Review: Mainland Tanzania and Zanzibar
© Oxford Policy Management 110
The WASH sector is the next largest sector in terms of nutrition allocations. In part, its
dominance is a reflection of the broad manner in which nutrition sensitive activities in WASH
are defined in the Tanzanian policy context (see Annex G). Specifically, water supply
infrastructure investments, which tend to be costly, are considered nutrition-sensitive by the
NMNAP. Such investments account for a large portion of nutrition-sensitive spending in the
WASH sector, primarily financed through RGZ own source funds and on budget ODA
(notably from JICA and African Development Bank). Smaller investments from the WASH
sector include water safety measures, the construction of latrines (financed through the
Basket Fund) and hygiene promotion (supported by non-basket development partners).
The agricultural sector is the third largest sector in terms of nutrition-sensitive allocations
and spending. Significant investments were identified in food security interventions (including
establishment of a food reserve, as well as food security monitoring and assessment),
provision of agricultural inputs, and research into nutritious crop varieties. Additionally, in
both districts visited, the District Agricultural Officers and Livestock Officers reported
implementing activities including promotion of vegetable, milk and egg production and
consumption, and undertaking training on food processing with local producers (for example,
drying sweet potatoes). Spending in this sector is primarily financed through the MOANLF-
RGZ budget, although some small food quality investments are financed through the Basket
Fund. Interviews identified additional agricultural off budget nutrition-sensitive ODA, but this
is not captured in the dataset.34
Nutrition sensitive interventions in the social protection sector account for less than 7% of
nutrition allocations, but around a third of expenditures, which is primarily because of the
higher level of reported expenditures for MLEEYWG-RGZ, compared to other MDAs (see
discussion under 9.2.3). Investments in this sector primarily relate to social assistance for
vulnerable communities (including working with vulnerable families on child welfare issues
such as vaccinations and breastfeeding), as well as a number of women’s economic
empowerment interventions.
Environment and climate change-related nutrition sensitive interventions were identified in
2016/17, when this area was added to the mandate of MLWEE-RGZ. Specifically,
government financed adaptation activities were identified in the dataset, which include
activities to support the livelihoods of affected people, such as climate-smart agriculture
interventions.
The education sector accounts for less than 1% of identified nutrition allocations and
sectors. The relevant activities identified related to early childhood care and development,
and school WASH (SWASH), as well as pre-primary school feeding35, for which RGZ has
provided grants of TZS2000/child, since 2015. The school feeding only covers pre-primary
schools, but it is universal across Zanzibar. There are no guidelines as to the types of food
which should be offered, and in both the districts visited, porridge was provided. In contrast,
at the primary level, a pilot school feeding programme has been operating since 2014
providing locally grown, nutritious foods (including sorghum, cowpeas, coconut milk, sweet
potatoes, vegetables and fruit, sugar, oil and salt) to primary schools. However, it is
34 see 8.1.4 and 9.2.4 35 Pre-primary school feeding and SWASH are part of MOEVT-RGZ’s education integration and life skills programme. As no breakdown as to what portion of the programme related to these areas, a nominal 29% of the budget line was taken as nutrition sensitive because two of the 7 programme areas were nutrition-sensitive.

Nutrition Public Expenditure Review: Mainland Tanzania and Zanzibar
© Oxford Policy Management 111
presently limited to 10 schools and apart from some small contributions from government for
utensils, is donor-financed (DFID) and not captured in the dataset.
9.2.3 Execution of nutrition budgets
Table 28 below presents the reported budget execution rates (total expenditures as a
percentage of approved allocations), for the MDAs overall, and for the nutrition related
budget lines. It presents a stark depiction of significant budget execution challenges,
however in the case of three of the four MDAs, the levels are so low they are deemed
inaccurate, and therefore can be interpreted as an indication of poor reporting more so, or in
addition to, poor execution.
In interviews, government officials reported some budget execution issues (discussed in
general in section 7.2.2, and 9.3.2.). In brief, these included delays in completion of
infrastructure projects, procurement issues and irregularity of aid inflows. In addition it was
reported that there are continuing challenges in timeliness of disbursements from MOFP,
with quarterly transfers coming towards the end of the period (however without the relevant
data on transfer timing, this finding is only anecdotal). In addition, incomplete disbursements
from MOFP, due to late or incomplete reporting from MDAs, were also noted as a contributor
to execution challenges.
These challenges noted, it remains the case that in interviews officials cited execution rates
which were much better than those subsequently presented in the IFMS report. Efforts to
reconcile these have provided possible causes of the discrepancies; firstly, IFMS numbers
are still provisional (actual execution levels will be confirmed when the actual expenditures
are reconciled; usually three FYs later); and secondly, the integration of external funding
may not be complete (and the Ministries in questions have a large part of their capital
expenditures met by foreign/donor financing).
Key findings:
The health sector accounts for the largest share of nutrition allocations and expenditures overall, with allocations from the sector growing by 49% between 2015/16 and 2016/17. This is predominantly composed of a range of nutrition sensitive health sector activities; a smaller portion relates to nutrition-specific activities. The WASH sector is the next largest sector in terms of nutrition allocations. In part, its dominance is a reflection of the broad manner in which nutrition sensitive activities in WASH are defined in the Tanzanian policy context; specifically, related to the inclusion of high cost water supply infrastructure investments.
The agricultural sector is the third largest sector in terms of nutrition-sensitive allocations and spending.
Lesser amounts are found in social protection and education. Regarding the latter, this is mostly pre-primary feeding however it was noted however that there are no guidelines as to the types of food which should be offered (and in both the districts visited, porridge was provided).
Environment and climate change-related nutrition sensitive interventions account for a modest but growing share as since 2016/17 this area was added to the mandate of MLWEE-RGZ.

Nutrition Public Expenditure Review: Mainland Tanzania and Zanzibar
© Oxford Policy Management 112
Table 28. Budget execution rates in nutrition related MDAs in Zanzibar
2015/16 2016/17
Ministry
budget execution rate
(overall) nutrition budget
execution rate
budget execution rate
(overall) nutrition budget
execution rate
MOH-RGZ 15.1% 7.8% 41.9% 10.7%
MOEVT-RGZ 19.3% 0.9% 30.1% 89.9%
MOANLF-RGZ 4.5% 9.7% 6.6% 21.0%
MLWEE-RGZ 8.3% 4.6% 7.9% 5.6%
MLEEYWC-RGZ 49.6% 62.8% 70.9% 94.9%
Source: PER dataset.
Setting aside concerns about the validity of absolute levels of budget execution reported, it is
nonetheless interesting to compare the execution rate of budget lines which were identified
as nutrition-related against overall budget execution relates. In the case of MLEEYWC-RGZ
and MOANLF-RGZ, the data provided suggest that nutrition-sensitive budget lines may
enjoy a degree of prioritisation in contexts of resource constraints, as the execution rate of
those lines are higher than for the MDA budget overall. The opposite appears to be the case
for MOH-RGZ (where, notably, zero expenditures were reported for the nutrition unit in
2016/17), and MLWEE-RGZ.
Assessing the budget execution performance of the Basket Fund was hindered by the
reporting format. Expenditure is reported against cost areas (administration, transport, minor
maintenance, strategic priority interventions, equipment and clinical supplies, training
meetings, community interventions, and monitoring and evaluation), as opposed to
activities.36 In 2015/16, Zonal Medical Officers in Pemba and Unguja reported total Basket
Fund expenditures of just 46% and 36% of their respective zonal allocations, as set out in
the health Plan of Action. Reasons for this under expenditure are explored in section 9.3.2.
36 For the purpose of data analysis, Activity level expenditures were estimated using the overall basket fund execution rates in each zone, as reported by the Zonal Medical Officers (for 2015/16). In future analyses, this assumption would warrant further investigation, if activity level expenditures could be provided.

Nutrition Public Expenditure Review: Mainland Tanzania and Zanzibar
© Oxford Policy Management 113
9.2.4 Sources of Finance for nutrition budgets
The table below presents a breakdown of nutrition allocations in 2016/17 by funding source.
It is only a partial breakdown, because in the dataset provided it was not possible to
distinguish between RGZ own funds and on-budget ODA. Furthermore, off-budget ODA
provided to the nutrition sensitive sectors beyond health, is not captured37. Nonetheless, it
serves to highlight two points; firstly, that a significant portion of nutrition spending flows
through the RGZ budget (underscoring the importance of budget processes for nutrition
outcomes); and secondly that the share of Basket Fund nutrition-related spending appears
to be relatively modest.
37 Significant nutrition sensitive off budget donor programmes noted during the course of interviews, but not captured in the dataset, include: DFID supported Table for 2 School feeding programme, USAID’s mwanzo bora programme, and the IFAD support Agricultural Support Service Programme.
Key findings:
The data present a stark depiction of significant budget execution challenges, which is likely to be a prominent obstacle to improving nutrition outcomes. Evidence on key bottlenecks underlying budget execution challenges is only anecdotal, but includes reported delays in completion of infrastructure projects, procurement issues, irregularity of aid inflows and timeliness of disbursements from MOFP.
Additionally, there is cause to believe that the low levels reported are in part an indication of poor reporting in addition to poor execution.
Execution challenges are not unique to government spending. Zonal Medical Officers in Pemba and Unguja reported total Basket Fund expenditures of just 46% and 36% of their respective zonal allocations, as set out in the health Plan of Action, in 2015/16. Different formats for budget planning and budget reporting of the Basket Funds hinders activity level analysis.
Links to relevant recommendation(s):
R17 (to RGZ and Development Partners): Improve the timeliness and comprehensiveness of expenditure reporting
R15 (to MOFP-RGZ and partners): Conduct an in-depth assessment of budget execution procedures and timelines and design appropriate, targeted measures to improve execution performance

Nutrition Public Expenditure Review: Mainland Tanzania and Zanzibar
© Oxford Policy Management 114
Figure 32. Breakdown of Zanzibar nutrition budget allocations by
funding source (2016/17)
Source: PER dataset.
* Other donor includes non-basket off budget donors as reported in the health sector Plan of Action.
9.2.5 Nutrition allocations and spending by level of government
For the years covered in the PER, Zanzibar operated a centralised fiscal regime. It is
therefore unsurprising that the majority of nutrition spending (98% in 2016/17) is planned
and budgeted for at the national level (see Table 29). This is likely to change substantially,
with the DbyD grants from 2017/18 (as discussed in section 9.3).
By contrast, Basket Fund allocations for nutrition are planned and budgeted for at the local
level, however these only account for a small portion (0.25%) of all nutrition allocations. Non-
basket ODA from other donors is more significant. Data from the health sector Plan of Action
indicate that the majority of these funds were for Zanzibar wide national-level interventions,
with a smaller portion targeting either Pemba or Unguja, or districts within them.
94.39%
0.25% 5.36%
RGZ Basket Fund Other donor*
Key findings:
The vast majority of nutrition spending flows through the RGZ budget (underscoring the importance of national budget processes for nutrition outcomes)
By contrast the share of Basket Fund nutrition-related spending appears to be relatively modest.
Links to relevant recommendation(s):
R13 (to MOFP-RGZ, TFNC, UNICEF): Consider integrating nutrition priorities into budget guidelines
R14 (to MOH-RGZ, Basket Fund Contributors): Explore means through which the health basket fund resources can more purposefully be mobilised to support nutrition (specific)
activities through the planning guidelines.

Nutrition Public Expenditure Review: Mainland Tanzania and Zanzibar
© Oxford Policy Management 115
Table 29. Zanzibar nutrition budget allocations by level of government (2016/17)
Row Labels Share of nutrition approved estimates
Local 1,129,251,121
Basket Fund 165,912,546
Other donor* 963,338,575
National 65,939,040,703
Other donor* 2,632,387,846
RGZ + on budget ODA 63,306,652,857
Grand Total 67,068,291,824
Source: PER dataset.
* Other donor includes non-basket off budget donors as reported in the health sector Plan of Action.
Figure 33. Distribution of Zanzibar nutrition budget allocations by
source (2016/17)
Source: PER dataset. * Other donor includes non-basket off budget donors as reported in the health sector Plan
of Action.
0% 20% 40% 60% 80% 100%
local
national
basket fund donor RGZ
Key findings:
98% of nutrition spending is planned and budgeted for at the national level, however this is set to change with the introduction of fiscal decentralisation.
Basket Fund allocations for nutrition are planned and budgeted for at the local level, whereas non-basket ODA is predominantly for Zanzibar wide national-level interventions.
Links to relevant recommendation(s):
R16 (to RGZ, TFNC): Strengthen nutrition capacity within RGZ (beyond MOH-RGZ) including at the local level in light of DbyD
R13 (to MOFP-RGZ, TFNC, UNICEF): Consider integrating nutrition priorities into budget guidelines

Nutrition Public Expenditure Review: Mainland Tanzania and Zanzibar
© Oxford Policy Management 116
9.2.6 Expenditure by nutrition categories
The nutrition policy frameworks for both mainland Tanzania and Zanzibar emphasise a combination of nutrition-specific and nutrition-sensitive approaches, as well as strengthening the enabling environment (the wider policy and governance processes around nutrition).
Figure 34 shows the relative share of spending against these broad categories. As expected, the vast majority (over 90%) of allocations and expenditures go towards nutrition-sensitive interventions, which seek to address the underlying causes of malnutrition, across a range of sectors. A much smaller share of reported allocations (7%) directly address malnutrition through nutrition-specific approaches, whereas 2% of funds support the governance and policy processes around nutrition. This distribution is largely mirrored when looking at actual expenditures, with the exception that the absolute volume and relative share of resources going to nutrition-specific interventions falls to 5% of all spending, which is due in large part to fact that the MOH-RGZ nutrition unit reported zero expenditures in 2016/17.
This is not an atypical distribution, given that nutrition-specific interventions are much more contained and targeted (although may include costly acute malnutrition interventions), and nutrition-sensitive investments span a wide range of sectoral programmes, including some costly infrastructure (e.g. water supply). However, the (draft) ZNNS costing is focused on nutrition specific interventions, which comprises around half of the total budget over 5 years with nutrition sensitive interventions in particular focused on incorporating nutrition-relevant activities within existing programmes in agriculture, WASH, and social protection in particular. Therefore, these findings on the expenditure breakdown being skewed heavily towards nutrition sensitive interventions implies that current spending patterns are not in line with what the ZNNS envisaged.
Figure 34. Allocations and expenditures by broad nutrition categories
(2015/16 – 2016/17)
Source: PER dataset. Notes: excludes SBCC spending. 2015/16 and 2016/17 data is combined.
* unknown/multiple relates to budget lines associated with unspecified medical supplies.
In the Tanzania policy architecture, and in the global nutrition community, nutrition-specific encompass high impact interventions including Infant and Young Child Feeding (IYCF), micronutrient deficiencies, treatment of acute malnutrition, as well as prevention and
90.87%
6.78% 2.15% 0.19%
Allocations
Nutrition-sensitive Nutrition-specific
Enabling Environment Unknown/multiple*
91.61%
5.31%2.91% 0.17%
Expenditures
Nutrition-sensitive Nutrition-specific
Enabling Environment Unknown/multiple*

Nutrition Public Expenditure Review: Mainland Tanzania and Zanzibar
© Oxford Policy Management 117
management of Diet-Related Non-Communicable Diseases (DRNCDs). A partial picture of how nutrition-specific funding in Zanzibar is distributed between the categories is presented in the figure below.
The analysis is hindered by the fact that no breakdown of allocations to the MOH-RGZ nutrition unit was available (it is budgeted for under a single activity called “nutritional services”). However, in interviews, unit officials clarified that their focus was on nutrition specific interventions including salt iodisation, vitamin A distribution38, exclusive breastfeeding campaigns and growth monitoring. In terms of donor support to nutrition-specific interventions, this is primarily in the form of UNICEF support to Maternal and Infant Maternal, Infant, Young Child and Adolescent Nutrition (MIYCAN) (including breastfeeding promotion and IYCF), and Prevention and Management of Micronutrient Deficiencies (vitamin A supplementation and deworming). Modest investments were directed towards SAM and MAM treatment in Unguja, financed by UNICEF and the health Basket Fund.
Figure 35. Zanzibar’s nutrition-specific allocations (2015/16 –
2016/17)
Source: PER dataset. The two years’ data are combined.
Table 30. Zanzibar’s nutrition-specific allocations (2015/16 - 2016/17)
Category, Source Approved estimates (TZS)
Integrated Management of Acute Malnutrition (IMAM) 106,915,000
Basket Fund 1,985,000
UNICEF 104,930,000
Maternal, Infant, Young Child and Adolescent Nutrition (MIYCAN) 58,385,500
Basket Fund 4,567,500
UNICEF 53,818,000
Multiple n-specific 6,163,947,000
Ministry of Health 6,163,947,000
Prevention and Management of Micronutrient Deficiencies 663,785,550
Basket Fund 10,618,000
38 The supplements themselves are provided by UNICEF.
2% 1%
88%
9%Integrated Managementof Acute Malnutrition(IMAM)
Maternal, Infant, YoungChild and AdolescentNutrition (MIYCAN)
multiple n-specific
Prevention andManagement ofMicronutrientDeficiencies

Nutrition Public Expenditure Review: Mainland Tanzania and Zanzibar
© Oxford Policy Management 118
UNICEF 653,167,550
Grand Total 6,993,033,050
Source: PER dataset. The two years’ data are combined.
In order to gauge the adequacy of nutrition-specific expenditures, the team looked to the ZNNS, which despite being never formally adopted by RGZ, was costed. The annual average cost cited to implement strategic objective 2 under the plan was estimated to be TZS 6,865,593,017 over 5 years, or TZS 1,373,118,603 per year on average. Viewed in this context, the reported levels of expenditure below (covering a two year period) may appear adequate, however the team had concerns about the robustness of ZNNS costing.39 A more accurate benchmark might be the World Bank guidelines of USD 8.50 per child under 5 per year, and as discussed previously, Zanzibar is currently at less than 7% of this recommended level.
All nutrition commodities are distributed centrally through MOH-RGZ (with the exception of iron folic acid). However, the Ministry did not have consolidated records of all goods distributed. Interviews with District Health Management Teams indicated that goods distributed include vitamin A and Ready-to-Use Therapeutic Food (such as Plumpy Nut), F75 and F100, rehydration salts, iodised salt, and mebendazole.
Table 31 presents a breakdown of nutrition-sensitive spending by sector. Budget allocations are dominated by the WASH sector, which is predominantly composed of water supply infrastructure programmes as discussed in 9.2.2. This is followed by the health sector (specifically, reproductive health care and family planning, child immunization, and malaria prevention) and then the agricultural sector (in the form of food security interventions, provision of agricultural inputs, and research into nutritious crop varieties). Nutrition sensitive interventions in the social protection sector (related to social assistance for vulnerable communities and women’s economic empowerment) account for less than 7% of nutrition-sensitive allocations, but over 40% of expenditures, which is primarily because of the higher level of reported expenditures for MLEEYWG-RGZ, compared to other MDAs (see discussion under 9.2.3). Environment and climate change-related nutrition sensitive interventions are more modest (4% of nutrition sensitive allocations), which is in part a reflection of the fact the area was only added to the mandate of MLWEE-RGZ in 2016/17, half way through the reporting period. Of note is the finding that the education sector (through pre-primary school feeding) accounts for just 0.17% of identified nutrition-sensitive allocations and only 0.13% of expenditures. Relative to the draft costing of the ZNNS this is unexpected, with education and agriculture allocated the largest amounts of funding, followed by social protection and finally WASH.
Table 31. Breakdown of Zanzibar’s nutrition-sensitive budget allocations and expenditures (2015/16 - 2016/17)
Sector Approved estimates (TZS) Expenditures (TZS)
Agriculture 18,985,014,700 3,006,452,113
Education 162,115,357 18,159,637
Health 28,792,970,916 3,090,677,679
Social Protection 6,528,044,500 5,609,407,485
Wash 35,339,337,131 1,926,884,277
Environment and climate change 3,860,473,000 192,084,260
39 Inter alia, unit costs are not specified, there is an unexplained discrepancy between cited total cost and aggregation of individual components, and across the board there appears to be a systematic underestimation of likely costs.

Nutrition Public Expenditure Review: Mainland Tanzania and Zanzibar
© Oxford Policy Management 119
Total nutrition-sensitive 93,667,955,604 13,843,665,451
Source: PER dataset. The two years’ data are combined.
Figure 36. Breakdown of nutrition-sensitive allocations and
expenditures (Zanzibar)
Source: PER dataset. The two years’ data are combined.
Figure 37 presents nutrition-sensitive allocations and expenditures by sector. It serves to further underscore the issues around nutrition budget execution and predictability of available funds, which were discussed above. This issue impedes nutrition spending in all sectors, with the possible exception of social protection nutrition-sensitive spending which performs comparatively well.
20%
0%
31%
7%
38%
4%
Breakdown of nutrition sensitive allocations (2014/15 - 2015/16)
21%
0%
25%39%
14%
1%
Breakdown of nutrition sensitive expenditures (2014/15 - 2015/16)

Nutrition Public Expenditure Review: Mainland Tanzania and Zanzibar
© Oxford Policy Management 120
Figure 37. Nutrition-sensitive allocations and expenditures (Zanzibar)
2015/16- 2016/17
Source: PER dataset. The two years’ data are combined.
As discussed elsewhere in this report, the definition of nutrition-sensitive interventions in the
Tanzanian policy framework differs from the global evidence base in one main respect,
namely that in Tanzania, water supply infrastructure is considered nutrition-sensitive. This
has a significant bearing on the sectoral distribution on nutrition-sensitive expenditure, and
goes a long way in explaining the dominance of the WASH sector identified above. The
charts below demonstrate this by excluding all budget lines associated with water supply
infrastructure, and resultantly the share of nutrition-sensitive spending coming from the
WASH sector falls to 0.27% for allocations and 0.14% for expenditures (compared to
37.73% and 13.54% when water supply is included). With this adjustment, the health,
agriculture and social protection sectors predominate.
05,000
10,00015,00020,00025,00030,00035,00040,000
Agriculture
Education
He
alth
Socia
l P
rote
ction
Wash
Environ
men
t an
d c
lima
techan
ge
n_sensitive
TZ
S M
illio
ns
nutrition allocations
Nutrition expenditures

Nutrition Public Expenditure Review: Mainland Tanzania and Zanzibar
© Oxford Policy Management 121
Figure 38. Breakdown of nutrition sensitive local budget allocations
and expenditures 2014/15 – 2015/16 (excluding water supply
infrastructure)
Source: PER dataset. Data is for both years, combined.
Lastly, Table 32 and Figure 39 present a breakdown of the reported investments in strengthening the nutrition enabling environment. Over 98% of such allocations (and 93% of expenditures) are for nutrition governance, which includes planning and coordination of nutrition activities, led by the nutrition unit in MOH-RGZ as well as district nutrition focal points. It also includes training and capacity building of health professionals in nutrition. Budget lines relating to district health plans and health sector coordination were also included (on a partial basis), as fieldwork indicated that most plans had a nutrition component.
More modest shares (2% of enabling environment allocations and 7% of expenditures) are for nutrition surveillance, surveys and information management. This includes monitoring of nutrition outcomes and costs associated with the nutrition scorecard initiative. It also includes costs of developing guidelines around nutrition, and food security monitoring. Furthermore, because the HMIS collects some nutrition-related indicators (specific and sensitive), related expenditure lines were (partially) included.
Table 32. Zanzibar’s enabling environment budget allocations and expenditures (2015/16 - 2016/17)
Category Approved estimates (TZS) Expenditures
(TZS)
Nutrition governance (Plans, policies, coordination, capacity) 1,809,361,780 174,476,176
Nutrition surveillance, surveys and information management 30,870,165 14,134,370
Enabling Environment Total 1,840,231,945 188,610,546
Source: PER dataset. The two years’ data are combined.
32.46%
0.28%49.23%
11.16%
0.27% 6.60%
Breakdown of nutrition sensitive budget allocations (2014/15 -
2015/16)
Agriculture Education
Health Social Protection
Wash Environment and CC
24.40%
0.15%
28.22%
45.53%
0.14% 1.56%
Breakdown of nutrition sensitive expenditures (2014/15 - 2015/16)
Agriculture Education
Health Social Protection
Wash Environment and CC

Nutrition Public Expenditure Review: Mainland Tanzania and Zanzibar
© Oxford Policy Management 122
Figure 39. Breakdown of enabling environment allocations (Zanzibar)
2015/16 – 2016/17
Source: PER dataset. The two years’ data are combined.
98%
2%
Nutrition government (plans, policies, coordination, capacity)
Nutrition surveillance, surveys and information management

Nutrition Public Expenditure Review: Mainland Tanzania and Zanzibar
© Oxford Policy Management 123
9.3 Budget process and performance for nutrition
9.3.1 Planning and budgeting processes for nutrition
Central budgeting processes in Zanzibar do not incentivise nutrition spending proposals. For
example, MDAs do not receive any directive to prioritise nutrition interventions in the budget
guidelines issued by MOFP-RGZ, nor is it a focus for budget officers scrutinising MDA
submissions. The move to programme-based budgeting has created space for discussion of
programme performance from a nutrition perspective. However, in practice, budget
deliberations between MDAs and MOFP-RGZ are time-constrained, and in parliamentary
hearings, nutrition discussions are limited primarily to the health budget.
This means that nutrition is prioritised within the budget, only where individual ministries see
it as a priority. MDAs indicated that they refer to the MKUZA and sector strategies when
determining budget priorities; none of the agencies met referred to the ZNNS. That
considered, interviewees reported a growing awareness amongst officials of the importance
of nutrition investments across a range of sectors.
Within the MOH-RGZ, which is the primary funder of nutrition activities in the budget, there is
no earmarking for a formal-based approach to the allocation of funds for nutrition vis-à-vis
other health priorities, but this is considered critical to ensuring fiscal flexibility. Within
Key findings:
Over 90% of allocations and expenditures go towards nutrition-sensitive interventions whereas only 7% of allocations and 5% of expenditures go towards nutrition-specific activities. In the (draft) ZNNS costing around half of the total budget over 5 years was expected to be nutrition-specific, therefore this heavy skew towards nutrition sensitive interventions is not in line with the vision of the ZNNS.
Analysis of nutrition-specific funding in Zanzibar is hindered by the fact that no breakdown of allocations to the MOH-RGZ nutrition unit was available (it is budgeted for under a single activity called “nutritional services”). However, in interviews, unit officials clarified that their focus was on nutrition specific interventions including salt iodisation, vitamin A distribution, exclusive breastfeeding campaigns and growth monitoring. Donor support to nutrition-specific interventions is focused on MIYCAN and Prevention and Management of Micronutrient Deficiencies (vitamin A supplementation and deworming). Modest investments were directed towards SAM and MAM treatment in Unguja.
Nutrition sensitive budget allocations are dominated by the WASH sector, followed by the health sector and then the agricultural. The education sector (through pre-primary school feeding) accounts for just 0.17% of identified nutrition-sensitive allocations. Relative to the draft costing of the ZNNS this is unexpected, with education and agriculture allocated the largest amounts of funding, followed by social protection and finally WASH.
Over 98% of enabling environment allocations are for nutrition governance, which includes planning and coordination of nutrition activities, and training and capacity building of health professionals in nutrition. More modest shares are for nutrition surveillance, surveys and information management.
Links to relevant recommendation(s):
R12 (to RGZ): Following the development of a nutrition policy, address the (likely) shortfall of nutrition-specific spending
R16 (to RGZ, TFNC): Strengthen nutrition capacity within RGZ (beyond MOH-RGZ) including at the local level in light of DbyD.
Links to relevant recommendation(s):
R16 (to RGZ, TFNC): Strengthen nutrition capacity within RGZ (beyond MOH-RGZ) including at the local level in light of DbyD
R13 (to MOFP-RGZ, TFNC, UNICEF): Consider integrating nutrition priorities into budget guidelines

Nutrition Public Expenditure Review: Mainland Tanzania and Zanzibar
© Oxford Policy Management 124
preventative services, nutrition is reportedly considered a priority, although the poor
execution rates of the nutrition unit (9.2.3) provide a basis for questioning whether that is
reflected in expenditure levels.
The Basket Fund has its own budget process separate from the RGZ budget. The process is
led by District Health Management Teams (DHMTs) at the district level, who compile an
annual Comprehensive DHMT plan and MTEF, based on HMIS data and needs as
communicated by health facilities, which is consulted upon with development partners and
other stakeholders before approval from zonal health management teams and a steering
committee at MOH-RGZ level. Planning guidelines for the Basket Fund direct DHMTs
towards a number of priority strategies, as detailed in the box below. Although nutrition-
specific interventions are not explicitly mentioned, they could fit within some of the specified
strategies (e.g. delivery and post natal services, home based care services, or antenatal
care services). DHMTs are not restricted to this list of priority strategies, but can identify any
strategy related to needs. What is mandatory is that they align each activity with one of a
number of overarching objectives for the fund (also in the box below), which are also broadly
enough defined to include nutrition. However, as with MOH-RGZ budget, there is no
earmarked allocation to nutrition in the Basket Fund. A district’s overall allocation is
determined by a formula which takes into account population, the number of primary health
care units, the poverty level and the disease burden, but there are no mandatory allocations.
As detailed in 9.2.4, nutrition-specific and sensitive allocations and expenditures from the
Basket Fund are modest.
Box 11. Basket Fund: Priority Strategies and Objectives
From Comprehensive District Health Planning Guidelines (2017/2018):
It is upon the DHMT/Hospital to select strategies which is effective to attain specific target. However, the following strategies are proposed to be used in planning. These are:
To pay for electricity
Ensure women not paying any fee for family planning, FANC, delivery or post-natal services.
Have basic health facilities equipment
Minor maintenance of building
Home based care services
Outreach for vaccination or ANC services
Cleaning supplies
Chlorination of water at source and at house hold level in collaboration with ZAWA
Surveillance of diarrhoea cases in collaboration with Epidemiology Unit
Referral of patients/pregnant women from community to facility and to higher level facility
In the template for the health Plan of Action, all recipients of Basket Fund funds are required report on planned activities, aligned to the below strategic objectives:
Ensure adequate and effective health workforce
Ensure equitable provision of quality curative care services
Improve health promotion and disease prevention
Ensure availability of required infrastructure, medicines, commodities and health equipment at all levels
Ensure adequate and sustainable financing for health sector
Ensure quality and timely research, monitoring and evaluation
Provide transparent and effective governance, evidence based policy development and partnerships within the health sector.
Source: Comprehensive District Health Planning Guidelines (2017/2018); POA dataset 2016/17

Nutrition Public Expenditure Review: Mainland Tanzania and Zanzibar
© Oxford Policy Management 125
The move towards a programme based budget is positive for nutrition because it orientates
spending decisions towards results and impact; inputs are clustered around activities with a
prespecified intended outcome and allocations can be directed towards priority outcomes.
However, there is no facility for cross-ministerial programmes, of which nutrition would
logically be one, due to its cross-sectoral nature. The reported reason for this is because of
the challenges it would pose for accountability (where more than one institution is
responsible for performance, the ability to tie budget allocations to performance is
weakened). However, this issue is not insurmountable, as international experience
demonstrates (see box below). The implication of this is that nutrition continues to be
budgeted for on a ministry by ministry basis in Zanzibar, which limits cross-sectoral
collaboration.
Box 12. Budgeting for shared outcome areas: some international experience
Improving nutrition demands a coordinated cross-ministerial response. At the same time, budgets are nearly
always structured and approved by ministry, as this mirrors demarcated lines of accountability. Different
governments have adopted different approaches to incentivising coordination within these constraints:
The Philippines operates what it calls a Programme Convergence Budgeting (PCB) approach to facilitate
and incentivise coordination between agencies on priority inter-Agency programs. Contributing agencies are
required to gather under the leadership of a lead agency, and identify relevant interventions in their plans,
funding requirements, and establishing collaborative M&E arrangements around them. The lead Agency for
each program has the responsibility to ensure collaboration and coordination among all the agencies
participating in the program. Example PCB programmes include the “First 1000 Days Program,” for nutrition.
Experience to date shows that the success of PCB depends on the passion and resilience of the lead
agencies, and the robustness of collaboration arrangements (better performing PCBs reportedly have formal
MOUs between the agencies). The Department for Budget Management has earmarked funds for
convergence programmes for which any contributing agencies can apply, through PCB programme specific
budget hearings.
Thailand is moving towards a similar system in setting up a system of thirteen Budget Committees for the
2017 budget, around twenty-three Integrated Budget Programmes identified in the Budget Allocation
Strategy. The Committees are chaired by the Deputy Prime Minister and hosted by a core ministry of the
programme, which acts as the Secretariat. Whilst the funding for each integrated budget programme will
need to be covered in the individual budgets of agencies budgets struck in one-to-one discussions between
the Bureau of Budget and the relevant ministries, the Integrated Budget Programmes committees will have
a role in signing off the budgets of member agencies. Compared to the earmarked funding response adopted
in the Philippines, this benefits from not distorting the budget allocation process, but nonetheless, it may risk
delaying the submission and passing of the budget if committee approvals are delayed. Despite that these
committees are not a mechanism for budget negotiations, through them, the budgets, projects, activities
and KPIs are discussed and agreed on for the programme. As a formal gathering, therefore, they provide
a forum in which policy initiatives and performance information on policies can be brought to the table.
Source: Pijuan and Allan 2016
9.3.2 Executing nutrition budgets
Nearly all MDAs cited challenges in budget execution, which is supported by the data
analysis in the previous chapter. The delays were in relation to the timeliness of transfers
from MOFP, which often arrived towards the end of the quarter, particularly in the case of the
first and last quarters, and were more pronounced in the development budget. However,
MOFP-RGZ reported that there have been improvements since MOFP-RGZ moved from
monthly to quarterly transfers. In addition, incomplete disbursements from MOFP, due to late

Nutrition Public Expenditure Review: Mainland Tanzania and Zanzibar
© Oxford Policy Management 126
or incomplete reporting from MDAs, were also noted as a contributor to execution
challenges. These challenges, whilst not particular to nutrition, impede the ability of the
ministries to provide nutrition related services.
In the case of the Basket Funds, DHMTs also expressed similar performance issues around
budget execution and delayed transfers from MOFP-RGZ. In this case, the difficulty is made
more severe by the fact that the governing Memorandum of Understanding between
partners and RGZ means that RGZ has to make its contribution first, and so where it is
subject to delays, development partner contributions are also delayed. When funds are
insufficient, DHMTs reported that they prioritise the ongoing running of health facilities. They
reallocate funds from other areas – including preventative services budget, - to cover these
basic running costs.
9.3.3 Monitoring of nutrition spending
All budget programmes are required to have associated performance indicators at the output and outcome level. In MOH-RGZ, the nutrition services programme has three nutrition-specific targets40; and across the ministry there are multiple nutrition-sensitive programme targets. Food security-focused targets were also identified related to MOANLF-RGZ programmes, and MOEVT-RGZ had an indicator related to the number of children benefitting from a comprehensive age-appropriate school health and nutrition education package.
Beyond these, examples of nutrition related budget programme performance indicators were few and far between. This may be a reflection of the fact that many of the nutrition-sensitive interventions identified were not conceived of as nutrition interventions or designed with their potential nutrition outcomes in mind. Take for example school feeding; this is frequently introduced as a means to improve enrolment, in which case the enrolment rate is typically measured rather than the nutritional status of students. The implication of this may be that the nutrition results of the programme are not maximised; which is evidently the case with pre-primary school feeding in Zanzibar, where porridge is routinely served instead of other more nutritious alternatives.
At the district level, data on nutrition outcomes is routinely collected and fed into district health information systems (DHIS) which then feed into the HMIS. DHMTs are required to prepare annual district health profiles alongside their plans and budgets, which present epidemiological data and data on health services provision and use. The constraint at the local level around monitoring of nutrition expenditures is that Basket Fund expenditures are not recorded by activity but by broad cost category, which makes is impossible to accurately monitor basket funds spent on nutrition.
9.3.4 Implications of DbyD on nutrition
The new service delivery transfers to districts fall out of the timeframe of the PER, but their potential implication for nutrition expenditure warrants a mention. From 2017/18, transfers will be going to districts for activities which included the following nutrition-related services:
Health: all primary health care will be decentralised which includes nutrition-specific expenditures (although nutritious foods will still be procured centrally), and nutrition-
40 2. 1 Increase the percentage of under five children administered by Vitamin A and deworming bi- annually; 2.2 Reduce underweight for children under five years and 2.3 Reduce stunting for children under five years
Nutrition Public Expenditure Review: Mainland Tanzania and Zanzibar
© Oxford Policy Management 127
sensitive services such as maternal and child health, family planning services and vaccinations.
Education: pre-primary school feeding
Agriculture: fish farming, and agricultural and livestock extension services
As with all service delivery, the decentralisation promise for nutrition is the opportunity to tailor services to meet local needs. In practice, the nature of the nutrition-related activities provided hasn’t changed considerably from when they were under the purview of the central government; the activities have largely been lifted from MDA budgets and transplanted into district budgets. However, this was during the first year of implementation, and may change in future years.
Whilst the delivery of these services was always at the district level, the management of the finances was not, and concerns were expressed about the ability of districts to manage the additional funds, as well as of PORALGSD to oversee the transfers. Given the reallocation of nutrition expenditure responsibilities, any teething problems experienced could negatively impact nutrition service delivery in Zanzibar.

Nutrition Public Expenditure Review: Mainland Tanzania and Zanzibar
© Oxford Policy Management 128
9.4 Efficiency and equity
A quantitative analysis of technical efficiency of nutrition services in Zanzibar has not been possible due to the lack of disaggregated data concerning nutrition outputs, and the issues regarding the RGZ and Basket Fund expenditure figures previously discussed. Nonetheless, it is apparent that a major impediment to technical efficiency is the timeliness of transfers, and the fact that funds frequently do not reach implementation units until later in quarter, resulting in a high percentage of unutilised funding.
Key findings:
Central budgeting processes in Zanzibar do not incentivise nutrition spending proposals. MDAs do not receive any directive to prioritise nutrition interventions in the budget guidelines issued by MOFP-RGZ, nor is it a focus for budget officers scrutinising MDA submissions. This means that nutrition is prioritised within the budget, only where individual ministries see it as a priority.
Regarding the Basket Fund, nutrition-specific interventions are not explicitly mentioned in the fund planning guidelines, although they could fit within some of the specified strategies. DHMTs are not restricted to this list of priority strategies, but can identify any strategy related to needs. As with MOH-RGZ budget, there is no earmarked allocation to nutrition in the Basket Fund.
The move towards a programme based budget is positive for nutrition because it orientates spending decisions towards results and impact; although there is no facility for cross-ministerial programmes, of which nutrition would logically be one, due to its cross-sectoral nature.
Challenges in budget execution impede the ability of ministries to provide nutrition related services, and relate to timeliness of transfers from MOFP. The Basket Fund also suffers from execution challenges, and when funds are insufficient, DHMTs reported that they reallocate funds from areas including preventative services budget, to cover basic running costs of health facilities.
All budget programmes are required to have associated performance indicators at the output and outcome level. Beyond MOH-RGZ and MOANLF-RGZ programmes, no nutrition related budget programme performance indicators were few and far between. This may be a reflection of the fact that many of the nutrition-sensitive interventions identified were not conceived of as nutrition interventions or designed with their potential nutrition outcomes in mind. The implication of this may be that the nutrition results of the programmes are not maximised.
From 2017/18, significant transfers will be going to districts for services in nutrition-related sectors. As with all service delivery, the decentralisation promise for nutrition is the opportunity to tailor services to meet local needs. The ability of local actors to manage funds for these services will be critical for nutrition outcomes going forward.
Links to relevant recommendation(s):
R11 (to RGZ and Development Partners): Consider developing (or refreshing) an overarching nutrition policy and coordination architecture to give strategic direction to nutrition interventions and strengthen accountability for results
R13 (to MOFP-RGZ, TFNC, UNICEF): Consider integrating nutrition priorities into budget guidelines
R14 (to MOH-RGZ, Basket Fund Contributors): Explore means through which the health basket fund resources can more purposefully be mobilised to support nutrition (specific) activities through the planning guidelines.
R16 (to RGZ, TFNC): Strengthen nutrition capacity within RGZ (beyond MOH-RGZ) including at the local level in light of DbyD

Nutrition Public Expenditure Review: Mainland Tanzania and Zanzibar
© Oxford Policy Management 129
With regards to allocative efficiency, we note that nutrition-specific spending levels are low, accounting for only 7% of nutrition allocations and 2% of expenditures. An increase in this area would be favourable in light of global evidence that these produces the highest marginal benefit in terms of nutrition outcomes, and the nutritional needs and priorities of Zanzibar as (partially) articulated in the ZNNS.
A comprehensive equity analysis is beyond the scope of this PER, but nonetheless, the following observations are noted:
The (unadopted) ZNNS included a commitment to ensuring equity is “mainstreamed enhanced in all nutrition initiatives to ensure equitable improved nutritional status of the entire population”. However as discussed previously, this isn’t being used to inform nutrition spending. Instead, sectoral strategic plans and policies guide spending priorities, and all those reviewed (including the Zanzibar Education Development Plan II; the HSSP III and the Zanzibar Food Security and Nutrition Policy, and the MLWEE0RGZ Strategic Plan) also included equity commitments (albeit not specifically in relation to nutrition).
District-level allocations under the Basket Fund, which accounts for a small portion of nutrition spending, are equity sensitive. They are guided by an allocation formula which includes parameters for poverty, population size, U5 mortality rate and land area.
Sectoral M&E systems mostly support equity analysis but could be strengthened. For example, most datasets are disaggregated to district level, enabling geographic analysis of nutrition outcomes and related issues. Some sectoral datasets also disaggregate by gender and (dis)ability (e.g. EMIS data), but others do not (including HMIS). This limits the ability to monitor how nutrition inequities converge with other vectors of inequity.
The extent to which nutrition-sensitive programmes are also equity-sensitive, varies. For example, child welfare outreach under MLEEYWC-RGZ focuses on disadvantaged families, however MOEVT-RGZ pre-primary school feeding grants are a universal grant equal to TZS 2000 / child, with no adjustments related to poverty or other equity concerns.
Key findings:
A major impediment to technical efficiency is the timeliness of transfers, and the fact that funds frequently do not reach implementation units until later in quarter, resulting in a high percentage of unutilised funding.
Allocative efficiency could be enhanced by allocating a greater share of spending to nutrition-specific interventions in light of global evidence that these produces the highest marginal benefit in terms of nutrition outcomes, and the nutritional needs and priorities of Zanzibar as articulated in the ZNNS.
The (unadopted) ZNNS is equity sensitive, as is Basket Fund allocation formula. The extent to which nutrition-sensitive programmes are also equity-sensitive, varies. Sectoral M&E systems mostly support equity analysis but could be strengthened.
Links to relevant recommendation(s):
R12 (to RGZ): Following the development of a nutrition policy, address the (likely) shortfall of nutrition-specific spending
R15 (to MOFP-RGZ and partners): Conduct an in-depth assessment of budget execution procedures and timelines and design appropriate, targeted measures to improve execution performance.

Nutrition Public Expenditure Review: Mainland Tanzania and Zanzibar
© Oxford Policy Management 130
10 Conclusions for Zanzibar
10.1.1 Limitations of analysis pertinent to these conclusions
The ability to draw out robust conclusions is critically limited by the incompleteness of the data. In the case of Zanzibar, the primary data constraints relate to the completeness and reliability of RGZ expenditure data, and gaps in non-basket donor data. Filling these data gaps should be a priority for improving accountability in nutrition expenditure.
10.1.2 Conclusions
Nutrition allocations have grown significantly over the two years under consideration
(amounts reported in the dataset grew from TZS 36bn in 2015/16 to TZS 67bn in 2016/17).
This is reportedly a reflection of the growing awareness of politicians and senior civil
servants to the importance of nutrition which is receiving greater fiscal prioritisation. Indeed,
the vast majority of nutrition spending (over 90%) flows through the RGZ budget (through
own source funds and on budget ODA), which underscores the importance of budget
processes for nutrition outcomes.
On this point, however, there is little evidence of central PFM processes operating in a way which purposefully supports nutrition spending. Nutrition does not feature in budget guidelines, there are no mandatory or recommended nutrition allocations, it is not a focus for budget officers when scrutinising budget submissions, and parliamentary discussions on nutrition issues are largely limited to deliberations over the health budget. Furthermore, cross-ministerial financial collaboration on nutrition-related programmes is hindered by the necessity for budget programmes to align with a single budget entity.
This means that nutrition is prioritised within the budget, only where individual
ministries see it as a priority. MDAs indicated that they tend to refer to the MKUZA and
sector strategies when determining budget priorities; none of the agencies met referred to
the (unadopted) ZNNS. Whilst interviewees reported a growing awareness amongst officials
of the importance of nutrition investments across a range of sectors, capacity remains
predominantly in the health sector (MOH-DGZ and district nutrition focal points), and
MOANLF-RGZ.
The assessment of the contribution of ODA to nutrition spending is muddied by data gaps, in particular for the nutrition-sensitive sector, but it is evident that Zanzibar’s nutrition response is reliant on important contributions from partners. This includes the provision of nutritious foods from UNICEF. The share of nutrition-related spending under the health basket fund appears to be relatively modest (less than 1% of total nutrition allocations in 2016/17 were derived from the Basket Fund). Decisions over how basket funds are allocated happen at the district level, with some guidance from the centre, although these guidelines stop short of specifically prioritising nutrition and there are no earmarked/mandatory allocations for nutrition related activities.
Arguably the most significant impediment to public expenditure outcomes for
nutrition is the challenges in budget execution. Whilst poor execution performance is not
unique to nutrition, preliminary data suggest that nutrition expenditures are not protected
from these, and that this impedes the ability of the ministries to provide nutrition related
services. Issues are reportedly related to the timeliness of transfers from MOFP-RGZ, which
often arrived towards the end of the quarter, particularly in the case of the first and last

Nutrition Public Expenditure Review: Mainland Tanzania and Zanzibar
© Oxford Policy Management 131
quarters and were more pronounced in the development budget. However, these challenges
in budget execution are not limited to RGZ funds; donor funds are also hindered by
execution challenges. The Basket Fund had spent less than half the reported zonal
allocation in both zones in 2015/16. Where resources are insufficient, anecdotal evidence
suggests that DHMTs may prioritise the ongoing running of health facilities, over preventive
services including nutrition.
In terms of the distribution of nutrition expenditures, the lion’s share of spending
(over 90%) targets nutrition-sensitive interventions in a wide range of sectors, with
smaller amounts directed towards nutrition-specific interventions. Nutrition-specific
interventions are focused on salt iodisation, vitamin A distribution41, exclusive breastfeeding
campaigns and growth monitoring. Nutrition-sensitive spending is dominated by the WASH
sector, which is predominantly composed of water supply infrastructure programmes,
followed by the health sector (specifically, reproductive health care and family planning, child
immunization, and malaria prevention) and then the agricultural sector (in the form of food
security interventions, provision of agricultural inputs, and research into nutritious crop
varieties). There are additional smaller but important (and growing) contributions from the
social protection and environment and climate change sectors. The education sector
accounts for less than 1% of identified nutrition allocations and sectors, related to pre-
primary school feeding grants, however with no guidelines as to appropriate foods, the
nutrition-sensitivity of this is in question. Additional investments in the enabling environment
focus primarily on nutrition governance (including planning and coordination of nutrition
activities, and training of health professionals around nutrition issues). Lesser amounts were
registered against nutrition related SBCC (in the form of village health days), and nutrition
surveillance (including the nutrition scorecard initiative and the HMIS).
A robust efficiency and equity analysis is limited by data constraints and there is no
overarching equity-sensitive nutrition policy in force. Equity awareness exists, but the
equity sensitivity of individual nutrition related programmes varies. For example,
Basket Fund allocations are determined through a formula which takes poverty and other
dimensions of deprivation into account, whereas the pre-primary school feeding grant is an
equal per capita allocation. Sectoral M&E systems mostly support equity analysis but could
be strengthened. For example, most of the datasets are disaggregated to district level, but
disaggregation by gender and (dis)ability are not always possible. This limits the ability to
monitor how nutrition inequities converge with other vectors of inequity.
Lastly looking forward, DbyD poses significant opportunities and risks for nutrition
funding. A lot of nutrition-sensitive and -specific expenditure in the education, health and
agriculture sectors is set to be decentralised under the new system. Consequently, ensuring
local government’s ability to plan and budget for the new transfers, and to prioritise nutrition
expenditures within the resource envelope, is of paramount importance.
41 The supplements themselves are provided by UNICEF.

Nutrition Public Expenditure Review: Mainland Tanzania and Zanzibar
© Oxford Policy Management 132
11 Recommendations Zanzibar
This section presents recommendations which are made in the light of the evidence presented
above. These were discussed with the PER steering committee in July 2018, and the Plan of
Action which was subsequently agreed is presented in Annex H.
R11. (to RGZ and Development Partners): Consider developing (or refreshing) an overarching nutrition policy and coordination architecture to give strategic direction to nutrition interventions and strengthen accountability for results
Rationale: Currently, Zanzibar does not have an operational overarching nutrition policy, as the ZNNS was never endorsed. In its absence there is no single document which strategically directs nutrition activities across the different sectors and different funders. As the PER indicates, nutrition spending is occurring (and growing) in the absence of a policy framework, however there is evidence to suggest it isn’t being optimised. For example, nutrition sensitive interventions and their monitoring frameworks are not always designed to maximise nutrition outcomes, the lack of guidance around appropriate foods for pre-primary school feeding being a case in point. Furthermore, without a policy framework to guide coordination, it is unsurprising that multisectoral coordination around nutrition occurs only on an ad hoc project by project basis.
Implementation: Development of a nutrition policy for Zanzibar should take place only if there is political appetite and RGZ support. Donor driven policy frameworks are rarely implemented. At this point in time the reasons why the ZNNS was not adopted are not clear. If the appetite is confirmed, the preferable option may be to embark on a consultation on and refresh of the ZNNS, as this would minimise the administrative burden associated with developing a policy afresh. However, this would only be advisable if such a process would result in a policy with enough cross-government ownership. At the very least, a review of the ZNNS should include a revised costing, as the current draft costing does not seem at all ambitious (9.3m USD over 5 years) and is unlikely to help lead to the desired outcomes. The draft ZNNS would also benefit from a more detailed costed action plan for each sector with a detailed evaluation framework for how each sector would monitor implementation and progress.
Following policy development, RGZ should establish and convene an appropriate coordination structure whose responsibilities would include: i) overseeing implementation of the nutrition policy, ii) monitoring the flow of funds to priority programmes, iii) strengthening cross-sectoral collaboration on nutrition interventions including ensuring the nutrition-sensitive interventions are maximising nutrition outcomes, and iv) to improve the monitoring of nutrition-related results on priority interventions. If there are options for embed such a nutrition coordination function within existing structures for the coordination of government business, these should be pursued. The coordination mechanism should involve all of the MDAs engaged in the delivery of nutrition services, as well as PORALG-SD (given their role in coordinating local level activity), MOFP-RGZ (from budget and expenditure perspective), a representative from the health Basket Fund and other key development partners. The model of the High-level Steering Committee for Nutrition from mainland Tanzania could be adapted and adopted for these purposes.
With time, RGZ may wish to look possibilities for devising a cross-sectoral financing mechanism for nutrition. This could be in the form of a converged budget programme for nutrition, under which multiple agencies can bid for funds; or budget programmes can remain under the purview of a single MDA, but with more formalised arrangements to enable other MDAs to contribute to how those funds are implemented and managed.

Nutrition Public Expenditure Review: Mainland Tanzania and Zanzibar
© Oxford Policy Management 133
R12. (to RGZ): Following the development of a nutrition policy, address the (likely) shortfall of nutrition-specific spending
Rationale: Currently on 7% of nutrition-related allocations directly address malnutrition through nutrition-specific approaches, and 5% of expenditures. In the (draft) ZNNS costing nutrition-specific interventions comprise around half of the total budget over 5 years. Therefore, these findings on the expenditure breakdown being skewed heavily towards nutrition sensitive interventions implies that current spending patterns are not in line with what the ZNNS envisaged. With the possibility of a new/refreshed nutrition policy, there is an opportunity to review whether nutrition-specific activities are similarly underfunded against the new plan and to take appropriate corrective measures.
Implementation: Following the development and approval of a nutrition strategy, compare the costing to the current levels of nutrition-specific expenditure identified here. In the likely case that a shortfall is identified, undertake a fiscal space analysis to identify where budgetary room for nutrition-specific programmes may be increased. Possible pathways include additional domestic revenue dedicated to a particular purpose (through inter and intra sectoral reallocations, or additional revenues raised), additional foreign grants, additional borrowing or efficiency gains. Each have ramifications for fiscal sustainability, and warrant careful consideration.
R13. (to MOFP-RGZ, TFNC, UNICEF): Consider integrating nutrition priorities into budget guidelines
Rationale: Currently, central PFM process operating in a way which purposefully supports nutrition spending. Therefore, whether or not nutrition features in an MDA budget is primarily determined by sectoral strategic priorities. Central budget guidelines can be a powerful tool for driving specific priorities in the budget from the centre. Currently, RGZ budget guidelines specify a number of strategic priorities which MDAs are directed to consider in budget submissions, but nutrition is not amongst these. Subsequently, it is not a standing concern for budget officers when scrutinising budget submissions.
Implementation: MOFP-RGZ should consult around including nutrition as a strategic priority in 2019/2020 budget guidelines. Supporting guidance would be required to define nutrition specific and sensitive interventions. This can be drawn from the nutrition policy framework if revisited (see R11), or alternatively could be prepared by TFNC. Subsequent to this, MOFP-RGZ should be given training on how to identify nutrition-relevant activities during budget scrutiny processes, which could potentially be provided by TFNC and/or UNICEF.
R14. (to MOH-RGZ, Basket Fund Contributors): Explore means through which the health basket fund resources can more purposefully be mobilised to support nutrition (specific) activities through the planning guidelines.
Rationale: Budget allocations from the basket fund for nutrition-related activities are notably
modest, particularly in the case of nutrition-specific activities, and have fallen over the
reporting period by 49%. Planning guidelines for the Basket Fund direct DHMTs towards a
number of priority strategies. Although nutrition-specific interventions are not explicitly
mentioned, they could fit within some of the specified strategies (e.g. delivery and post natal
services, home based care services, or antenatal care services).
Implementation: Basket Fund stakeholders should consult and consider revising the guidelines to include a stronger directive on nutrition spending. Combining this with efforts to generate greater nutrition spending through the RGZ budget (R13) will ensure sustainability. When there is underspend in some areas, resources could be redirected towards nutrition services.

Nutrition Public Expenditure Review: Mainland Tanzania and Zanzibar
© Oxford Policy Management 134
R15. (to MOFP-RGZ and partners): Conduct an in-depth assessment of budget execution procedures and timelines and design appropriate, targeted measures to improve execution performance
Rationale: Arguably the most significant impediment to public expenditure outcomes for
nutrition is the challenges in budget execution. Whilst poor execution performance is not
unique to nutrition, preliminary data suggests that nutrition expenditures are not protected
from these, and that this impedes the ability of the ministries to provide nutrition related
services.
It was beyond the scope of this PER to conduct the detailed analysis to identify blockages
with certainty. Anecdotal evidence gleaned through interviews suggest the delay maybe
related to the timing of transfers from MOFP-RGZ to MDAs, which often arrived towards the
end of the quarter, but a multitude of reasons could be behind this (including, for instance,
incomplete or late reporting from MDAs, poor revenue forecasting, unrealistic activity costing
or planning, in-efficient cash management processes, extensive arrears, overly strenuous
procurement procedures, lagging capacity, etc.). Without a detailed diagnostic of the specific
constraints (of the sort which could be gleaned from a Public Expenditure and Financial
Accountability (PEFA) assessment) it is difficult for appropriate solutions to be devised.
Implementation: A PEFA for Zanzibar state is reportedly in the pipeline.42 This study should
be fast tracked and given a mandate to focus on budget execution challenges. Subsequent
recommendations should be implemented by RGZ, and the impact on nutrition expenditure
monitored through the nutrition coordination architecture.
R16. (to RGZ, TFNC): Strengthen nutrition capacity within RGZ (beyond MOH-RGZ) including at the local level in light of DbyD
Rationale: Most of the nutrition expertise in RGZ currently sits within MOH-RGZ, within the nutrition unit. All districts have nutrition focal persons reporting to the MOH-RGZ, however, resource constraints meant that only two additional qualified nutritionists were employed (the rest of the positions were filled with reassigned health officers who underwent some nutrition training from MOH-RGZ), and their cross-sectoral coordination role is limited (as they report to MOH-RGZ). There is also a food security and nutrition unit within MOANLF-RGZ, but it does not enjoy the same status and resources of other functions under the ministry. Beyond this, there appears to be limited nutrition expertise in other RGZ MDAs. Addressing this capacity shortage and concentration, is critical not only to ensuring that nutrition-sensitive interventions are designed and monitored in a way which maximises their nutrition impact, but also to ensure that local level planning and budgeting for nutrition is adequate, given the new local government grants for health, education and agriculture from 2017/18 onwards.
Implementation: A commonly adopted model for building and spreading nutrition capacity
amongst SUN member countries is to assign a nutrition focal person in all relevant ministries
(including MOEVT-RGZ). The role of these persons would be to advise on the design and
implementation of nutrition-sensitive programmes under their purview and to facilitate cross
ministerial coordination. Ideally they should combine nutrition and sector specific expertise.
Their recruitment and training could be supported by TFNC.
At the local level, there is cause for strengthening the role of the nutrition focal points. This
could be done by ensuring the posts are filled with individuals with appropriate educational
42 https://pefa.org/assessments/tanzania-zanzibar-state-2017

Nutrition Public Expenditure Review: Mainland Tanzania and Zanzibar
© Oxford Policy Management 135
backgrounds, and with enough seniority to engage proactively with District Management
Teams. It might also make sense for the district nutrition officer to report to the
District/Municipality Executive Director, (as opposed to reporting into MOH-RGZ) particularly
as DbyD will means that a lot of the nutrition budgeting decisions are being decentralised
down to the local level.
R17. (to RGZ and Development Partners): Improve the timeliness and comprehensiveness of expenditure reporting
Rationale: Monitoring public expenditure for nutrition and ensuring accountability around commitments, is entirely dependent on the timeliness and completeness of expenditure data. RGZ may wish to use this PER as a baseline against which progress on nutrition spending can be measured. However, its ability to do so will depend entirely on strengthening the process of expenditure reporting. At present, expenditure reporting is patchy and delayed, and would benefit from more robust quality assurance processes. This includes government reporting on the IFMS, donor reporting on ODA to MOFP and MDAs, and reporting around donor funds (like the basket fund, which presently does not report expenditures on an activity basis). Of course, improving on this front will facilitate better fiscal management overall and across all sectors, not just in the case of nutrition.
Implementation: MOFP-RGZ (through the Accountant General’s office) should seek to enforce timely reporting by MDAs through the IFMS system. Typically, a schedule of one month after quarter end is a reasonable target to aim for. Where reported figures are widely differing from allocated amounts, a brief justification should be provided by the MDA. Reporting expenditures against on-budget aid commitments should also adhere to these timeframes.
In the case of the basket fund, it is recommended that the fund operational guidelines be revised to necessitate expenditure reporting against specific activities as well as by overall cost category. This will enable the fund’s spending against specific areas of health to be monitored, and will enable a more rigorous assessment as to which is any areas are squeezed out under situations of resource constraints.

Nutrition Public Expenditure Review: Mainland Tanzania and Zanzibar
© Oxford Policy Management 136
References
Bhutta et al., 2013. Evidence-based interventions for improvement of maternal and child nutrition: what can be done and at what cost? Series on Maternal and Child Nutrition 2. The Lancet.
Black et al. 2013 Maternal and child undernutrition and overweight in low-income and middle-income countries, Maternal and Child Nutrition, the Lancet, Series on Maternal and Child Nutrition 2013
Development Initiatives, 2017. The Global Nutrition Report 2017: Nourishing the SDGs. Bristol, UK: Development Initiatives.
Greener, R., Picanyol, C., Mujica, A. and Allan, S. (2016) “Analysis of Nutrition-Sensitive Budget Allocations: Experience from 30 countries” DFID/MQSUN. Hoddinott, J., H. Alderman, J. R. Behrman, L. Haddad, and S. Horton, 2013. The Economic Rationale for Investing in Stunting Reduction. Maternal and Child Nutrition 9: 69–82.
Hoddinott, Rosegrant, and Torero, 2012. Investments to reduce hunger and undernutrition Paper prepared for Copenhagen Consensus. International Food Policy Research Institute, Washington, DC.
IMF, 2007 PFM Technical Guidelines Note 3: Commitment Controls
IMF, 2016. Article V: United Republic of Tanzania: Fifth Review Under The Policy Support Instrument—Press Release; Staff Report
IMF, 2017. Article V: United Republic of Tanzania: Fifth Review Under The Policy Support Instrument—Press Release; Staff Report
Innovex, UNICEF and Irish Aid, 2014. Public Expenditure Review of the Nutrition Sector
International Food Policy Research Institute, 2014. Global Nutrition Report 2014: Actions and Accountability to Accelerate the World’s Progress on Nutrition. Washington, DC.
International Food Policy Research Institute, 2016. Global Nutrition Report 2016: From Promise to Impact: Ending Malnutrition by 2030. Washington, DC.
Ministry of Finance and Planning, 2017, Assessment of the Public Financial Management Systems of the Central Government applying the PEFA 2016 Framework: Final Report, October 2017
Ministry of Finance and Planning, 2017. Planning and Budget Guidelines 2018/19
Ministry of Health and Social Welfare, 2011. National Nutrition Strategy – July 2011/12 – June 2015/16. The United Republic of Tanzania
Ministry of Health, Community Development, Gender, Elderly and Children (MoHCDGEC) [Tanzania Mainland], Ministry of Health (MoH) [Zanzibar], National Bureau of Statistics (NBS), Office of the Chief Government Statistician (OCGS), and ICF. 2016. Tanzania Demographic and Health Survey and Malaria Indicator Survey (TDHS-MIS) 2015-16. Dar es Salaam, Tanzania, and Rockville, Maryland, USA: MoHCDGEC, MoH, NBS, OCGS, and ICF.
MOFP 2015. Guidelines for the Preparation of Annual Plan and Budget for 2015/16 in the Implementation of the Five Year Development Plan 2011/12-2015/16
National Audit Office, 2018, The Annual General Report of the Controller and Auditor General on the Financial Statements for the year ended 30th June, 2017: Local Government

Nutrition Public Expenditure Review: Mainland Tanzania and Zanzibar
© Oxford Policy Management 137
ODI 2014. Volume I: Local Government Authority (LGA) fiscal inequities and the challenges of ‘disadvantaged’ LGAs
OECD 2006. Budget Practices and Procedures database: Final Glossary
PEFA 2016. PEFA Handbook Volume II
Pijuan and Allan, 2016 Integrating Equity into PFM Systems in East Asia and the Pacific: Synthesis Report. OPM for UNICEF EAPRO.
PMO 2012. Guidelines for Councils for the Preparation of Plan and Budget for Nutrition
PO-RALG 2016. Allocation of Funds for Nutrition Interventions in the Plans and Budget of Regions, Towns, Municipal and District Councils for the Financial Year of 2016/17 – 2018/19
Prime Minister’s Office, 2016. National Multi-sectoral Nutrition Action Plan – From Evidence to Policy to Action – July 2016 – June 2021. The United Republic of Tanzania
Shekar et al., 2017. An Investment Framework for Nutrition: Reaching the Global Targets for Stunting, Anaemia, Breastfeeding, and Wasting. Directions in Development. Washington, DC: World Bank.
The Revolutionary Government of Zanzibar, 2014. Zanzibar Multi-sectoral National Nutrition Strategy & Costed Implementation Plan 2014-18 (draft)
UNICEF 2012. Budgeting for Children in Tanzania: A guide for civil society organisations
UNICEF 2017. Zanzibar budget brief: FY 2011/12–FY 2015/16. Focus on health, nutrition and education
UNICEF, 2013. Improving Child Nutrition - The achievable imperative for global progress.
UNICEF, 2016. Nutrition Budget Brief.
World Bank, 2009. Core Guidance: Preparing PERs for Human Development.

Nutrition Public Expenditure Review: Mainland Tanzania and Zanzibar
© Oxford Policy Management 138
Glossary of key public finance management terminology
Absorption The capacity of the sector/ institution to spend and use effectively budgetary provisions. Spending as a percentage of funds received is referred to as absorption rate.
Arrears Outstanding payment obligations that the government has failed to discharge in a reasonable period of time. They can arise on any expenditure item, including wages, debt service, transfers, and goods and services.
Budget A comprehensive statement of government financial plans including expenditures, revenues, deficit or surplus, and debt. The budget is the government’s main economic policy document, indicating how the government plans to use public financial resources to meet policy goals.
Budget Allocation The maximum amount the government agency or organization is authorized to spend in a given fiscal year.
Budget Classification
A normative framework for the day-to-day administration and monitoring of budget execution, policy formulation and analysis, ensuring accountability, providing information to parliament and the public, and creating the basis for budget authorization
Budget Cycle The major events or stages in making decisions about the budget, and implementing and assessing those decisions, encompassing formulation, approval, implementation and oversight.
Budget Execution Budget execution is the phase where resources are used to implement policies incorporated in the budget.
The budget execution rate is defined as outturns / actual expenditure as a percentage of the approved budget allocation. It is also sometimes referred to as budget credibility which is similarly defined as the degree of deviation between planned and actual spending over a specified period (usually 12 months)
Budget Formulation
The processes for preparing a government’s budget, from preliminary analyses and forecasts, through submission of budget requests by ministries and other government bodies and the review and decision of the executive, to its official presentation to the legislature.
Capital Expenditure
Investments in assets that will last for more than a year, such as vehicles; repair and maintenance expense for buildings and roads
Decentralization The transfer of responsibility from central ministries to field offices giving them more managerial decision authority managerial discretion.
Economic Classification
The classification of expenditures (or expenses) and the acquisition/disposal of assets into economic categories, which emphasis the economic nature of the transaction (salaries, interest, transfer, etc.)
Fiscal Decentralization
The assignment of revenues, as well as transfer of resources and some degree of budgetary autonomy, to subnational authorities.
Functional Classification
The classification of expenditure (as well as expense) transactions and acquisitions/disposals of financial assets for policy purpose, according to the purpose for which transactions are undertaken. The standard Classification of Function of the Government (COFOG) system, established by the United Nations, is aimed at facilitating international comparisons and preparing income accounts consistent with the System of National Accounts methodology
Recurrent Expenditure
Expenditure on goods and services consumed within the current year,which needs to be made recurrent to sustain delivery services.
Nutrition Public Expenditure Review: Mainland Tanzania and Zanzibar
© Oxford Policy Management 139
Intergovernmental Fiscal Transfers
Payments made from central government to subnational governments to support subnational government’s expenditure can be made in the form of unconditional grants, where their final use is determined by the subnational governments through their budgets, or through conditional (earmarked) grants to subnational governments to implement selected service delivery and expenditure responsibilities—for example, by function or program, typically in accordance with an agreed-upon regulatory or policy standard.
Source: PEFA 2016, OECD 2006, IMF 2007

Nutrition Public Expenditure Review: Mainland Tanzania and Zanzibar
© Oxford Policy Management 140
Annex A List of People Met
Name Designation Organisation
Government of Tanzania (mainland)
C.A. Mwamwaja Assistant Commissioner - Budget MOFP (LGAs & regions)
Flora Nkoba MOFP (LGAs & regions)
Evodius Kanyamyoga Budget Officer MOFP (LGAs & regions)
Adam R. Msumule Principle Economist MOFP
Jacqueline Manyanga MOFP
Adella Mpina PMO
Bariki Mwasaga PMO
Dr Ntuli Kapologwe Director of Health Services PO-RALG
Stephen Mtambi Assistant Director for Nutrition PO-RALG
Rashid Mafta Assistant Director for Social Protection PO-RALG
Andrew M. Komba Director of Sector Coordination PO-RALG
Dr Vincent Assey Assistant Director for Nutrition Services MoHCDGEC
Elimpaa Y. Kiranga Principal Agricultural Officer MoALF
Martin MoWI
Jeremiah Sendoro MoEVT
Makuru Petro MoEVT
Changane George MoEVT
Joel A Muvamasangula MoEVT
Elisabeth Msangi Assistant Director of Planning and Budgeting MoTI
Dr. Joyceline Kaganda Managing Director TFNC
Julieth Itatiro Research Officer TFNC
Geoffrey Chiduo Policy and Planning Director TFNC
Catherine Kimalando TFNC
Clifford Tandale Regional Administrative Secretary (RAS) Morogoro Region
Happy Moses Regional Nutrition Coordinator Morogoro Region
Ntenu Kila Regional Planning Officer Morogoro Region
Dr. Frank Jacob Regional Medical Officer Morogoro Region
Elina Kweka District Nutrition Officer Morogoro Municipality
Happiness Masata District Planning Officer Morogoro Municipality
- District Planning Officer Makete DC
- District Nutrition Officer Makete DC
- District Treasury Officer Makete DC
- District Medical Officer, Health Secretary and DRCH Officer Makete DC
- Agriculture, Irrigation and Cooperatives Officer Makete DC
- Primary Education Officer Makete DC
- Secondary Education Officer Makete DC
- Community Development Officer Makete DC

Nutrition Public Expenditure Review: Mainland Tanzania and Zanzibar
© Oxford Policy Management 141
- Livestock and Fisheries Officer Makete DC
- Regional Nutrition Officer and District Nutrition Officer Rukwa region; Sumbawanga
DC
Nyange J Msemakweli District Executive Director Sumbawanga DC
Mr. Komba District Planning Officer Sumbawanga DC
Mr. Nduhiye District Treasury Officer Sumbawanga DC
- Fishing and irrigation Officer, Water engineer, Primary and
secondary education officers, Community Development
Officer, Agriculture Officer
Sumbawanga DC
- District Medical Officer, Health Secretary and DRCH Officer Sumbawanga DC
- Acting District Planning Officer Moshi DC
Acting District Treasury Officer Moshi DC
- Regional Nutrition Officer and District Nutrition Officer Kilimanjaro region; Moshi DC
- District Medical Officer, Health Secretary and DVO Officer Moshi DC
- Primary and secondary education officer, WASH officer,
community development officer and agriculture officer
Moshi DC
Revolutionary Government of
Zanzibar
Azzan M. Azzan DPHO DHMT- West
Ali Haji Ramadhan Liason Officer FAO
Amina Issa Salum Accounts Officer Magharibi B District
Azza Amgir Social Welfare Officer Magharibi B District
Hasna Masoud Land and water. Magharibi B District
Khamis Suleiman Agricultural extension Officer Magharibi B District
Maryam Khamis Planning Officer Magharibi B District
Ramadhan A Hassan Livestock & fisheries Magharibi B District
Rehemia Khamis Ali Environment Officer Magharibi B District
Soud Hassan Soud Education Officer Magharibi B District
Amoour Ally Mussa District Executive Officer, M. Municipality Magharibi B Municipality
Swaumu Daniel Municipal Planning Officer, M Municipality Magharibi B Municipality
Ali Suleiman Pharmacist Magharibi DHMT
Mwananmvun Bilal District Public Health Officer Magharibi DHMT
Rahma Mdisara District Medical Officer Magharibi DHMT
Sabiha Khamis District Health Administrative Officer Magharibi DHMT
Salama Makame Ashrak District Nutrition Focal Person Magharibi DHMT
Sharifa Seif District Data Manager Magharibi DHMT
Mansura Kassim Director – food security and nutrition MANRLF
Sheha Idrissa Hamdan Director of Policy and Planning MANRLF
Abdul Omar Nassi District Administrator Michewani DHMT
Fasisi Ismail Bakar District health data officer Michewani DHMT
Fatima Ghezzad District Medical Officer Michewani DHMT
Mwandaidi Khamis District Public Health and Nursing Officer Michewani DHMT
Zuhura Soud Nutrition Focal Person Michewani DHMT

Nutrition Public Expenditure Review: Mainland Tanzania and Zanzibar
© Oxford Policy Management 142
Abdalla Hamad Agriculture Officer Michewani DMT
Ali Khamis Planning Officer, District Council Michewani DMT
Bizume Zume Women and children district officer Michewani DMT
Hamad Uhamis Social Welfare Officer Michewani DMT
Juma Haji District Livestock Officer Michewani DMT
Mbwana Shaame Said District Education Officer. Michewani DMT
Salhina Mwita Ameir Director of Planning, Policy and Research MLWEE
Ali Basha Planning Officer MoANRLF Zanzibar
Khalid Director of Policy and Planning MOEVT
Abdalah Mzee Deputy Principal Secretary MoEVT Zanzibar
Khamis Omery Principle Secretary MoFP Zanzibar
Mwita M Mwita Budget Commissioner MoFP Zanzibar
Shabani J Jumanne; Mulhat Budget Technical Focal Point MoFP Zanzibar
Omar A. Abdalla Economist MOH
Asha Salmin Head of Nutrition Unit MoH Zanzibar
Dr. Fadil Mohammed Director Preventive Services MoH Zanzibar
Rahma Maisala District Health Officer, District Health Management Team MoH Zanzibar
Abdulla Mohamed Ali, Pemba Zonal Medical Office
Dr Haji Khatib Fakih Zonal Public Health Officer Pemba Zonal Medical Office
Dr Mbwana Shoka Salim Zonal Medical Officer Pemba Zonal Medical Office
DG Daima Director of Policy, Planning and Research Department PORALGSD Zanzibar
Khadija Abass Mohammed Zonal Public Health Officer Unguja Zone
N/A Zonal Accountant Unguja Zone
Other
Biram Ndiaye Head of Nutrition Section UNICEF
Joyce Ngegba Nutrition Specialist UNICEF
Hayrullo Malikov Social Protection Specialist UNICEF
Beatrice Targa Social Protection Specialist UNICEF
Mathew Cummins Regional Social Policy Specialist UNICEF
Dennis Biseko PFM Specialist World Bank
Chiho Suzuki Health Adviser World Bank
Esther Independent consultant
Shemsa Nassor Msellem Nutrition specialist UNICEF

Nutrition Public Expenditure Review: Mainland Tanzania and Zanzibar
© Oxford Policy Management 143
Annex B Development Partner data request and template
Instructions for filling out the template
Instructions for filling out the template Division of labour in reporting Since the template will be filled out by donors, UN agencies and NGOs, it is crucial to avoid double counting. To this end, we request the respondent to follow guidelines outlined below:
1. NGOs should report on all nutrition programmes they implement (regardless of whether they are funded by donors / UN / own resources) indicating source of funding in indicated columns
2. UN agencies should only report on programmes they implement directly themselves and on contributions (money / in kind) they give to the government for nutrition. Funding channelled through NGOs or other UN agencies should be excluded. 3. Donors should be requested only to report on those nutrition programmes they implement directly themselves (if any), and on contributions (money / in kind) they give to the government for nutrition i.e. excluding nutrition funding they channel through the UN/NGOs;
Column Title Explanation of column titles in the template
Column B Project/programme name
Please clearly write the name of the project/programme.
Column C Priority Area Choose an appropriate option from the dropdown menu. The options are based on major priority areas indicated in the National Nutrition Strategy document (2011-2016) and the NMNAP (2016-2021). They have been modified slightly to make the list more exhaustive. If the project primarily focuses on capacity building, then please choose the option 'Nutrition governance' and provide a description of its nature in column 'D'. If the project focuses on more than one priority area, please include a new line for each priority area under the same project. For instance, if the project also focuses on providing 'Vitamin A supplements' then enter a second line choosing the priority area 'vitamin and mineral deficiencies'
Column D Provide description, if other
Please provide a description or name the priority area if you think the drop-down options in column 'C' does not cover this. Also please use this column to provide a description if the project is heavily focused on 'capacity building'

Nutrition Public Expenditure Review: Mainland Tanzania and Zanzibar
© Oxford Policy Management 144
Column E Activity type Will be filled automatically when fill in column 'C'
Column F Sector Please choose any one sector based on the priority area chosen. If there is more than one sector, choose the one that receives majority of the budget allocation
Column G Name region of operation
Choose from the dropdown menu to indicate what regions are supported by the project. If a specific region is supported, please choose accordingly. If more than one region is supported by each priority area of the project, please make a new line entry for every region. If all regions in the Mainland or Zanzibar are supported, please choose the option 'all regions'. If agencies at the Central Government (for e.g. support to the TFNC), please choose option 'National level Mainland' or 'National level Zanzibar' accordingly.
Column H Sources of funding This column is divided into type of donor - multilateral, bilateral etc. If there is more than one type of donor, please add a new line of expenditure for each. For instance, finance could be received from multiple sources such as an NGO’s 'own source' and a 'bilateral contribution'. In such cases, please enter two lines - one each for bilateral and 'own source'.
Column I Name funding organisation
Mention the name of the funding organisation(s). For instance, if column 'H' is bilateral, please list all the bilaterals who provide funding.
Column J Which admin unit is funding provided to?
Choose from the dropdown menu to indicate if funding is provided to a Central Government body, LGA, directly to a service delivery unit (for instance, PHCCs) or an NGO/implementing partner which will then provide the service
Column K Currency in which values are provided
If you are able to enter the information in TShs, please do so. If not, feel free to use the currency used by your organisation for internal budgeting. Please make sure to maintain consistency and use the same currency for all values entered across columns L-S.
Column L Total value of the activity
Provide the total value over the life of the project only for the component that priority area chosen represents
Column M Time period of the project
Mention the start and end year of the project
Columns N, P, R
Allocation Please mention the amount allocated to your organisation by a donor or from ‘own source’ for the priority area chosen for each financial year (FY) indicated. A FY can be defined based on your organisation’s FY calendar if it is not possible to define by Tanzania FY.
Columns O, Q, S
Expenditure Please mention the amount released/expended by your organisation for the priority area chosen for each financial year (FY) . The amount could be released to another implementing partner or a service delivery unit or expended on purchase of goods and services.

Nutrition Public Expenditure Review: Mainland Tanzania and Zanzibar
© Oxford Policy Management 145
Development Partner Data Collection Template
Name
Organisation
Organisation type NGO or CSO
Phone number
Email address
Comments
Project/Programme Name Priority Areas
Provide description, if
other or 'nutrition
governance'
Activity type SectorName region of
operationSources of funding
Name funding
organisation
Which admin unit is
funding provided
to?
Currency in which
values are provided
Total value of the
activity/component
Time period of the
project
Guidelines
Make new entry for a
different priority area
within the project
Automatically filledChoose best-fit
option
Make new entry
for a different
region
Make a new entry for
a different type of
funding source
If more than one funder
for chosen source type,
separate by comma
Choose from drop-
down
E.g. TShs, USD,
GBP, AUD, Euro,
CAD
Allocation Expenditure Allocation Expenditure Allocation Expenditure
ABCVitamin and mineral
deficienciesNutrition specific
Health and social
welfareDodoma Region Bilateral DfID, UNICEF
Transferred
onwards to an NGO
or implementing
partner
USD 500,000.00 2012-2016
ABC Nutrition Governance
Capacity building for
nutrition budget officers
in Kibaha district
Enabling environmentHealth and social
welfarePwani Region Bilateral DfID
Local Government
AuthorityUSD 300,000.00 2012-2016
Contact Details
Programme related Funding amount
2013-14 2014-15 2015-16

Nutrition Public Expenditure Review: Mainland Tanzania and Zanzibar
© Oxford Policy Management 146
Annex C Mainland Tanzania and Zanzibar draft data requests
Data request to MOFP 29 June 2017
Permanent Secretary Treasury (PST), Attn Commissioner for Budget, Charles Mwamwaja,
Dear Sir,
Public Expenditure Review of Nutrition
We take this opportunity to thank you for your support for this initiative. We are now writing to request data from the IFMS system and documents in order for the program to go ahead.
Nutrition activities (specific, sensitive and/or governance related) take place at central and LGA level in nutrition-relevant MDAs. They are:
1. Ministry of Health, Community Development, Gender, Elderly and Children 2. Ministry of Agriculture, Livestock and Fisheries 3. Ministry of Education, Science, Technology and Vocational Training 4. Ministry of Industry, Trade and Investment 5. Ministry of Water and Irrigation 6. Tanzania Food and Nutrition Centre 7. President’s Office – Regional Administration and Local Governments 8. Prime Minister’s Office 9. Ministry of Finance and Planning
For nutrition-relevant MDAs we seek to identify activities related to nutrition, and to identify amounts budgeted and spent for each of those activities in the years: 2013/14, 2014/15 and 2015/16. We are unable to specify exact activities in advance, but they will be based upon the categories indicated in the National Multi Sector Nutrition Action Plan (NMNAP).
Accordingly, we request:
1. The IFMS database for the nutrition-relevant ministries indicated above with full budget classification for the years 2013/14, 2014/15 and 2015/16
2. Clarification of the meaning and use of each segment of the current 28 digit IFMS code.
3. A copy of the Final Draft 2017 PEFA will be helpful in many ways. We will of course respect any confidences requested.
You have advised us to request certain information directly from Ministries and/or LGAs. We attach a draft of a letter to be sent to the nutrition-relevant MDAs , and would be grateful if you would send these letters to the MDAs on our behalf, when we have no doubt they will be expedited.
We are still seeking a comprehensive record of LGA MTEFS, financial statements and details of transfers in order to complete our Public Expenditure Review. We will contact PO-RALG to obtain this data and will be grateful for any support you can provide.

Nutrition Public Expenditure Review: Mainland Tanzania and Zanzibar
© Oxford Policy Management 147
We are aware of the many pressures on your team at present, but would respectfully request that you provide this information soon, in order for our programme to go ahead according to plan. If we were able to receive the information by July 7th it would be very helpful.
Additional data may become necessary. If this proves to be the case we will advise you as soon as possible and submit a supplementary request. Do let us know if you need any clarification.
Yours etc.,
UNICEF

Nutrition Public Expenditure Review: Mainland Tanzania and Zanzibar
© Oxford Policy Management 148
Data request to MDAS 29 June 2017
The Permanent Secretary Ministry of Health, Community Development, Gender, Elderly and Children Ministry of Agriculture, Livestock and Fisheries Ministry of Education, Science, Technology and Vocational Training Ministry of Industry, Trade and Investment Ministry of Water and Irrigation President’s Office – Regional Administration and Local Governments Prime Minister’s Office Ministry of Finance and Planning The Director, Tanzania Food and Nutrition Centre
Dear Sir,
Public Expenditure Review of Nutrition
This Ministry is collaborating with UNICEF and a team from Oxford Policy Management to carry out a Public Expenditure Review of Nutrition for years 2013/14, 2014/15 and 2015/16.
Nutrition activities (specific, sensitive and/or governance related) take place at central and LGA level in nutrition-relevant MDAs, which are:
1. Ministry of Health, Community Development, Gender, Elderly and Children 2. Ministry of Agriculture, Livestock and Fisheries 3. Ministry of Education, Science, Technology and Vocational Training 4. Ministry of Industry, Trade and Investment 5. Ministry of Water and Irrigation 6. Tanzania Food and Nutrition Centre 7. President’s Office – Regional Administration and Local Governments 8. Prime Minister’s Office 9. Ministry of Finance and Planning
Your Ministry is included in this list. For nutrition-relevant MDAs such as yours the team needs to identify activities related to nutrition, and to amounts budgeted and spent for each of those activities in years 2013/14, 2014/15 and 2015/16. It is difficult to specify exact activities in advance, but they will be based upon categories indicated in the National Multi Sector Nutrition Action Plan (NMNAP).
We would be grateful if you could provide:
1. an electronic version of your Medium-Term Expenditure Framework (MTEF) for the years 2013/14, 2014/15 and 2015/16
2. Detailed Chart of Accounts (“budget dictionaries”) for those years in a form that will enable us to link activities and targets defined in the SBAS MTEF to corresponding budgets and expenditures in the IFMS Epicor database.
3. An electronic version of the Annual Financial Statements of the Ministry for the years 2013/14, 2014/15 and 2015/16
We are aware of the many pressures on you at present, but would respectfully request that you provide this information soon, in order for our programme to go ahead according to plan. If we were able to receive the information by July 7th it would be very helpful.
Additional data may become necessary. If this proves to be the case we will advise you as soon as possible and submit a supplementary request. Do let us know if you need any clarification.
Yours etc.
Ministry of Finance and Planning

Nutrition Public Expenditure Review: Mainland Tanzania and Zanzibar
© Oxford Policy Management 149
Data request to PO-RALG 30 June 2017
To the Permanent Secretary
Dear Sir,
Public Expenditure Review of Nutrition
This Ministry is collaborating with UNICEF and a team from Oxford Policy Management to carry out a Public Expenditure Review of Nutrition for years 2013/14, 2014/15 and 2015/16.
The Tanzanian Food and Nutrition Centre estimate that 70% of nutrition-related spending is carried out at the LGA level, and accordingly the team seeks a comprehensive understanding of LGA budget processes and nutrition spending. For nutrition-relevant MDAs represented within LGAs, they seek to identify activities related to nutrition, and to identify amounts budgeted and spent for each of those activities in the years: 2013/14, 2014/15 and 2015/16. Activities are based upon the categories indicated in the National Multi Sector Nutrition Action Plan (NMNAP).
To enable the team to conduct this analysis, they request your support to provide for years 2013/14, 2014/15 and 2015/16, for all regions and LGAs, electronic versions of:
1. Complete MTEFs with full budget classification 2. Detailed Annual Financial Statements 3. Region and LGA budgets and budget execution data by vote, sub-vote, cost centre,
item and sub- item for the nutrition-relevant Ministries mentioned above. 4. Copies of the latest LGA planning and budgeting manuals (manual on how to
complete MTEFs on PlanRep, for example) and, 5. The database of Intergovernmental Transfers for each year showing transfers initially
budgeted, and amounts actually transferred by category of grant and by quarter
In addition, the team will be meeting with 8 LGAs during the fieldwork to gain a deeper understanding of nutrition related planning and budgeting processes. The regions and LGAs proposed are:
We therefore also request:
6. Authorisation letters for these regions and LGAs to release to us: their current five-year plan; any sector plans including the Comprehensive Council Health Plan; budgetary data; regional and/or LGA financial statements for the years 2013/14 2014/15 and 2015/16; and regional/LGA audit observations for those years.
Region Council
Morogoro Morogoro MC
Njombe Makete DC
Kagera Karagwe DC
Kilimanjaro Moshi MC
Dodoma Kongwa DC
Rukwa Sumbawanga DC
Kaskazini Pemba Michewani
Mjini Magharibi Magharibi A
Nutrition Public Expenditure Review: Mainland Tanzania and Zanzibar
© Oxford Policy Management 150
We are aware of the many pressures on your time, but would respectfully request that you provide this information soon, in order for the programme to go ahead according to plan. If we were able to receive the information by July 14th it would be very helpful.
Additional data may become necessary. If this proves to be the case we will advise you as soon as possible and submit a supplementary request. Do let us know if you need any clarification.
Yours etc. MoFP

Nutrition Public Expenditure Review: Mainland Tanzania and Zanzibar
© Oxford Policy Management 151
Data request to RGZ
27 June 2017
Permanent Secretary, Ministry of Finance and Planning
Revolutionary Government of Zanzibar
Dear Sir,
Public Expenditure Review of Nutrition
We take this opportunity to thank you for the support extended by the MoFP and other Line Ministries during the inception mission. As discussed during the inception mission, the team would require access to budget data and related documents in order to conduct the Public Expenditure Review. Your assistance in providing access to these data and documents is crucial for the program to go ahead. We’ve detailed the data and documents required in this letter. Please find details below:
Until FY 2016/17, nutrition activities (specific, sensitive and/or governance related) were budgeted and executed at the Central level. For the nutrition-relevant MDAs indicated at Annex 1 we seek to identify activities related to nutrition, and then to determine the amounts budgeted and spent for each of those activities in the years under review: 2013/14, 2014/15 and 2015/16.
We understand that the Ministry has changed from line item budgeting to Program based budgeting from the FY 2015/16 onwards.
1. In view of the above we request for the years 2013/14, 2014/15 and 2015/16: a. Aggregate/Overall approved budget estimate and actual execution figures for
the three years b. For the FY 2013/14 and 2014/15, a line item breakdown of budget allocation
(approved estimates) and outturns (actuals) for the above ministries in excel format
c. For the FY 2015/16, the IFMS database (allocated and executed amounts) for the nutrition relevant ministries indicated above with full budget classification
d. Detailed Chart of Accounts (“budget dictionaries/classifications”) for all relevant years providing clarification of the meaning and use of each segment of the current coding system (FY 2015/16 onwards) and previous coding system (FY 2013/14-14/15).
e. Annual Financial Statements f. MTEFs or its equivalent for the nutrition-relevant ministries indicated above
with full budget classification 2. We also request the Budget Guidelines or Call Circular issued by the MoFP for years
2013/14 to 2017/18 including all the appendices 3. Copies of the MTEF and IFMS planning and budgeting manuals for FY 2015/16-
2017/18 4. Approved budget allocation figures on transfers to regions and districts (Education,
Health and Agriculture sector) as a part of ‘Devolution by Decentralisation’ plan starting in FY 2017/18
We would be grateful for English versions of documents where available. It may be possible that as we review the documents you provide we discover that additional data is necessary. If this proves to be the case we will advise you as soon as possible and submit a supplementary request.

Nutrition Public Expenditure Review: Mainland Tanzania and Zanzibar
© Oxford Policy Management 152
We are aware of the many pressures on your team at present, but would respectfully request that you provide this information in good time, in order for our programme to go ahead according to plan. If we were able to receive the information by July 7, it would be very helpful.
Do let us know if you need any clarification. We would be happy to help. We look forward to developing this collaboration further.
Yours Sincerely.
UNICEF
Annex 1: Nutrition relevant MDAs
We refer to the following as nutrition relevant MDAs based on the Zanzibar Multi-sectoral National Nutrition Strategy (2014-18):
Ministry of Health
Ministry of Agriculture, Natural Resources, Livestock and Fisheries
Ministry of Education and Vocational Training (MoEVT),
President’s Office’s Regional Administration, Local Governance and Special Department (PORALGSD)
Ministry of state –Economic Empowerment, Social Welfare, Youth, Women and Children Development (MOSEESWYWCD),
Zanzibar Food and Drug Board (ZFDB)
Ministry of Lands, Water, Energy and Environment (MoLWEE)

Nutrition Public Expenditure Review: Mainland Tanzania and Zanzibar
© Oxford Policy Management 153
Annex D Rationale for the selection of chosen LGAs for fieldwork
A basic agreement was reached with the Government of Tanzania and UNICEF to focus on 8 districts for the PER, with 6 in mainland Tanzania and 2 in Zanzibar. Based on the outcomes of discussions with key stakeholders, including the Government of Tanzania, on what factors to take into account when choosing the districts, the following criteria were used:
1. Inclusion of a minimum of 3 districts from the previous PER (from Mainland Tanzania) 2. Inclusion of both urban and rural districts 3. The different geographical zones of the country (as many as possible) 4. The range of nutritional status/burden (stunting) across the different regions of the
country (TDHS 2015-16 and Bureau of Statistics population projections 2016) 5. The variations in donor funding for nutrition-related interventions across districts and
regions (based on the JMNR and known large donors working in regions)
For Zanzibar, particularly points 2 and 3 were the main considerations, with the two chosen districts representing the two main islands and one rural and one urban. However, in the districts chosen, the nutritional status/burden is also varied.
*Estimates based on Bureau of Statistics population projections for 2016 by region, available at: http://www.nbs.go.tz/nbstz/index.php/english/statistics-by-subject/population-and-housing-census/844-tanzania-total-population-by-district-regions-2016
Some amendments to the above selection were made during the course of implementation of the fieldwork. Specifically, Magharibi B was visited instead of Maghiribi A, and Moshi DC instead of Moshi MC.
Region District Category
Nutrition Status
(TDHS 2015-16)
Nutrition burden
(census projectns
2016 & TDHS)* Coverage
level of donor
nutrition
funding JMNR
Donors in
region PER 2014?
Morogoro Morogoro MC Urban 33.40% 353,487 Eastern zone Low USAID Yes
Njombe Makete DC Rural 49.40% 96,166 Southern Highlands Medium UNICEF Yes
Kagera Karagwe DC Rural 41.70% 502,351 Lake zone High DFID-starting No
Kilimanjaro Moshi MC Urban 29.00% 204,878 Northen zone Medium no big donor No
Dodoma Kongwa DC Rural 36.50% 359,537 Central zone Low USAID Yes
Rukwa Sumbawanga DC Rural 56.30% 222,109 South West Highlands Low no big donor No
Kaskazini Pemba Michewani Rural 34.10% 39,208 Zanzibar N/A not known No
Mjini Magharibi Magharibi A Urban 16.50% 100,143 Zanzibar N/A not known No

Nutrition Public Expenditure Review: Mainland Tanzania and Zanzibar
© Oxford Policy Management 154
Annex E Rationale for the LGAs in data collection sample The table below lists the mainland LGAs which were selected for data analysis purposes. Initially, LGAs were selected on the basis of i) data availability, ii) regional spread,
iii) stunting levels, and iv) a mix of rural and urban councils. In practice the process of selecting a sample was iterative. As issues around data availability and quality emerged
(including the percentage of expenditure codes in the expenditure files which could not be matched against a discernible equivalent in the planrep files), the team swapped
some sample LGAs for alternates.
LGA Region Rural/Urban Expenditure File availability PlanRep file availability First
PER? Fieldwork?
Stunting prevalence
Un-match rate
2014/15 2015/16 2014/15 2015/16 2014/15 2015/16
Chunya DC Mbeya Rural x x x x 37.7 15.3% 21.9%
Dodoma MC Dodoma Urban x x x x 36.5 21.4% 40.7%
Iringa MC Iringa Urban x x x x 41.6 9.6% 9.4%
Kilolo DC Iringa Rural x x x x 41.6 21.4% 27.3%
Kisarawe DC Pwani Rural x x x x 30 15.0% 17.6%
Kongwa DC Dodoma Rural x x x x x x 36.5 29.0% 43.8%
Kyela DC Mbeya Rural x x x x 37.7 0.6% 32.0%
Lushoto DC Tanga Rural x x x x 39.4 19.2% 34.5%
Makete DC Njombe Rural x x x x x x 49.4 11.9% 22.6%
Manyoni DC Singida Rural x x x x 29.2 21.0% 27.4%
Masasi DC Mtwara Rural x x x x 37.7 36.2% 36.9%
Mbeya City Council Mbeya Urban x x x x x 37.7 46.4% 14.5%
Morogoro DC Morogoro Rural x x x x 33.4 0.0% 0.0%
Morogoro MC Morogoro Urban x x x x x x 33.4 0.9% 27.2%
Moshi DC Kilimanjaro Rural x x x x x 29 24.9% 0.6%
Namtumbo DC Ruvuma Rural x x x x 44.4 37.2% 34.8%
Njombe Town Council Njombe Urban x x x x 49.4 28.7% 12.1%
Same DC Kilimanjaro Rural x x x x 29 18.9% 26.7%
Sikonge DC Tabora Rural x x x x 27.9 39.3% 41.5%
Songea MC Ruvuma Urban x x x x 44.4 4.6% 30.6%
Tabora MC Tabora Urban x x x x 27.9 39.7% 37.8%
Ulanga DC Morogoro Rural x x x x 33.4 13.1% 42.2%

Nutrition Public Expenditure Review: Mainland Tanzania and Zanzibar
© Oxford Policy Management 155
Annex F Budget Cycle mainland Tanzania
The formal budget process is divided into 4 broad phases as summarised below:
Summary of budget process in Tanzania
Source: UNICEF, 2012
Budget Formulation: the processes, roles and responsibilities for MDAs at all levels are set out in the Annual MOFP Guidelines for the Preparation of Plans and Budgets. Formulation begins with the overarching Medium Term Fiscal Framework, which provides estimates of revenues, borrowing, and recurrent and development expenditure for a three-year time frame, guided by detailed macroeconomic forecasts on future growth, inflation and import trends.
MOFP budget guidelines are then issued in November/December, and contain:
an overview of macroeconomic performance and projections
a summary of the medium-term expenditure framework and resource envelope
a summary of progress and performance against strategic planning frameworks
procedures and formats for the preparation and submission of the draft budget to MOFP
Additional priorities and other considerations to be made when preparing submissions.
Budget ceilings are issued at vote level shortly after (in January). Following this, Ministries, Departments and Agencies (MDAs), Regional Administrative Secretariats (RASs) and Local Government Authorities (LGAs) are required to prepare:

Nutrition Public Expenditure Review: Mainland Tanzania and Zanzibar
© Oxford Policy Management 156
domestic revenue collection estimates, indicating revenues collected in the current and previous year, as well as projections for the coming three years
Expenditure estimates for the coming three years, which include recurrent expenditures on Personnel Emoluments, Goods and Services, and Maintenance and Transfers; and capital expenditures on Infrastructure, Equipment, Studies, and Other Capital.
In February revenue and expenditure estimates are submitted to MOFP for scrutiny. Scrutiny criteria include adherence of budget policy objectives and estimates (MTEF) to Budget Guidelines; review of past year budget implementation; review of midyear performance for current financial year; revenue and expenditure performance, challenges encountered, and steps taken to address those challenges.
Agencies then enter the budget data into the government’s IT platform (SBAS). LGAs, follow the same budget guidelines but their MTEFs and revenue projections are required to be submitted to PO-RALG (formerly PMO-RALG) prior to submission to MOFP. MOFP consolidates the budget before submitting for approval.
Approval and enactment: MOFP submits the draft budget for approval in late February/ early March. There are multiple stages of scrutiny of budget proposals. First is the Inter-Ministerial Technical Committee (IMTC) – a committee comprising all Permanent Secretaries. To facilitate their deliberations, MOFP prepares a draft Cabinet Budget Paper that covers the budget frame, the financial demands after dialogue with MDAs, the government priorities and financial implications. IMTC may require the MOFP to make further technical improvements in the paper or put up recommendations for consideration by the Cabinet.
The Cabinet Budget Paper is then discussed by Cabinet who approve government budget proposals for the fiscal year before they are submitted to the legislature. The process of obtaining Parliamentary approval takes place from March to June. It starts with discussions within Sector Committees. Detailed budgets are then submitted to Parliamentary committees for scrutiny one by one. After the estimates, have been reviewed by the sector committees of the Parliament, they are tabled to parliament for debate and authorisation, usually in June.
Budget Execution/Implementation: revenue collections and service delivery take place throughout the fiscal year (July to June). The Tanzania Revenue Authority is charged with the assessment, collection and accounting of all central government revenue. MOFP has responsibility for the management and release of funds to MDAs and LGAs, and for the monitoring of budget performance. MOFP is required to publish quarterly Budget Execution Reports to maintain transparency on use of public funds in line with the budget estimates approved by Parliament (but these are often late).
Budget Oversight and Control: Budget oversight and controls focuses on the appropriateness of expenditure and revenue; accountability to the authorities through financial reports and providing information on performance. Key accountability and control mechanisms include internal and external audit. All MDAs have internal audit units, which are overseen by the Internal Auditor General.
Budget oversight is also supported by the IFMS, which can produce monthly flash reports on revenue collections and expenditure. However, the IFMS coding structure lacks an identifier for nutrition spending, so that automated nutrition expenditure tracking is not enabled (a function which the JMNR has attempted to perform). In addition, MDAs are required to prepare quarterly and annual performance reports detailing progress against predefined performance indicators for revenue, expenditure as well as establishment status.

Nutrition Public Expenditure Review: Mainland Tanzania and Zanzibar
© Oxford Policy Management 157
Annex G Nutrition identification and classification guidelines
This annex details the approach adopted for classification of budget lines. It starts by setting out how key terms were used to determine whether or not a budget line should be considered nutrition-related, and then sets out the various ways in whether nutrition-related lines were categorized and apportioned in the dataset.
G.1 Key terms
When determining whether a specific budget line was nutrition-related (Nutrition specific, sensitive or enabling environment), the team referred to the below list of key terms based on international definitions and key planning documents in Tanzania. The documents consulted to derive these key terms included: Tanzania National Multisectoral Nutrition Action Plan (NMNAP), the Compendium of Actions for Nutrition (CAN) – SUN UN Network / REACH, the SUN 3-Step Approach guidelines - Tracking Government Investments for Nutrition at Country Level, and the Budget Analysis for Nutrition: guidance note for countries (update 2017).
The specific key terms are categorized by identified categories/sectors of the NMNAP. They are a mix of key terms used in the NMNAP and generic key terms relevant under each category with regard to nutrition specific, nutrition sensitive and enabling environment activities.
These key terms are a guide to identify nutrition-related activities – pragmatic variations on the terms were still included, and not all budget lines including these terms were deemed nutrition-related. Nevertheless, the identification of key terms was used to bring some objectivity and consistency to the process.
The team also employed a principle of “one step removed” for nutrition sensitive activities. In this, we assume that expenditures directly associated with the nutrition sensitive activity identified would be counted (e.g. rearing livestock for domestic consumption) but associated support costs would not be (e.g. expenses associated with slaughter houses).
Nutrition Specific
Relevant government entities: MOHCDGEC, TFNC, PO-RALG, TFDA, MALF, MOEST, and local governments.
Maternal, Infant, Young Child and Adolescent Nutrition (MIYCAN)
Maternal, Infant, Young Child and Adolescent Nutrition (MIYCAN), Baby Friendly Hospital Initiative (BFHI), World Breastfeeding Week, maternity, Infant and Young Child Feeding (IYCF), lactating, breastfeeding, complementary feeding, exclusive breastfeeding, breastmilk substitutes, maternity protection, low birthweight care
Prevention and Management of Micronutrient Deficiencies
Micronutrients, micronutrient supplementation, micronutrient powder, (MNP), fortification, fortified, vitamin A, anaemia, iron folate, iron folic acid (IFA), calcium, iodine, zinc, iodised salt, Mebendazole, deworming

Nutrition Public Expenditure Review: Mainland Tanzania and Zanzibar
© Oxford Policy Management 158
Integrated Management of Acute Malnutrition (IMAM)
(Integrated) Management of Acute Malnutrition (IMAM), Severe Acute Malnutrition (SAM), Moderate Acute Malnutrition (MAM), acute malnutrition, therapeutic feeding, supplementary feeding, RUTF, F75, F100
Prevention and Management of Diet-Related Non-Communicable Diseases
Overweight, obesity, (diet related) non-communicable disease, diet, healthy lifestyle, healthy diet
Nutrition sensitive
Health Sector
Relevant government entities: MOHCDGEC, TFNC, and local governments.
Other nutrition
related in health
Family planning, reproductive health,
child immunization, EPI,
hygiene promotion,
HIV/AIDS supplementation (PLWHIV),
malaria prevention, insecticide treated bed nets (ITBN),
health training (nutrition components), nutrition cadre,
BRN – Big Results Now (health)
Budget lines relating to generic medical supplies were included, but apportioned, based on the assumption that this would likely include some nutrition-specific and nutrition-sensitive health commodities. They were duly categorised “unknown multiple” and “health specific and sensitive” (see Error! Reference source not found.).
In line with the “one step removed” principle (see above), budget lines relating to support services around these nutrition relevant health services were not included including the associated infrastructure costs (such as construction or renovation of clinics and dispensaries) apart from sanitation infrastructure (i.e. toilets and handwashing facilities).
Agriculture
Relevant government entities: MALF, TFNC, PO-RALG, TASAF, and local governments.
Diversity,
processing,
storage
(Nutritious) crops, pulses, legumes, nuts, fruit, vegetable (for domestic consumption)
production of livestock, fish, aquaculture, poultry, dairy, (for domestic consumption)
high nutrient, diversification, dietary diversity,
value added,
aflatoxin, food safety, food quality, food hygiene, food processing / storage,
fortification, community fortification, fortified complementary foods, bio-fortification (fortified),
school milk feeding,
food availability / security
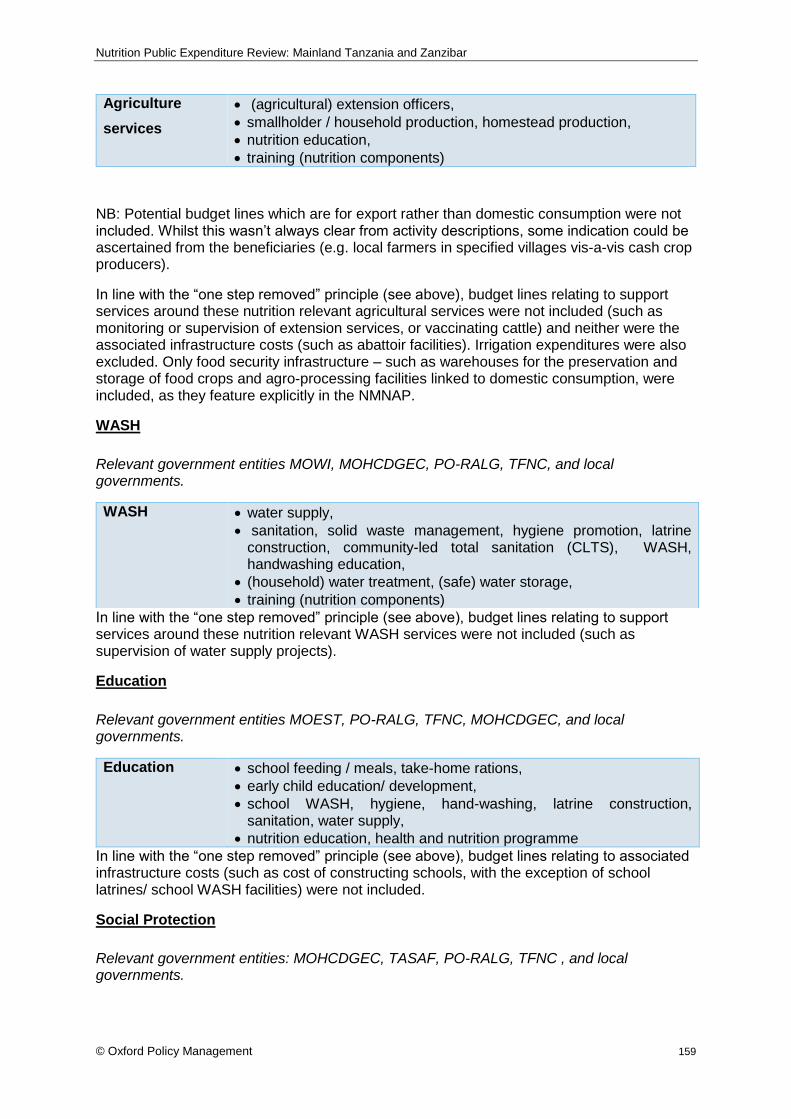
Nutrition Public Expenditure Review: Mainland Tanzania and Zanzibar
© Oxford Policy Management 159
Agriculture
services
(agricultural) extension officers,
smallholder / household production, homestead production,
nutrition education,
training (nutrition components)
NB: Potential budget lines which are for export rather than domestic consumption were not included. Whilst this wasn’t always clear from activity descriptions, some indication could be ascertained from the beneficiaries (e.g. local farmers in specified villages vis-a-vis cash crop producers).
In line with the “one step removed” principle (see above), budget lines relating to support services around these nutrition relevant agricultural services were not included (such as monitoring or supervision of extension services, or vaccinating cattle) and neither were the associated infrastructure costs (such as abattoir facilities). Irrigation expenditures were also excluded. Only food security infrastructure – such as warehouses for the preservation and storage of food crops and agro-processing facilities linked to domestic consumption, were included, as they feature explicitly in the NMNAP.
WASH
Relevant government entities MOWI, MOHCDGEC, PO-RALG, TFNC, and local governments.
In line with the “one step removed” principle (see above), budget lines relating to support services around these nutrition relevant WASH services were not included (such as supervision of water supply projects).
Education
Relevant government entities MOEST, PO-RALG, TFNC, MOHCDGEC, and local governments.
Education school feeding / meals, take-home rations,
early child education/ development,
school WASH, hygiene, hand-washing, latrine construction, sanitation, water supply,
nutrition education, health and nutrition programme
In line with the “one step removed” principle (see above), budget lines relating to associated infrastructure costs (such as cost of constructing schools, with the exception of school latrines/ school WASH facilities) were not included.
Social Protection
Relevant government entities: MOHCDGEC, TASAF, PO-RALG, TFNC , and local governments.
WASH water supply,
sanitation, solid waste management, hygiene promotion, latrine construction, community-led total sanitation (CLTS), WASH, handwashing education,
(household) water treatment, (safe) water storage,
training (nutrition components)

Nutrition Public Expenditure Review: Mainland Tanzania and Zanzibar
© Oxford Policy Management 160
Social
Protection
safety net, (conditional) cash transfer, TASAF
conditional vouchers (e.g. maternal health services, nutritional support),
in-kind food transfers,
maternity leave,
nutrition education,
end child marriage, reduce early pregnancies,
women economic empowerment
Environment and Climate Change
Relevant government entities: VPO, PMO, MALF, PO-RALG , and local governments.
Environment
and Climate
Change
Livelihood vulnerability, vulnerable communities, nutrition strategy, drought, shock, adaptation
Enabling Environment (M&E and Governance)
Relevant government entities: TFNC, PO-RALG, TDFA, PMO, “Key Ministries” (MOHCDGEC, MALF, MOEST), and local governments.
Nutrition
surveillance,
surveys and
information
management
operational research, nutrition research,
vulnerability assessment, rapid nutrition assessment, nutrition information system (NIS), Nutrition survey, nutrition indicators, growth monitoring and promotion (GMP), anthropometric, bottleneck analysis, multisectoral nutrition scorecard,
food security and analysis system (MUCHALI),
Joint Multisectoral Nutrition Review (JMNR)
national guidelines (food security, surveys, WASH, agriculture, social protection etc.)
Because HMIS collect some nutrition-related indicators (specific and sensitive-health) related expenditure lines were (partially) included.
Nutrition
governance
(Plans, policies,
coordination,
capacity)
Nutrition policy / plan / law / legislation / regulation / guideline / strategy, nutrition sectoral strategies,
Nutrition financial tracking, nutrition budget guideline,
nutrition capacity development / building,
nutrition officer / focal person,
nutrition pre-service curricula, nutrition in-service training,
multisectoral coordination, coordination mechanism / platform, nutrition steering committee,
MP nutrition champion group, mapping stakeholders
Budget lines related to Council health plans were included (partially), as fieldwork indicated that most plans included nutrition relevant

Nutrition Public Expenditure Review: Mainland Tanzania and Zanzibar
© Oxford Policy Management 161
interventions. Similarly, district expenditures for health coordination were included (partially). General planning (including council development plans) and coordination budget lines were not included.

Nutrition Public Expenditure Review: Mainland Tanzania and Zanzibar
© Oxford Policy Management 162
G.2 Classification
The table below details how the nutrition tagging section of the expenditure database was completed, and in doing so describes the various ways in which nutrition-related budget lines were categorised.
Database Field Purpose Standardisation considerations
Nutrition related? For identifying whether the
specific budget line includes
nutrition-related
expenditures
4 options were developed:
- Yes, for budget lines that relate to one or more of the key term categories (see
above). Allocations and expenditures related to these category are identified
as fully nutrition related in the dataset
- Maybe, for budget lines which were possibly nutrition related, but it was not
possible to conclude either way, based on the objective / target / activity
description, interview notes and document review. These budget lines have
been excluded from the nutrition-related dataset, but presented in the annex
of this report, pending further confirmation from GOT.
- Partially, for budget lines which contain some component of nutrition-related
expenditure, as delineated by the key term categories, but are broader than
just nutrition-related activities. In this case, apportionment was generally
considered necessary, in an effort to separate out the nutrition-related portion
of expenditure. A portion of these budget lines is identified as nutrition-related
in the dataset, but weighted by the apportionment value (see below).
- No, for budget lines which had no relation to nutrition, as delineated by the key
term categories
Comment To provide further
justifications for the nutrition
related category selected.
Not applicable.
Subvote name and activity
description
To provide a further
descriptor of the nutrition
budget line.
Not applicable.
Level 1 categorisation For lines which have been
identified as “yes” or
4 options were established:
- n_specific for nutrition-specific interventions

Nutrition Public Expenditure Review: Mainland Tanzania and Zanzibar
© Oxford Policy Management 163
“maybe” against the
nutrition-related field, this
field specifies whether it is
nutrition-sensitive, nutrition
specific, or enabling
environment.
- n_sensitive for nutrition-sensitive interventions
- unknown_multiple where the budget line was deemed to include both
nutrition specific and nutrition sensitive interventions but where no one
category was thought to dominate. In practice, this category was reserved for
nutrition-related LG salaries and medical supplies.
- enabling_environment for interventions relating to the enabling environment
for nutrition
Level 2 categorisation For lines which have been
identified as “yes” or
“maybe” against the
nutrition-related field, this
field specifies which
subcategory under nutrition-
sensitive/nutrition-specific/
enabling environment, the
activity falls under
Conditional lists were set up, reflecting the subcategories set out in the key terms
list, namely: Nutrition specific:
- Maternal, Infant, Young Child and Adolescent Nutrition (MIYCAN)
- Prevention and Management of Micronutrient Deficiencies
- Integrated Management of Acute Malnutrition (IMAM)
- Prevention and Management of Diet-Related Non-Communicable
Diseases
- unknown / multiple
Nutrition Sensitive
- Health
- Agriculture
- Wash
- Education
- Social Protection
- Environment and climate change
Enabling environment
- Nutrition surveillance, surveys and information management
- Nutrition governance (Plans, policies, coordination, capacity)
Cross-cutting:
Social and behaviour change communication

Nutrition Public Expenditure Review: Mainland Tanzania and Zanzibar
© Oxford Policy Management 164
L1 and L2 Categorisation of salaries:
Salaries were identified within the dataset as lines with the corresponding GFS code
of “civil servants”
Because most salary lines are not associated with a particular objective / target or
activity within vote, disentangling those salaries paid to staff who undertook nutrition
related work, from the wider salary bill of the entity, was not possible.
For categorisation purposes, salary lines (duly apportioned, see below) were
categorised according to the nature of the majority of nutrition activities that the
entity in question carried out. Specifically:
Ministry of agriculture salaries - nutrition sensitive / agriculture.
Ministry of water salaries - nutrition sensitive / WASH.
Ministry of health salaries - nutrition sensitive / health (as this dominated over
nutrition -specific activities).
PMO – enabling environment / coordination
In the case of LGAs, whose mandates cover the full array of nutrition specific,
sensitive and enabling environment activities, salaries were classified as “unknown
multiple” under L1, and not classified under L2.
It is acknowledged that this is a relatively blunt means of classifying salary data,
which could potentially skew the distribution of nutrition expenditures. For this
reason, the analyses were conducted with and without salaries included, to
understand how these impacted on the results observed.
Apportionment This provides the basis by
which budget lines are to be
apportioned, should they be
broader than just the
nutrition-related expenditure
(i.e. those lines for which
“partially” was selected
For non-salary recurrent and development expenditure, wherever possible,
an objective basis was sought to determine an apportionment percentage
between 0-100%, including interview notes and policy documents. The basis for
this estimate is noted against each relevant budget line in the database.
Where an objective basis for arriving at this apportionment value could not be
identified, (see detailed discussion under limitations), a default value of 10% was
applied. This is a conservative estimate, and is open to revision upon the
identification of better evidence.
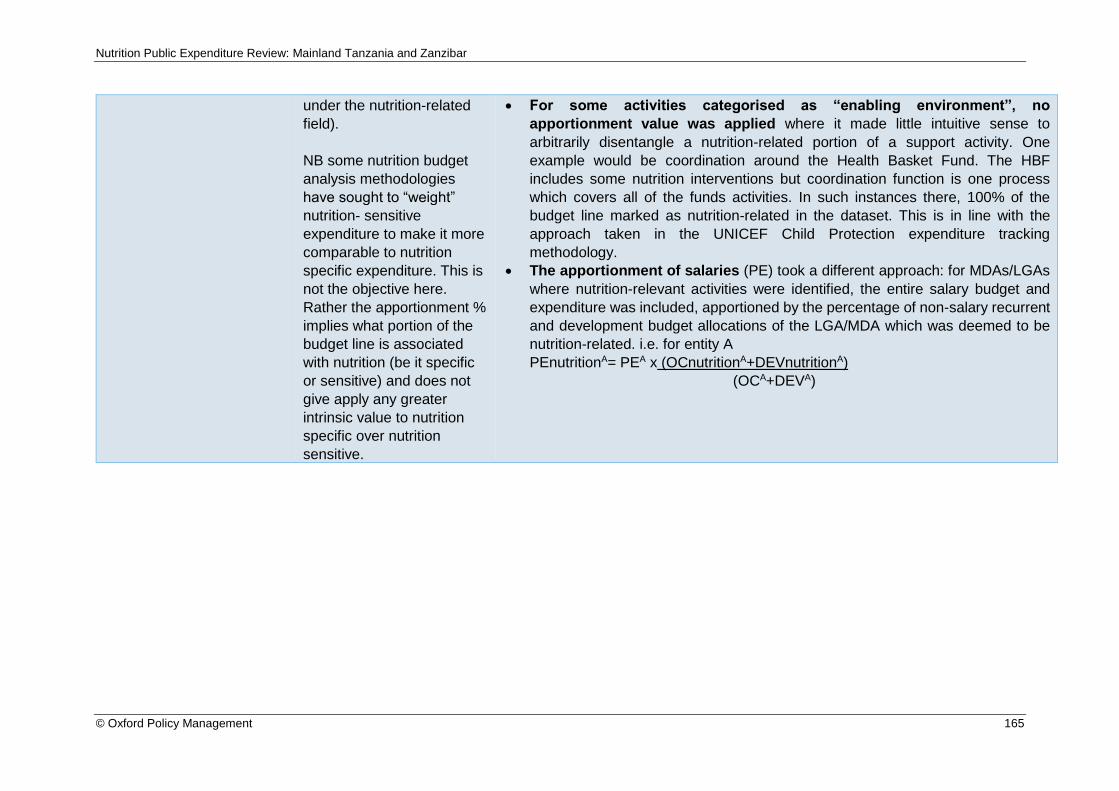
Nutrition Public Expenditure Review: Mainland Tanzania and Zanzibar
© Oxford Policy Management 165
under the nutrition-related
field).
NB some nutrition budget
analysis methodologies
have sought to “weight”
nutrition- sensitive
expenditure to make it more
comparable to nutrition
specific expenditure. This is
not the objective here.
Rather the apportionment %
implies what portion of the
budget line is associated
with nutrition (be it specific
or sensitive) and does not
give apply any greater
intrinsic value to nutrition
specific over nutrition
sensitive.
For some activities categorised as “enabling environment”, no
apportionment value was applied where it made little intuitive sense to
arbitrarily disentangle a nutrition-related portion of a support activity. One
example would be coordination around the Health Basket Fund. The HBF
includes some nutrition interventions but coordination function is one process
which covers all of the funds activities. In such instances there, 100% of the
budget line marked as nutrition-related in the dataset. This is in line with the
approach taken in the UNICEF Child Protection expenditure tracking
methodology.
The apportionment of salaries (PE) took a different approach: for MDAs/LGAs
where nutrition-relevant activities were identified, the entire salary budget and
expenditure was included, apportioned by the percentage of non-salary recurrent
and development budget allocations of the LGA/MDA which was deemed to be
nutrition-related. i.e. for entity A
PEnutritionA= PEA x (OCnutritionA+DEVnutritionA)
(OCA+DEVA)

Nutrition Public Expenditure Review: Mainland Tanzania and Zanzibar
© Oxford Policy Management 166
Annex H Plan of Action
The below Plan of Action was developed during PER validation workshops by members of
the PER steering committees. Derived from the report recommendations, it sets out target
outcomes and related activities, assigning responsible entities and planned timing.
H.1 Mainland Tanzania Plan of Action
Recommendation: DRAFT
Proposed Actions: DRAFT Timing Responsible Entities
1. Adequacy of budgets for nutrition improved
i) Implement the PFM Action Plan MOFP
ii) Mobilize additional revenues to reach at least regional averages and allocate a part to nutrition interventions
MOFP
iii) Support the process with relevant analyses of fiscal space availability and sectoral needs
Development Partners & UNICEF
2. Budget planning and implementation for nutrition improved.
i) Implement the recommendations and programmes of the PFM Action Plan to ensure realistic budgeting and a new approach to cash rationing
MOFP, PORALG
ii) Engage with the PFM Action Plan process fully, ensure that the sectoral and sub-national viewpoints are taken into account, and support agreed initiatives
MDAs and LGAs
iii) Ensure nutrition budgets are discussed in the HLSCN
HLSCN
3. Equity in nutrition (and in LGAs) improved
i) Ensure any revision to the PFM Action Plan address LGA equity issues
MOFP, PO-RALG
ii) Correct the high levels of fiscal inequities between LGAs
MOFP
iii) Consider a supplementary health/nutrition grant for those LGAs with high numbers of children or adults suffering from malnutrition, which also takes into account poverty rate, distance to school/health facilities, number of schools/health facilities.
MOFP, PO-RALG
4. Nutrition expenditures are incentivised
i) Ensure accountability for mandatory nutrition specific expenditures through a PO-RALG review or NAO audit
PO-RALG, NAO
ii) Consider whether national level nutrition allocations to be awarded protected status.
MOFP
iii) Consider a matching grant to encourage key nutrition expenditures from own source funds.
MOFP
iv) MOFP to incorporate nutrition issues in budget guideline)
MOFP

Nutrition Public Expenditure Review: Mainland Tanzania and Zanzibar
© Oxford Policy Management 167
Recommendation: DRAFT
Proposed Actions: DRAFT Timing Responsible Entities
5. The nutrition enabling environment at LGA level is strengthened
i) Regional and local governments to adhere to PORALG directive on meetings of the nutrition steering committees and to add these to the district / region calendar.
PO-RALG, RAS, LGAs
ii) Conduct capacity building on management, planning, data analysis, interpretation and budget issues to the DNuOs.
Development partners, LGAs
iii) Review the of the guideline of RHMT and CHMT to ensure nutrition offices are full members.
PO-RALG, LGAs
iv) Sensitization of key personnel (decision makers from national level to the community level) on nutrition imperatives and NMNAP
TFNC, Development Partners
6. The community level is more sensitised to nutrition issues.
i) Improve knowledge; change social norms and behaviour that affect nutrition. The Local Government should find ways to reach different groups of people. This should be through (1)school sessions (Improve syllabus to include nutrition knowledge and improvement of school feeding programmes), (2) Involvement of Community Health Workers, (3) Involvement of Health Worker providers and (4) The use of media (mobile phones SMS, community radio and television).
PO RALG, LGAs, UNICEF, Development Partners
7. Monitoring of nutrition spending improved
i) Ensure that where possible, donor-financed programmes to support nutrition at the subnational level include a governance component to support financial management initiatives
Development Partners
ii) Monitor and maximise the use of the nutrition Cost Centre tied with service outputs
PO-RALG
iii) Support PFM Action Plan Strategic Objective 3 for the budget to be executed as planned with timely and accurate reporting.
MOFP
iv) Strengthen the budget monitoring capacity of TFNC and agree their role in monitoring the recommendations of this PER as per the mandated roles of each MDA.
TFNC, MOFP, PORALG
v) Re-emphasise role of HLSCN in nutrition budget monitoring.
HLSCN
vi) Plan for a new nutrition PER in 2020 to cover 2016/17; 2017/18 and 2018/19; making use of recent improvements in the reporting system which has been put and in place by PORALG.
HLSCN, Development Partners, PORALG.

Nutrition Public Expenditure Review: Mainland Tanzania and Zanzibar
© Oxford Policy Management 168
Recommendation: DRAFT
Proposed Actions: DRAFT Timing Responsible Entities
8. National Resource mobilization Thematic working
group develop
new funding modalities for nutrition.
i) Explore possibilities for devising a cross-sectoral financing mechanism for nutrition as it is for Health Basket Fund. This could be in the form of a converged budget programme for nutrition, under which multiple agencies can bid for funds; or budget programmes can remain under the purview of MoFP with a degree of ringfencing for nutrition related programmes.
2019/20
9. Malnutrition treatment data is routinely collected
and collated, covering acute
malnutrition, chronic malnutrition and non- communicable diseases.
i) RNuOs and DNuOs to be provided with the necessary guidance (from MOHSW and/or TFNC) and resources to collect and collate treatment data so that technical efficiency of LGAs can be assessed. This should be standard disaggregated information across local governments in the country. The information should be in line with the NMNAP and the national data information system.
HLSCN, MoHSW and TFNC
ii) The Government should strengthen the data collection and use.
GOT
10. Development partners adhere to PORALG guidelines on timely reporting of ODA to local
i) Development partners should meet the PO-RALG directive concerning the timely reporting on ODA allocations and expenditures to local governments.
Development Partners
ii) PORALG to compile these reports and make them available for other analyses as required (including future PERs).
PORALG
H.2 Zanzibar Plan of Action
Outcome Actions Timing Responsible Entity
11. The overarching Nutrition Strategic Plan and coordination architecture is refreshed, to give strategic direction to nutrition interventions and strengthen accountability for results
i) Refresh the ZNNSP. At the very least, this should include a more detailed costed action plan for each sector with a detailed evaluation framework for how each sector would monitor implementation and progress.
July, 2018 – December, 2018
RGZ (MOH-RGZ) and Development Partners
ii) Following policy development, establish and convene an appropriate coordination structure whose responsibilities would include: i) overseeing implementation of the nutrition policy, ii) monitoring the flow of funds to priority programmes, iii) strengthening cross-sectoral
July, 2018 – December, 2018
MOH-RGZ MOEVT-RGZ LGAs PORALGSD

Nutrition Public Expenditure Review: Mainland Tanzania and Zanzibar
© Oxford Policy Management 169
Outcome Actions Timing Responsible Entity
collaboration on nutrition interventions including ensuring the nutrition-sensitive interventions are maximising nutrition outcomes, and iv) to improve the monitoring of nutrition-related results on priority interventions.
iii) Devise a cross-sectoral financing mechanism for nutrition in the form of a converged budget programme for nutrition (especially at the LGA level), under which multiple agencies can bid for funds.
2019/2020 LGAs
12. The shortfall of nutrition-specific spending is addressed
i) Undertake a fiscal space analysis to identify where budgetary room for nutrition-specific programmes may be increased. This should cover all potential sectors.
RGZ
ii) MOFP-RGZ and PORALGSD to prepare directives for the decentralized sectors (health, education and agriculture) regarding minimum budget allocations for nutrition, drawing on the experience of the mainland.
MOFP-RGZ PORALGSD
13. Nutrition priorities are integrated into budget preparation processes
i) MOFP-RGZ to consult around including nutrition as a strategic priority in 2019/2020 budget guidelines. Supporting guidance will be drawn from the revised nutrition policy.
MOFP-RGZ, TFNC
ii) Subsequent to this, MOFP-RGZ should be given training on how to identify nutrition-relevant activities during budget scrutiny processes, by TFNC and/or UNICEF.
MOFP-RGZ, TFNC, UNICEF
iii) Train Principal Secretaries and Directors of Policy, Planning and Research on nutrition issues during budget preparations.
MOFP-RGZ, MDAs
iv) Integrate budget discussion preparation on nutrition issues in budget dialogue.
MOFP-RGZ
14. The District Health Basket Fund planning guidelines include a stronger directive on nutrition spending.
i) Basket Fund stakeholders should consult and consider revising the guidelines to include a stronger directive on nutrition spending.
MOH-RGZ, Basket Fund Contributors
ii) Reallocation of unused funds towards nutrition activities should be encouraged when required.
Basket Fund management teams
15. Budget execution performance is improved
i) Future PFM diagnostic studies to be given a mandate to focus on budget execution challenges. Subsequent recommendations to be implemented by RGZ, and the impact on nutrition expenditure
MOFP-RGZ and partners

Nutrition Public Expenditure Review: Mainland Tanzania and Zanzibar
© Oxford Policy Management 170
Outcome Actions Timing Responsible Entity
monitored through the nutrition coordination architecture.
ii) Harmonise budget executions procedures into budget act
2019/2020 MOFP-RGZ
16. Nutrition capacity within RGZ is strengthened and expanded (beyond MOH-RGZ) including at the local level.
i) Assign a nutrition focal person in all relevant ministries (including MOEVT-RGZ). The role of these persons would be to advise on the design and implementation of nutrition-sensitive programmes under their purview and to facilitate cross ministerial coordination. Ideally they should combine nutrition and sector specific expertise.
MDAs
ii) Uses /formulate the established Shehia Health Custodian Committee for implementing nutrition activities at the shehia level.
MOH-RGZ, District Governments
17. The timeliness and comprehensiveness of expenditure reporting is improved.
i) MDAs should improve the timeliness of reporting in order to facilitate more timely and complete transfers from MOFP-RGZ
MDAs
ii) MOFP-RGZ (through the Accountant General’s office) should seek to enforce timely reporting by MDAs through the IFMS system. Reporting expenditures against on-budget aid commitments should also adhere to these timeframes.
MOFP-RGZ, MDAs, Donors
iii) Revise Basket to report expenditures against specific activities.
Health Basket Fund oversight entity