nutrition of florida citrus trees - edis - electronic data...
TRANSCRIPT

Nutrition of Florida Citrus Trees
Second EditionEdited by Thomas A. Obreza
and Kelly T. Morgan
SL 253

1

1
SL 253
The Institute of Food and Agricultural Sciences (IFAS) is an Equal Opportunity Institution authorized to provide research, educational information and other services only to individuals and institutions that function with non-discrimination with respect to race, creed, color, religion, age, disability, sex, sexual orientation, marital status, national origin, political opinions or affiliations. For more information on obtaining other UF/IFAS Extension publications, contact your county’s UF/IFAS Extension office.
U.S. Department of Agriculture, UF/IFAS Extension Service, University of Florida, IFAS, Florida A & M University Cooperative Extension Program, and Boards of County Commissioners Cooperating. Nick T. Place, dean for UF/IFAS Extension.
Nutrition of Florida Citrus Trees 2nd Edition1
Thomas A. Obreza and Kelly T. Morgan2, Editors
1. This document is SL 253, a publication of the Department of Soil and Water Sciences, UF/IFAS Extension. Original publication date: January 2008. Reviewed June 2017. The first edition of this document was SP 169, Nutrition of Florida Citrus Trees. Visit the EDIS website at http://edis.ifas.ufl.edu.
2. Thomas A. Obreza, professor; and Kelly T. Morgan, assistant professor; Department of Soil and Water Sciences, UF/IFAS Southwest Florida Research and Education Center, Immokalee, FL 34142.

2 3
SL 253 Nutrition of Florida Citrus Trees, 2nd Edition. Edited by Thomas A. Obreza and Kelly T. Morgan. This publication replaces UF-IFAS SP 169.
COOPERATIVE EXTENSION SERVICE, UNIVERSITY OF FLORIDA, INSTITUTE OF FOOD AND AGRI-CULTURAL SCIENCES, Larry R. Arrington, Director, in cooperation with the United States Department of Agriculture, publishes this information to further the purpose of the May 8 and June 30, 1914 Acts of Congress; and is authorized to pro-vide research, educational information, and other services only to individuals and institutions that function with non-discrim-ination with respect to race, creed, color, religion, age, disability, sex, sexual orientation, marital status, national origin, political opinions, or affiliations. This information was published January 2008 as SL 253, Florida Cooperative Extension Service.
DedicationThe first edition of this publication was dedicated to emeritus citrus research scientists Drs. Robert C. J. Koo, Ivan Stew-art, and Herman Reitz, Univ. of Florida, Citrus Research and Education Center (CREC), Lake Alfred and Paul Smith, USDA-Agricultural Research Service (ARS), Orlando. Their research contributions laid the foundation for citrus nutrition programs in Florida. The editors of the second edition dedicate it to an additional group of emeritus citrus re-search scientists, extension specialists, and educators: Drs. David P. H. Tucker, Larry K. Jackson, and T. Adair Wheaton, CREC-Lake Alfred; Dr. David V. Calvert, Indian River Research and Education Center, Ft. Pierce; and Dr. Heinz Wutscher, USDA-ARS, Orlando. Their many years of devoted service furthered our knowledge of nutrient management as the Florida citrus industry entered the era of Best Management Practices.
Contributing AuthorsL. Gene Albrigo University of Florida, Citrus Research and Education CenterBrian J. Boman University of Florida, Indian River Research and Education CenterMary E. Collins University of Florida, Soil and Water Science DepartmentJames J. Ferguson University of Florida, Horticultural Sciences DepartmentStephen H. Futch University of Florida, Multi-County Citrus ExtensionEdward A. Hanlon University of Florida, Southwest Florida Research and Education CenterKelly T. Morgan University of Florida, Southwest Florida Research and Education CenterThomas A. Obreza University of Florida, Soil and Water Science DepartmentLawrence R. Parsons University of Florida, Citrus Research and Education CenterArnold W. Schumann University of Florida, Citrus Research and Education CenterMongi Zekri University of Florida, Multi-County Citrus Extension
With Additional Contributions ByAshok K. Alva US Department of Agriculture – Agricultural Research ServiceDavid V. Calvert University of Florida, Indian River Research and Education Center (retired)Frederick S. Davies University of Florida, Horticultural Sciences DepartmentLarry K. Jackson University of Florida, Horticultural Sciences Department (retired)David P. H. Tucker University of Florida, Citrus Research and Education Center (retired)T. Adair Wheaton University of Florida, Citrus Research and Education Center (retired)Heinz Wutscher US Department of Agriculture – Agricultural Research Service (retired)
AcknowledgementsThe editors gratefully acknowledge the reviewers of this publication (Mark Colbert, Fred Davies, Hugh English, John Jackson, Chris Oswalt, Mark Ritenour, Steve Smith, Jerry Southwell, Jack Zorn, and all contributing authors) for their time, effort, and suggestions for improvement.Funding provided by the Florida Department of Agriculture and Consumer Services to print this document is also gratefully acknowledged.Front and rear cover photos by Thomas S. Wright.

2 3
1. Introduction – Thomas A. Obreza and Kelly T. Morgan ................................................................................................................................................................ 71.1. Preface ...................................................................................................................................................................................................................................................................................... 71.2. Nutrition of Florida citrus trees – A historical perspective .......................................................................................................................................... 71.3. Florida enters the BMP era ............................................................................................................................................................................................................................... 8
2. Production Areas, Soils, and Land Preparation – Thomas A. Obreza and Mary E. Collins ............................................................... 92.1. General information ................................................................................................................................................................................................................................................. 92.2. Characteristics of soil orders important to Florida citrus production .............................................................................................................. 92.3. Soil series typically found in citrus groves ........................................................................................................................................................................................ 92.4. Soil physical and chemical properties important to citrus nutrient management ............................................................................112.5. Vulnerable soils ...........................................................................................................................................................................................................................................................122.6. Grove site selection and land preparation .....................................................................................................................................................................................122.7. Effects of leveling and bedding on soil fertility in flatwoods citrus groves ...............................................................................................142.8. Soil pH and liming ..................................................................................................................................................................................................................................................142.9. Organic matter ............................................................................................................................................................................................................................................................15
3. General Soil Fertility and Citrus Tree Nutrition – Thomas A. Obreza, Mongi Zekri, and Stephen H. Futch ...............163.1. Essential nutrients ....................................................................................................................................................................................................................................................163.2. Macronutrients and citrus production ..............................................................................................................................................................................................163.3. Micronutrients and citrus production ..............................................................................................................................................................................................173.4. Supplying nutrients to citrus trees .........................................................................................................................................................................................................183.5. Nutrient behavior in Florida soils ...........................................................................................................................................................................................................183.6. Citrus nutrient requirements ......................................................................................................................................................................................................................203.7. Nutrition, irrigation, and fruit quality ..............................................................................................................................................................................................213.8. Grove management practices ......................................................................................................................................................................................................................223.9. Interactions of nutrition with other grove practices ..........................................................................................................................................................22
4. Soil and Leaf Tissue Testing – Thomas A. Obreza, Mongi Zekri, and Edward A. Hanlon ..................................................................244.1. Introduction ...................................................................................................................................................................................................................................................................244.2. Benefits of leaf analysis .......................................................................................................................................................................................................................................244.3. Steps in leaf sampling ...........................................................................................................................................................................................................................................254.4. Benefits of soil analysis ........................................................................................................................................................................................................................................264.5. Steps in soil sampling ............................................................................................................................................................................................................................................284.6. Traditional vs. alternative sampling strategies ...........................................................................................................................................................................304.7. Summary ............................................................................................................................................................................................................................................................................324.8. Soil and leaf tissue analysis checklist ...................................................................................................................................................................................................32
5. Precision Agriculture for Citrus Nutrient Management – Arnold W. Schumann and Edward A. Hanlon ....................335.1. Common elements of precision agriculture ................................................................................................................................................................................335.2. Objectives of precision agriculture for nutrient management ................................................................................................................................335.3. Remote sensing ...........................................................................................................................................................................................................................................................33
5.3.1. Field measurements of soil electrical conductivity .............................................................................................................................................335.3.2. Ultrasonic canopy measurements ..........................................................................................................................................................................................345.3.3. Citrus yield mapping ...........................................................................................................................................................................................................................35
5.4. Precision nutrient application – Variable rate fertilization ........................................................................................................................................355.5. Summary ............................................................................................................................................................................................................................................................................37
Table of Contents

4 5
6. Fertilizer Sources and Formulations – Thomas A. Obreza and Brian J. Boman .............................................................................................386.1. Introduction ...................................................................................................................................................................................................................................................................386.2. Solid sources for soil application .............................................................................................................................................................................................................386.3. Solid N fertilizer sources and ammonia volatilization .....................................................................................................................................................396.4. Solution sources – Fertigation ...................................................................................................................................................................................................................396.5. Solution fertilizer salt-out ...............................................................................................................................................................................................................................406.6. Solution sources – Foliar sprays ................................................................................................................................................................................................................406.7. Suspension sources ..................................................................................................................................................................................................................................................416.8. Slow-release sources ...............................................................................................................................................................................................................................................416.9. Controlled-release sources ..............................................................................................................................................................................................................................416.10. Formulating fertilizer products .................................................................................................................................................................................................................426.11. Nutrient sources for organic citrus production .......................................................................................................................................................................42
7. Methods of Fertilizer Application – Thomas A. Obreza, Brian J. Boman, Mongi Zekri, and Stephen H. Futch .........437.1. Applying dry fertilizers .......................................................................................................................................................................................................................................437.2. Fertigation ........................................................................................................................................................................................................................................................................437.3. Applying suspension fertilizers ..................................................................................................................................................................................................................467.4. Applying foliar fertilizers .................................................................................................................................................................................................................................46
8. Recommended Fertilizer Rates and Timing – Thomas A. Obreza, Kelly T. Morgan, L. Gene Albrigo, and Brian J. Boman ............................................................................................................488.1. Fertilizer rates, application frequency, and timing for non-bearing trees (first 3 years in the grove) ...........................48
8.1.1. Solid plantings ............................................................................................................................................................................................................................................488.1.2. Resets in established groves ..........................................................................................................................................................................................................508.1.3. Example fertilizer program for non-bearing trees ................................................................................................................................................50
8.2. Fertilizer rates for bearing trees (4+ years in grove) ...........................................................................................................................................................508.3. Timing and frequency of fertilizer application for bearing trees .........................................................................................................................568.4. Slow-release and controlled-release fertilizers ...........................................................................................................................................................................568.5. Foliar application of N, P, and K .............................................................................................................................................................................................................57
9. Irrigation Management to Improve Nutrient Uptake – Kelly T. Morgan and Thomas A. Obreza ............................................609.1. Water supply ...................................................................................................................................................................................................................................................................609.2. Production region characteristics important to irrigation management .....................................................................................................609.3. Nutrient uptake efficiency ..............................................................................................................................................................................................................................609.4. Allowable soil water depletion ...................................................................................................................................................................................................................609.5. Irrigation scheduling .............................................................................................................................................................................................................................................60
9.5.1. Soil moisture measurement ..........................................................................................................................................................................................................609.5.2. Water budgeting .......................................................................................................................................................................................................................................61
9.6. Irrigation strategies to improve nutrient uptake and reduce leaching ............................................................................................................61
10. Environmental Issues and Best Management Practices (BMPs) – Brian J. Boman, Thomas A. Obreza, and Kelly T. Morgan ..........................................................................................................................................................6410.1. Environmental nutrient issues related to Florida citrus production ................................................................................................................6410.2. The BMP era ..................................................................................................................................................................................................................................................................6410.3. General nutrient BMPs for citrus production ..........................................................................................................................................................................65
4 5
11. Special Situations – Thomas A. Obreza, Brian J. Boman, Mongi Zekri, Stephen H. Futch, Lawrence R. Parsons, and James J. Ferguson ..........................................................................................................6711.1. Scions and rootstocks ..........................................................................................................................................................................................................................................6711.2. Rootstock/nutrition interaction .............................................................................................................................................................................................................6711.3. Soils high in copper ................................................................................................................................................................................................................................................6711.4. Calcareous soils ...........................................................................................................................................................................................................................................................6811.5. Saline soils and water ............................................................................................................................................................................................................................................6911.6. Using reclaimed water for irrigation ....................................................................................................................................................................................................7011.7. Fertilization strategies for damaged trees .......................................................................................................................................................................................71
11.7.1. Wind damage .........................................................................................................................................................................................................................................7111.7.2. Freeze damage ........................................................................................................................................................................................................................................72
11.8. Nutritional deficiencies enhanced by environmental or pathological factors .......................................................................................7211.9. Organic citrus production ..............................................................................................................................................................................................................................72
11.9.1. General information .......................................................................................................................................................................................................................7211.9.2. Soil fertility and crop nutrient management guidelines ..........................................................................................................................73
12. References and Further Reading ..........................................................................................................................................................................................................................7412.1. Refereed journal articles ....................................................................................................................................................................................................................................7412.2. Non-refereed journal articles .......................................................................................................................................................................................................................7512.3. Extension publications, articles, and books .................................................................................................................................................................................7512.4. Historical documents ...........................................................................................................................................................................................................................................75
13. Glossary .............................................................................................................................................................................................................................................................................................76
14. Appendices ....................................................................................................................................................................................................................................................................................79A. Physical and chemical properties of typical Florida citrus soils ...................................................................................................................................81B. Nutrient concentrations of fertilizer materials ...............................................................................................................................................................................82C. Salt index of fertilizer materials .......................................................................................................................................................................................................................84D. Solubility of fertilizer sources and common fertilizer solutions .................................................................................................................................85E. Fertilizer mixture formulation example .................................................................................................................................................................................................87F. Example determination of the fertilizer requirement for bearing citrus trees .............................................................................................88G. Key to citrus nutrient deficiency symptoms ......................................................................................................................................................................................89
15. Color plates ...................................................................................................................................................................................................................................................................................90

6 7

6 7
1.1. Preface
“Nutrition of Florida Citrus Trees, 2nd Edition” is an update of Univ. of Florida-IFAS Bulletin SP169, which provided guidelines for Florida citrus fertilization since 1995. The objective of the original edition was to provide background information and recommendations to develop a sound citrus nutrition program that optimizes financial returns while sustaining yields and maintaining soil and water quality. The second edition maintains that objective as it incorporates the findings of numerous citrus nutrition research projects conducted since the mid-1990s.
Updated guidelines presented herein reflect changes in fer-tilizer recommendations that have occurred as the Florida citrus industry has entered the era of Best Management Practices (BMPs). In addition to the original chapters, this publication adds chapters on 1) production areas and soil characteristics, 2) using precision agriculture to manage citrus nutrition, 3) irrigation and nutrient management, and 4) environmental issues and BMPs.
Supplemental information on subjects related to citrus nutrition appear in extensive appendices. Color plates depicting nutrient deficiencies and toxicities and a key to mineral deficiency symptoms in citrus are included to aid in visual analysis of tree nutritional status.
1.2. Nutrition of Florida citrus trees – A historical perspective
To maintain a viable citrus industry in Florida, growers must be able to economically produce large, high quality fruit crops. Prior to the establishment of Univ. of Florida-IFAS and USDA-ARS research programs, high produc-tion was not possible because citrus nutritional require-ments were poorly understood. For example, early classical studies by Michael Peech and T. W. Young showed that Florida’s sandy soils had very low capacity to hold nutri-ents and water.
The first commercial citrus growers had some understand-ing of the need for the macronutrients nitrogen, phospho-rus, and potassium. Nitrogen was generally applied using natural organic sources like farm animal manure and bird guano. Some mineral nitrogen was mined and imported from Chile. Phosphorus was obtained from local mines, and potassium was imported from Germany.
Meanwhile, worldwide studies demonstrated that plants needed elements in addition to nitrogen, phosphorus, and potassium in order to grow properly. In 1939, A. F. Camp and B. R. Fudge showed that secondary and micronutri-ents were needed to grow citrus on Florida soils. Included were examples of deficiency symptoms of copper, zinc, manganese, magnesium, boron, and iron. They indicated how each of the above element deficiencies could be cor-rected with the exception of iron. At that time, there was no known satisfactory fertilizer source of this element.
Other elements were later found to be necessary for Florida citrus. The problem of yellow spot disease was first reported in 1908. This disease was rather widespread and caused extensive defoliation and tree death. In 1951, Ivan Stewart and C. D. Leonard reported that this problem was due to molybdenum deficiency that could be corrected by a spray application of as little as 1 oz of sodium molyb-date/acre.
Calcium is commonly thought of as a soil amendment and is usually applied as lime. However, when W. F. Spencer and R. C. J. Koo planted citrus on new land at the Citrus Experiment Station (now the Citrus Research and Edu-cation Center) in Lake Alfred, they did not add calcium to some of the plots, which resulted in stunted trees that showed leaf symptoms specific to calcium deficiency.
Copper deficiency of citrus limited growth and fruit pro-duction in many early Florida groves. Following discovery of this problem, high rates of copper were applied to trees in both foliar sprays and soil applications. Later, I. W. Wander and co-investigators found that copper was not taken up in abundance by the trees, nor did it leach like many other fertilizer elements, which resulted in its ac-cumulation in the surface soil.
Copper accumulation interfered with iron uptake by citrus trees, causing leaf chlorosis and defoliation. By 1951, many trees were being removed due to this problem. Stewart and Leonard found that when organically chelated iron (iron-EDTA) was applied to the soil, yellow leaves on iron-deficient trees re-greened.
While sulfur is essential for citrus, its deficiency has not been reported in Florida because it has been supplied through pesticide sprays and dusts, fertilizer components, irrigation water, and rainfall.
1. IntroductionThomas A. Obreza and Kelly T. Morgan
(Includes contributions by David P. H. Tucker and Larry K. Jackson)

8 9
In 1954, the first Florida citrus fertilizer recommendations were made by a joint effort of Citrus Experiment Station and USDA Horticultural Laboratory scientists. Based on data accumulated from many years of experiments, Bul-letin 536 was published. This bulletin was revised three times and for 41 years was the comprehensive guide for citrus tree nutrition. Rates and sources of eleven essential fertilizer elements were recommended based on results from field experiments.
In the 1960s, CREC faculty recommended that growers change to high analysis fertilizers, thus eliminating much of the filler. By so doing, a great deal of the mixing cost was eliminated and transportation and application costs were reduced. Further reductions in costs were made when Spencer and Stewart reported that phosphorus applied to established groves had not leached, but had accumulated in an available form, resulting in reduced phosphorus application rates to established groves. Finally, the use of micronutrients was recommended only when deficiency symptoms persisted.
Numerous nitrogen fertilizer rate and timing studies were conducted by Univ. of Florida and USDA scientists for many years, covering a wide range of soil types, tree ages, varieties, rootstocks, and cultural conditions. The results showed N rates in excess of 200 lbs/acre were justified only for very productive groves. In addition, Stewart and Leon-ard demonstrated that excess nitrogen could reduce yield. Maximum production may vary greatly depending on other limiting conditions, but nitrogen fertilizer require-ments remain similar for a range of production levels and conditions. As a result of these findings, Bulletin SP 169 was published in 1995 by D. P. H. Tucker, A. K. Alva, L. K. Jackson, and T. A. Wheaton. This bulletin de-empha-sized projected yield or yield goal as the basis to determine mature citrus grove nitrogen fertilizer rates in favor of a maximum rate of 200 lbs/acre for typical groves and 240 lbs/acre for “exceptional” groves (defined as groves pro-ducing 700 or more boxes/acre annually).
1.3. Florida enters the BMP era
In the late 1980s, the Florida Dept. of Environmental Protection (FDEP) surveyed drinking water quality across the state and detected the nitrate form of nitrogen in 63% of the wells tested. The nitrate-N concentration in 15% of the wells was greater than the EPA drinking water stan-dard of 10 mg/L. A large majority of the high-nitrate wells were located in Lake, Polk, and Highlands counties, the heart of Florida’s central ridge citrus production area.
Although the influence of citrus nitrogen fertilization on groundwater nitrate concentration was unknown, the combined circumstances of large citrus acreage, relatively high annual fertilization rates, high annual rainfall, and extremely inert, porous soils led the Florida Dept. of Ag-riculture and Consumer Services (FDACS) to implement a set of voluntary BMPs for nitrogen fertilization of ridge citrus trees designed to protect water quality. These were the first official nutrient BMPs for Florida citrus produc-tion. In exchange for implementing the BMP program, FDACS provides citrus producers with a presumption of compliance with water quality standards.
Subsequently, citrus production BMP manuals were writ-ten for the Indian River, Peace River, and Gulf production areas, and grower implementation is now taking place. These BMPs go beyond nutrient management to include irrigation and drainage management, erosion prevention, pesticide use, and aquatic weed control. Essentially the entire commercial citrus industry in Florida now has access to a voluntary BMP umbrella. Producing citrus under BMP implementation allows a grower to farm profitably without the threat of administrative penalties if groundwa-ter standards are violated.
This publication provides an understanding of concepts and issues of nutrition that can address environmental is-sues and concerns about profitability of Florida citrus in a highly competitive global market.

8 9
2.1. General information
Florida’s sandy soils are not particularly favorable for man-agement of water and agrichemicals. Most Florida citrus is grown on naturally infertile sands that are unable to retain more than a minimal amount of soluble plant nutrients against leaching by rainfall or excessive irrigation. Florida citrus soils range from well-drained Entisols on relatively high, rolling landscapes to poorly-drained Alfisols and Spodosols on low-lying flatwoods (Fig. 2.1). The root zone of these soils are dominated by sand and contain only minor quantities of silt, clay, and organic matter. This condition makes the management of water and nutrients a challenging task for grove managers.
Fig. 2.1. Distribution of soil types planted to citrus in Florida.
Well-drained soils are found through the central part of the Florida peninsula as far south as Highlands county on the central Florida ridge. Their main advantages are good drainage, good aeration, and a deep root zone. The main disadvantage is the need for frequent irrigation during dry periods. Soil uniformity, lack of a hardpan, and a low water table allow for deep, extensive root systems. Such an extensive rooting zone enables the tree to overcome the low water and nutrient-holding capacity of these soils to some extent.
Poorly-drained soils are found in coastal areas and on the flatwoods of central and south Florida. The soils on the east coast usually are naturally acidic with a subsurface hardpan, but some may have marl or shell in the profile that makes them alkaline. The water table is close to the surface and the soil may pond during the wet season. These soils must be drained and bedded before planting citrus. Their principal advantages are higher natural fertility and water-holding capacity. Disadvantages include poor drain-age and increased alkalinity or clay content of the topsoil due to deposition of subsurface materials over the natural surface during the bedding process.
2.2. Characteristics of soil orders important to Florida citrus production
A soil order is the most basic category of soil classification. The order provides a general idea about basic physical and chemical characteristics of a soil. Characteristics important to production on Florida citrus soil orders are as follows:
• Entisols are sandy mineral soils low in organic matter, natural fertility, and water-holding capacity (Fig. 2.2). They have weak or no diagnostic subsurface layers and are well to excessively well-drained.
• Spodosols are sandy mineral soils low in organic matter and natural fertility in the surface layer (Fig. 2.3). They contain an acidic subsurface restrictive layer composed of aluminum and iron cemented together with organic matter.
• Alfisols are sandy mineral soils low in organic matter in the surface layer but higher in relative natural fertil-ity compared with Spodosols (Fig. 2.4). They contain a subsurface layer of loamy material (a mixture of mostly clay and sand with little silt) that has a relatively high water-holding capacity.
2.3. Soil series typically found in citrus groves
A soil series is the most specific category of soil classifica-tion. There are 15 soil series that represent most of the soils on which Florida citrus groves have been planted (Table 2.1). Entisols (other than Basinger) occur on high ridges and upland plains at an elevation greater than 100 ft above mean sea level (MSL) in the central ridge production area. Alfisols, Spodosols, and the Basinger series occur on broad,
2. Production Areas, Soils, and Land PreparationThomas A. Obreza and Mary E. Collins
(Includes contributions by Larry K. Jackson, Ashok K. Alva, David P. H. Tucker, and David V. Calvert)

10 11
Fig. 2.2. Candler sand, an Entisol, with surface (A) and subsur-face (E) horizons. (Mary Collins)
Fig. 2.3. Myakka sand, a Spodosol, with surface (A), leached (E), and restrictive (Bh) horizons. (Mary Collins)
Fig. 2.4. Riviera sand, an Alfisol, with surface (A), leached (E), and restrictive (Bt) horizons. (Mary Collins)
Table 2.1. Common soils used for citrus production in Florida.
Series Drainage Typical location (counties)
Entisols
Astatula Excessive Polk, HighlandsBasinger Poor HighlandsCandler Excessive PolkTavares Moderate Polk
Spodosols
Immokalee Poor Hendry, Collier, DeSotoMyakka Poor DeSoto, Hardee, HighlandsOldsmar Poor Hendry, CollierPomona Poor HardeeSmyrna Poor DeSoto, Hardee
Wabasso Poor St. Lucie, Indian River, Martin
Alfisols
Boca Poor Hendry, CollierHolopaw Poor Hendry
Pineda Poor St. Lucie, Indian River, Martin, Collier
Riviera Poor St. Lucie, Indian River, MartinWinder Poor St. Lucie, Indian River

10 11
low flat areas or in sloughs at elevations from 10 to 40 ft above MSL in the Gulf and Indian River production areas, and 35 to 100 ft above MSL in the Peace River production area. Some Alfisols and Spodosols can also occur in depres-sional areas, even though they are normally located higher on the landscape.
2.4. Soil physical and chemical properties important to citrus nutrient management
The soil on which citrus is grown greatly influences how irrigation water and nutrients should be managed to maxi-mize production, minimize resource use, and protect water quality. Soil properties important to nutrient management include texture, water-holding capacity, organic matter content, soil pH, cation exchange capacity, and coatings on sand grains (Appendix A).
• Soil texture is the relative proportion of sand, silt, and clay in a mineral soil. Texture influences how much wa-ter a soil can hold against drainage by gravity and how quickly water will drain away. Most citrus soils contain 94 to 98% sand in the root zone, which makes irriga-tion water management extremely difficult because sand has little capacity to hold water. If too much irrigation water is applied at one time, the excess will be lost below the root zone, which can induce nutrient leaching.
• Soil organic matter includes any organic carbon-based material, from freshly deposited plant residues to highly decomposed humus or compost. In their native state, typical citrus soils may contain as much as 5% organic matter, but after a grove is planted organic matter decreases, eventually stabilizing around 1 or 2% by the time the grove matures. In general, the more chroni-cally wet a citrus soil is, the higher its organic matter content tends to be. Soil organic matter is rapidly lost by oxidation to carbon dioxide in Florida’s warm and humid climate, and it is not replaced in large quantities by citrus trees. Use of herbicides beneath tree canopies also decreases organic matter accumulation. In a sandy soil, organic matter is an extremely valuable component because it provides both water and nutrient-holding capacity, and its decomposition provides recycled nutri-ents to plants.
• Soil water-holding capacity is directly related to the amount of silt, clay and organic matter present. Since most Florida citrus soils contain only small amounts of these components, water-holding capacity is rarely greater than 1 inch per foot of soil depth, and is often less than 0.75 inches per foot. Low water-holding capac-
ity soils require light and frequent irrigation to mini-mize nutrient leaching.
• Soil pH affects the availability of plant nutrients includ-ing phosphorus (P), calcium (Ca), magnesium (Mg), and the micronutrients. Most Florida soils are acidic in their native state, so they require lime applications be-fore planting and every few years thereafter depending on fertilizer and irrigation water sources. The optimum soil pH range for citrus is 6.0 to 6.5. The pH of Florida citrus soils can change rapidly as a result of chemical reactions caused by lime or fertilizer applications. An exception to this principle is a calcareous soil. Some of the Alfisols in Table 2.1 can be calcareous due to a sub-stratum of natural calcium carbonate rock or shell that dominates their chemistry. The pH of a calcareous soil remains relatively constant around 8.2.
• Cation exchange capacity (CEC) is a measure of the ability of the soil to hold positively charged nutrients like Ca, Mg, potassium (K), and ammonium (NH4
+) against leaching (Fig. 2.5). Generally speaking, as CEC increases, soil fertility increases. Soil CEC is supplied by clay and organic matter. Florida citrus soils are low in CEC, so nutrient management is difficult. The best fer-tilizer use efficiency can be obtained by applying mobile nutrients like nitrogen (N )and K frequently in small doses, similar to irrigation water. Entisols are the least fertile citrus soils, followed by Spodosols and Alfisols. The increased fertility of Spodosols reflects their slightly higher organic matter content, while the fertility of Alfisols is greatest because they contain some clay as well as organic matter.
Fig. 2.5. Example of the cation exchange reaction that occurs when a soil is fertilized with ammonium nitrate.

12 13
• Coated and non-coated sands relate to the P fixation ca-pacity of Florida soils. Fixation is important because the movement of P from agricultural fields to surface water bodies has become an environmental concern. Most soils nationwide have a moderate to high capacity to ad-sorb or hold soil P against leaching because they contain considerable quantities of silt and clay that provide a chemical mechanism to bind P. Florida soils dominated by quartz sand lack appreciable amounts of these silts and clays. However, in many cases the sand particles are coated with iron and/or aluminum compounds that also have some capacity to adsorb P.
One way to judge if coated sand grains are present is to observe the soil color (Fig. 2.6). Yellow, orange, or brown colored sand is more likely to be coated, while beige or white sand is not. Therefore, citrus groves on soils contain-ing coated sands have the ability to build a soil P reserve following P fertilizer applications. The presence of this P reserve can be determined with soil testing, and P fer-tilization should be curtailed if high soil test P is found. Conversely, citrus groves on non-coated sandy soils lack the ability to hold P. In this case excessive P fertilization may induce P leaching, so P fertilizer should not be used indiscriminately because it may be lost to the environment.
Fig. 2.6. Coated and non-coated sand grains.
2.5. Vulnerable soils
The presence of fertilizer and agricultural chemicals in groundwater has become an issue in a number of agri-cultural production areas around the world. More than half of the total fresh water used in Florida comes from groundwater, and more than 90% of the public rely on groundwater supplies for drinking.
Of all fresh water withdrawn in Florida, one-third is
consumed and two-thirds is returned to the groundwater. The quality of this water is important since it may come in contact with soluble nutrients, pesticides, or metals prior to returning to the surficial aquifer or flowing off site. Florida’s unique hydrogeologic features, including a thin surface soil layer, high water table, and porous lime-stone in many areas make the soil susceptible to downward movement of nutrients. Soils used for citrus production on the central ridge are particularly subject to leaching and are referred to as vulnerable soils (Fig. 2.7). These soils are well-drained with low organic matter and provide ideal conditions for leaching of plant nutrients including soil-applied N fertilizer. Removal of N by denitrification is minimal in these soils.
Table 2.2. Soil series classified as vulnerable to nutrient leaching.
Adamsville Dade Palm BeachArchbold Florahome PaolaAstatula Fort Meade SatelliteBahiahonda Gainesville St. AugustineBroward Lake St. LucieCanaveral Lakewood TavaresCandler Neilhurst OrsinoCocoa Orlando
The soils in Table 2.2 have been categorized by the Florida Department of Agriculture and Consumer Services (based on USDA-Natural Resource Conserva-tion Service information) as highly permeable and well drained. Thus, they are at risk in terms of groundwater contamination through agrichemical leaching. Although such soils dominate throughout the ridge citrus produc-tion area, many are scattered throughout other Florida citrus producing areas. Producers should consult the local NRCS office or county soil survey to determine if a grove contains one or more vulnerable soils. County soil surveys can be viewed on the NRCS internet web site at: http://websoilsurvey.nrcs.usda.gov/.
2.6. Grove site selection and land preparation
When developing a grove site, it is important to determine general soil fertility by testing the soil for pH, organic matter, and Mehlich 1 (double-acid) extractable P, Ca, and Mg. If the site has been previously used to grow citrus or vegetables, extractable copper (Cu) concentration should also be checked.
If the soil is found to be acidic (pH 5.5 or less), the pH should be raised to the 6.0 to 6.5 range by adding lime. The higher target pH should be used for soils with Me-

12 13
Fig. 2.7. Approximate location of vulnerable soils in citrus production regions. (Courtesy of James Turk and Juan Vega, USDA-NRCS, Gainesville.) See table 2.2 for a list of vulnerable soil series.

14 15
hlich 1-extractable Cu greater than 25 mg/kg (ppm). If the soil is calcareous (contains free calcium carbonate, with pH around 8.2), no attempt to lower the pH should be made. If planted to citrus, improving the fertility of highly calcareous soils and white sandy soils (“sand soaks”) devoid of organic matter will be extremely difficult. Additional production costs associated with management of trees on such soils can make the difference between profit and loss, particularly during periods of low fruit returns.
Renovating old flatwoods groves by rebedding and ditch-ing can have profound effects on fertility, water relations, and tree rooting volume. Often the renovation is benefi-cial, but problems may occur in some cases if high pH materials or clay is brought up into the rooting zone.
2.7. Effects of leveling and bedding on soil fertility in flatwoods citrus groves
In contrast to central ridge citrus groves that are planted along the natural contour of the land, flatwoods grove sites must be leveled, slightly sloped, and bedded before planting to provide artificial drainage. The topsoil of native Alfisols and Spodosols is no more than 6 to 8 inches thick. Below this layer is the first subsoil layer, which is usually a white or light gray sand that is extremely low in fertility and water-holding capacity. Occasionally, land leveling removes all of the topsoil from a higher part of the field and transports it to a lower part, leaving the light-colored sandy subsoil as the new surface (Fig. 2.8). Citrus tree growth and produc-tion in these areas (commonly referred to by flatwoods cit-rus growers as scraped areas or sand soaks) is usually poor.
After leveling, soil beds are constructed by cutting parallel wide and shallow V-shaped furrows about 50 ft apart. The soil removed from these furrows is shaped into a convex bed between them on which the citrus trees are planted. The vertical distance from the bottom of the furrow to the top of the bed is usually 2 to 3 feet. When construct-ing beds, the original soil surface is covered by subsoil that may have significantly different physical or chemical characteristics than the surface soil. The overburden soil can be either coarser or finer-textured than the surface soil, but it is almost always lower in organic matter. If the soil series has limestone in the profile, the overburden may be calcareous. Therefore, the root zone soils in bedded groves are often less fertile and lower in water-holding capacity compared with the buried original surface layer.
The restrictive subsurface layer in flatwoods soils can affect citrus production in two ways. If it is relatively deep, it remains intact after bedding and will impede downward
water percolation. Citrus rooting can be affected by this layer due to its influence on shallow water table depth and duration. Typically, almost all flatwoods citrus roots reside in the top 12 to 18 inches of soil due to the effect of the restrictive layer.
Some flatwoods soils have relatively shallow restrictive layers that can be excavated during the bedding process, so these subsurface materials are sometimes mixed into the root zone. The chemical and physical properties of a restrictive layer differ substantially from the sandy surface layer (Appendix A). Material from a loamy (Bt) layer is higher in clay, while a sandy dark red, brown, or black (Bh) layer is higher in organic matter. Loamy layers can be either acidic or alkaline in pH, while organic-stained layers are always highly acidic. In addition, water-holding and cation exchange capacities are higher in restrictive layers. The mag-nitude of influence that soil from these layers might have on root zone soil properties is directly related to amount of material that was excavated and mixed in during bedding.
2.8. Soil pH and liming
Soil pH measures soil acidity or alkalinity, and is used to make liming decisions. Soil pH measurement is quick, easy, and inexpensive. Soil pH control is important because the availability of most plant nutrients as well as those that are toxic to plants are affected by it.
Irrigation water from Florida’s deep aquifers frequently contains dissolved limestone that can slowly raise soil pH. Higher soil pH is particularly evident in the areas wetted by microirrigation emitters. Florida soils vary considerably in Ca content. The majority of soil Ca exists as sparingly sol-uble minerals including Ca-phosphates and Ca-carbonate.
Fig. 2.8. Effect of leveling a flatwoods citrus site on topsoil (A horizon) thickness. Note the thick, dark topsoil on the left and lack of same on the right. (Mace Bauer)

14 15
Calcium must dissolve from these compounds to become plant-available. Florida’s coarse-textured soils are low in Ca because they are mostly quartz sand. On the other hand, calcareous soils are extremely high in Ca. Calcium in soils may be classified as non-exchangeable (mineral forms), ex-changeable (adsorbed to clay or organic matter colloids), or soil solution Ca. Exchangeable Ca is the major Ca reserve in soils that is available to plant roots. Calcium availability is largely a factor of the supply in the soil.
The target pH of 6.0 to 6.5 for Florida citrus production is based on a study of pH and Ca interactions conducted on a ridge soil (Candler fine sand). A clear advantage of pH 6.0 over pH 5.0 was evident, and pH 7.0 was no better than pH 6.0 at all Ca levels. Therefore, if a soil test does not show excessive copper accumulation, a soil pH of 6.0 is sufficient for citrus production. Soil pH should be raised to 6.5 when soil tests show a build-up of copper because this element becomes toxic at low soil pH.
Soil pH can be increased by applying either calcitic or dolomitic lime. In addition to affecting soil pH, calcite is an effective source of Ca, whereas dolomite supplies both Ca and Mg. Therefore, although either calcite or dolomite could be effectively used for citrus production, the choice of dolomite would be more appropriate for soils that also require Mg.
In groves with favorable soil pH but low soil Ca, gypsum or a more soluble fertilizer like calcium nitrate can be used as a source of available Ca. In most bearing groves, soil pH is generally above 6.0, so liming is not required. Gypsum is a source of moderately-available Ca with no effect on soil pH, while calcium nitrate is a rapidly-available Ca and N fertilizer with a slightly alkaline reaction in the soil.
Although the application of dolomite can alleviate Mg deficiency, tree response is usually slow. Application of dolomite as a source of Mg is not recommended if the soil pH is in the desired range. Under this condition, applying MgSO4 or MgO to the soil or Mg(NO3)2 as a foliar spray can correct Mg deficiency.
The current soil pH recommendation for non-bearing and bearing citrus takes into account: 1) higher pH soils now in production, 2) the high pH of groundwater used for irrigation, and 3) greater use of rootstocks like Swingle citrumelo that grow poorly in high pH soils.
2.9. Organic matter
As discussed earlier, organic matter is an extremely valuable component of sandy soils because it provides both water
and nutrient-holding capacity, and its decomposition pro-vides recycled nutrients to plants. The opportunity to add imported organic matter to a citrus grove is greatest prior to planting because it can be more readily applied and in-corporated into the soil where the tree rows will be located.
Florida citrus has been successfully grown for decades without adding organic matter from outside sources, so it is not a necessary practice. However, because of its benefits to soil fertility and its increased availability since the mid 1990s, organic matter addition has become more practi-cal. Florida landfills no longer accept horticultural waste, so some county waste disposal operations have turned to mulching or composting for disposal. These materials are usually provided to consumers at no cost other than transportation. Materials intended as mulches are not rec-ommended for application to citrus groves as soil amend-ments because they may rob N from trees as they decom-pose. Finished compost is appropriate for immediate soil application, but mulch would need to be composted on site before it would be safe to incorporate it.
There is no particular target rate for composted organic matter application. A general rule is, some is better than none, and more is better than less. A grower’s decision to apply organic matter should be based on the proximity of a suitable supply plus transportation, spreading, and incorporation costs. Because of the large volumes required for meaningful application rates (e.g. 10 to 50 tons/treated acre), uniform application of a lower rate across an entire grove is not recommended. Rather, the grower should identify the weaker soils in the grove and concentrate higher rates of organic matter application in those areas.
Ozores-Hampton et al. (1998) suggested optimum physi-cal and chemical properties for compost applied to agricul-tural land:
• 35 to 55% moisture by weight.• 50% or more organic carbon.• pH between 5.0 and 8.0.• 20 to 60% water-holding capacity by weight.• Less than 6.0 dS/m soluble salts.• 500 to 1000 lbs/yd3 fresh bulk density.• Particle size passes 1-inch screen.• 15:1 to 25:1 C-to-N ratio.• No viable weed seeds.
Of these characteristics, the two most important are C-to-N ratio and soluble salts. Lower values of each indicate compost more favorable for application to a Florida citrus grove.
16 17
3.1. Essential nutrients
Seventeen elements are essential for the growth and func-tioning of green plants. Carbon (C), hydrogen (H), and oxygen (O), which make up about 95% of tree biomass, are provided by nature. C and O are taken up by leaves as carbon dioxide (CO2) from the air. They combine with H, taken up as water by the roots, to produce carbohydrates. Photosynthesis takes place in chlorophyll-bearing cells, us-ing light as an energy source. Carbohydrates, together with proteins, fats, and other organic compounds derived from them, are the true plant foods. They are used to make new plant tissues and provide energy for growth and fruiting.
The other 14 mineral elements are nitrogen (N), phospho-rus (P), potassium (K), calcium (Ca), magnesium (Mg), sulfur (S), iron (Fe), zinc (Zn), manganese (Mn), boron (B), copper (Cu), molybdenum (Mo), chlorine (Cl), and nickel (Ni). Florida’s sandy soils often do not contain a suf-ficient supply of many of these nutrients, so growers may need to provide some of them through fertilizer applica-tion.
When any essential element is in short supply, tree func-tion is restricted. A severe shortage of an element typically produces a characteristic deficiency symptom exhibited by the leaves, which usually persists until the deficiency is corrected. Twigs and fruits may also exhibit characteristic symptoms. Sometimes two or three elements are deficient in varying degrees, resulting in confusing visual symptoms. Conversely, excessive amounts of some elements may be present in the soil and may prevent the tree from function-ing properly. Visual symptoms and leaf and soil analysis are all useful to evaluate nutritional status.
Mineral nutrients are divided into macronutrients, which are elements that plants require in large amounts (N, P, K, Ca, Mg, S), and micronutrients, which are needed only in small amounts (Fe, Zn, Mn, B, Cu, Mo, Ni, Cl) (Table 3.1). The macronutrients are divided into two groups: primary elements (N, P, and K) and secondary elements (Ca, Mg, and S). Micronutrients are sometimes referred to as “minor” or “trace” elements, but these terms are mis-leading. For example, the role of Fe in plant metabolism should not be considered less important than the role of K. Iron deficiency can result in total crop loss, so its role is not a “minor” one, and it is not of minor importance. The
difference between Fe and K is in the amount required by plants, so the use of the terms micro and macronutrients is more appropriate.
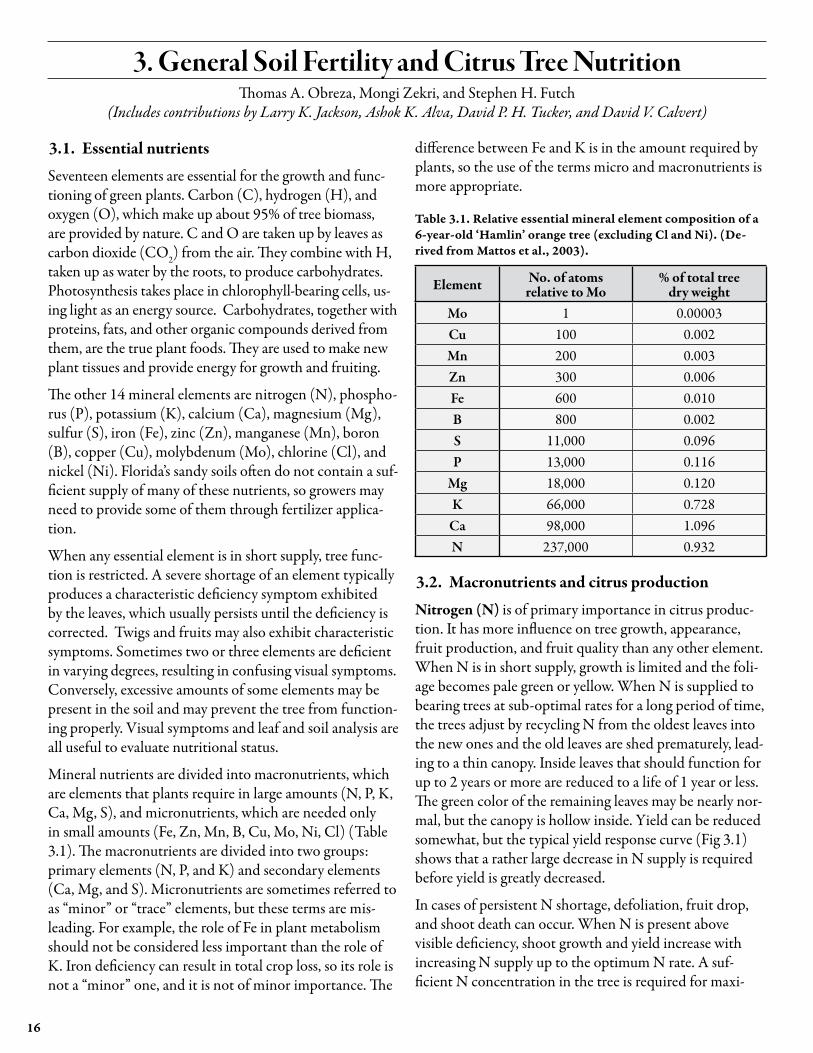
Table 3.1. Relative essential mineral element composition of a 6-year-old ‘Hamlin’ orange tree (excluding Cl and Ni). (De-rived from Mattos et al., 2003).
Element No. of atoms relative to Mo
% of total tree dry weight
Mo 1 0.00003Cu 100 0.002Mn 200 0.003Zn 300 0.006Fe 600 0.010B 800 0.002S 11,000 0.096P 13,000 0.116
Mg 18,000 0.120K 66,000 0.728
Ca 98,000 1.096N 237,000 0.932
3.2. Macronutrients and citrus production
Nitrogen (N) is of primary importance in citrus produc-tion. It has more influence on tree growth, appearance, fruit production, and fruit quality than any other element. When N is in short supply, growth is limited and the foli-age becomes pale green or yellow. When N is supplied to bearing trees at sub-optimal rates for a long period of time, the trees adjust by recycling N from the oldest leaves into the new ones and the old leaves are shed prematurely, lead-ing to a thin canopy. Inside leaves that should function for up to 2 years or more are reduced to a life of 1 year or less. The green color of the remaining leaves may be nearly nor-mal, but the canopy is hollow inside. Yield can be reduced somewhat, but the typical yield response curve (Fig 3.1) shows that a rather large decrease in N supply is required before yield is greatly decreased.
In cases of persistent N shortage, defoliation, fruit drop, and shoot death can occur. When N is present above visible deficiency, shoot growth and yield increase with increasing N supply up to the optimum N rate. A suf-ficient N concentration in the tree is required for maxi-
3. General Soil Fertility and Citrus Tree NutritionThomas A. Obreza, Mongi Zekri, and Stephen H. Futch
(Includes contributions by Larry K. Jackson, Ashok K. Alva, David P. H. Tucker, and David V. Calvert)

16 17
mum vegetative growth, flowering, and fruit yield. A high N concentration increases tree growth and may require increased applications of other elements, particularly K. Luxury (excessive) consumption of N can lead to excessive vegetative growth at the expense of fruit yield.
Phosphorus (P) is listed on a fertilizer label as P2O5 and is referred to as available phosphoric acid. Phosphorus does not readily leach if the soil pH is 6.0 or higher, and remov-al by a citrus crop is only around 2 lbs of elemental P/100 boxes of fruit. Most mature Florida citrus groves contain sufficient residual P that accumulated from previous fertilizer applications, so regular P fertilizer application is usually not necessary. Most previously non-cultivated soils used for new citrus plantings are naturally low in P, so fertilizer application may be needed for the first few years until P accumulates in the root zone.
Potassium (K) (also called potash) is listed on a fertilizer label as K2O, and is important to yield, fruit size, and juice quality. Potassium does not accumulate to a great extent in sandy soils used to produce citrus, even with repeated fertilizer applications. Potassium deficiency is not com-mon when a grove is fertilized normally, but it can develop on high pH soils or when high N rates stimulate high fruit production. Too little K can slow vegetative growth and result in thinning of the topmost foliage. Potassium deficiency reduces fruit number and size, increases fruit creasing, plugging and drop, and decreases juice soluble solids, acid, and vitamin C content. High K fertilizer rates do not increase cold hardiness of citrus trees.
Calcium (Ca) is the most abundant mineral element by weight in citrus trees, residing mainly in the leaves. Ca is rarely deficient since occasional applications of CaCO3 (lime) are used to control soil acidity, and because Ca is present in irrigation water. Florida’s alkaline soils have an abundance of Ca because they contain dissolved calcium carbonate (limestone).
Magnesium (Mg) is an essential constituent of chloro-phyll. A deficiency produces a characteristic chlorotic pattern and may cause premature defoliation. Seedy citrus varieties may need more Mg than seedless ones because seeds store a large amount of Mg. Dolomitic limestone is often used to correct acidity and supplies slowly-available Mg. Calcium is abundant in alkaline soils, which can be antagonistic to Mg uptake.
Sulfur (S) is utilized by citrus trees in an amount similar to P. It is supplied with fertilizers like ammonium sulfate and sulfates of micronutrient metals. Sulfur is a major compo-nent of the soil organic fraction and becomes available to plants as organic matter decomposes. Sulfur is also present in some irrigation water sources. When S is deficient in a citrus tree, the symptom looks like N deficiency.
3.3. Micronutrients and citrus production
Iron (Fe) deficiency causes a chlorotic pattern that first appears on young shoots because mobility of Fe within the plant is low. It occurs in trees growing in alkaline soil, waterlogged soil, or soils very low in organic matter soil. Other Fe deficiency problems have occurred where Cu is high in the soil.
Copper (Cu) deficiency causes fruit corking, ammonia-tion (curved branching), inter-nodal stem gumming, and twig dieback. The deficiency can be corrected by applying Cu fertilizer to the soil. Copper should not be included in fertilizer if foliar Cu sprays are used, or if a grove soil test shows sufficient Cu (Chapter 4). For new plantings on previously non-cultivated flatwoods soils, Cu should be included in the fertilizer for the first 2 or 3 years.
Zinc (Zn) deficiency symptoms are expressed in citrus trees as severe chlorosis where leaf tissue becomes nearly white, except for green veins. New leaves grow progres-sively smaller as the deficiency becomes more severe, and shoot internodes become shorter causing a rosette effect. Severe Zn deficiency restricts growth and reduces fruit yield.
Manganese (Mn) deficiency produces a mild form of interveinal chlorosis on acidic, sandy soils. The “marl chlorosis” found on calcareous soils is the result of com-
Fig. 3.1. Generic response of citrus yield to N fertilizer rate.

18 19
bined deficiencies of Mn and Zn, and sometimes Fe. Temporary mild deficiency patterns on new shoots are not detrimental to growth or fruiting of citrus trees. Correc-tive measures should only be taken in the case of persistent deficiency symptoms.
Boron (B) deficiency causes fruit drop, gum pockets in the peel, gumming around the core, and brown areas in the albedo and central axis. It sometimes occurs when grow-ers use only high-analysis fertilizers (without micronutri-ents), or following a prolonged drought. Boron should be applied every year either as a soil or foliar application, but not both. Foliar application to correct a deficiency is advantageous due to rapid tree uptake. Boron fertiliza-tion may not be needed at all if trees are irrigated with reclaimed water.
Molybdenum (Mo) deficiency produces a symptom described as “yellow spot.” Unlike other nutrients, Mo is less available in acidic than in slightly alkaline soils. Mo deficiency is rare in Florida. If it occurs, the soil usually has become too acidic with time. Liming the soil effectively relieves the deficiency, but more rapid response is obtained if sodium molybdate is applied as a foliar spray.
The exact roles of chlorine (Cl) and nickel (Ni) in citrus tree metabolism are not clear.
3.4. Supplying nutrients to citrus trees
A sufficient supply of essential nutrients is critical to nutri-ent management and sustainability. If a single element is below the critical availability level, crop growth and yield will fall even if the other elements are in sufficient supply. A balance of available nutrients is a key component to profitability because it allows for positive nutrient interac-tion. For example, in the case of N fertilization a shortage of another nutrient could decrease N uptake, reduce N use efficiency, and increase the potential for N loss.
Soil application of macronutrients is favored over foliar application due to the high uptake demand by citrus trees. However, fertilizer applied to the soil is subject to various fates including leaching, runoff, and fixation to forms not available to plants. Solution fertilizers applied to the tree foliage are less prone to these losses, but only small quanti-ties of nutrients can penetrate leaves. Foliar fertilizer ap-plication may be considered for the nutrients N, P, K, Mg, Zn, Mn, and B. It is especially useful when soil properties like high pH inhibit nutrient availability.
Foliar fertilizer application can reduce or eliminate soil applications of micronutrients since they are taken up in low amounts (Table 3.1). Foliar application is the fastest
method of promoting micronutrient uptake by plants in the short term when a nutritional deficiency is diagnosed, but should not be relied upon for long-term tree nutrition unless the soil is calcareous (Chapter 11).
Fertilization represents about 20% of total citrus pro-duction costs, but it can have a large effect on potential profitability at extreme highs or lows. Visual evaluation of nutritional status, soil and plant analysis, field history, production experience and economics are all important guidelines for making fertilizer rate and source decisions.
3.5. Nutrient behavior in Florida soils
Plant nutrients exist in both organic and inorganic forms in soil. Organic forms are found in fresh plant residue, soil organic matter (humus), living soil organisms (e.g. bacteria and fungi), soil amendments (e.g. biosolids or compost), and synthetic organic materials (e.g. some N fertilizers). Organic materials are the key component of nutrient recycling. They are a stable storehouse of plant nutrients because they are not rapidly lost from the soil.
Nutrients associated with organic matter are not immedi-ately plant-available, but are slowly released as the material is decomposed by soil microbes. The decomposition rate depends on the material’s physical and chemical charac-teristics and the climate. Florida’s warm and humid condi-tions are ideal for decomposition of almost any organic material, so organic matter does not accumulate in citrus grove soils over the long term. Nutrients are continuously released in inorganic form as decomposition proceeds. The recycling process is complete once these nutrients are taken up by growing plants. Many of the nutrients in citrus tree residues (dropped leaves, twigs, and fruit; dead roots) are returned to the tree in this manner.
Inorganic plant nutrients exist in solid form (minerals or precipitates), in adsorbed form (bonded to a solid phase material), on the cation exchange complex (Fig. 2.5), or in the soil solution. The ionic nutrient forms that plants use (Table 3.2) must dissolve, desorb, or exchange into the soil solution before they can be taken up. If the soil solution is not replenished with nutrients rapidly enough to satisfy plant demand, plant nutrition will be less than optimum.
In an intensive crop production system, fertilizers added to the soil supplement the natural nutrient supply and pre-vent nutrient deficiencies. Most fertilizers applied to citrus groves are inorganic minerals or soluble salts that quickly dissolve into plant-available (ionic) form. The soil can react with some of these ionic forms, rendering them unavailable to plants. In the absence of these reactions, nutrients may

18 19
leach with water that percolates through the root zone. The general characteristics and behavior of nutrients in sandy Florida soils planted to citrus are outlined below.
Nitrogen
• 95% of the natural N that resides in the soil is associ-ated with organic matter. Soil humus contains about 5% N. The N release from organic matter depends on how much is there and how fast the material decomposes. This release rate is fast enough to support plant growth in a natural landscape, but is too slow for intensive agri-cultural production on sandy soils.
• Biological ammonification converts organic N to mineral N (ammonium, NH4
+). Ammonium is also a component of some mineral N fertilizers. Nitrifica-tion, which also depends on microbial activity, converts NH4
+ to nitrate (NO3-) in days to weeks. Thus, soil
solution N is dominated by negatively-charged nitrate. There is no mechanism to hold nitrate in the soil, so it leaches easily.
• Most of the N lost from soils is a result of N loading of the soil from fertilizer or animal waste application, fol-lowed by N leaching from the soil with excessive rainfall or irrigation.
Phosphorus
• P occurs naturally in some Florida soils as calcium phos-phate minerals. These minerals can also slowly form following P fertilizer application. Soil phosphates are relatively insoluble, which can affect plant availability.
• If a soil has the capacity to adsorb, or “fix” P, then added P will accumulate in the root zone. Phosphorus fixation occurs when soluble P forms nearly insoluble compounds with Fe or aluminum (Al) at low soil pH or Ca at high soil pH. The best P availability in these soils occurs around pH 6.5.
• Florida’s sandy soils may or may not have the capacity to hold applied P fertilizer depending on the type of sand present. Sand coated with Fe or Al compounds can fix P in the root zone, while non-coated sand cannot (Fig. 2.6). If a soil is dominated by non-coated sand, P may leach.
• Adsorbed P can be transported via surface runoff (ero-sion) while soluble P can be transported via leaching. Phosphorus loss from the soil results from long-term loading of the soil with P from animal wastes or fertil-izers, followed by erosion of soil and organic matter particles or leaching, depending on the soil.
Potassium
• Florida soils are naturally low in K, so intensive agricul-tural production requires the use of K fertilizer.
• The ionic form of K can be held by the soil cation ex-change complex (Fig. 2.5), which delays leaching. How-ever, Florida soils planted to citrus have naturally low cation exchange capacity in the root zone (Appendix A, Table A.1), so K+ leaches almost as readily as NO3
-.
• K is not fixed in sandy soils and does not form insoluble compounds, so it is easily lost from the root zone. Thus, K fertilizer application is required every year in Florida citrus groves.
Calcium and Magnesium
• Ca and Mg exist as solid compounds in the soil (mostly in combination with carbonate or phosphate) and in ionic forms held by the cation exchange complex.
• Solid forms of Ca and Mg are sparingly soluble and can reside in the soil for many years if the pH is not too acidic. Dissolution is more rapid at low pH, which is the basis of the liming reaction.
• Because they are divalent cations, Ca and Mg dominate on the cation exchange complex, limiting their mobility in soil.
Sulfur
• 90% of the S that occurs naturally in soils is associated with organic matter. Soil humus contains about 0.5% S. Like N release, S release depends on organic matter quantity and decomposition rate. Organic S release combined with S from other sources like rain or irriga-tion water usually provides this nutrient to plants at a sufficient rate even in intensive agricultural production.
• The plant-available form of sulfur (sulfate) is a negative ion, which makes it prone to leaching. Sulfate can be adsorbed by soils but adsorption usually occurs much deeper in the soil profile than the majority of plant roots.
• Calcium sulfate (gypsum) is a sparingly-soluble com-pound that is applied as a long-term source of available Ca, but it also supplies S to plants.
Copper, Iron, Manganese, and Zinc
• These micronutrients form compounds that are only slightly soluble in sandy soils, thus they are not mobile nutrients. Solubility increases somewhat as pH decreas-es (Fig. 3.2), so it is important to not over-lime a soil. At

20 21
alkaline pH, some plants suffer micronutrient deficien-cies due to almost total insolubility.
• If applied to the soil as soluble fertilizer, these micronu-trients will precipitate near the soil surface.
Boron
• The plant-available form of B is negatively charged (bo-rate), so it can easily leach from sandy soil.
• B fertilizer should be regularly applied to Florida citrus groves, but there is a narrow range between deficiency and toxicity.
Molybdenum
• Mo is the only micronutrient that increases in solubil-ity as soil pH increases. Thus, it is an immobile nutrient within the soil pH range that is favored for citrus tree growth.
Nutrient movement in Florida’s sandy soils is summarized in Table 3.2.
3.6. Citrus nutrient requirements
This section describes the typical citrus yield response curve and discusses nutrient requirements in relation to anticipated yield. Fertilizer rate guidelines for non-bearing and bearing trees are provided in Chapter 8.
The relationship between nutrient supply and yield of a wide variety of annual and perennial crops has been stud-ied for decades. The relationship between plant response (yield) and fertilizer rate is called the yield response curve. The shape of this curve is similar for a range of crops and conditions.
The curves in Fig. 3.1 illustrate how citrus yield increases with increasing N rate for two conditions. Fertilizer N is used in this example, but the nature of the response curve is similar for other limiting nutrients. At very low N rates there is a large yield response to each added unit of N. As yield increases, each additional unit of N results in a smaller increment in yield. This smaller response to increasing input is also referred to as the law of diminish-ing returns. The two response curves in Fig. 3.1 compare the effect of N rate when other factors are not limiting and the response when yield is limited to one-half by a second factor. The shapes of the curves are similar, and the rate of N where the slope levels off is only slightly higher for the more productive grove.
The yield response curves shown never completely flatten out, indicating that ever higher N rates theoretically will
Fig. 3.2. Effect of soil pH on nutrient availability as expressed by relative bar width.
Table 3.2. Qualitative assessment of nutrient movement in Florida’s sandy soils based on ionic form in the soil solution and ability to precipitate or be adsorbed by the soil.
NutrientIonic form taken up by
plants
Nutrient subject to precipitation or
adsorption?
Nutrient mobile in
sandy soil?
N NH4+, NO3
- No Yes
P PO43- Yes Yes/No*
K K+ No Yes
Ca, Mg Ca2+, Mg2+ Yes No
S SO42- Yes Yes/No*
Cu, Mn, Fe, Zn
Cu2+, Mn2+, Fe3+, Zn2+ Yes No
B H3BO3, No Yes
Mo MoO42- Yes No
* Depends on soil properties (see discussion above).

20 21
produce small additional yield increases. Because fertilizer cost was a small portion of total production cost in the past, high N rates were commonly applied to produce the highest possible yield. However, experiments with citrus have rarely demonstrated a benefit of N fertilizer rates higher than about 200 lbs/acre, regardless of the produc-tion potential. Instead, yield declined in several experi-ments when N rate was increased beyond the optimum range.
Nutrients removed with the harvested crop must be replaced. The amount the crop removes varies from a frac-tion of a lb/acre for some of the micronutrients to as much as 100 lbs/acre of N or K from a high-producing grove (Table 3.3). For oranges, approximately 0.12 lbs N/box is removed with the harvest. Therefore, crop removal ranges from 12 lbs N/acre for a 100 box/acre yield to around 100 lbs N/acre for a grove producing 800 boxes/acre.
Nutrient uptake from applied fertilizers is not 100% ef-ficient, so more nutrients must be applied than the mini-mum required by the tree. N use efficiency, expressed as lbs N removed by the crop divided by lbs N applied, ranges from 0.2 to 0.4 in groves with low to moderate yield. However, N efficiencies around 0.5 have been observed in groves with a good production record. Application of 200 lbs N/acre supplies sufficient N for an 800 box/acre or-ange yield when N use efficiency is 0.5. A grower using the latest fertilization technology (e.g. fertigation, controlled-release fertilizers) with good irrigation management may be able to exceed an N use efficiency of 0.5.
3.7. Nutrition, irrigation, and fruit quality
Florida has the highest citrus fruit quality standards in the world. The most important quality factors for Florida cit-rus growers, production managers, processors, and packers include fruit juice content, soluble solids and acid con-centrations, soluble solids/acid ratio, fruit size, and color. Florida citrus growers discern between quality factors for the fresh and processing markets. For example, fruit size, shape, color, and maturity date are most important for fresh fruit, but high juice content and soluble solids are de-sired for processed fruit. Fruit quality is affected by factors including cultivar, rootstock, climate, soil, pests, irrigation, and nutrition.
The effects of nutrition and irrigation on fruit quality should be understood and taken into consideration by citrus growers to increase profitability, enhance sustain-ability, and improve worldwide competitiveness. Exces-sive irrigation and fertilization reduce fruit quality, so supplying sufficient nutrition and using sound irrigation scheduling techniques should be high priorities of every grower. Citrus trees require a properly designed, operated, and maintained water management system and a balanced nutrition program formulated to provide specific needs for tree maintenance and expected yield and fruit quality.
Irrigation is a major component of fertilizer program ef-ficiency. Citrus trees with sufficient water and nutrients grow stronger, tolerate pests and stresses better, yield more consistently, and produce high quality fruit. On the other hand, excessive or deficient irrigation or fertilization may result in reduced fruit quality.
Table 3.3. Total amounts of various nutrients in 100 boxes1 of orange fruits.
NutrientHamlin2 Hamlin3 Hamlin4 Parson
Brown3 Valencia3 Sunburst3 Average
lbs nutrient/100 boxes of fruitN 12.5 10.6 10.8 11.3 13.5 13.6 12.1P 1.4 1.5 1.7 1.5 2.0 1.8 1.7K 17.6 13.6 13.9 13.3 14.4 14.0 14.5
Ca 4.5 4.0 5.2 4.9 4.3 3.4 4.4Mg 1.9 1.1 1.0 1.2 1.2 1.0 1.2
S 1.1 --- 0.8 --- --- --- 1.0Fe 0.024 0.020 0.036 0.030 0.072 0.036 0.036B 0.020 --- 0.025 --- --- --- 0.023
Zn 0.020 0.032 0.008 0.032 0.029 0.041 0.027Mn 0.011 0.020 0.004 0.023 0.023 0.023 0.017Cu 0.006 0.005 0.006 0.006 0.007 0.007 0.006
11 box of fruit = 90 lbs. 2A. K. Alva, unpublished data. 3Paramasivam et al. (2000). 4Mattos et al. (2003).

22 23
The most important management practices influencing fruit quality are irrigation and N, P, and K nutrition. Some micronutrients like B and Cu can also affect fruit quality, but only if they are deficient. In general, when any nutrient element is severely deficient, fruit yield and fruit quality may be negatively affected.
Trends in fruit quality response to increasing nutrient and water availability are described and summarized below:
Nitrogen• Increases juice volume and color, total soluble solids
(TSS), and acid concentration.• Increases TSS/box and TSS/per acre. However, exces-
sive N, particularly with inadequate irrigation, can result in lower yields with lower TSS/acre.
• Decreases fruit size and weight.• Increases green fruit at harvest. High N may delay color
break and increase re-greening of Valencia oranges.• Increases creasing and scab on susceptible varieties, but
decreases peel blemishes like wind scar, mite russeting, and rind plugging.
• Reduces stem-end rot and green mold of fruit in storage.
Phosphorus• Reduces acid concentration, which increases TSS/acid
ratio.• Increases number of green fruit.• Reduces peel thickness.• Increases expression of wind scar but reduces that of
russeted fruit.
Potassium• Decreases juice content, TSS, TSS/acid ratio, and juice
color.• Increases acid content.• Increases fruit size, weight, green fruit and peel thick-
ness.• Reduces splitting, creasing, and fruit plugging.• Reduces stem-end rot of fruit in storage.
Magnesium• Slightly increases TSS/box and TSS/acid ratio.• Slightly increases fruit size and weight.• Decreases rind thickness.
Irrigation• Increases juice content and TSS/acid ratio.• Reduces TSS and acid concentration.
• Increases fruit size and weight, and green fruit at harvest.• Decreases peel thickness.• Increases blemish from wind scar, scab and Alternaria
brown spot (overhead irrigation only), but reduces rind plugging.
• Reduces stem-end rot, but increases green mold of fruit in storage.
Specific effects on juice and external fruit qualities summa-rized in Table 3.4 are based on numerous field experiments conducted for many years that evaluated the response of oranges to irrigation and fertilization practices. Most of these effects were consistently observed, but some of them appeared to depend on local conditions and grow-ing regions. These observations are useful to help develop a strategy aimed at improving fruit quality for a particular variety or location.
3.8. Grove management practices
Management practices that improve fertilizer nutrient-use efficiency include:• Using a leaf and soil testing program (Chapter 4).• Using precision fertilizer application (Chapter 5).• Selecting fertilizer materials and rates that match nutri-
ent requirements (Chapters 6 and 8).• Carefully placing fertilizer over the root zone (Chapter 7).• Timing to avoid the rainy season (Chapters 8 and 10).• Split applications (Chapter 8).• Applying N fertilizer at a rate consistent with historical
or expected production (Chapter 8).• Irrigation management to maximize production and
minimize leaching (Chapter 9).
Groves with non-nutritional limiting factors do not produce more fruit if the grower exceeds basic fertil-izer requirements in an attempt to boost yield. Instead, excess fertilizer is not used by the tree, efficiency declines, and potential for leaching loss increases.
3.9. Interactions of nutrition with other grove practices
Nutrition management interacts with irrigation, pest control, weed management, and vegetative growth control (hedging and topping). Nutrition and irrigation are linked through fertigation and the need to provide maximum nutrient uptake while minimizing nutrient leaching. Water and nutrient uptake efficiency increases as trees mature due to greater interception by closely interwoven root sys-tems. Fertilization and irrigation outside the root zone is

22 23
economically and environmentally unsound and promotes weed growth.
Nutrient considerations for pest control
Luxuriant growth caused by excessive fertilization or ir-rigation may increase incidence of foliar diseases like citrus canker and fungal diseases like scab, Alternaria brown spot, and post-bloom fruit drop (PFD). Excessive vegeta-tive growth may also increase insect pest problems includ-ing the citrus leafminer and the Asian citrus psyllid, which vectors Huanglongbing (citrus greening) disease. Con-trolling tree growth at containment size through pruning is more difficult when vegetative growth is promoted by
excessive inputs. Such excess vegetative growth competes with fruit production and may suppress it.
Until specific fertilization recommendations for groves infected with citrus greening disease are developed, groves should be provided with sufficient nutrition to maintain current fruit production (Chapter 8). However, if a grove is being visually monitored for greening symptoms, it is important to minimize signs of micronutrient (Zn, Mn, Fe) deficiencies so the disease can be more easily detected. Likewise, tree growth (particularly of young trees) during the fall and winter makes it difficult to control psyllids, so fertilizer application during this period should be mini-mized.
Table 3.4. Increasing levels of nutrients within recommended ranges result in the responses shown, whereas excess nutrition can reduce fruit yield and quality (Koo, 1988). Key to symbols: Increase (+), Decrease (–), No change (o), No information (?).
Measurement Macronutrient element Micronutrient element
IrrigationN P K Ca Mg Mn Zn Cu Fe B
Juice qualityJuice content + + o o o o o o o o +
Soluble solids (SS) + o – o + o o o + o –Acid (A) + – + o o o o o o o –
SS/A ratio – + – o + o o o o o –Juice color (red) + o – ? ? ? ? ? ? ? o
Juice color (yellow) + o – ? ? ? ? ? ? ? +Solids/box + o – o + o o o + o –Solids/acre + + + o + o o o o o +
External fruit qualitySize – o + o + o o o o o +
Weight – o + o + o o o o o +Green fruit + + + o o o o o o +
Peel thickness + – + o – o o o o o –Peel blemishes
Wind scar – + o ? ? ? ? ? ? ? +Russet – – o ? o o o o o o o
Creasing + + – ? ? ? ? ? ? ? oPlugging – o – ? ? ? ? ? ? ? –
Scab + o o ? ? ? ? ? ? ? +Storage decay
Stem-end rot – o – ? ? ? ? ? ? ? –Green mold – o o ? ? ? ? ? ? ? +
Sour rot o o o ? ? ? ? ? ? ? o

24 25
4.1. Introduction
Nutrient deficiency or excess will cause citrus trees to grow poorly and produce sub-optimal yield and/or fruit quality. Diagnosis of potential nutritional problems should be a routine citrus-growing practice. Quantifying nutrients in soils and trees eliminates guesswork in adjusting a fertilizer program (Fig. 4.1).
Fig. 4.1. Proper soil and leaf tissue sampling and analysis can accurately gauge citrus grove nutrition and help improve fertil-izer programs. (Mongi Zekri)
This chapter explains the value of leaf and soil analysis in determining fertilizer programs that increase fertilizer efficiency while maintaining maximum yield and desir-able fruit quality. Soil testing and leaf tissue testing have different uses or purposes depending on the property or nutrient, so care must be taken to use the correct test when diagnosing citrus nutrition (Table 4.1).
4.2. Benefits of leaf analysis
Leaf tissue analysis is the quantitative determination of the total mineral nutrient concentrations in the leaf. Tissue testing includes analysis for N, P, K, Ca, Mg, S, Mn, Zn, Cu, Fe, and B. Chlorine concentration is usually sufficient given most field conditions, but Cl may become exces-sive where soil or irrigation water is saline. Similarly, Mo deficiency or toxicity is rare. The goal in tissue analysis is to adjust fertilization programs such that nutritional prob-lems and their costly consequences are prevented.
Table 4.1. Summary of the usefulness of soil testing and leaf tissue testing as citrus nutrient management tools.
Property or nutrient Soil testing Leaf testingpH √
Organic matter √N √P √ √K √
Ca √ √Mg √ √Cu √ √
Zn, Mn, Fe, B √
Leaf analysis is a useful tool to detect problems and adjust fertilizer programs for citrus trees because leaf nutrient concentrations are the most accurate indicator of fruit crop nutritional status. Because citrus is a perennial plant, it is its own best indicator of appropriate fertilization. Leaves reflect nutrient accumulation and redistribution throughout the plant, so the deficiency or excess of an element in the soil is often reflected in the leaf. Consider-able research involving citrus leaf testing has established its reliability as a management tool, but sampling guide-lines should be followed precisely to insure that analytical results are meaningful.
Tissue analysis:• Determines if the tree has had a sufficient supply of
essential nutrients.• Confirms nutritional deficiencies, toxicities or
imbalances.• Identifies hidden toxicities and deficiencies when visible
symptoms do not appear.• Evaluates the effectiveness of fertilizer programs.• Provides a way to compare several fertilizer treatments.• Determines the availability of elements not tested for by
other methods.
Leaf analysis integrates all the factors that might influence nutrient availability and uptake. Tissue analysis shows the relationship of nutrients to each other. For example, K deficiency may result from a lack of K in the soil or from excessive Ca, Mg, and/or Na. Similarly, adding N when K is low may result in K deficiency because the increased growth requires more K.
4. Soil and Leaf Tissue TestingThomas A. Obreza, Mongi Zekri, and Edward A. Hanlon

24 25
4.3. Steps in leaf sampling
Procedures for proper sampling, preparation and analysis of leaves have been standardized to achieve meaningful comparisons and interpretations. If done correctly, the reliability of the chemical analysis, data interpretation, fertilization recommendations, and adjustment of fer-tilizer programs will be sound. Therefore, considerable care should be taken from the time leaves are selected for sampling to the time they are received at the laboratory for analysis.
Leaf sample timing
• Leaf samples must be taken at the correct time of year because nutrient concentrations within leaves continu-ously change. As leaves age from spring through fall, N, P, and K concentrations decrease, Ca increases, and Mg first increases and then decreases (Fig. 4.2). However, leaf mineral concentrations are relatively stable from 4 to 6 months after emergence in the spring.
• The best time to collect 4 to 6-month-old spring flush leaves is July and August (Fig. 4.3). If leaves are sampled later in the season, summer leaf growth can easily be confused with spring growth.
Leaf sampling technique
• A sampled citrus grove block or management unit should be no larger than 20 acres. The sampler should make sure that the selected leaves represent the block being sampled.
• Each leaf sample should consist of about 100 leaves taken from non-fruiting twigs of 15 to 20 uniform trees of the same variety and rootstock that have received the same fertilizer program.
• Use clean paper bags to store the sample. Label the bags with an identification number that can be referenced when the analytical results are received.
• Avoid immature leaves due to their rapidly changing composition.
• Do not sample abnormal-appearing trees, trees at the edge of the block, or trees at the end of rows because they may be coated with soil particles and dust.
• Do not include diseased, insect-damaged, or dead leaves in a sample.
• Select only one leaf from a shoot and remove it with its petiole (leaf stem).
Fig. 4.2. Changes in concentration of N, P, K, Ca, and Mg in citrus leaves with age. The shaded areas denote the recom-mended sampling period and the optimum concentration range for each element.
Fig. 4.3. Sample 4 to 6-month-old spring flush leaves from non-fruiting twigs. (Thomas Obreza)

26 27
Special Case: Diagnosing growth disorders
• Collect samples from both affected trees as well as nor-mal trees.
• Trees selected for comparison sampling should be of the same age, scion type, and rootstock.
• If possible, confine the sampling area to trees that are close to each other.
Handling of leaf samples
• Protect leaves from heat and keep them dry. Place them in a refrigerator for overnight storage if they cannot be washed and oven dried the day of collection.
• For macronutrient analysis, leaves do not need to be washed.
• If accurate micronutrient analysis is desired, the leaves will need to be washed (see below).
• Dry the leaves in a ventilated oven at about 140º F.
Preparation for analysis
• Leaves that have been sprayed with micronutrients for fungicidal (Cu) or nutritional (Mn, Zn) purposes should not be analyzed for those elements because it is almost impossible to remove all surface contamination from sprayed leaves.
• For accurate Fe and B or other micronutrient determi-nations, leaf samples require hand washing that is best done shortly after collection before they dehydrate.
• For micronutrient determinations, rub the leaves be-tween the thumb and forefinger while soaking them in a mild detergent solution, then thoroughly rinse with pure water. It is difficult to remove all surface residues, but this procedure removes most of them.
Analysis and interpretation
• The laboratory determines the total concentration of each nutrient in the leaf sample. Since total concentra-tion is determined, there should be no difference in leaf analysis results between different laboratories.
• To interpret laboratory results, compare the values with the leaf analysis standards in Table 4.2. These standards are based on long-term field observations and experi-ments conducted in different countries with different citrus varieties, rootstocks, and management practices, and are used to gauge citrus tree nutrition throughout the world.
• The goal in nutrition management is to maintain leaf nutrient concentrations within the optimum range (Table 4.2) every year. If the interpretation for a par-ticular nutrient is not optimum, various strategies can be used to address the situation (Table 4.3).
4.4. Benefits of soil analysis
Soil analysis measures organic matter content, pH, and extractable nutrients, which are useful in formulating and improving a fertilization program. Soil analysis is particu-larly useful when conducted for several consecutive years so that trends can be observed. However, a citrus grower cannot rely on soil analysis alone to formulate a fertilizer program or diagnose a nutritional problem in a grove.
Similar to leaf analysis, methods to determine organic mat-ter and soil pH are universal, so results should not differ between laboratories. However, soil nutrient extraction procedures vary from lab to lab. Several accepted chemical procedures exist that remove different amounts of nutri-ents from the soil because the extractants vary in strength. To draw useful information from soil tests, consistency in use of a single extraction procedure from year to year is im-portant to avoid confusion when interpreting the amount of nutrients extracted.
A soil extraction procedure does not measure the total amount of nutrients present, nor does it measure the quan-tity actually available to citrus trees. A perfect extractant would remove nutrients from the soil in amounts that are exactly correlated with the amount available to the plant. Therefore, the utility of a soil testing procedure is how well the extractable values correlate with the amount of nutri-ent a plant can take up. The process of relating these two quantities is called calibration.
A soil test is only useful if it is calibrated with plant re-sponse. Calibration means that as a soil test value increas-es, nutrient availability to plants increases in a predictable way (Fig. 4.4). Low soil test values imply that a crop will respond to fertilization with the particular nutrient in question. High soil test values indicate the soil can supply all the plant needs, so no fertilization is required. The soil test value that separates predicted fertilizer response from non-response is called the critical or sufficiency soil test value (Fig. 4.5).
In Florida, soil testing for mobile, readily leached elements like N and K has no practical value. In addition to organic matter and pH, soil testing is important for P, Mg, Ca, and Cu. The Univ. of Florida Extension Soil Testing Labora-tory (ESTL) has used the Mehlich 1 (double acid) extrac-

26 27
Table 4.2. Guidelines for interpretation of orange tree leaf analysis based on 4 to 6-month-old spring flush leaves from non-fruiting twigs (Koo et al., 1984).
Element Unit of measure Deficient Low Optimum High ExcessN % < 2.2 2.2 – 2.4 2.5 – 2.7 2.8 – 3.0 > 3.0P % < 0.09 0.09 – 0.11 0.12 – 0.16 0.17 – 0.30 > 0.30K % < 0.7 0.7 – 1.1 1.2 – 1.7 1.8 – 2.4 > 2.4
Ca % < 1.5 1.5 – 2.9 3.0 – 4.9 5.0 – 7.0 > 7.0Mg % < 0.20 0.20 – 0.29 0.30 – 0.49 0.50 – 0.70 > 0.70Cl % --- --- < 0.2 0.20 – 0.70 > 0.701
Na % --- --- --- 0.15 – 0.25 > 0.25Mn mg/kg or ppm2 < 18 18 – 24 25 – 100 101 – 300 > 300Zn mg/kg or ppm < 18 18 – 24 25 – 100 101 – 300 > 300Cu mg/kg or ppm < 3 3 – 4 5 – 16 17 – 20 > 20Fe mg/kg or ppm < 35 35 – 59 60 – 120 121 – 200 > 200B mg/kg or ppm < 20 20 – 35 36 – 100 101 – 200 > 200
Mo mg/kg or ppm < 0.05 0.06 – 0.09 0.10 – 2.0 2.0 – 5.0 > 5.01Leaf burn and defoliation can occur at Cl concentration >1.0%. 2ppm = parts per million.
Table 4.3. Adjusting a citrus fertilization program based on leaf tissue analysis.
Nutrient What if it is less than optimum in the leaf ? Options:
What if it is greater than optimum in the leaf ? Options:
N
1. Check yield.2. Check tree health.3. Review water management.4. Review N fertilizer rate.
1. Check soil organic matter.2. Review N fertilizer rate.
P 1. Apply P fertilizer (see Chapter 8). 1. Do nothing.
K 1. Increase K fertilizer rate (see Chapter 8).2. Apply foliar K fertilizer.
1. Decrease K fertilizer rate.
Ca
1. Check soil pH.2. Check soil test Ca status.3. Consider applying lime or soluble Ca fertilizer
depending on soil pH.
1. Do nothing.
Mg
1. Check soil test Mg status.2. Check soil pH.3. Consider applying dolomitic lime or soluble Mg
fertilizer depending on pH.
1. Do nothing.
Micronutrients1. Check soil pH and adjust if needed.2. Apply foliar micronutrients.3. Include micronutrients in soil-applied fertilizer.
1. Check for spray residue on tested leaves.2. Do nothing.

28 29
tion procedure since 1977. The Mehlich 1 test was devel-oped for sandy soils with pH < 6.5, CEC < 10 meq/100 g, and organic matter < 5%. Most of the soils used to pro-duce citrus in Florida meet these criteria. The exceptions are the calcareous soils of the Indian River production area that do not meet the pH requirement.
Univ. of Florida soil test interpretations for P, K, and Mg (Table 4.4) were established from experiments with an-nual field and vegetable crops conducted for many years. Limited soil test calibration work with Florida citrus trees suggests that the interpretations in Table 4.4 are suitable for citrus.
Some commercial agricultural laboratories use the Me-hlich 1 extraction procedure, but others use procedures different from Mehlich 1 as their preferred soil test method. Additional extractants used to determine P include Mehlich 3, ammonium acetate buffered at pH 4.8,
and Bray P1. Other extractants for Ca and Mg include Mehlich 3 and ammonium acetate buffered at either pH 4.8 or pH 7.0. Some interpretations for these extractants were developed by Koo et al. (1984) through experimen-tation, field observation, and best professional judgment (Table 4.5). Others were derived from correlations with the Mehlich 1 extractant (Alva, 1993; Sartain, 1978).
The single most useful soil test in a citrus grove is for pH. Soil pH greatly influences nutrient availability (Fig. 3.2). Some nutrient deficiencies can be avoided by maintain-ing soil pH between 6.0 and 6.5. Deficiencies or toxicities are more likely when the pH is outside this range. If soil pH is too low, the soil test laboratory runs a buffer test to determine the rate of lime need to raise the top 6 inches of soil to pH 6.5.
In some cases, soil tests can determine the best way to cor-rect a deficiency identified by leaf analysis. For example, Mg deficiency may result from low soil pH or excessively high soil Ca. Dolomitic lime applications are advised if the pH is too low, but magnesium sulfate is preferred if soil Ca is very high and the soil pH is in the desirable range. If soil Ca is excessive and soil pH is relatively high, then foliar application of magnesium nitrate is recommended.
A poor relationship may exist between soil test values and leaf nutrient concentrations in perennial crops like citrus. Often fruit trees contain sufficient levels of a nutrient even though the soil test is low. On the other hand, a high soil test does not assure a sufficient supply to the trees. Tree nutrient uptake can be hindered by problems like drought or flooding stress, root damage, and cool weather. Tissue analysis combined with soil tests can help identify the problem.
4.5. Steps in soil sampling
Standard procedures for sampling, preparing, and analyz-ing soil should be followed for meaningful interpretations of the test results and accurate recommendations.
Soil sample timing
• In Florida, soil samples should be collected once per year at the end of the summer rainy season and before fall fertilization (August to October).
• It is convenient to take annual soil samples when col-lecting leaf samples to save time and reduce cost.
• The accuracy of soil test interpretations depends on how well the soil sample represents the grove block or management unit in question.
Fig. 4.4. Ideal soil test calibration curve.
Fig. 4.5. Soil test interpretation categories and their relation-ship to expected fertilizer response.

28 29
Table 4.4. Interpretation of soil analysis data for citrus using the Mehlich 1 (double-acid) extractant.
Soil test interpretation
ElementVery Low Low Medium High Very High
mg/kg (ppm)1
P < 10 10 – 15 16 – 30 31 – 60 > 60Mg2 --- < 15 15 – 30 > 30 ---Ca2 2503 > 250Cu < 254 25 – 505 > 506
1parts per million (ppm) x 2 = lbs/acre.2A Ca-to-Mg ratio greater than 10 may induce Mg deficiency.3 The Univ. of Florida Extension Soil Testing Laboratory does not interpret extractable Ca. Work with Florida citrus trees suggests that a Mehlich 1 soil test Ca of 250 mg/kg or greater is sufficient.
4Cu toxicity is unlikely even if soil pH is less than 5.5.5Cu toxicity is possible if soil pH is less than 5.5.6Cu toxicity is likely unless soil pH is raised to 6.5.
Table 4.5. Soil test interpretations for other extraction methods compared with Mehlich 1.
Extractant Nutrient
Soil test interpretation
Very Low Low Medium High Very High
(Less than sufficient) (Sufficient)Mehlich 1
Pmg/kg (ppm)1
< 10 10 – 15 16 – 30 31 – 60 > 60Mehlich 32 < 11 11 – 16 17 – 29 30 – 56 > 56
Ammonium acetate pH 4.83 ≤ 11 > 11Bray P13 ≤ 40 > 40Bray P23 ≤ 65 > 65
Mgmg/kg (ppm)
Low Medium HighMehlich 1 < 15 15 – 30 > 30Mehlich 34 < 25 25 – 33 > 33
Ammonium acetate pH 4.85 < 14 14 – 26 > 26Less than sufficient Sufficient
Ammonium acetate pH 7.03 ≤ 50 > 50
Camg/kg (ppm)
Less than sufficient SufficientMehlich 1 ≤ 250 > 250Mehlich 34 ≤ 200 > 200
Ammonium acetate pH 4.85 ≤ 270 > 270Ammonium acetate pH 7.03 ≤ 250 > 250
1parts per million (ppm) x 2 = lbs/acre.2Estimated from unpublished correlation data (T. A. Obreza, 2006).3From Koo et al. (1984).4Estimated from correlation data (Alva, 1993).5Estimated from correlation data (Sartain, 1978).

30 31
Soil sampling technique
• Each soil sample should consist of one soil core taken about 8 inches deep at the dripline of 15 to 20 trees within the area wetted by the irrigation system in the zone of maximum root activity (Fig. 4.6).
• Sampled areas should correspond with grove blocks where leaf samples were collected. The area should con-tain similar soil types with trees of roughly uniform size and vigor.
• Thoroughly mix the cores in a non-metal bucket to form a composite sample. Take a subsample from this mixture and place it into a labeled paper bag.
Fig. 4.6. Sample soil near the dripline of the trees, not in the row middle. (Thomas Obreza)
Special case: Diagnosing growth disorders
• Collect soil samples from beneath affected trees as well as normal trees and analyze them separately.
• If possible, confine the sampling area to trees that are close to each other.
Preparation for analysis
• Soil samples should be air-dried before shipping to the laboratory for analysis.
Analysis and interpretation
• The basic soil analysis package run by most agricultural laboratories includes soil pH and extractable P, K, Ca, and Mg. Organic matter is sometimes part of the basic package or it may be a separate analysis. Extractable Cu is normally determined upon request.
• Since extractable nutrients are measured, the mag-nitude of soil test values may differ between different
laboratories, but this difference is not a concern as long as the extraction method is calibrated for citrus.
• The laboratory interprets each soil test result as very low, low, medium, high, or very high, and may also provide fertilizer recommendations accordingly. Cit-rus growers can independently interpret the numerical results according to UF-IFAS guidelines based on the extractant used (Tables 4.4 and 4.5).
• The interpretations should be used to make manage-ment decisions regarding soil pH adjustment or fertil-izer application (Table 4.6).
4.6. Traditional vs. alternative sampling strategies
A practical nutrient management strategy uses tissue and soil analysis results as tools to help determine nutrient requirements for large grove blocks, followed by uniform fertilizer application across the entire area. An inherent problem with this approach is that some trees may be over-fertilized and others may be under-fertilized. Citrus grove variability is common, especially on flatwoods soils. It is important to take this variability into consideration so the grove can be managed more efficiently.
A basic principle of traditional sampling is to return to roughly the same sampling locations from year to year. This technique assumes that the selected area is less vari-able but also representative of the entire grove or major portion of the block. Representative sites are selected based on tree observation, past experience, crop yield, soil type, and/or remotely-sensed images. Traditional sampling minimizes sampling errors, the number of samples taken, cost, and time required, but it does not fully indicate field variability.
With technological advances, the popularity of grid sam-pling for precision agriculture has increased in Florida’s citrus industry. The first step in this strategy is to place a 1 to 5-acre grid over a grove map. The second step is to take soil and/or leaf samples either at the center of each grid section or at the point where the grid lines intersect (Fig. 4.7). The individual taking the samples records the geographic location of each point with a Global Position-ing System (GPS) instrument. The third step is to match the analysis results with the geographic data and construct variability maps using Geographic Information System (GIS) software. If appropriate, fertilizer or lime may be custom-applied using an applicator equipped with variable rate technology (VRT).

30 31
Fig. 4.7. Example of the grid sampling strategy for selecting soil and leaf sampling locations. The red dots show pre-determined sampling locations that will be recorded with GPS equipment and used to construct variability maps.
Nutrient management using grid sampling information is still in development and more research is needed before VRT becomes widely used to manage Florida citrus tree nutrition. Dense grid sampling can be quite expensive and has limited practicality. Growers should carefully compare the potential for a positive return with the cost of the pro-gram before employing this method.
Between traditional and grid sampling strategies lies the “management zone” method (Fig. 4.8). Knowledge of grove characteristics such as soil types, high and low yielding areas, soil water and nutrient holding capacities, and depth to the water table allows a grower to delineate management zones. The zone concept requires less sam-pling than the grid method, but it is more targeted than the traditional strategy. With this technique, different fertilizer rates can be applied to a smaller number of zones without VRT equipment.
Growers should remain flexible and prepared to adjust sampling and management strategies. Emerging technol-ogy will continue to refine sampling systems and integrate information such as yield, tree age, tree size, and soil maps, aerial photographs, and satellite images into nutrient man-agement decision-making.
Table 4.6. Adjusting a citrus fertilization program based on soil analysis.
Property or nutrient What if it is below the sufficiency value in the soil? Options:
What if it is above the sufficiency value in the soil? Options:
Soil pH1 1. Lime to pH 6.0.
1. Do nothing.2. Use acid-forming N fertilizer.3. Apply elemental sulfur.4. Change rootstocks.
Organic matter2 1. Do nothing (live with it).2. Apply organic material. 1. Do nothing.
P1. Check leaf P status.2. Apply P fertilizer if leaf P is below optimum (see
Chapter 8).1. Do nothing.
K 1. Apply K fertilizer (see Chapter 8). 1. Lower K fertilizer rate.
Ca 1. Check soil pH and adjust if needed.2. Check leaf Ca status.
1. Do nothing.2. Check leaf K and Mg status.
Mg1. Check soil pH and adjust with dolomitic lime if
needed.2. Check leaf Mg status.
1. Do nothing.
Cu 1. Do nothing. 1. Lime to pH 6.5.1The sufficiency value for soil pH is 6.0.2There is no established sufficiency value for soil organic matter.

32 33
Fig. 4.8. Example of soil and leaf tissue sampling locations using the management zone method. The grove zone area delineated by the blue rectangle is a productive area, while that delineated by the red rectangle is a weak area. The yellow zigzag line denotes the sampling pattern within each manage-ment zone.
4.7. Summary
Tissue and soil analysis are powerful tools to confirm nu-trient deficiencies and toxicities, identify “hidden hunger,” evaluate fertilizer programs, study nutrient interactions, and determine fertilizer rates. However, if any steps in site
selection, sampling, or analysis are faulty, the results may be misleading.
Experience interpreting sample results is essential due to the many interacting factors that influence the concentra-tions of elements in soil and leaf tissue. Tree age, cropping history, sampling techniques, soil test interpretations, and leaf analysis standards all must be considered before making a final diagnosis. If done properly, tissue and soil analysis will lead to more economical and efficient use of fertilizers because excessive or insufficient application rates will be avoided.
4.8. Soil and leaf tissue analysis checklist
Use this checklist as a guide for starting a soil and leaf tis-sue testing program:
A sampling program is most effective if it is done annually.
Leaf tissue testing is valuable for all elements.
Soil testing is most useful for pH, P, Ca, Mg, and Cu.
Use the standard sampling procedures for soil and leaves described in this chapter.
Be aware that spray residues or dust on leaf surfaces af-fect sample results; wash leaves for accurate micronutri-ent analysis. Avoid sampling recently sprayed trees.
Be aware that a number of different soil extracting solu-tions exist, and they can differ in their ability to extract plant nutrients, especially P.
Interpretation of leaf and soil tests should be used to make fertilizer or liming decisions. Wise use of the results allows optimal citrus production and minimizes fertilizer loss.

32 33
5.1. Common elements of precision agriculture
The term precision agriculture includes equipment that improves citrus management for high quality fruit produc-tion. Proper water management is a key component for efficient nutrient management, and precision agricultural tools may improve nutrient and water-use efficiencies. In turn, producers can anticipate lower production costs through effective nutrient and water resource manage-ment with the expectation of sustained high yields and improved chance for profit.
• Remotesensing applies to non-destructive measure-ments. Remote sensing typically involves acquiring and processing satellite or aerial images photographed in the visible or near-infrared portions of the spectrum. Useful information derived from remote sensing includes grove variability, tree canopy size and health, soil type, and water stress in trees. Today, many more tools are avail-able including ultrasonic and laser scanners for canopy volume or electro-magnetic soil sensors for detecting profile properties below ground.
• A geographic information system (GIS) is a comput-erized “graphic database” allowing storage, retrieval, display and processing of digital images or drawings with known positions on the earth’s surface. Several technologies are involved with GIS. Maps of an area can be digitized and used to plot positional information captured from global positioning system receivers. Dif-ferences in spectral reflectance of groves from aerial or satellite images can be used by grove managers to locate high yielding or low yielding areas within a grove.
• By obtaining signals from several satellites, a global po-sitioning system (GPS) can be used to precisely locate a position on the earth’s surface, within a grove, or specific trees within a grove. This system works equally well to locate the path of a vehicle through the grove. Position location (geo-referencing of data, observations, objects, maps and images with GPS) is an essential prerequisite for meaningful processing and display on a GIS.
• Mobilecomputinganddatastorage: Portable comput-ers collect and analyze sensor data, GIS information, and GPS data streams. The integration of these technologies allows for decision management on the fly as a vehicle moves through the grove. Handheld computers are valu-
able for making and recording field observations during scouting, leaf sampling or soil surveying. When used in conjunction with a GPS and GIS software, a handheld computer can be used to navigate through the field, which allows location and marking of trees, plots, soil types or other information already contained in the GIS.
• Soilmapping: Once the purview of the USDA-Natural Resource Conservation Service (NRCS), most county soil surveys and related maps have been digitized. These maps can be used as one of the layers in a GIS decision management system. Soil mapping with geophysical survey or electromagnetic induction instruments such as the EM38 (Geonics, LTD), or the Veris 3000 (Veris Technologies) allows rapid collection of digital geo-ref-erenced map data correlated with chemical and physical properties of soil profiles.
• Variable-rateinputs: Using the technologies described above, grove managers can use additional controllers on traditional agricultural equipment to precisely apply fertilizers and other chemicals at spatially-varying rates as needed.
5.2. Objectives of precision agriculture for nutrient management
Many possible objectives exist for different precision agriculture programs. Four important objectives related to citrus nutrient management are:
• Reduce fertilizer amounts per unit land area to lower citrus production costs.
• Increase fertilizer nutrient use efficiency to lower envi-ronmental impacts.
• Increase fruit yield and quality.• Automate and digitally record grove operations to
speed data analysis and increase efficiency and conve-nience.
5.3. Remotesensing
5.3.1. Field measurements of soil electrical conductivity
Soil profile properties can be measured remotely using geophysical survey or electrical conductivity (EC) sen-sors. The use of EC sensors for nutrient management is an indirect measurement, reflecting the dissolved salt and hence also the ion concentrations in the soil. Since fertil-
5. Precision Agriculture for Citrus Nutrient ManagementArnold W. Schumann and Edward A. Hanlon

34 35
izers are salts, changes in dissolved and adsorbed fertilizer can be sensed as changes in electrical conductivity. Since the measurement involves all salts in the soil, the portion attributed to fertilizer can only be estimated, but has been attempted for some crops in uniform soils with relatively small changes in salinity. Both nutrients and salts from other sources (e.g. saline well water) are measured by this remote sensing equipment. Distinguishing salty water from fertilizer salts can be difficult, especially if the soil varies naturally throughout the grove.
Another use of this type of sensor is to detect limiting layers in soil profiles. A soil must provide sufficient soil volume for proper tree root growth and nutrient uptake. Improper soil volume for tree root growth may lead to tree stunting with resulting loss of yield and quality, or tree mortality. Common soil profile limitations in citrus production are described below.
• Along the central Florida ridge production area, soils are deep and well-drained, but are infertile and droughty.
• In citrus flatwoods production areas, root damage may result from shallow (perched) water tables and associ-ated capillary rise.
• Flatwoods production areas exhibit shallow clay lay-ers and/or cemented spodic horizons that restrict or prevent root growth.
• In most citrus production areas, soils are sandy with low organic matter content and fertility, especially in the E-horizon of the subsoil.
• Citrus grove soils are often prone to soil compaction due to vehicular traffic.
Since field EC can be measured with mobile sensors, these data can be linked with GPS information to create relevant maps of each grove.
5.3.2. Ultrasonic canopy measurements
Citrus tree canopy height and volume can be measured remotely using a vertical sensor array that sends out ultra-sonic pulses and detects the distance to the tree canopy (Fig. 5.1). The sensor array has a differential global posi-tioning satellite system (DGPS) instrument that records its position within the grove. Both the DGPS and ultra-sound readings are recorded and processed by a computer program to create a map of the canopy volumes within the grove (Fig. 5.2).
Calculated canopy volumes (light green) are superimposed on an aerial photograph of the grove (Fig 5.2), which has a
considerable number of resets. From this map, tree canopy sizes can be displayed on a frequency diagram (Fig 5.3). When shown in this manner, new resets, resets planted in 1989 after a freeze, and original grove trees can be identified.
Since citrus yield is directly related to canopy volume, this type of diagram can help growers make decisions concern-ing long-term operations within their groves. For example, this grove has a wide range of canopy volumes and can be expected to have a considerable range in yield as well. Managing for somewhat less canopy volume variability in this grove could improve yields and reduce environmental impacts of agrichemicals.
Canopy volume measurements can also be used to aid other management strategies like changes in irrigation for drought or delineation of wet zones within the grove, soil textural changes that influence tree growth in produc-tion, etc.
Fig. 5.1. Sensing the height and volume of the tree canopy.
Fig. 5.2. Map of citrus tree canopy volume.

34 35
Fig. 5.3. Frequency histogram of tree size within a citrus grove.
5.3.3. Citrus yield mapping
An automatic tub position logger can record the grove position where fruit was harvested using GPS technology (Fig. 5.4). One tub (red dot) is equivalent to 10 boxes of fruit. Yield maps produced from the positioning data and the number of tubs per unit grove area can be used to iden-tify both high and low production sites within the grove. In the example shown in Fig. 5.5, the high yield locations are dark green (maximum yield of 543 boxes/acre). Low yielding locations (light yellow) produced only 181 boxes per acre. The average for the entire grove was 336 boxes per acre. Fertilizer savings can be realized by applying the rate of fertilizer needed by the trees based on their yield (Section 8.2, Fig. 8.3) using yield maps like the one in Fig. 5.5 with a variable rate fertilizer applicator (Section 5.4).
5.4. Precision nutrient application – Variable rate fertilization
After determining canopy volume and yield throughout the grove, the next step is to apply fertilizers only where supplemental nutrients are needed. Variable rate fertilizer spreaders can reduce fertilizer use in citrus groves by as much as 40%. In addition to reducing production costs, risk of nutrient movement from the grove is minimized. In variable rate fertilization of citrus groves, granular fertilizer is accurately placed in independent left and right ‘bands’ under the trees. The amount of fertilizer is regulated ac-cording to either a GPS-guided prescription map, or by the number of sensors that detect a tree canopy in left- or right-hand rows.
Roots are the primary target for fertilizer applications, and their growth pattern in the soil follows tree canopy volume growth above the surface. Fertilizer should not be placed
Fig. 5.4. Locations of harvested tubs of fruit are marked by the red dots.
Fig. 5.5. Citrus yield map identifying areas of high (dark green) and low (yellow) production.

36 37
where roots are not present. Tree spacing and bedding also affects root growth patterns. Immature trees or resets should not receive the same fertilization as mature trees (see Chapter 8). If dry fertilizer is uniformly band-applied to a grove with varying tree sizes, fertilizer will be wasted (Fig. 5.6). This problem can be solved with variable rate application equipment that uses canopy sensors in a look-ahead mode, rapidly positioning fertilizer dispenser valves on each side of the spreader to:
• Avoid dispensing fertilizer where there are no trees.
• Adjust the applied fertilizer rate based on tree size (canopy volume).
• Make these measurements and valve adjustments in a synchronized fashion as the spreader is moving through the grove.
Fig. 5.6. Areas in the tree row where fertilizer can be wasted when using simple band placement. The fertilizer bands cover considerably more area than the area in which citrus roots are located. Fertilizer applied in areas without roots is wasted.
Sensing and valve adjustment must be automatically syn-chronized with the speed of the application equipment to apply fertilizer properly to the correct trees. Variable rate fertilization is most effective in groves with high spatial variability because the technology is designed to exploit variability. Perfectly uniform groves with no gaps between canopies would not benefit from variable rate technology. A grove containing a mixture of mature trees, young trees, and/or resets (such as that in Fig 5.3) will benefit the most from using this technology to apply fertilizers.
Not all variable-rate applicator controllers perform well on the fly. Some commercial controllers do not support the
look-ahead feature to allow accurate fertilizer placement under trees while avoiding other locations where fertil-izer is not needed. Other controllers and their valves have response times that are too slow to cope with the rapidly changing fertilizer requirements of a variable grove.
Fig. 5.7 shows the use of photoelectric diffuse reflectance sensors with look-ahead and tree height sensing capabili-ties. Sensor angle increases with vertical height allowing sensors to be placed lower than the height of the tallest trees. For smaller trees, the angle of the sensors is de-creased. Trigonometry calculations allow the estimate of sensor height to be calculated accurately as a function of the sensor angle. Compare the benefits of this sensor arrangement with that in Fig. 5.1, and note the reduced height of the sensor array in Fig. 5.7.
Fig. 5.7. Variable rate fertilization is linked to measurements of tree height.
Since canopy volume is related to yield and tree height, fer-tilizer rates can be adjusted based on tree height. The pro-portion of fertilizer to be applied is shown as a function of tree height in Fig. 5.7. The look-ahead sensing capability must be coupled with the mechanical parts of the fertilizer application equipment. Calculations must be based on the ground speed of the vehicle, the height of the tree, and the time delay for the equipment to respond to the demand for changing fertilizer rates.
Slow reaction time for a variable rate application system means that fertilizer will be applied at the wrong rates (Fig. 5.8). To avoid this bias in fertilizer application, the variable rate application system must be responsive and properly tuned. When purchasing a variable rate spreader, insist on rapid response times and look-ahead sensing us-ing well-matched components. The target rate is the UF/IFAS recommended fertilizer rate proportioned using the percentages shown in Fig. 5.7 for applicable tree heights in this particular example. A rule of thumb is not to reduce

36 37
variable fertilizer rates based on tree height to less than 50% of the maximum rate used. The smallest trees have a less efficient root system and a smaller horizontal canopy profile that further reduces the applied rates.
Fig. 5.8. Bias in actual applied fertilizer rate compared with the required rate when using a variable rate spreader with slow response times.
5.5. Summary
• Precisionagriculturetoolscanaddconsiderablestrength to grove management decisions.
• Sensingdevicescanbeusedtodeterminewatertabledepth and other soil properties that aid in irrigation, drainage, and fertilizer management decisions.
• Treesensingequipmentcanbeusedtoestimatecanopyvolume and canopy height.
• Canopyvolumeandtreeheightcanbeusedwhenplan-ning tree replacement strategies, fertilizer management, and zone irrigation decisions.
• Incombinationwithvariable-rateapplicatorsandappropriate look-ahead technology, fertilizers can be ap-plied accurately based on tree need and production.
• Grovemanagersshouldconsideruseofprecisionagri-culture tools to keep production costs low and improve citrus yields while avoiding potential environmental concerns.

38 39
6.1. Introduction
Nitrogen fertilizers are classified as inorganic (e.g. am-monium nitrate), synthetic organic (e.g. urea), or natural organic (e.g. animal manure). Inorganic and synthetic organic high-analysis N fertilizers are most economical to use in citrus groves. They are rapidly-available to plants unless coated as a component of controlled-release fertil-izer. Natural organic materials are more slowly available and lower in analysis, so higher application rates of these products are needed to supply equal amounts of available N compared with high-analysis fertilizer. For this reason, they are usually more expensive per unit of N.
The other macronutrients (P, K, Ca, Mg, and S) are usu-ally applied as inorganic fertilizers. An exception is when a grower applies a natural organic material like animal manure that contains a wide range of nutrients. Major P and K fertilizers are manufactured from mined products. Calcium, Mg, and S fertilizers are derived from mined sources like limestone and gypsum.
Micronutrients applied to citrus are usually inorganic or synthetic organic fertilizers. Common micronutrient fertilizers and their analyses are listed in Appendix B. Salt index values (Section 11.5) for typical fertilizer sources and examples of how to calculate the salt index of a fertil-izer blend are shown in Appendix C.
6.2. Solid sources for soil application
Solid sources are typically bulk-blended into N-K2O or complete N-P2O5-K2O fertilizers, often including micro-nutrients, for spreading in citrus groves. Uniform particle size is required to prevent bulk blends from separating during transport to the grove or transfer from delivery trailer to spreader (Fig. 6.1).
Most solid nutrient sources are readily water-soluble and rapidly available for tree uptake (Fig. 6.2; Appendix D, Table D.1). Solid fertilizers are applied with conventional spreading equipment and are sometimes applied by hand to young trees. Common solid sources applied to citrus grove soils include:
Nitrogen• Ammoniumnitrate• Ammoniumsulfate• Urea• Calciumnitrate
• Potassiumnitrate• Diammoniumphosphate
Phosphorus• Ordinarysuperphosphate• Concentratedsuperphosphate• Monoammoniumphosphate• Diammoniumphosphate
Potassium• Potassiumchloride(muriateofpotash)• Potassiumsulfate• Potassium-magnesiumsulfate• Potassiumnitrate
Calcium• Calciumcarbonate(calciticlime)• Calciumsulfate(gypsum)• Calciumnitrate
Magnesium• Magnesiumcarbonate(dolomiticlime)• Potassium-magnesiumsulfate(sul-po-mag)• Magnesiumsulfate• Magnesiumoxide
Sulfur• Ammoniumsulfate• Potassiumsulfate• Potassium-magnesiumsulfate• Ordinarysuperphosphate• Calciumsulfate(gypsum)• Elementalsulfur
6. Fertilizer Sources and FormulationsThomas A. Obreza and Brian J. Boman
Fig. 6.1. Unloading dry solid fertilizer from a delivery trailer to a grove spreader. (Stephen Futch)

38 39
Iron• Ironsulfate• Ironoxy-sulfate• IronEDTAandHEDTA• IronDTPA• IronEDDHA• Ironsucrate• Ironhumate
Manganese• Manganesesulfate• Manganeseoxy-sulfate• Manganeseoxide
Zinc• Zincsulfate• Zincoxide• ZincEDTAandHEDTA
Copper• Coppersulfate
Boron• Borax(Sodiumtetraborate)
Molybdenum• Ammoniummolybdate• Sodiummolybdate
6.3. Solid N fertilizer sources and ammonia volatilization
Loss of N fertilizer through ammonia volatilization is a concern in citrus groves because solid N sources applied to the soil surface are rarely incorporated. Up to 50% of the N in solid urea or ammonium-containing fertilizer sources can volatilize to the atmosphere when applied to citrus under two circumstances: 1) surface-applied ammo-nium fertilizer sources on calcareous or freshly-limed soils; and 2) surface-applied urea on acidic or alkaline soils.
Ammonia is easily lost from urea because it rapidly con-verts to ammonium carbonate following surface appli-cation. If not incorporated or watered in, ammonium carbonate readily decomposes to produce ammonia and carbon dioxide gases. An ammonium carbonate solution has a pH of about 8.6, which causes large ammonia losses whenever the gas is free to escape to the atmosphere as with surface application. Thus, urea volatilizes readily because it creates its own alkaline environment around each granule. If solid urea is dissolved and moved into the soil by irrigation or rainfall immediately after application, volatilization is insignificant.
When ammonium-containing fertilizers are surface-applied to soils containing free calcium carbonate (e.g. calcareous or freshly-limed soils), an alkaline environment is maintained that allows conversion of ammonium ions to ammonia gas. The degree to which this reaction proceeds depends on the anion associated with the ammonium fertilizer. Those N fertilizers that react to form Ca-reaction products of low solubility will lose considerably more ammonia than fertilizers producing reaction products of relatively higher solubility. For example, ammonium sul-fate will produce low-solubility gypsum (CaSO4) in com-bination with soil calcium, while ammonium nitrate will produce highly-soluble calcium nitrate. Thus, if ammo-nium sulfate and ammonium nitrate are surface-applied to calcareous soil and are not immediately irrigated into the soil, more ammonium will volatilize from ammonium sulfate. Note that N fertilizer in the nitrate form is not subject to volatilization.
6.4. Solution sources – Fertigation
Fertigation is the application of solution fertilizer with irrigation water, typically through a microsprinkler or drip system (Fig. 6.3; Chapter 7). The two most common nutrients applied to citrus through fertigation are N and K. Fertilizer injected into a microirrigation system should be a true solution with no solid contaminants. Solutions Fig. 6.2. Cold water solubility of macronutrient fertilizer
sources.
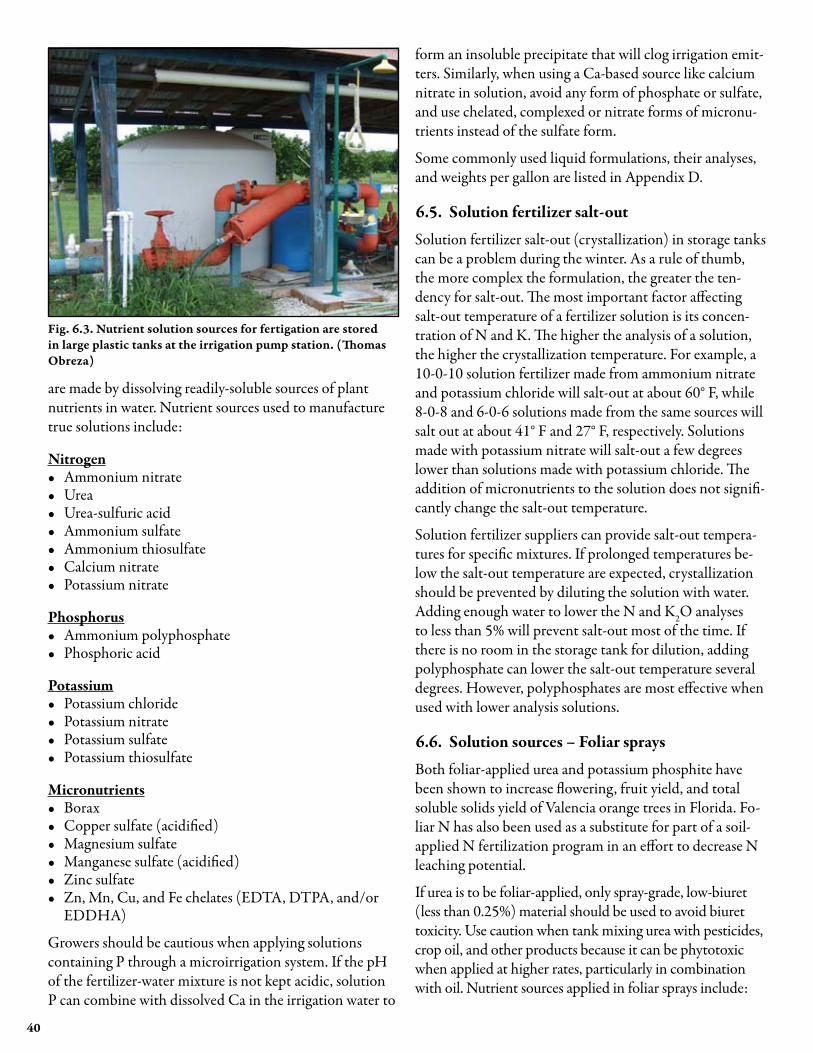
40 41
are made by dissolving readily-soluble sources of plant nutrients in water. Nutrient sources used to manufacture true solutions include:
Nitrogen• Ammoniumnitrate• Urea• Urea-sulfuricacid• Ammoniumsulfate• Ammoniumthiosulfate• Calciumnitrate• Potassiumnitrate
Phosphorus• Ammoniumpolyphosphate• Phosphoricacid
Potassium• Potassiumchloride• Potassiumnitrate• Potassiumsulfate• Potassiumthiosulfate
Micronutrients• Borax• Coppersulfate(acidified)• Magnesiumsulfate• Manganesesulfate(acidified)• Zincsulfate• Zn,Mn,Cu,andFechelates(EDTA,DTPA,and/or
EDDHA)
Growers should be cautious when applying solutions containing P through a microirrigation system. If the pH of the fertilizer-water mixture is not kept acidic, solution P can combine with dissolved Ca in the irrigation water to
form an insoluble precipitate that will clog irrigation emit-ters. Similarly, when using a Ca-based source like calcium nitrate in solution, avoid any form of phosphate or sulfate, and use chelated, complexed or nitrate forms of micronu-trients instead of the sulfate form.
Some commonly used liquid formulations, their analyses, and weights per gallon are listed in Appendix D.
6.5. Solution fertilizer salt-out
Solution fertilizer salt-out (crystallization) in storage tanks can be a problem during the winter. As a rule of thumb, the more complex the formulation, the greater the ten-dency for salt-out. The most important factor affecting salt-out temperature of a fertilizer solution is its concen-tration of N and K. The higher the analysis of a solution, the higher the crystallization temperature. For example, a 10-0-10 solution fertilizer made from ammonium nitrate and potassium chloride will salt-out at about 60° F, while 8-0-8 and 6-0-6 solutions made from the same sources will salt out at about 41° F and 27° F, respectively. Solutions made with potassium nitrate will salt-out a few degrees lower than solutions made with potassium chloride. The addition of micronutrients to the solution does not signifi-cantly change the salt-out temperature.
Solution fertilizer suppliers can provide salt-out tempera-tures for specific mixtures. If prolonged temperatures be-low the salt-out temperature are expected, crystallization should be prevented by diluting the solution with water. Adding enough water to lower the N and K2O analyses to less than 5% will prevent salt-out most of the time. If there is no room in the storage tank for dilution, adding polyphosphate can lower the salt-out temperature several degrees. However, polyphosphates are most effective when used with lower analysis solutions.
6.6. Solution sources – Foliar sprays
Both foliar-applied urea and potassium phosphite have been shown to increase flowering, fruit yield, and total soluble solids yield of Valencia orange trees in Florida. Fo-liar N has also been used as a substitute for part of a soil-applied N fertilization program in an effort to decrease N leaching potential.
If urea is to be foliar-applied, only spray-grade, low-biuret (less than 0.25%) material should be used to avoid biuret toxicity. Use caution when tank mixing urea with pesticides, crop oil, and other products because it can be phytotoxic when applied at higher rates, particularly in combination with oil. Nutrient sources applied in foliar sprays include:
Fig. 6.3. Nutrient solution sources for fertigation are stored in large plastic tanks at the irrigation pump station. (Thomas Obreza)

40 41
Nitrogen• Low-biureturea
Phosphorus• Potassiumphosphite• Ammoniumphosphite• Phosphorousacid
Potassium• Potassiumnitrate• Potassiumthiosulfate• Monopotassiumphosphate• Dipotassiumphosphate
Micronutrients• Manganese/zincnitrates• Manganese/zincsulfates• Coppersulfate• Syntheticandnaturalorganicchelates(manyforms)• Borax
6.7. Suspension sources
Suspensions are fluid fertilizers in which solids are pre-vented from settling by a suspension agent, usually a swell-ing-type clay like attapulgite or bentonite. Suspensions are higher in concentration than true solution fertilizers because they contain both dissolved and non-dissolved fertilizer. They can be uniformly applied to the soil surface as part of fertilizer-herbicide mixtures that sometimes include micronutrients. Mechanical agitation may be necessary to maintain fertilizer concentration uniformity in the tank. Suspensions are made from the same fertilizers sources used to make true solutions (see Section 6.4).
6.8. Slow-release sources
Slow-release sources are materials of limited water solubil-ity that release plant-available nutrients as they decompose or degrade in the soil following application. Except for a few slow-release K sources, almost all slow-release fertiliz-ers are N sources. The release process is either biological or chemical, and slow-release fertilizers are grouped accord-ingly. For example, release of N from urea formaldehyde requires both dissolution of the fertilizer and microbial decomposition, while release of N from isobutylidene diurea (IBDU) involves slow dissolution only. Processed waste products release N through microbial degradation. Examples include biosolids, composts, and tankages.
Slow-release nutrient sources applied to Florida citrus include:• Sulfur-coated urea• Urea formaldehyde
o Ureaformo Methylene urea
• IBDU• Organiform(tankage)• Animalmanures• Municipalbiosolids• Municipalcomposts
6.9. Controlled-release sources
Controlled release fertilizers (CRFs) contain one or more plant nutrients in a form that either delays their availabil-ity for plant uptake after application or extends their avail-ability significantly longer than rapidly-available fertilizers like ammonium nitrate, urea, or potassium chloride. CRFs were initially developed for their horticultural benefits, but they have also attracted attention in the BMP era because they can reduce potential negative environmental effects of crop fertilization.
Controlling the release of nutrients is accomplished by surrounding conventional water-soluble fertilizer sources with a coating (Fig. 6.4). Substances used as coatings include polymers, plastics, waxes, and sulfur, either alone or in combination. The standard (reference) release rate of a particular material is controlled by varying the coating thickness or physical characteristics during manufacture, but nutrient release is also typically influenced by soil tem-perature or water content.
CRFs are substantially more expensive than conventional sources so their use may be limited to special situations such as young tree fertilization or nutrient management in environmentally-sensitive areas. Many diverse CRF prod-ucts have been developed and the technology continues to advance. Most CRFs contain a complete N-P-K fertilizer
Fig. 6.4. Coated fertilizer sources control the release of water-soluble nutrients to citrus trees and can last up to 12 months. (Thomas Obreza)

42 43
combination with small concentrations of micronutrients. Growers are advised to consult the label of such products to determine release characteristics and recommended ap-plication strategy.
6.10. Formulating fertilizer products
More then 80% of the fertilizer sold in Florida is bulk-blended at the request of the customer. It is possible to obtain almost any requested combination of nutrients by blending the various base sources listed in Appendix B. In most fertilizer plants, blends are prepared by mixing the base sources and conveying the mixture to a bulk trailer or into bags. An example of the procedure used to formulate a fertilizer mixture is described in Appendix E.
6.11. Nutrient sources for organic citrus production
Organic citrus production relies on animal manures (Table 6.1), plant materials, and some mined raw minerals as nu-trient sources as opposed to inorganic chemicals and com-pounds. Essentially all manufactured or synthetic fertiliz-ers are prohibited in certified organic groves. In particular, materials containing chloride, nitrate, and highly-soluble phosphate cannot be used. Although biosolids (processed domestic wastewater residuals) are organic materials, they are prohibited from organic farming.
Examples of nutrient sources that can potentially be used for organic citrus production are listed below. Some are allowed with no restrictions, and others are restricted to special cases. Organic growers should consult their certify-ing organization for specific rules and guidelines.
• Legumes
• Composted food and forestry by-products
• Wood ash
• Crop residueso Green manureso Peat mosso Strawo Seaweed
• Animal manureso Beefo Dairyo Poultryo Horse
• Mealso Alfalfao Boneo Bloodo Cottonseed
o Fisho Feathero Hoof and horno Leathero Soybean
• Minerals and saltso Agricultural limestoneo Basalto Boraxo Bordeaux mixtureso Chilean sodium nitrateo Colloidal phosphateo Greensand (glauconite)o Granite (ground)o Gypsum (mined raw material only)o Kiln dusto Langbeinite (K-Mg sulfate – mined raw material only)o Micronutrient-sulfate saltso Natural rock phosphateo Potassium sulfate (mined only)o Sodium nitrate (mined only) – limited useo Sodium molybdateo Sulfur (mined only)o Zinc sulfate
Section 11.9 presents additional information about soil fertility and nutrient management guidelines for organic citrus production.
Table 6.1. Manure nutrients.
Manurelbs of nutrient
per ton of manure C:N ratio
N P2O5 K2OBeef 24:1scraped from paved surface 11-14 7-9 10-13
scraped from dirt feedlot 21-26 14-16 20-23
Dairy 11-30:1scraped from paved surface 10 3-6 6-9
with bedding 9 3 6Poultrybroiler house litter 72 78 46 10-14:1stockpiled litter 36 80 34layer-deep pit 38 56 30 3-10:1layer-undercage 26 31 20Horse (fresh) 12 6 12 22-50:1
Note: Nutrient contents listed are general averages. Samples of the manure to be applied should be analyzed before calculating applica-tion rates.

42 43
7.1. Applying dry fertilizers
The choice of fertilizer application method becomes im-portant as growers seek to improve nutrient use efficiency and reduce losses to leaching and runoff. Dry solid fertilizer spreaders should apply materials directly over the root zone, avoiding the row middle. It may be necessary to prune tree skirts to improve the spreading pattern and uniformity. When applying fertilizers to young trees, managers should take advantage of manual or electronic spreader adaptations that deliver fertilizer rates accurately to small tree root zones while leaving out the area between trees where roots are not present. Effort should be made to reduce surface movement of applied fertilizers by rainfall or wind.
Aerial application of micronutrients and other sprays is an accepted practice in Florida’s citrus industry, but this appli-cation method is not recommended for dry fertilizers.
For economical and efficient fruit production, it is essen-tial that spreaders be calibrated to apply exact amounts of fertilizers per acre. Plant nutrients should be applied according to individual crop requirements. Reduced yield may result from insufficient nutrient application, while excess nutrient application can lead to accumulation in soils and adjacent surface or groundwater.
Equipment needed to calibrate a typical grove spreader such as that shown in Fig. 7.1:• A tray (catch pan) that slides under the opening where
the chain pulls fertilizer from the hopper. This tray fits just above the fans.
• A spring scale or balance to weigh the fertilizer.
Calibration steps:
1. Position the empty tray so it will catch the fertilizer distributed from the hopper during calibration.
2. Drive the tractor and spreader along a row middle or edge of a block as if fertilizing normally for a distance of exactly five trees. Record the speed, RPM and gear of the tractor.
3. Collect the fertilizer discharged into the tray and weigh it.
4. Repeat the above procedure several times until a reliable average weight is obtained.
5. Use this equation to convert the weight of material to application rate in lbs/acre or lbs/tree, assuming the
spreader is fertilizing two rows at a time, i.e. running every other row middle:
Fertilizer material application rate (lbs/acre) =
Weight collected (lbs)[10 trees ÷ tree density (trees/acre)]
For example, if an average of 28 lbs of fertilizer were collected and the grove density was 145 trees/acre, the application rate would be:
28 lbs ÷ (10 ÷ 145) = 406 lbs/acre.
7.2. Fertigation
Fertigation is the application of soluble fertilizers with ir-rigation water. Advantages of fertigation:• Fertilizer is placed in the wetted area where the most
active roots are located.• Fertilizer may be applied more frequently in small
amounts so that it is available when the tree needs it.• Increased fertilizer application frequency can increase
fertilizer efficiency and reduce leaching.• Compared with conventional ground application, ferti-
gation can produce similar or better tree growth, yield, and fruit quality with less fertilizer.
7. Methods of Fertilizer ApplicationThomas A. Obreza, Brian J. Boman, Mongi Zekri, and Stephen H. Futch
(Includes contributions by David P. H. Tucker)
Fig. 7.1. Conventional fertilizer spreader equipped with a split chain and rear deflector plates to apply dry, solid fertilizer beneath the citrus tree canopy. (Mongi Zekri)

44 45
• Application cost is lower than that of dry or foliar fertil-izer application since fertilization is incorporated into the normal irrigation schedule.
Disadvantages of fertigation:• Fertilizer application uniformity and coverage depend
on proper design, installation, and maintenance of the irrigation system.
• Extra equipment (injection device, tank, backflow pre-vention system) must be added to the irrigation system (Fig. 7.2).
• Soluble fertilizers are more expensive than granular fertilizers on an equal nutrient basis.
• Fertilizers injected into an irrigation system may con-tribute to emitter plugging.
• Fertigation does not allow for variable rate fertilization based on tree size.
To effectively fertigate citrus trees, growers must properly maintain their microirrigation systems to apply water and fertilizer uniformly (Obreza, 2004). In addition, growers must determine:• The most suitable fertilizer formulations for injection;• The most appropriate fertilizer analysis for different age
trees and specific stages of growth;• The fertilizer amount to apply during a given fertigation
cycle or event;• The timing and frequency of applications per season.
Fig. 7.2. Fertigation equipment, including fertilizer tank (left), filters (center), and injector (right). (Mongi Zekri)
Properly managed applications of plant nutrients through irrigation systems significantly enhance fertilizer efficiency while maintaining or improving yield and fruit quality. On the other hand, poorly managed fertigation may result in substantial yield loss. Keep in mind that if a very wet soil is fertigated when following a pre-determined fertigation schedule, fertilizer and water will be wasted because water and nutrient uptake are drastically reduced if the soil is saturated.
Nutrient solutions for fertigation are available in varying forms and concentrations. Formulations usually contain two or more nutrients and the solubility of various for-mulations vary significantly. Fertilizer solubility is critical when preparing stock solutions for fertigation, especially when dissolving dry materials in water. Preparing hand-made nutrient stock solutions from dry fertilizers may require considerable time and effort and can generate sediments. Therefore, commercially-prepared true liquid fertilizer solutions are preferred.
Solutions are convenient because they can be directly injected into the irrigation water stream with a variable rate injection pump. Thus, they are less spill-prone than dry fertilizer. Although transportation cost makes liquids more expensive, they save time and labor and prevent problems associated with hand-made mixes. They also eliminate problems caused by insoluble materials found in some dry fertilizers.
Be careful when injecting fertilizers containing P or S into microirrigation systems. These elements may react with dissolved calcium and magnesium in the irrigation water to form insoluble precipitates that can clog irrigation lines and emitters. However, phosphoric acid can be safely injected into most water sources since it acidifies the solu-tion, preventing precipitation. Most N sources have low clogging potential except for ammonium phosphate. This material increases water pH, which may cause Ca and Mg to precipitate.
Injected fertilizers must remain in solution throughout the entire time the irrigation system is running. To help avoid plugging, a properly designed microirrigation system should include:• A method of filtering irrigation water;• A means of injecting chemicals into the water;• Equipment for flushing the system;• In some cases, a settling basin to allow aeration and the
removal of solids.
Most fertilizers are highly corrosive and are a potential health threat if they contact the skin. When fertigating, take these safety precautions:• Wear appropriate protective clothing and eye wear
when handling liquid fertilizers.• Inspect all system components including pumps, injec-
tion devices, lines, filters, and tanks prior to use.• Establish a routine fertigation monitoring program
that emphasizes the start-up and shut-down periods in particular.

44 45
• Calibrate and frequently re-check injection rates and times to ensure proper system operation.
• Prevent leaks, runoff, excess applications, and applica-tion to areas near surface water.
• Flush all system components with clean water following each fertigation.
Fertilizer salts in irrigation water can burn leaves even if relatively low salinity water is used. When injecting fertil-izers, check the electrical conductivity (EC) of the irriga-tion water-fertilizer mixture and try to maintain it below 1.5 dS/m (mmhos/cm), which is equivalent to about 1000 ppm total dissolved solids (TDS). It is preferable to inject small doses of fertilizer more frequently rather than less frequent injections of larger doses.
It is essential to have legal backflow prevention devices installed in the irrigation system to keep fertilizer from siphoning back into the water supply (Fig. 7.3). Manag-ers should consult state and local regulations that address their equipment needs based on the type of water supply and selected injection device.
The injection system should be made of corrosion resistant materials like reinforced ethyl vinyl acetate (EVA) hoses, nylon or polypropylene fittings, and polypropylene or fiberglass tanks. The injection device should have its own check valve plus a screen to prevent non-dissolved particles from entering the system. Fertilizer injection should take place upstream of filters so that any contaminants or pre-cipitates can be filtered out. Injection should stop during filter back-washing. If the system has a filter that uses part of the supply water to continuously back-wash, fertilizer must be injected downstream of it. Injection of highly acidic or corrosive materials should take place downstream of filters that may be subject to corrosion.
Fig. 7.3. Schematic diagram of fertigation equipment with backflow prevention devices circled.
Fertigation rates and timing should be calibrated for each irrigation zone. A single injection should last at least as long as the time it takes for water to travel from the injection point to the furthest emitter when the system is operating at normal pressure and flow rate.
There is a large increase in EC when fertilizer is present in irrigation water, so fertilizer movement through an irriga-tion system can be traced by following changes in EC with a portable EC meter. The time from the beginning of an injection to a sudden increase in EC at the farthest emitter from the injection point indicates the travel time of the fertilizer. For many systems, this time is 20 to 30 min-utes. Flush time should be longer than travel time so that nutrients do not remain in the tubing, otherwise microbial growth will be enhanced. An alternate method to deter-mine travel time is to inject liquid soap and observe the time it takes for bubbles to appear at the farthest emitters.
Maximum injection time depends on soil type and water requirement of the trees. Flush time should not be exces-sive to avoid leaching freshly-applied fertilizer below the root zone.
Fertilizer injection rates can be measured with a chemical flow meter or volumetrically. If a chemical flow meter is used on the high-pressure side of an injector, the flow me-ter should be rated for the pressure used. Volumetric mea-surements can be made by determining the time needed to inject a known volume of fertilizer under normal operat-ing conditions.
For all fertigation methods, the required fertilizer injec-tion volume can be calculated with the equation:
Volume = (Acres x N) ÷ (F x Density)
where
Volume = volume of fertilizer to be injected (gal) Acres = grove area to be fertigated (acres) N = amount of N to be applied per acre (lbs N/acre) F = percentage of N in the fertilizer expressed as a decimal (e.g. F = 0.08 for an 8-0-8 analysis) Density = fertilizer solution density (lbs/gal)
The weight per gallon of the liquid fertilizer solution is usually shown on the fertilizer label. Alternately, a known volume of solution can be weighed and converted to a weight per gallon. Appendix D (Table D.2) lists the den-sity of many common fertilizer solutions.
Example• The desired N rate is 150 lbs/acre/year.• Fertilizer is to be applied in 20 equal doses.

46 47
• The fertilizer solution is an 8-0-8 analysis made from ammonium nitrate and potassium chloride.
• The fertilizer solution density is 9.7 lbs/gal.• The grove to be fertilized is 80 acres.
Calculations:
Dividing the annual rate of 150 lbs N/acre into 20 fertiga-tions results in a single-dose application rate of 7.5 lbs N/acre. The volume of fertilizer to be injected is then calcu-lated from the equation:
Volume = (80 acres x 7.5 lbs N/ac) ÷ (0.08 N x 9.7 lbs/gal) = 773 gal
Injecting the fertilizer during a 60-minute period would require 773 gal/60 min = 12.9 gal/min. Alternately, 10 gal/min of fertilizer could be injected for 77 minutes, re-sulting in 770 gallons injected. Injection rates may have to be adjusted to compensate for equipment capacities. If 10 gal/min is above the range of the injection system, increase the injection time and/or fertigate more frequently.
In mature groves irrigated with typical micro-sprinklers that apply water between 0.10 and 0.15 inches/hr within the irrigation pattern, fertigation and flush cycles should be completed in 2 to 3 hours. Injection intervals that are too short result in tree exposure to high rates of salinity, and salt burn may result if the irrigation pattern contacts lower leaves and fruit. Injection times that are too long may result in leaching if the water-holding capacity of the root zone soil is exceeded before irrigation is completed.
Special attention is needed when fertigating young trees equipped with downspray micro-sprinklers that confine the irrigation pattern to a 3 to 4-ft diameter circle. The wa-ter application rate of these emitters can result in excessive irrigation and nutrient leaching. For example, a 15 gal/hr emitter with a 4-foot diameter wetted area has an effec-tive application rate of 1.9 inches/hr. This rate may result in leaching even if a fertigation-flush cycle requires only 1 hour to complete. To minimize leaching while downsprays are attached to emitters, post-injection irrigation must be the minimum required to flush the lines.
As trees mature and the root system expands to a much larger soil volume, the wetted area must be increased to achieve successful fertigation. The wetted area for a mature tree should cover most of the area under the canopy or at least 50% of the total land area. Patterns that irrigate less than 30% of the total land area may be unable to supply nutrients to enough of the root zone, and may cause leach-ing. Knowledge of the application rate of the irrigation
system and the soil water content prior to irrigating is criti-cal to fertigation management. The use of soil moisture sensors may be beneficial, particularly those that measure water content at multiple depths.
7.3. Applying suspension fertilizers
Suspension fertilizers are applied with a standard herbicide boom that places the fertilizer directly over the root zone (Fig. 7.4). Nozzles used to apply suspension fertilizers are larger than those typically used to apply herbicides (e.g. flooding or flood-jet nozzles). It is important to continu-ously agitate fertilizer in the tank through air sparging or mechanical recirculation to assure application uniformity.
Boom application equipment should be modified with manifolds and nozzles made of a salt-resistant material like stainless steel. Applying fertilizer with a boom pro-vides the opportunity to co-apply other agrichemicals like herbicides, insecticides, and fungicides. The salt effect of the liquid fertilizer can complement residual herbicides by burning existing weeds. However, care should be taken to avoid incompatibility when mixing materials.
Fig. 7.4. Boom applicator used to apply suspension fertilizers. (Stephen Futch)
7.4. Applying foliar fertilizers
Foliar nutrient application to citrus trees is common for economic and environmental reasons. Under specific con-ditions, it can improve nutrient uptake efficiency because nutrients are directly absorbed by the leaves. Foliar spray-ing can provide specific nutrients to the tree on a timely basis during critical stages of growth, flowering, and fruit development.
A well-planned foliar nutrition program can supplement soil fertilizer applications especially when the citrus root system is unable to keep up with crop demand or when soil nutrients are unavailable. In some cases, a significant por-
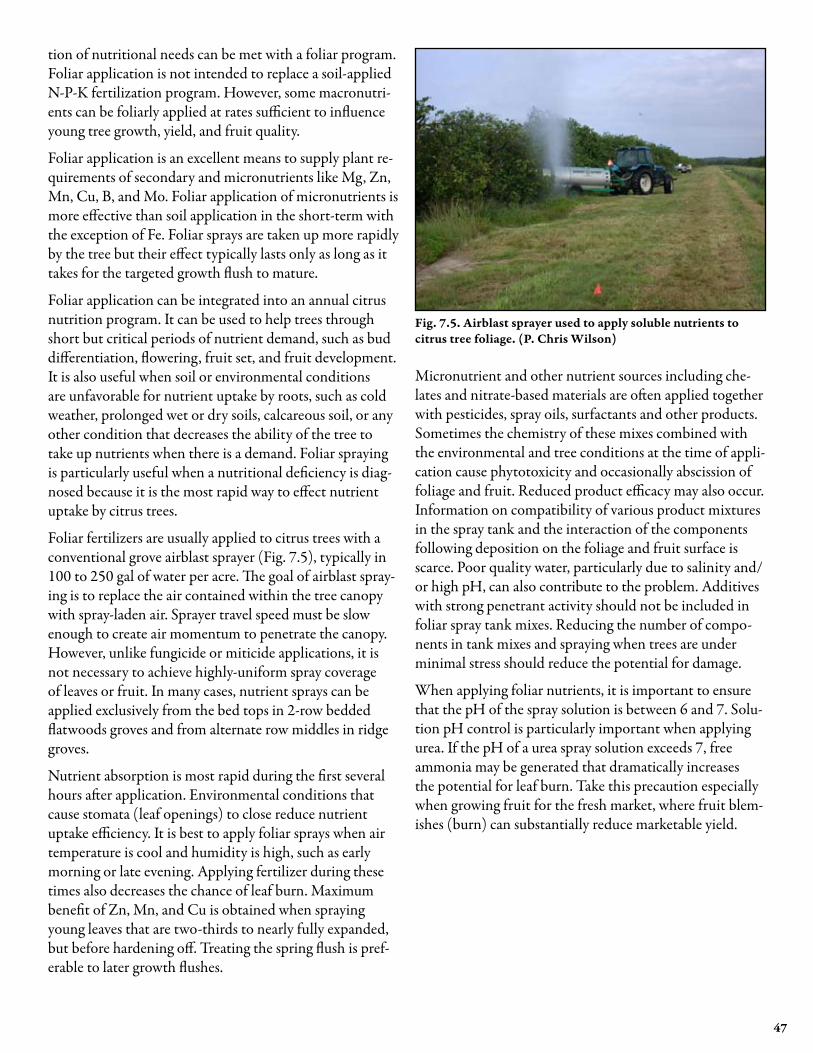
46 47
tion of nutritional needs can be met with a foliar program. Foliar application is not intended to replace a soil-applied N-P-K fertilization program. However, some macronutri-ents can be foliarly applied at rates sufficient to influence young tree growth, yield, and fruit quality.
Foliar application is an excellent means to supply plant re-quirements of secondary and micronutrients like Mg, Zn, Mn, Cu, B, and Mo. Foliar application of micronutrients is more effective than soil application in the short-term with the exception of Fe. Foliar sprays are taken up more rapidly by the tree but their effect typically lasts only as long as it takes for the targeted growth flush to mature.
Foliar application can be integrated into an annual citrus nutrition program. It can be used to help trees through short but critical periods of nutrient demand, such as bud differentiation, flowering, fruit set, and fruit development. It is also useful when soil or environmental conditions are unfavorable for nutrient uptake by roots, such as cold weather, prolonged wet or dry soils, calcareous soil, or any other condition that decreases the ability of the tree to take up nutrients when there is a demand. Foliar spraying is particularly useful when a nutritional deficiency is diag-nosed because it is the most rapid way to effect nutrient uptake by citrus trees.
Foliar fertilizers are usually applied to citrus trees with a conventional grove airblast sprayer (Fig. 7.5), typically in 100 to 250 gal of water per acre. The goal of airblast spray-ing is to replace the air contained within the tree canopy with spray-laden air. Sprayer travel speed must be slow enough to create air momentum to penetrate the canopy. However, unlike fungicide or miticide applications, it is not necessary to achieve highly-uniform spray coverage of leaves or fruit. In many cases, nutrient sprays can be applied exclusively from the bed tops in 2-row bedded flatwoods groves and from alternate row middles in ridge groves.
Nutrient absorption is most rapid during the first several hours after application. Environmental conditions that cause stomata (leaf openings) to close reduce nutrient uptake efficiency. It is best to apply foliar sprays when air temperature is cool and humidity is high, such as early morning or late evening. Applying fertilizer during these times also decreases the chance of leaf burn. Maximum benefit of Zn, Mn, and Cu is obtained when spraying young leaves that are two-thirds to nearly fully expanded, but before hardening off. Treating the spring flush is pref-erable to later growth flushes.
Fig. 7.5. Airblast sprayer used to apply soluble nutrients to citrus tree foliage. (P. Chris Wilson)
Micronutrient and other nutrient sources including che-lates and nitrate-based materials are often applied together with pesticides, spray oils, surfactants and other products. Sometimes the chemistry of these mixes combined with the environmental and tree conditions at the time of appli-cation cause phytotoxicity and occasionally abscission of foliage and fruit. Reduced product efficacy may also occur. Information on compatibility of various product mixtures in the spray tank and the interaction of the components following deposition on the foliage and fruit surface is scarce. Poor quality water, particularly due to salinity and/or high pH, can also contribute to the problem. Additives with strong penetrant activity should not be included in foliar spray tank mixes. Reducing the number of compo-nents in tank mixes and spraying when trees are under minimal stress should reduce the potential for damage.
When applying foliar nutrients, it is important to ensure that the pH of the spray solution is between 6 and 7. Solu-tion pH control is particularly important when applying urea. If the pH of a urea spray solution exceeds 7, free ammonia may be generated that dramatically increases the potential for leaf burn. Take this precaution especially when growing fruit for the fresh market, where fruit blem-ishes (burn) can substantially reduce marketable yield.

48 49
8.1. Fertilizer rates, application frequency, and timing for non-bearing trees (first 3 years in the grove)
8.1.1. Solid plantings
Nitrogen
Young citrus tree care requires managing irrigation, nutri-tion, weeds, diseases, pests, and cold protection to stimu-late rapid canopy growth. Water and N availability are the most important factors affecting growth of young trees. Obtaining optimum growth requires substantial irrigation and N inputs, but excesses of either are non-productive, costly, and may result in loss of N by leaching or runoff.
Nitrogen fertilizer recommendations for non-bearing trees were derived from numerous young-tree fertiliza-tion studies conducted throughout Florida (Table 8.1 and Fig. 8.1). These guidelines include a range of rates by tree age because a number of factors influence the N fertilizer requirement. Criteria for selecting a rate within the recom-mended range include:
• Soil type – Trees planted in soils high in organic matter (e.g. 2% or greater) or with a loamy texture require less fertilizer than trees on low-organic matter sandy soils.
• Land history – New plantings on land previously used for pasture or vegetable production require less fertil-izer during the first 1 to 2 years compared with trees replanted in established groves due to mineralization of accumulated organic matter.
• Fertilizer source – Use of controlled-release formula-tions may allow a reduction in fertilizer rate.
The annual N rate applied to solid-set 2 to 3 year old trees should not exceed 200 lbs/acre (Fig. 8.1).
Phosphorus
Before deciding to apply P fertilizer to young trees, test the soil for P and compare the results with the ranges in Tables 4.4 or 4.5.
• If soil test P is in the high or very high range, do not ap-ply P fertilizer.
• If soil test P is in the medium range, apply P fertilizer at a P2O5 rate equal to 50% of the N rate.
• If soil test P is in the low range, apply P fertilizer at a P2O5 rate equal to 75% of the N rate.
• If soil test P is in the very low range, apply P fertilizer at a P2O5 rate equal to the N rate.
If soil testing justifies P fertilizer application, test the soil again the following year and compare with Tables 4.4 or 4.5 to determine if P fertilization can be decreased or omitted. Initiate a leaf tissue testing program for P in year 3, and compare the results with the standards in Table 4.2.
Potassium
Apply K fertilizer at a K2O rate equal to the N rate.
Calcium
Liming the soil to pH 6.0 to 6.5 and maintaining it in that range will supply needed Ca. If soil pH is favorable, there is no need to apply Ca unless soil test Ca is less than suf-ficient. In this case, an application of gypsum or soluble Ca fertilizer may be considered. If soil pH is above 6.5, the soil will likely contain sufficient Ca for tree growth.
Magnesium
If soil test Mg is medium or lower (Tables 4.4 and 4.5), apply Mg fertilizer at a rate equal to 20% of the N rate. Curtail Mg fertilizer application if a subsequent soil test shows Mg in the high range.
Micronutrients
If trees are planted on previously cultivated land (e.g complete grove renovation or land converted from other agricultural uses where fertilizer was applied), do not apply micronutrients unless leaf analysis indicates they are below optimum or leaf/twig/fruit deficiency symptoms appear.
If trees are planted on previously non-cultivated land, ap-ply Mn, Cu, and B at 5%, 2.5%, and 0.33% of the N rate, respectively, until soil and leaf analysis and/or tree appear-ance indicate that one or more may be omitted. Boron may need to be applied every year because it leaches read-ily. Do not routinely apply Zn, Fe, or Mo unless prompted by visual symptoms.
8. Recommended Fertilizer Rates and TimingThomas A. Obreza, Kelly T. Morgan, L. Gene Albrigo, and Brian J. Boman
(Includes contributions by James J. Ferguson, Frederick S. Davies, David P. H. Tucker, Ashok K. Alva, and T. Adair Wheaton)

48 49
Table 8.1. Recommended N rates and minimum number of annual applications for non-bearing citrus trees.
Year in grove lbs N/tree/year (range)
Lower limit of annual application frequencyControlled-release fertilizer Dry soluble fertilizer Fertigation
1 0.15 – 0.30 1 6 102 0.30 – 0.60 1 5 103 0.45 – 0.90 1 4 10
Fig. 8.1. Recommended N rates for non-bearing citrus trees on a per-acre basis as a function of planting density. To determine the per-acre rate, find the planting density on the x-axis, move up into the colored band, and find the recommended N rate range on the y-axis.

50 51
Nutrient management
Applying fertilizer in several small doses increases fertilizer efficiency because it maintains more constant N availabil-ity and reduces leaching potential. A minimum of 4 to 6 annual applications of dry fertilizer is recommended for young trees. Splitting fertigation into 10 or more yearly applications is common. The cost of liquid injection dur-ing irrigation is relatively small particularly if the injection can be automated. One or two applications of controlled-release fertilizer is satisfactory because nutrients are protected from leaching. Controlled-release formulations may be applied pre-plant, incorporated after planting, or broadcast to insure uniform distribution of nutrients throughout the enlarging root zone of young trees.
Non-bearing trees fertilized after September may be slightly less cold-hardy. However, citrus tree growth is trig-gered by favorable temperatures and soil moisture, not by fertilization. Omitting fertilizer in the fall will not prevent growth. Nutrient uptake is reduced at lower soil tempera-tures, particularly for trees on Swingle citrumelo root-stock. Trees on Swingle can become quite chlorotic during the winter months even with fall fertilization.
Irrigation management of young trees is critical because water stress can occur rapidly as the soil surrounding the limited root system dries, and because young tree growth is particularly sensitive to water stress. Instances where young tree growth improved after a grove was converted to fertigation may have been due more to improved soil water regime than nutrient delivery method.
Excessive irrigation is often a problem when managing young trees. Small microsprinkler wetted patterns used to irrigate young trees apply water at high rates. Short ir-rigation durations of 30 minutes or less may be required to avoid nutrient loss below the root zone. Irrigation line flushing times after fertigation must also be minimized to avoid nutrient leaching.
8.1.2.Resetsinestablishedgroves
Resets in established groves should be fertilized like solid-set non-bearing trees. Resets may not grow well if they only receive fertilizer during mature tree application because only a small amount of material may be deposited in the young tree root zone. Resets will most likely not require P fertilizer, but this can be checked with a soil test. Controlled release materials can be applied 1 to 2 times per year without compromising tree growth in reset situa-tions. In closely spaced groves, reset growth may be re-stricted due to competition from the adjacent older trees.
8.1.3. Example fertilizer program for non-bearing trees
Fertilizer rates for trees during the first 3 years in the grove are calculated on a per tree basis. For example, if a 2-year old tree is scheduled to receive 0.4 lbs N per tree per year in four equal applications, then 0.1 lbs N will be applied each time. Using a fertilizer containing 10% N, the tree will receive 1.0 lb of fertilizer per application.
8.2. Fertilizer rates for bearing trees (4+ years in grove)
Nutrient management for bearing trees requires many of the same considerations important for non-bearing trees. Nitrogen continues to be the most important element for tree growth, fruit yield, and fruit quality, but others also have substantial effects on production and fruit qual-ity. Harvesting the crop removes a significant amount of nutrients from the grove (Table 3.3), but fruit production accounts for only part of the fertilizer requirement.
Nitrogen
Continued strong vegetative growth is an objective for several years after fruit production begins, so N fertilizer application supports both canopy expansion and fruit production. In addition, fruit quality becomes important for both processed and fresh fruit. Orange and grapefruit groves tend to receive higher N fertilizer rates if the fruit is grown for processing, since returns are based on lbs solids/acre (total sugar) production. If the fruit is grown for the fresh market where fruit size, shape, peel thickness, texture, and color are important, the N fertilizer rate is usually lower, perhaps two-thirds or three quarters of the processed fruit rate.
Young bearing trees (years 4 through 7 in the grove). Recommended N fertilizer rates (Table 8.2) provide enough N for canopy expansion towards containment size while producing maximum economic yields of high quality fruit. The N rate selected should be based on soil characteristics, yield potential, and tree needs as indicated by leaf analysis interpretation (Table 4.2).• For grapefruit, the recommended annual N rate is 120
to 160 lbs/acre.• For oranges and other varieties, the recommended an-
nual N rate is 120 to 200 lbs/acre.• If justified by an exceptionally high-producing young
grove (>650 boxes/acre), the yield-based N recommen-dation for trees 8+ years of age (Table 8.2) may be used.
Mature bearing trees (years 8+ in the grove). Once trees reach containment size, further canopy growth is not

50 51
desired so nutrition inputs can be stabilized and possibly reduced. Nitrogen fertilizer management should focus on 1) maintaining tree biomass, 2) generating sufficient veg-etative growth to replenish fruiting wood, and 3) replacing N exported with the harvested crop. The guidelines for annual N fertilizer rates accounts for the needs of both vegetative growth and crop removal (Table 8.2).
Grapefruit:• The recommended annual N rate is 120 to 160 lbs/
acre. For groves producing more than 800 boxes/acre, up to 180 lbs/acre may be considered. The N rate ap-plied should be based on tree needs as indicated by leaf analysis interpretation, soil characteristics, desired fresh fruit quality characteristics, and yield potential.
• The optimum leaf N concentration associated with best grapefruit quality is around 2.2% (Fig. 8.2), which is lower than the optimum leaf N range for or-ange production (2.5 to 2.7%). To achieve high yields of large fruit, growers should adjust N fertilizer rates to maintain grapefruit leaf N around 2.2%.
Oranges:• The annual N rate should fall within the range of 140
to 250 lbs/acre. The recommended rate for a specific grove depends on either expected yield potential (for 8 to 11-year-old trees) or 4-year running average pro-duction history (for 12+ year-old-trees) expressed as either fruit yield or soluble solids production (Fig. 8.3).
• When basing N fertilization on expected yield poten-tial, the rate should be selected considering 1) how well the young, bearing trees have produced, and 2) leaf tissue analysis.
• If leaf N is consistently maintained in the optimum range, additional fertilizer will not increase yield (Fig. 8.4), and may reduce some aspects of fruit quality.
Table 8.2. Recommended N rates and minimum number of annual applications for bearing citrus trees.
Year in groveOranges Grapefruit Other varieties Lower limit of annual application frequency
lbs N/acre/year (range) Controlled-release fertilizer
Dry soluble fertilizer Fertigation
4 through 7 120 – 200 120 – 160 120 – 200 1 3 10
8 and up 140 – 250 Yield-based1 120 – 1602 120 – 3003 1 3 10
1See Fig. 8.3 for specific production-based N fertilizer rate recommendations.2For grapefruit groves producing more than 800 boxes/acre, the maximum recommended N rate is 180 lbs/acre.3 For Orlando tangelos, the maximum recommended N rate is 250 lbs/acre. For Honey tangerines (Murcotts), the maximum recommended N rate is 300 lbs/acre.
Fig. 8.2. As grapefruit leaf N increases from 2.0 to 2.3%, yield increases and Brix/acid ratio decreases slightly. Fruit size in-creases as leaf N approaches 2.2%, then decreases substantially (He et al., 2003).

52 53
Fig. 8.3. Production-based N fertilizer rate recommendations for Florida oranges. Find the projected yield potential (8 to 11 year-old-trees) or 4-year running average production (12+ year-old trees) on the x-axis, move up or down to the straight line, and find the recommended N rate range on the y-axis.

52 53
• The base N rate recommendation (140 lbs/acre) is for groves producing 200 boxes/acre or 1300 lbs solids/acre.
• The high end of the N rate range (250 lbs/acre) is for groves producing 1000 boxes/acre or 5800 lbs solids/acre.
• Beginning at the base N rate, the recommended N rate increases:o 14 lbs N/acre for every 100 box/acre increase in
expected yield potential or 4-year running average yield; or
o 2.5 lbs N/acre for every 100 lbs solids/acre increase in expected yield potential or 4-year running average yield.
Fig. 8.4. As orange leaf N increases from 2.1% to 3.0%, yield increases to a maximum around 2.6%, then decreases (Alva et al., 2006).
Applying nutrients, particularly N, using variable rate application should be considered (see Section 5.4). Yield maps (Section 5.3.3) indicate how yield varies across a block or grove. The use of variable rate technology is en-couraged if the necessary equipment or custom applicator is available.
Other varieties:• For other varieties, the recommended annual N rate is
140 to 250 lbs/acre using the method above to calcu-late a production-based rate for specific groves.
• For the special case of Orlando tangelos, the maximum recommended annual N rate is 250 lbs N/acre.
• For the special case of Honey tangerines (Murcotts), the maximum recommended annual N rate is 300 lbs N/acre.
Example N fertilizer rate calculation for mature, bearing orange trees using box/acre yield:
Recommended N rate = Base N rate + {[(Avg. yield – 200 boxes/acre)/100] x 14 lbs/acre}
If a grove has produced an average of 500 boxes/acre during the past 4 years, then
Recommended N rate = 140 lbs N/acre + {[(500 – 200)/100] x 14 lbs N/acre} = 140 + 42 = 182 lbs N/acre
Example N fertilizer rate calculation for mature, bearing orange trees using lbs solids/acre yield:
Recommended N rate = Base N rate + {[(Avg. yield – 1300 lbs sol./acre)/100] x 2.5 lbs/acre}
If a grove has produced an average of 3500 lbs solids/acre during the past 4 years, then
Recommended N rate = 140 lbs N/acre + {[(3500 – 1300)/100] x 2.5 lbs N/acre} = 140 + 55 = 195 lbs N/acre
Leaching rain rule: If 3 or more inches of rain falls within 72 hours after an N fertilization, “replacement” fertilizer may be applied up to one-half of the N rate affected by the rain (not to exceed 30 lbs/acre). If the affected N fertilizer source was 100% slow-release or controlled-release, this rule does not apply. If the source was a mixture of water-soluble and slow or controlled-release N, this rule applies only to the soluble N fraction.
Phosphorus
Determine the need for P fertilization using leaf tissue and soil test results.• Sample leaves and soil using the procedures described in
Chapter 4.• Compare the analytical results with the interpretations
provided in Tables 4.2, 4.4, and 4.5.• Follow the P fertilization guidelines in Table 8.3.
Potassium
Apply K fertilizer at a K2O rate equal to the N rate. If leaf K is consistently below optimum from year to year, increase the K2O rate by 25%, especially if the grove soil is calcareous.

54 55
Calcium
Liming the soil to pH 6.0 to 6.5 and maintaining it in that range will supply needed Ca. If soil pH is favorable, there is no need to apply Ca unless soil test Ca is less than suf-ficient or leaf tissue Ca is below optimum. In these cases, application of gypsum or soluble calcium fertilizer should be considered. If soil pH is above 6.5, the soil will likely contain sufficient Ca for tree growth and fruit production.
Magnesium
If soil test Mg is medium or lower (Tables 4.4 and 4.5) or if leaf Mg is below optimum (Table 4.2), apply Mg fertilizer at a rate equal to 20% of the N rate. Alternatively, Mg may be applied in a foliar spray. Curtail Mg fertilizer applica-tion if a subsequent soil test shows Mg in the high range or if leaf Mg improves to optimum or greater.
Micronutrients
The quantities of micronutrients in 100 boxes of fruit are extremely small (Table 3.3). Removal of micronutrients by the harvested fruit from even a high-producing grove is negligible compared with the amount present in the soil. In high pH (>7) soils, micronutrient availability (except
Mo) decreases considerably. Micronutrients (with the exception of B and Cu) should be applied as needed based on visual, persistent foliar deficiency symptoms or low leaf analysis values. Recommended methods, timing, and rates for micronutrient application to citrus groves are shown in Table 8.4.
Factors influencing the effectiveness of foliar sprays include the formulation used, metallic rate per acre, and timing of the spray with respect to leaf age. Many commer-cially-available micronutrient formulations applied at their recommended label rates will maintain sufficient leaf con-centrations but usually will not correct moderate to severe deficiencies. Water-soluble micronutrient fertilizers may be included with post-bloom or summer sprays, preferably timed when leaves of new growth flushes are two-thirds to fully expanded.
Copper. Some central ridge and east coast grove soils contain 300 to 400 lbs Cu/acre in the top 6 inches of soil. A moderate routine disease control spray program con-tributes an additional 3 to 4 lbs Cu/acre/year so no soil application of Cu fertilizer is needed in this situation. Soil pH below 5.5 can solubilize soil Cu that is toxic to plants. As little as 1 ppm Cu in the soil solution can kill roots.
Table 8.3. Recommendations for P fertilization of bearing citrus trees based on leaf tissue and soil tests taken according to the guidelines described in Chapter 4 (leaf and soil samples taken in July or August of each year).1
If leaf tissue P is… …and soil test P is… …the recommendation for P fertilization is:Excessive or High
Soil test P value is not applicable. Do not apply P fertilizer to the soil for 12 months following leaf and soil sampling,
then sample again and re-evaluate.Optimum Sufficient
Optimum Less than sufficient Apply 8 lbs P2O5/acre to the soil for every 100 boxes/acre of fruit produced during the current year. Sample leaves and soil again in 12 months and re-evaluate.
Low Less than sufficient Apply 12 lbs P2O5/acre to the soil for every 100 boxes/acre of fruit produced dur-ing the current year. Sample leaves and soil again in 12 months and re-evaluate.
Deficient Less than sufficient Apply 16 lbs P2O5/acre to the soil for every 100 boxes/acre of fruit produced dur-ing the current year. Sample leaves and soil again in 12 months and re-evaluate.
1These recommendations do not pertain to foliar-applied P.
Table 8.4. Recommended methods, timing, and rates for micronutrient application to citrus groves.
Mn Zn Cu B Fe
MethodFoliar Yes Yes Yes Yes No
Soil Yes1 No Yes Yes Yes
TimingFoliar When spring flush leaves reach full expansion
Soil Anytime as needed
Rateslbs metallic equivalent/acre
Foliar 3 to 5 5 3 to 5 ¼ ---Soil 7 to 10 --- 5 1 See below2
1Soil applications of Mn are not recommended on calcareous soils.2Acid soil: Fe-EDTA, ⅔ oz elemental Fe/tree; Calcareous soil: Fe-EDDHA, 1¾ oz elemental Fe/tree.

54 55
Maintaining soil pH close to neutral is recommended to reduce the potential for Cu toxicity. Some rootstocks (e.g. Swingle citrumelo) that perform poorly in high pH soils are also sensitive to high soil Cu. When replanting on old grove sites with low soil pH, the potential for toxicity is high. While the emphasis with old grove soils is on manag-ing high soil Cu, most previously non-cultivated Florida sandy soils are deficient in Cu. If a grove is developed on a virgin sandy soil, Cu fertilizer should be included in the fertilizer blend (see Section 8.1.1).
Iron. Soil applications of non-chelated, inorganic Fe fertil-izers usually cannot correct visible Fe deficiency symp-toms. Because these Fe fertilizers readily precipitate, they are unavailable to the tree. In neutral to slightly acidic soils Fe deficiency can also be a problem if Cu is present at high concentration.
Calcareous soils may contain high total Fe but it is ex-tremely insoluble. Visible Fe deficiency is common on these soils. The primary factor causing Fe chlorosis in an alkaline soil is the effect of the bicarbonate ion (HCO3
-) on Fe uptake and/or translocation in the plant, resulting in an inactivation or immobilization of Fe in plant tissue. Citrus rootstocks vary widely in their ability to overcome low Fe stress (Table 8.5). The easiest way to avoid alkaline-induced Fe chlorosis in citrus trees that are planted on calcareous soils is to use tolerant rootstocks.
Iron chlorosis should be corrected by soil application of chelated Fe fertilizer. Chelates are superior sources of Fe for plants because sufficient Fe can be supplied at lower rates compared with inorganic Fe sources. The effective-ness of an Fe chelate depends greatly on soil pH (Table 8.6). Fe-EDTA and Fe-HEDTA, which are relatively inex-pensive, will correct Fe deficiency if soil pH is less than 6.5. Do not apply these chelates to alkaline soil because they will readily break down resulting in loss of available Fe by precipitation.
Iron chlorosis of citrus trees on susceptible rootstocks growing on calcareous soil is not easily remedied. Effective Fe chelates for these soils are available, but the treatments can be expensive and leaf greening is usually transient. Choose Fe-DTPA for mildly-alkaline soils (pH 7.5 or less), and choose Fe-EDDHA for highly-calcareous soils (pH greater than 7.5).
Organically-complexed Fe exists in by-products like wastewater residuals (biosolids) or certain drinking water treatment residuals (Fe-humates). Biosolids are potentially useful because they contain a high concentration of Fe in a complexed form that does not readily precipitate. Re-
search with Fe-humate applied to citrus trees showed that moderate Fe deficiency could be corrected for relatively low cost.
Zinc. Soil pH is the most important factor regulating plant-available Zn. Zinc precipitates at alkaline pH mark-edly decreasing availability so soil pH less than 7 is the pre-ferred situation. Although there are natural mechanisms in the soil-plant system that increase the availability of Zn in alkaline soils, Zn deficiencies are common.
If Zn deficiency symptoms are transient and not wide-spread in a citrus grove, applying Zn fertilizer is not recom-mended. However, special consideration should be given to groves being visually monitored for citrus greening disease symptoms (see Section 3.9). Trees on Carrizo citrange root-stock tend to show Zn deficiency symptoms more readily even though the tree is not likely Zn deficient.
Application of foliar Zn fertilizer is usually combined with pesticide sprays scheduled in April or May at 3 to 5 lbs of metallic Zn/acre using either ZnO or ZnSO4. A number of other formulations are available for foliar application, including nitrates and organically-chelated forms using lignin sulfonate, glucoheptonate, or alpha-keto acids. Practically speaking, inorganic and organic Zn fertilizer sources are about equally effective with respect to foliar absorption.
Table 8.5. Citrus rootstocks ranked according to Fe-chlorosis susceptibility.
Sour orange (C. aurantium)Lowest
susceptibilityRough lemon (C. jambhiri)Cleopatra mandarin (C. reticulata)C. macrophyllaC. volkameriana
Sweet orange (C. sinensis)Moderate
susceptibilityCarrizo citrange (C. sinensis x P. trifoliata)
Trifoliate orange (P. trifoliata)Highest
susceptibilitySwingle citrumelo (C. paradise x P. trifoliata)
Table 8.6. Effective pH range of various Fe chelates.
Iron chelate Effective soil pH rangeFe-EDTA 4.0 to 6.5
Fe-HEDTA 5.0 to 6.5Fe-DTPA 4.0 to 7.5
Fe-EDDHA 4.0 to 9.0Fe-citric acid Not suitable for soil application

56 57
Application of Zn directly to acidic soils is rarely economi-cally practical due to the massive rates required to correct a deficiency. Zinc should not be soil-applied to groves on calcareous soils because the alkaline pH renders the Zn unavailable almost immediately.
Manganese. The behavior of Mn in the soil is similar to that of Zn especially with respect to relative availability in acidic and alkaline soils. Either sulfate, oxysulfate, or some oxide forms of Mn can be used to correct Mn deficiency with the degree of effectiveness decreasing in that order. Soil application of Mn is not recommended on calcareous soils where Mn deficiency is commonly encountered.
For groves on acidic soils that show persistent Mn defi-ciency symptoms on young foliage, soil application of 7 to 10 lbs of Mn as MnSO4 per acre is recommended. On calcareous or heavily limed acid soils, foliar application of 3 to 5 lbs of Mn per acre is recommended. A special effort to prevent Mn deficiency symptoms should be made in groves being visually monitored for citrus greening disease symptoms (see Section 3.9).
Boron. Boron is required in miniscule amounts and there is only a small range between deficient and toxic fertilizer rates. It should be applied annually as a foliar spray or in a dry fertilizer mixture at approximately 1/300 of the N fertilizer rate. If trees are irrigated with reclaimed water, B fertilization may not be necessary.
Molybdenum. Molybdenum is also required in very small amounts. If Mo deficiency occurs, it usually means that the soil is highly acidic. The deficiency is corrected by a foliar spray that may last for several years. Soil applications are not satisfactory.
8.3. Timing and frequency of fertilizer application for bearing trees
Bearing tree nutrition management must support both vegetative growth and the current fruit crop. Spring veg-etative growth is particularly important because it forms the fruiting wood for the following year’s crop. The period of highest nutrient requirement begins in late winter and extends through early summer. During this time, flowering and fruit development competes with spring vegetative growth flushes. Flowers and fruitlets take up accumulated nutrients but some of these are temporarily lost during the flower-fruitlet shedding process. The tree is then left with the fruit it can sufficiently support to maturity. This process continues until the May-June drop of fruitlets is completed, after which nutritional requirements for fruit development decrease. Best fruit quality is obtained when
fall and early winter nutritional status, particularly N, is moderately low.
Based on the nutritional demands during a typical year, a basic fertilizer application schedule divides the total an-nual requirement into three equal increments:• The first increment should be made available between
early February and the initiation of flowering.• The second increment should be made available be-
tween flowering and late May.• Third increment should be made available between Sep-
tember and mid-October, avoiding the summer rainy season as much as possible.
Fertilizer may be applied during the fall and winter partic-ularly in the southern portion of the citrus-growing region where trees often grow throughout the year. Any time growth is induced by warm weather, sufficient nutrients should be available. However, fertilizer applied in Janu-ary may not be readily taken up if soils are cold. If a freeze occurs shortly after a winter fertilizer application, much of the fertilizer will be lost by leaching if micro-sprinklers are used for freeze protection.
Be aware that fall or winter fertilizer applications can make psyllid control more difficult (see Section 3.9), delay fruit color development, and increase the susceptibility of trees to freeze injury.
Much of Florida’s citrus industry exists on shallow flat-woods soils with intensive irrigation so the danger of root damage from high salinity is greater than it is on deep sandy soils. Split fertilizer applications minimize salt dam-age potential, decrease leaching during the summer rainy season, and help maintain a continuous nutrient supply during south Florida’s long growing season.
8.4. Slow-release and controlled-release fertilizers
Slow-release N sources
Citrus growers can reduce the number of fertilizer appli-cations per year when slow-release N sources like sulfur-coated urea, urea formaldehyde, methylene urea, or IBDU make up 40 to 60% of the total N in the fertilizer. For ex-ample, a grower applying 100% water-soluble N fertilizer (e.g. ammonium nitrate) four times per year could cut the application frequency in half if the N source was changed to a 50-50 blend of ammonium nitrate and IBDU. How-ever, the total N rate applied per year should be the same in both cases.
If a natural organic material like manure or biosolids is included as part of the N applied to citrus, the mineraliza-

56 57
tion rate must be considered when determining the rate to apply. Organic matter decomposes relatively quickly in Florida’s warm and humid environment so N mineralizes much faster than it would in a cooler northern climate. Roughly half of the N in biosolids and two-thirds of the N in poultry (layer) manure becomes plant-available during the first year after application. For example, if a poultry manure application supplied 100 lbs/acre of total N to a grove, about 66 lbs N/acre would become available to the trees during the next 12 months.
Research conducted in several Florida locations showed that N mineralization is front-loaded in the case of both poultry manure and biosolids (Table 8.7). Most of the N becomes plant-available in the first month after applica-tion, followed by a gradual release of the remainder during the subsequent 11 months. Research has suggested that the amount of plant-available N released from either mate-rial after 12 months is negligible. The N not accounted for by the plant-available fraction most likely volatilizes, denitrifies, is used by soil microbes, or remains in the soil as recalcitrant organic matter.
Table 8.7. Approximate rate of N availability from poultry (layer) manure and biosolids following application to the soil (Hanselman et al., 2004).
Time after application (months)
Poultry manure Biosolids
Available N as a percentage of total N applied
0 – 1 50 351 – 3 6 83 – 6 4 6
6 – 12 4 7Total 64 56
Controlled-release fertilizers
Commercial fertilizer companies have blended together individual coated fertilizer materials, each with a different release rate, to create controlled-release mixtures suit-able for single annual applications to citrus. For example, a fertilizer made to match the nutrient requirements of citrus trees might be composed of a suite of water-soluble, 3-month, 6-month, and 9-month materials. A blend like this would be applied once per year in February. Ideally, it would release two-thirds of its nutrients from February to June, and the remaining one-third would gradually release between June and October.
Coated fertilizers provide the highest nutrient uptake efficiency potential of any fertilizer class. Recent research suggests they can sustain equal or increased fruit produc-
tion when applied at lower N rates compared with a stan-dard water-soluble N fertilization program. Since they are considerably more expensive than water-soluble materials, applying coated fertilizers at lower rates may be necessary to maintain an economically-competitive fertilization pro-gram. Since the marketing of coated fertilizers for mature citrus groves is relatively new, growers are encouraged to consult the fertilizer manufacturer or blender for release rates and efficiencies of specific products.
8.5. Foliar application of N, P, and K
The amount of plant nutrients that can be taken up through the leaves of a citrus tree is miniscule compared with the amount that can enter through the roots. Micronutrients can be successfully applied with foliar sprays because the tree does not require them in large amounts (Table 3.1) but leaves are not usually thought of as a major uptake site for macronutrients. However, there are special cases where fo-liar application of N, P, and/or K is justified. Citrus growers should realize that a positive response to foliar sprays of N or P may be due to additional effects of the materials on tree physiology beyond simple enhancement of tree nutrition.
Nitrogen
Commercial forms of urea are available that can be read-ily absorbed by citrus leaves particularly if applied with a non-ionic surfactant. Foliar urea sprays applied during the winter have enhanced the number of flowers and yield of Valencia oranges in both research plots and commercial trials. These sprays presumably work only if some induc-tion has taken place from natural cold or drought stress. Therefore, for effective use in the winter, urea sprays should be applied after some natural flower induction has occurred but before most bud differentiation starts. In Florida, significant induction may not start until late De-cember some years, while in other years some buds may be differentiating by early January. After some cool tempera-ture induction or 30 days of drought stress, foliar sprays of 50 to 60 lbs of spray grade urea per acre can enhance flower bud induction and may increase fruit yield. Care must be taken to apply the correct rate, because leaf damage can occur if urea application is excessive.
Maximum penetration of urea into citrus leaves occurs within 24 to 48 hours after spray application. Optimum conditions for foliar uptake include:• Air temperature between 77 and 88° F.• High relative humidity.• Spray solution with a pH between 7 and 8 to prevent
urea breakdown.

58 59
Under favorable environmental conditions, roughly half of foliar-applied urea penetrates the leaves, while most of the other half is lost through volatilization. The rate of foliar-applied N should be considered as part of the total annual N rate applied to the grove. For example, a foliar spray of 50 lbs urea/acre applies 23 lbs N/acre. If the fertilization plan calls for a total of 180 lbs N/acre/year, only 157 lbs N/acre (180 – 23) should be included in the soil-applied fertilizer program.
In Florida citrus production areas where groundwater nitrate contamination exists or is seen as a potential prob-lem, urea sprays should be evaluated to provide a portion of the tree N requirements, especially during the summer months when leaching potential is the greatest.
Phosphorus
Citrus leaves are extremely impervious to the phosphate (PO4
3-) form of P so foliar application of a liquid P mate-rial like ammonium polyphosphate is not recommended. Conversely, the phosphite (PO3
3-) form of P is more read-ily absorbed into plant tissue and once inside the plant it remains stable. Phosphite does not readily convert to phosphate in the plant so the nutritional value of absorbed PO3
3- is uncertain. However, phosphite is officially recog-nized by FDACS as a source of P for crops.
In California, research showed that foliar applications of phosphite were able to replace standard P fertilization in citrus crops suffering from P deficiency. The conversion of phosphite to phosphate likely occurred prior to plant absorption, resulting from slow chemical oxidation or by oxidizing bacteria and fungi found living on citrus leaves. Phosphite also showed fungicidal activity and increased citrus floral intensity, yield, fruit size, total soluble solids, and anthocyanin concentration, usually in response to a single foliar application.
In Florida, a pre-bloom foliar application of 2.6 quarts of 28% P2O5 as potassium phosphite per acre to Valencia oranges significantly increased flower number, fruit yield, and total soluble solids yield compared with an untreated control. These results suggest that the effect of phosphite was not due to the molecule’s fungicidal attributes, but to other growth-stimulating properties.
Citrus growers should identify their production goal for the year (e.g. increased yield, increased fruit size, or im-proved fruit quality) to determine if a phosphite applica-tion is justified. Be aware that phosphite materials, if not formulated correctly, have significant phytotoxicity poten-
tial and may induce adverse reactions with other materials in the spray tank such as micronutrients or pesticides.
Potassium
Many factors contribute to the size of fruit in a particular year such as fruit load, rainfall pattern, fertilization pro-gram, hedging and topping, and rootstock/scion combina-tion. However, it is difficult to predict how these factors combine to affect final fruit size at harvest. The easiest fac-tor to manipulate is nutrient management. Among other fruit qualities, increased K fertilization is associated with larger fruit size (Table 3.4).
Effects of low K on fruit yield and quality generally pre-cede appearance of leaf deficiency symptoms. Decreased yield and small fruit have been observed on trees with leaf K in the range of 0.5 to 0.8%, while K concentrations of 1.2% or more have been associated with maximum yield of high quality fruit.
Applying foliar sprays of K cannot entirely substitute for soil-applied fertilizer, but they can serve as a supplement, and their ability to increase fruit size has been demon-strated. Foliar-applied K has also corrected K deficiency of citrus on calcareous soil. Applying potassium nitrate (KNO3) in this manner increases leaf K more rapidly compared with soil-applied fertilizers because plant uptake is much faster, but the positive effect is shorter-lasting.
Salt index. The salt index of a fertilizer (Section 11.5) measures its tendency to increase the osmotic pressure of the soil solution compared with an equal amount of sodium nitrate. High soluble salt concentrations in the soil may develop an osmotic pressure exceeding that of the plant sap, possibly resulting in dehydration and permanent injury. When salt solutions are sprayed on leaf surfaces similar results may occur. Typically, the higher the salt index, the greater the potential to burn to leaves or fruit.
Materials. Potassium sources used for foliar K applica-tion include KNO3 (13-0-44), monopotassium phosphate (MKP, 0-52-34), and dipotassium phosphate (DKP, 0-18-20). DKP is made by combining MKP and potas-sium hydroxide. When applying MKP or DKP, a small amount (3 to 5%) of low-biuret urea should be included to enhance uptake. KNO3 is usually applied without surfac-tants or urea.
Application rates and timing. Research in the Indian River production area showed that about 8 lbs of K2O per acre were needed per foliar application to achieve satisfac-tory results. Higher rates did not show additional benefit, and lower rates resulted in less fruit enlargement.

58 59
If foliar spraying with 100 or more gal of water/acre, the potential for burn is relatively low, so the least expensive K source may be chosen. When applying foliar K with low-volume equipment, MKP or DKP should be used to minimize the burn potential. MKP has been applied to grapefruit at rates as high as 106 lb MKP in 125 gal water per acre under hot, dry conditions with no adverse effects. The low salt index of MKP (only 1/6 that of KNO3 per unit of K2O; Appendix C, Table 1) makes it safe to use.
Caution: Be careful if tank mixing MKP with other materials. The MKP-water solution has a pH of about 4.5, which may not be suitable for some tank mix combina-tions. DKP makes a pH-neutral solution that would be a better choice if tank-mixing with other materials.
Timing is important for K applications to enhance fruit size. Potassium is a primary component of cell walls, accounting for more than 40% of fruit mineral content. About 70% of final fruit size is related to the number of cells in the fruit, so more cells usually means larger fruit. Cell division typically stops by late April and size change throughout the rest of the year comes from cell enlargement. Therefore, the maximum effect of foliar K is achieved from applications that make it available during bloom and post-bloom when it can be used during both cell division and rapid cell enlargement phases. An ad-ditional application with the summer spray (normally in July) is also recommended to ensure sufficient K through the summer growing season.
Grapefruit size enhancement occurred in about half the fall field trials in the Indian River area, suggesting that late summer or fall K applications may be effective some years. Fall applications were most effective in years with wet sum-mers and falls. Shorter day lengths and cooler weather re-sults in a dramatically decreased fruit expansion rate after mid-October in most years. Thus, if foliar K applications for fruit enlargement are considered during late summer or fall, they should be made in August or September to be most effective.
Expected results. Studies on Sunburst and Valencia showed that foliar-applied K produced 25 to 33% more larger-sized fruit compared with non-treated plots. In ad-dition, there was a corresponding increase in soluble solids yield in the Valencia experiments. Combining pre-bloom, post bloom, and summer K sprays may increase average fruit diameter 0.16 to 0.24 inches, which can equal 1 or more pack sizes. When fall application was successful, grapefruit diameter increased 0.08 to 0.16 inches, or about ½ to 1 size category. Foliar K will not produce large fruit from small fruit, but it can move a significant portion of the fruit into a larger size class. The following observations and recommendations are based on the Indian River area experiments:
• The recommend program for most citrus varieties is 8 lbs K2O/acre per application, applied pre-bloom (typically February), post-bloom (typically April), and summer ( July).
• If the summer and fall are wetter than usual, later K applications may be considered. When exercising this option, schedule the applications during August and September.
• Foliar K application has had little or no effect on juice volume, acid, Brix, or Brix:acid ratio.
• Diameters of smaller fruit tended to increase more than larger fruit when foliar K applications were made.
• Fruit burn was not observed at the following spray con-centrations:o 25 lbs KNO3/acre applied in 125 gal of water/acre.o 15 lbs MKP/acre applied in 32.5 gal of water/acre.o 15 lbs MKP/acre applied in 10 gal of water/acre by
airplane.

60 61
9.1. Water supply
Competition for water is increasing in all citrus produc-tion areas. Florida’s expanding population increases water demand in the urban sector, which reduces water avail-ability for agriculture. Growing a high-quality citrus crop is water-intensive, but growers do have options to remain competitive. By increasing water uptake efficiency (the amount of water taken up by the trees compared with the amount of water applied to the grove), growers can con-tinue to achieve normal production while reducing water withdrawals.
If more water is applied than the soil can hold, it drains below the root zone and is wasted. Nutrients, especially N, move with water as it passes through the soil (leaching) ei-ther downward to groundwater or laterally toward ditches and canals. When nutrients are leached, they are no longer available to the trees and may become an environmental concern. Understanding how water and nutrients move through the soil is important in improving their use.
9.2. Production region characteristics important to irrigation management
The central Florida ridge (Fig. 2.7) features, well-drained, sandy Entisols (Appendix A). These soils permit rapid infiltration of rain and irrigation water, making them vulnerable to nutrient leaching. Nitrate leaching is a major concern to citrus producers on the ridge. The maximum irrigation depth to wet the majority of the root zone in these soils is 3 to 4 ft.
The Gulf, Peace River, and Indian River citrus production areas are dominated by poorly-drained flatwoods soils (Fig. 2.7) that require artificial drainage to produce high quality citrus. Nitrate leaching is greatly reduced in flat-woods soils compared with the ridge. The citrus root zone in these soils is typically 18 inches or less.
9.3. Nutrient uptake efficiency
Improving water uptake efficiency will also improve nutri-ent uptake efficiency (the amount of nutrients taken up by the plant compared with the amount of nutrients applied as fertilizer). In Florida’s sandy soils, nutrient and water uptake efficiencies are linked. Management methods that improve irrigation water uptake efficiency will increase the proportion of applied nutrients that are taken up by the
tree, potentially leading to increased growth and yield.
9.4. Allowable soil water depletion
As soil dries out, water becomes increasingly more diffi-cult for trees to remove, which can eventually cause water stress. Tree health and yield will suffer if the soil is allowed to get too dry. To provide adequate water for flowering, fruit set, and vegetative growth, maximum soil water depletion should be no more than 25 to 33% of available water from February to June. Once the rainy season starts, the maximum depletion level can be increased to 50 to 66% of available water. This additional allowable depletion increases the capacity of the soil to hold rainfall without leaching nutrients. The same depletion levels in the fall and winter months will save water without reducing yield.
9.5. Irrigation scheduling
Successful irrigation management maintains sufficient water and nutrients in the root zone to maximize plant growth and health. Growers who focus on improving water and nutrient uptake efficiency will reduce N and P losses and decrease environmental impacts at the same time. While some nutrient loss is unavoidable due to excess rainfall, loss due to management decisions can be minimized.
Proper irrigation scheduling applies an appropriate volume of water to a citrus grove at the appropriate time based on tree need, soil properties and weather conditions. Schedul-ing methods include:• Experience• Calendar method (e.g. 0.8 inches every 4th day during
the dry season)• Monitoring soil water status• Calculating a water budget
9.5.1. Soil moisture measurement
Experience or the calendar method can provide a reason-ably good irrigation schedule, but they are not accurate enough to maximize water uptake efficiency and prevent nutrient leaching. Using soil moisture sensors improves accuracy because they quantify changes in soil water status. These devices may be fixed in one location, portable, or hand-held. They measure soil moisture at one depth or at multiple depths. General categories include:
9. Irrigation Management to Improve Nutrient UptakeKelly T. Morgan and Thomas A. Obreza

60 61
• Tensiometers• Electrical resistance blocks• Time domain reflectometry (TDR) probes• Capacitance probesConsiderations when using soil moisture sensors to sched-
ule irrigation include:• Knowing the soil water-holding capacity and tree root
zone depth (Appendix A, Table A.1).• Placing sensors where the majority of roots are located
such as at the dripline of the tree.• Using multiple sensors both across the grove and with
depth to fully characterize the tree root zone.• Moving sensors to follow root growth as the tree canopy
expands in developing groves.• Basing irrigation on the soil depth containing the great-
est root density.• Managing root zone soil moisture between field capac-
ity and the maximum allowable available water deple-tion (one-fourth to two-thirds depletion, depending on time of year).
Fig. 9.1 shows an example of how a multi-level capacitance probe could be used to adjust an irrigation schedule to maximize water uptake efficiency and minimize nutrient leaching. The four graphed lines represent soil moisture content at 4-inch (red), 8-inch (blue), 12-inch (purple), and 20-inch (green) depths in the soil and the x-axis shows a 16-day time period separated into 2-day increments.
Fig. 9.1. Continuous monitoring of soil moisture at 4, 8, 12, and 20-inch depths in the soil by a multi-level capacitance probe installed in the root zone of a mature citrus tree.
The effect of irrigation is easily observed as sharp increases in soil moisture at the 4, 8, and 12-inch depths. However, note that the first irrigation increased soil moisture at the 20-inch depth as well (black arrow), which is below the zone of highest root density. Since the goal here was to keep the irrigation water in the top 18 inches of soil, the grower reduced the duration of subsequent irrigations.
The steadily decreasing water content at the 20-inch depth during the following 2-week period showed that the grow-er had attained optimum irrigation water management.
9.5.2. Water budgeting
An alternative method to schedule irrigation uses a com-puter program that estimates grove water consumption (evapotranspiration, or ET) from weather data. Reference ET and convenient irrigation scheduling management tools for all Florida citrus production regions can be found on the Florida Automated Weather Network (FAWN) website at http://fawn.ifas.ufl.edu. The computer program uses the soil water-holding capacity of specific soil series to determine field capacity. Irrigation schedules are deter-mined using the strategies and equations described in the next section.
9.6. Irrigation strategies to improve nutrient uptake and reduce leaching
Developing an irrigation strategy to reduce nutrient leach-ing has the objective of not applying more irrigation water than the root zone can hold. Considering the low water-holding capacity of citrus grove soils, this objective is very difficult to accomplish even for the most experienced and diligent irrigation managers. The major questions to be answered in this procedure are:• How much water can the root zone hold?• What is the maximum irrigation system run time before
leaching occurs?
Example
A central ridge citrus grove has the following characteristics:• Tree spacing – 12½ ft within the row and 25 ft between
rows.• Tree canopy diameter – 17½ ft• Root zone depth – 3 ft.• One 16 gal/hr micro-sprinkler per tree with a 16-ft
diameter wetted pattern.• The citrus root zone is continuous from tree to tree,
existing both inside and outside of the wetted pattern.• The irrigated system wets approximately 60% of the
total root zone (Fig. 9.2).
Nutrient leaching risk in this grove is higher within the wetted pattern due to potential over-irrigation plus the fact that most fertilizers are applied to that zone (Fig. 9.3). A good irrigation manager will control this risk with care-ful water management.

62 63
Note: The following depictions of water content chang-es in the citrus tree root zone (Figs. 9.4 to 9.7) do not represent the actual water extraction pattern. The blue shading shows 1) approximately where water extraction oc-curs beneath the canopy, and 2) the relative soil water con-tent with respect to available soil water-holding capacity.
This example starts with the entire grove at field capacity moisture content following a heavy rain (Fig. 9.4). The cit-rus trees begin to remove water from the soil in response to the atmospheric ET demand. After several days have passed (depending on time of year) the water content in the root zone decreases to 50% of available water capacity (Fig. 9.5).
At this point, the grove manager turns on the irrigation system and operates it long enough to return the soil in the wetted pattern back to field capacity (Fig. 9.6). From this point until the next significant rainfall, only the soil water content in the irrigated zone can be influenced by the ir-
rigation manager. The water content in the non-irrigated zone rapidly decreases to the point where little to no soil water can be extracted by the tree.
Fig. 9.2. Scaled diagram of example citrus grove described above.
Fig. 9.3. Irrigated and non-irrigated zones in a citrus grove have different leaching potentials that depend on irrigation scheduling and fertilizer placement.
Fig. 9.4. The citrus grove at field capacity soil water content (time = 0).
Fig. 9.5. The citrus grove several days later, after half of the available water has been removed from the root zone. Note that water extraction has occurred from both the irrigated and non-irrigated zones.
Fig. 9.6. The citrus grove after irrigation returns the wetted zone to field capacity. Note that the non-irrigated zone con-tains very little available water.

62 63
If the grove manager operates the irrigation system too long and applies more water than the soil can hold, water will move beneath the citrus tree roots. If water soluble nu-trients like nitrate or potassium are present in the irrigated zone during the irrigation period, a portion will leach (Fig. 9.7).
Fig. 9.7. Excessive irrigation leaches mobile nutrients like nitrate and potassium.
How much water can the root zone hold? From Appendix A, Table A.1:• Central ridge soils – 0.3 to 0.7 inches/ft• Flatwoods soils – 0.3 to 1.2 inches/ft
What is the maximum system run time before leaching occurs?
Information needed: In this example:Soil water-holding capacity 0.6 inches/ftMaximum allowable depletion 50%Root zone depth 3 ftSurface area wetted by micro-sprinklers 60%Micro-sprinkler flow rate 16 gal/hrTree spacing 12½ ft x 25 ft
Calculations
1. Volume of water the root zone can hold: 0.6 inches/ft × 3 ft deep root zone = 1.8 inches
2. Volume of water to refill at maximum depletion: 1.8 inches × 50% = 0.9 inches
3. Volume of water this represents per tree space: 0.9 inches/tree × 1 ft/12 in × (25 ft × 12½ ft) × 7.5 gal/cu ft × 60% coverage = 105 gal/tree
4. Maximum system run time: 105 gal ÷ 16 gal/hr emitter flow rate = 6.6 hr
5. Adjust for system delivery efficiency of 90%: 6.6 hr ÷ 0.9 = 7.3 hr
Therefore, the irrigation system should never be run longer than about 7 hours for any single cycle, provided that the available soil water is at least 50% depleted when the irrigation begins. If the soil is less than 50% depleted of available water, then the maximum run time decreases accordingly.
Considerations
Ideal maximum system run time vs. practical field management. There may be management limitations that prevent stopping irrigation at or before the ideal maxi-mum run time, such as limitations of the irrigation system design or lack of sufficient personnel. Growers should evaluate their overall irrigation management and take cor-rective action if possible.
Theory vs. reality. Calculating maximum run time from grove and irrigation system characteristics provides a starting point, but the irrigation system or soil may behave differently than the model situation. Thus, growers should fine-tune the maximum run time in the field.

64 65
10.1. Environmental nutrient issues related to Florida citrus production
Although N fertilizer is required for tree growth and fruit production, there is little net increase in tree size in a mature grove. Nitrogen used for leaf growth or taken up by a cover crop is largely recycled as leaves drop or the cover crop dies, the vegetative material decomposes, and miner-alization releases the N for reuse by the tree. This recycled N supplies most of the continuing need for new leaves, and relatively little fertilizer N is needed for growth. Replace-ment of the N removed by fruit harvest becomes the main N requirement in a mature grove. Figure 10.1 illustrates the citrus tree as a component in the environmental N cycle.
Fig. 10.1. The citrus tree as a component of the environmental N cycle.
A 600 box/acre crop of oranges removes about 72 lbs of N/acre from the grove. If this mature grove receives 200 lbs N/acre annually, approximately 128 lbs of N/acre remains to be accounted for after crop removal. The fate of this N is not completely understood. Some goes into new roots and shoots, and some is taken up by weeds. A portion of the rest may be lost by volatilization or denitrification, although denitrification in vulnerable soils is minimal. In controlled leaching studies, about 40% of the N applied to the soil was not recovered even when water was supplied soon after fertilizer application. Although unknown mechanisms may partially reduce the soil N concentration, a substantial portion of the N applied in fertilizer is subject to leaching as indicated by elevated N in groundwater beneath some groves. Clearly, excess N application should be avoided on
vulnerable soils where the potential for leaching exists.
In the flatwoods, most soils are slowly-permeable due to the presence of spodic and/or argillic horizons (Chapter 2) so nitrate leaching to groundwater is less important than on the ridge. In addition, nitrate that passes through the root zone to the shallow water table can be reduced (denitrified) to gaseous N that disperses in the atmosphere.
Surface water contamination by nitrate is more likely to be a factor in the flatwoods. Soluble nutrients that move more than about 30 inches below ground level become unavail-able to flatwoods citrus trees because of their shallow rooting depth. Dissolved nutrients (including P) may move laterally above the hardpan rather than vertically through the restrictive layers. As a result, leached nutrients can move into water furrows if rainfall or irrigation is excessive. Nu-trients removed as a grove drains are readily used by algae, bacteria, and aquatic plants that often clog irrigation/drain-age canals and ditches. Excessive plant growth in water furrows may be an indication of lateral nitrate movement.
10.2. The BMP era
In the late 1980s, FDEP surveyed the water quality from 3949 shallow (<100 ft) drinking water wells across the state. Nitrate-N was detected in 2483 (63%) of these wells and 584 contained a nitrate-N concentration greater than the national maximum contamination limit (MCL) of 10 ppm. Nearly 90% of the high-nitrate wells were located in Lake, Polk, and Highlands counties, the heart of Florida’s central ridge citrus production area (Fig. 2.7).
In response to water quality concerns, a Nitrogen BMP bill was passed by the Florida Legislature in 1994 that authorized FDACS “to develop fertilizer BMPs designed to meet ground water standards…. These BMPs are not mandatory, but if the grower implements the BMPs…., the landowner or lessee will not be subject to administrative penalties if nitrate ground water standards are violated. The Department of Environmental Protection is autho-rized to conduct field monitoring….”
The definition of a BMP is a practice or combination of practices determined by the coordinating agencies, based on research, field-testing, and expert review, to be the most effec-tive and practicable on-location means, including economic and technological considerations, for improving water qual-
10. Environmental Issues and Best Management Practices (BMPs)Brian J. Boman, Thomas A. Obreza, and Kelly T. Morgan
(Includes contributions by Larry K. Jackson, Ashok K. Alva, David P. H. Tucker, and D. V. Calvert)

64 65
ity in agricultural and urban discharges.
The first BMP that FDACS adopted by rule in response to the 1994 law was called “Nitrogen Best Management Practices for Florida Ridge Citrus.” It specified N fertilizer sources, annual N rates, maximum N rate per application, fertilizer application timing, irrigation management, and record-keeping for citrus grown on permeable better-drained sandy soils typical of Florida’s central ridge. The purpose was to minimize the risk of nitrate leaching from fertilizers to groundwater.
Citrus production BMP development followed in the Indian River growing region in response to surface wa-ter quality concerns in the Indian River Lagoon and St. Lucie Estuary. These BMPs were developed for citrus on poorly-drained flatwoods soils. They expanded beyond nutrient management to include water volume, sedi-ment transport, pesticides, and aquatic plants. Since then, similar BMP manuals have been developed for the Peace River and Gulf citrus-growing areas, so essentially all com-mercial Florida citrus groves can potentially come under the auspices of a BMP program if the grower so desires. Citrus growers are referred to the FDACS Office of Water Policy for more detailed information about BMPs (http://www.floridaagwaterpolicy.com/).
The following are the steps growers should take to get involved in their regional BMP program:• Assess the grove operation and list BMPs that are al-
ready present or will be enacted.• Submit the summary of practices to FDACS in a
“Notice of Intent to Implement” BMPs.• Once enrolled, maintain records and provide documen-
tation regarding BMP implementation.• Receive a “presumption of compliance” with water
quality standards from FDACS.
After enrollment, growers become eligible for cost share funding or drainage permit exemptions, depending on grove location.
Characteristics of a successful BMP program:• A “cradle to grave” approach.• A stakeholder-driven process from manual development
through BMP implementation.• Distribution of printed manuals to growers.• Adoption of BMP manual by rule, followed by avail-
ability of cost-share for implementation.• Growers keep good production records and use self-
assessment tools.• Third-party implementation teams help growers enroll
and take part in BMPs.
• Field studies determine the effectiveness of BMPs.• BMP education is a continuous process.
10.3. General nutrient BMPs for citrus production
Nutrient BMPs do not represent exotic or unfamiliar fertilizer management practices to modern Florida citrus producers. In fact, most BMPs are simple, common-sense, “good housekeeping” practices that many grove managers already use in their normal caretaking. The following list summarizes typical nutrient BMPs found in Florida’s vari-ous citrus BMP manuals:• Educate and train field operators who handle, load, or
apply fertilizers about fertilizer placement, avoiding waste, and preventing contamination of open water.
• Develop a nutrient management plan based on crop nutrient requirements.
• Use tissue and soil analysis to make fertilization decisions.• Use appropriate application equipment.• Properly calibrate and maintain application equipment.• Apply fertilizers to target sites.• Avoid high risk applications such as before forecasted
rainfall, on bare soils with extreme erosion potential, or when the water table is near the surface.
• Store fertilizer to prevent contamination of nearby ground and surface water. Always store fertilizer in areas protected from rainfall.
• If fertilizer is spilled on the ground, collect it and apply as normal. Use a tarp on ground surfaces where fertilizer is transferred.
• Use caution when loading near ditches, canals, and wells. Locate loading activities away from these sites if possible.
• Use multiple fertilizer loading and transfer sites to pre-vent concentration of nutrients in a single area.
• Use backflow prevention devices on irrigation and spray tank filling systems to prevent entry of nutrients into surface or ground water.
• Split fertilizer applications throughout the growing season.
• Use erosion-control practices to minimize soil loss and runoff.
• When irrigating, try to wet only the root zone. Do not over-irrigate.
• Add organic matter to the soil whenever possible.• Prevent groundwater contamination by plugging wells
that are not in use.• Use appropriate fertilizer sources and formulations
based on nutritional needs, season of year, and antici-pated weather conditions to achieve greatest efficiency and reduce potential for off-site transport.

66 67

66 67
11.1. Scions
Orlando tangelo
While the nutritional requirements of oranges and grape-fruit are well known, the requirements of many com-mercially grown hybrids are obscure. Orlando tangelos may require the higher N and K rates recommended in Chapter 8, with emphasis on fall application to prevent yellowing and defoliation. Transient yellowing of foliage in the winter should not be the sole reason for increasing the fertilizer rate.
Honey tangerine
Mature honey tangerines (Murcotts) may require up to 300 lbs/acre of N and K2O each year to reduce the inci-dence of tree collapse during heavy crop years. At least one-third of the annual fertilizer rate should be applied in the fall to coincide with greater tree stress from the fruit load. Some studies have indicated that heavy fruit set leads to root starvation and death resulting in reduced mineral uptake. Therefore, the fruit crop should be mechanically or chemically thinned in heavy crop years with reduced rates of fertilization in light crop years.
Navel orange
There is no evidence that Florida navel oranges require different fertilizer formulations or additional nutritional or foliar N applications compared with other sweet orange cultivars. It is prudent to maintain leaf nutrient concen-trations within guidelines established for sweet oranges without excessive fertilization. Optimum but not excessive nutrition will ensure sufficient tree vigor without compro-mising fruit yield and quality.
11.2.Rootstock/nutritioninteraction
Citrus rootstocks influence nutrient uptake and can make the difference between a productive and non-productive grove. Best known is the poor performance that can oc-cur when trees budded on trifoliate and trifoliate hybrid rootstocks like Carrizo citrange and Swingle citrumelo are planted on soils with pH > 7. These trees typically exhibit Zn, Mn, Fe, and Mg deficiency symptoms. Soils with high concentrations of shell, limestone rock, and/or subsoil clay are particularly unsuitable for Swingle and Carrizo root-stocks.
The widespread planting of trees on Swingle citrumelo rootstock has brought the important influence of root-stock on citrus tree nutrition to the forefront. Trees on Swingle rootstock often grow relatively poorly with chlo-rotic foliage when planted on alkaline soils. Iron deficiency has become more prominent with the increased use of Swingle rootstock. Trees on Swingle also sometimes show general starvation symptoms (of N and other elements) during the winter, even though soil temperatures may not attain the critical 55° F threshold associated with reduced root function. This “winter chlorosis” occurs in spite of sufficient soil nutrient supply and supplemental winter fertilizer applications.
While rootstock-related nutrient deficiencies can be over-come by appropriate fertilizer applications (although at high cost), the only way to alleviate toxicities is by reduc-ing input of phytotoxic elements or the use of less sensitive rootstocks. For example, C. macrophylla is highly B toler-ant, and trees on Rangpur lime are Cl tolerant.
Cleopatra mandarin is the most Cl tolerant rootstock. Sun Chu Sha is efficient in taking up Mg when soil Mg availability is low. Trifoliate orange, and to a lesser extent citranges and citrumelos, are susceptible to Fe chlorosis on high pH (>7) soils. The above rootstocks also accumulate B and Cl, and as a result are not tolerant to saline soils.
11.3. Soils high in copper
Repeated use of Cu both as a soil application and as foliar fungicide sprays has caused Cu to accumulate to toxic con-centrations in some older citrus grove soils with acidic soil pH. Trees experiencing Cu toxicity may exhibit Fe chloro-sis on the foliage. For most Florida soils in citrus produc-tion, the Mehlich 1 soil test Cu interpretations in Table 4.4 can be used as a rough estimate of potential Cu toxicity.
Although useful as a guide, soil test Cu may not predict Cu toxicity well in many cases. Cu is more toxic when soil pH is less than 6.0. However, if soil pH is maintained above 6.0 by liming, Cu bioavailability is negligible. When the soil is found to contain high Cu, take the following steps:• Discontinue using Cu except where it is required to
control fruit and foliage fungal diseases where no alter-native control exists.
11. Special SituationsThomas A. Obreza, Brian J. Boman, Mongi Zekri, Stephen H. Futch, Lawrence R. Parsons, and James J. Ferguson
(Includes contributions by David P. H. Tucker, Heinz Wutscher, Ashok K. Alva, and David V. Calvert)

68 69
• Lime the soil to pH 6.5 and maintain it there.• Avoid using Swingle citrumelo rootstock, which is Cu-
sensitive.
As Cu is present in the soil solution at low concentration and accumulates in feeder roots with time, its extraction from roots may be used to diagnose Cu toxicity. Field and greenhouse studies have indicated that both total feeder root Cu and Cu extracted with 1M hydrochloric acid are correlated with extractable Cu in sandy soils. In high Cu soils, root Cu concentration is a better indicator of Cu tox-icity than leaf Cu. While a critical root Cu concentration is not well defined, toxicity in mature groves has been associ-ated with feeder root Cu in the 350 to 800 mg/kg range.
11.4. Calcareous soils
Calcareous soils are alkaline (pH > 7) due to the presence of excess calcium carbonate (CaCO3). These soils can con-tain from 1% to more than 25% CaCO3 by weight, with pH in the range of 7.6 to 8.4. In a Florida calcareous soil, the pH is not usually higher than 8.4 regardless of CaCO3 concentration.
Many Florida flatwoods soils contain one or more hori-zons (layers) that are calcareous. A typical characteristic is an alkaline, loamy horizon less than 40 inches deep that can be brought to the surface during land preparation for citrus planting. Increased nutritional management inten-sity is often required to successfully grow citrus on cal-careous soils. Some sites (e.g. ditch banks) are comprised of soils containing considerable amounts of lime rock or shell. It may not be economically justifiable to plant these sites with certain rootstocks considering the management problems and costs involved.
Citrus fertilizer management on calcareous soils differs from that on non-calcareous soils because of the effect of soil pH on soil nutrient availability and chemical reactions that affect the loss or fixation of some nutrients. The pres-ence of CaCO3 directly or indirectly affects plant avail-ability of N, Mg, K, Mn, Zn, Fe and Cu. The behaviors of Fe, Zn, and Mn in high pH soil and recommendations for alleviating their deficiency have already been discussed in Chapter 8. The remaining discussion deals with N, Mg, and K. The availability of soil Cu is also affected but is not discussed here because the citrus Cu requirement is nor-mally satisfied through Cu fungicide foliar sprays.
Management of fertilizer nutrients
Soil pH affects biological and chemical reactions involving N and can influence plant N use-efficiency. Nitrification
(the conversion of NH4+ to NO3
- by soil bacteria) is more rapid in soils with pH between 7 and 8. Volatilization of ammoniacal-N fertilizer can be significant if the pH of the soil surface is greater than 7 where the fertilizer is applied. This condition occurs in calcareous soils or where the breakdown of the N fertilizer material produces an alka-line condition (e.g. urea decomposition).
Nitrogen fertilizer should be managed to minimize am-monia volatilization. If rainfall is not imminent following application of ammoniacal-N to the surface of a calcareous soil, the fertilizer should be immediately moved into the soil with irrigation water. Urea applied to the surface of any soil should also be irrigated in. Fertigation using either of these sources is a suitable application method because the N immediately enters the soil.
Low leaf K concentrations are common in groves planted on calcareous soils. If low yield, small fruit, fruit splitting, and/or creasing are observed, application of additional K fertilizer is justified. One approach is to increase the N:K2O fertilizer rate ratio to 1:1¼, i.e. apply 25% more K2O than normal.
If trees do not respond to soil application, an alternative approach to increasing leaf K is foliar sprays of KNO3 or KH2PO4 (Chapter 8). Precautions should be taken to avoid foliar burn from high spray concentrations. The N applied in the spray is as equally available as soil-applied N, so the rate of N applied as KNO3 should be taken into account when determining the annual N fertilizer rate.
Low leaf Mg concentration in groves on calcareous soils can be addressed by applying foliar sprays of Mg(NO3)2.
Acidification to reduce soil pH
Soil acidification can improve nutrient availability in calcareous soils by decreasing soil pH. The rate of a soil acidifier required to cause a plant response depends on the amount of CaCO3 in the soil. The chance of a positive plant response to broadcast applications of an acidifier is near zero if lime rock or shell is visible in the root zone. In contrast, it is feasible to acidify soils with lower CaCO3 content (e.g. from over-liming) or those that have become alkaline from repeated application of high-bicarbonate irrigation water.
Soil acidifiers include elemental S and ammonium or potassium thiosulfate [(NH4)2S2O3, K2S2O3]. The sulfur in these compounds converts to sulfuric acid in the soil that neutralizes CaCO3 (Table 11.1) and decreases soil pH. Ammonium sulfate [(NH4)2SO4] acidifies the soil through nitrification that releases H+ as NH4
+ converts to NO3-.

68 69
Elemental S is the most effective soil acidifier. The pow-der form can be difficult to handle due to dustiness and fire hazard, and can cause severe root burn if not applied properly. To overcome these problems, some S products have been formulated into porous pellet-like particles that are much easier to handle and apply.
Ammonium thiosulfate and potassium thiosulfate are clear liquid fertilizers containing S2O3
2-. They can be blended with N, P, and K solutions to form a wide variety of N-P-K-S formulations. Thiosulfates are non-corrosive and non-hazardous to handle, and are well-adapted to the methods used to apply fertilizer solutions. Application of ammonium thiosulfate to calcareous soils has been shown to increase the amount of extractable Fe in the soil.
The soil within the wetted pattern of a micro-irrigation emitter often becomes alkaline when the water source contains bicarbonate while the surrounding soil may be neutral or acidic. Lowering the soil pH in this situation requires an application of acid or acidifying fertilizer to the wetted pattern only. Application of acid or thiosulfate fertilizer through the irrigation system can be effective in treating this problem.
Table 11.1. Materials that can be used to lower soil pH, and their acidifying power relative to CaCO3.
Acidifier Amount needed to neutralize 1000 lbs of pure CaCO3
Elemental sulfur 320 lbs
Concentrated (98%) sulfuric acid 68 gal
Ammonium thiosulfate 12-0-0-26S 1600 lbs
Potassium thiosulfate 0-0-25-17S 3800 lbs
Ammonium sulfate 21-0-0 900 lbs
11.5. Saline soils and water
All natural waters and soil solutions contain soluble salts. Salt concentration is reported several ways:
• Milligrams per liter (mg/L), or parts per million (ppm) of total dissolved solids (TDS). The units mg/L and ppm are interchangeable.
• Electrical conductivity (EC), expressed as deci-Siemens per meter (dS/m), millimhos per centimeter (mmhos/cm), or micromhos per centimeter (μmhos/cm). The units dS/m and mmhos/cm are interchangeable, and μmhos/cm = mmhos/cm x 1000.
Salts in solution exist as ions that can conduct an electric current, so EC increases as dissolved salt concentration increases. The EC of Florida waters usually ranges between 0 and 5 dS/m.
The conversion from EC to TDS depends on the kind of salts present in the solution. TDS (in ppm) can be estimat-ed by multiplying EC (in dS/m or mmhos/cm) by 700. This conversion factor is an average value appropriate for converting the EC of Florida soil extracts and irrigation waters to TDS. Many conductivity meters that provide a direct salinity reading in ppm have a built-in conversion factor in the range of 630 to 640. Care must be taken to ensure that measurements made by different conductivity meters are comparable.
Vast amounts of salts can be deposited on the soil by long-term irrigation with high-salinity water. For example, 100 gallons of water at 3000 ppm TDS contains about 2.5 lbs of salt. Since the weekly irrigation requirement of a bear-ing citrus tree can exceed three times this amount, soil salts can quickly accumulate. Even 1000 ppm TDS water (con-taining 0.8 lbs salt in 100 gallons) can create salt stress.
Since soil salt concentration depends on soil water con-tent, soil salinity is often related to a standard saturation extract (ECe). The ECe standardizes soil salt concentra-tion to the saturation soil water content. Thus, salinity around tree roots may be several times greater than ECe when soil moisture is at field capacity or less. In sandy soils, where salts are easily leached, management decisions based solely on ECe measurement are not advised. ECe of these soils only indicates soil salinity at the time of measurement and can change rapidly following irrigation or rainfall.
The main citrus tree response to excess salts in soil and irri-gation water is growth reduction. Injury symptoms caused by saline irrigation water are not usually permanent, but affected trees may remain stunted compared with trees not receiving salty water especially if they are young.
Salts in solution exert an osmotic effect that reduces water availability through both chemical and physical processes. Roots are not able to extract as much water from a solu-tion high in salts compared with one low in salts. In effect, the trees must expend more energy to move water through them, which reduces root growth followed by reductions in shoot growth and yield.
The critical salinity concentration will vary with the buffering capacity of the soil (that increases with clay and organic matter content), the climate, the rootstock used, and the soil moisture status. Salinity-induced symptoms

70 71
like reduced root growth, decreased flowering, smaller leaf size, and impaired shoot growth are often difficult to assess but occur prior to ion toxicity symptoms in the leaves. Chloride toxicity, which appears as burned necrotic or dry-appearing edges on leaves, is one of the most common visible salt injury symptoms. Sodium toxicity symptoms are seldom seen in Florida, but sometimes high Na may cause an overall leaf “bronzing” accompanied by reduc-tions in growth. As with Cl, high leaf Na can cause nutri-ent imbalances at much lower concentrations than those required to produce visible symptoms. Since Na and Cl are highly soluble in soil water, evaluating salinity stress by measuring their concentration in the soil has little diag-nostic value.
Common citrus rootstocks tolerate soil salinity differently. The ranking of rootstocks from most tolerant to least tol-erant of salinity is: 1. Cleopatra mandarin; 2. sour orange; 3. sweet orange; 4. Swingle citrumelo; 5. Carrizo citrange; 6. rough lemon. Grapefruit trees tend to be less salt toler-ant than orange trees.
Fertilizer application frequency directly affects soil solu-tion TDS concentration. A fertilization program that frequently applies low rates of soluble salts will normally result in less salinity stress than programs applying only two or three high-rate doses per year. Use of controlled-release fertilizers or fertigation can minimize salt stress if high-salinity irrigation water must be used. Growers using salty irrigation water usually observe a marked improve-ment in water quality when summer rains begin.
Selecting nutrient sources that have a relatively small os-motic effect on the soil solution can help reduce salt stress. The osmotic effect of a fertilizer is defined as its salt index relative to sodium nitrate, which arbitrarily has a salt index of 100. Phosphorus sources have a low salt index and pres-ent little problem. Conversely, N and K sources can have a high salt effect (Appendix C). The salt index of inorganic and natural organic fertilizers are low compared with commonly-used soluble fertilizers. High analysis fertilizers may have a lower salt index per unit of plant nutrient than lower-analysis fertilizers because they may be made with lower salt index materials. Thus, at a given fertilization rate, a high-analysis formulation will likely produce less salt injury.
Selecting nutrient sources that do not add a potentially harmful ion to already high concentrations in irrigation water can reduce the likelihood of a salinity problem. The Cl- in KCl or Na+ in NaNO3 add potentially harmful salts to the soil solution. High application rates of fertilizer salts
can raise soil pH and decrease soil nutrient availability. Specific ions can also aggravate nutrient imbalances in soil and trees. For example, Na+ displaces K+ and to a lesser ex-tent Ca2+ in soil solutions. Displacement of K+ by Na+ can lead to K deficiency and in some cases even Ca2+ deficiency in leaves when repeatedly irrigating with water high in Na+. Nutrient deficiencies compound the effects of salinity stress. Problems can be minimized if sufficient nutrition is maintained through either soil or foliar fertilizer applica-tion.
Nutrient management with saline irrigation water• Routinely evaluate irrigation water salinity with an EC
meter. TDS below 1000 ppm is excellent. A salt prob-lem may become evident as TDS increases from 1000 to 2000 ppm, and is highly likely if TDS exceeds 2000 ppm.
• If excess salts accumulate in the soil, keep the soil moist so they are less concentrated.
• Fine-textured soils and areas of compacted soils or poor drainage may need special management to flush excess salts from the root zone.
• Do not allow salty water to contact leaves, especially when evaporation demand is high.
• Use nighttime irrigation whenever possible to minimize evaporation and salt deposition.
• Choose fertilizer formulations with the lowest salt index per unit of plant nutrients.
• Increase fertilization frequency, which will help reduce the salt content of each application and will aid in pre-venting excess salt accumulation in the root zone.
• Maintain optimum but not excessive nutrient concen-trations in the leaves.
• Base fertilization rates on the long-term production of the grove. Decrease fertilizer rates applied to trees irrigated with salty water compared with trees irrigated with good quality water, since production is probably lower.
• Use leaf tissue analysis to detect excessive leaf Na or Cl or deficiencies of other elements caused by salt-induced nutrient imbalance.
11.6. Using reclaimed water for irrigation
Reclaimed municipal effluent is an excellent citrus irriga-tion water source as long as it is produced under strict quality control. As Florida’s population continues to grow, treated wastewater will become increasingly important for irrigation.

70 71
Long term use of large quantities of reclaimed water can increase soil pH and soil test P and Ca. Leaf analysis may sometimes show increased Na, Cl, and B concentrations with no observed tree injury. Differences in uptake of vari-ous elements in the water (Table 11.2) can be expected to occur among varieties and rootstocks.
Table 11.2. Chemical composition of reclaimed municipal effluent from the city of Orlando and Orange county’s Water Conserv II project compared with typical well water and drink-ing water standards (Parsons et al., 2001).
Element or parameter
Drinking water MCL1
(ppm)
Typical well water
(ppm)Typical Conserv II
water (ppm)
EC (μmhos) 781 360 720Arsenic 0.05 --- <0.005Boron --- 0.02 <0.25
Cadmium 0.005 --- <0.002Calcium --- 39 42Chloride 250 15 75 – 81
Chromium 0.1 --- <0.005Copper 1.0 0.03 0.002 – 0.05
Lead 0.015 --- <0.003Magnesium --- 16 9Manganese 0.05 0.01 0.006 – 0.042
Nickel 0.1 --- 0.01Nitrate-N 10 3 6 – 7
Phosphorus --- 0.01 1.1Potassium --- 6 12
Sodium 160 18 50 – 70Sulfate 250 23 29 – 55
1Maximum contamination limit.
Essential elements in reclaimed water contribute to citrus tree nutrition, so it may be possible to reduce fertilizer rates if reclaimed water is the sole source of irrigation. For example, applying 50 acre-inches/yr of reclaimed water containing 10 ppm N would supply 113 lbs N/acre. How-ever, even in low rainfall years, trees in Florida do not need 50 inches of irrigation, so considerable leaching would occur if this volume was applied. Hence, N fertilization is still needed when irrigating with reclaimed water.
It has been determined that P and B inputs could be reduced or eliminated when using large quantities of reclaimed water. Leaf Na, Cl, and B should be routinely monitored to avoid their reaching toxic levels under re-claimed water irrigation.
Limited studies have shown that it is feasible to grow citrus using citrus processing effluent as an irrigation source. However, certain variables must be considered in the design and management of irrigation systems for use of this water. Daily flow from the processing plant, weekly loading depth to the land, and the storage capacity of the soil should all be considered when determining the needed land area. As with other reclaimed water sources, efflu-ent monitoring procedures at the processing facility are needed to ensure that acceptable quality is maintained.
Nutrient concentrations in citrus processing wastewater are too low to sustain tree growth (Table 11.3), so supple-mental fertilization is necessary. Rootstocks and scion varieties should be selected for their tolerance to excess Na contained in processing effluent.
Table 11.3. Average chemical composition of citrus processing wastewater (Koo, 1973).
Source A Source A Source B Source CNot
treated Treated Treated Treated
pH 7.2 7.7 7.8 5.7ppm
TDS 639 612 412 225Total N 119 7 8 10
Nitrate-N 2 2 4 3P 1 2 1 1K 35 33 22 12
Ca 44 47 32 37Mg 10 10 7 3Na 169 137 81 24Cl 81 48 48 14Fe 2 1 0.4 16
Mn 0 0 0 0.2Zn 0.01 0.05 0.03 0.1B 0 0 0 0.2
11.7. Fertilization strategies for damaged trees
11.7.1. Wind damage
Strong sustained winds from tropical storms or hurricanes can damage citrus trees by removing canopy and fruit. Root damage may also occur if a storm produces flooding rains. The main nutritional factors related to severe canopy thinning are loss of leaf N and K reserves and interrup-tion of the natural nutrient recycling that occurs as tree residues decompose and mineralize in root zone soil. As a

72 73
result, subsequent vegetative growth may deplete remain-ing tree and soil reserves of N and K. Additional fertiliza-tion beyond the normal program is justified to aid grove recovery in this situation, as long as the root system is not significantly damaged.
To determine how much additional N and K2O to ap-ply, start with the assumption that every 10% loss of leaf canopy from an average grove represents a loss of about 10 lbs N/acre, then estimate a target fertilizer rate based on the relative amount of leaf canopy that the grove has lost and the efficiency of the fertilizer application method to be used. Keep the following considerations in mind when attempting to replace lost canopy N and K with additional fertilizer as the grove recovers:• Reduce the fertilizer rate for smaller trees.• It will take time to re-build a full, healthy canopy.• Distribute additional N and K fertilizer throughout the
following growing season as normal. Do not front-load all of it in the spring.
• Consider foliar application in place of soil application.• Remember that bloom and fruit set in the following
year will depend more on environmental conditions and less on fertilizer rates.
When root systems are extensively damaged from pro-longed flooding, the tree canopy will recover more slowly. In this case, fertilization should be reduced until the root system can rejuvenate. Surviving roots are more likely to be close to the soil surface, with the lower ones damaged or killed. Addition of fertilizer at rates normally applied to vigorous trees may further damage roots.
11.7.2. Freeze damage
Trees should not be fertilized or irrigated following a severe freeze until the extent of damage is determined and re-growth is evident. Stored nutrients in bearing trees on a regular fertilizer program can mobilize to new shoots and leaves, especially after severe wood damage. No more than 50% of the recommended N rate should be applied to severely-damaged citrus trees that will not produce a crop the following year, provided that optimum tree water status is maintained. It may be necessary to apply only N and foliar micronutrients. There is strong evidence that soil-applied fertilizer may not even be necessary for bear-ing trees in the first post-freeze season if they have received sufficient fertilization in the years prior to the freeze. Reduced fertilizer rates may be applied to 2 to 4-year-old trees with moderate freeze damage provided no crop is set following the freeze.
11.8. Nutritional deficiencies enhanced by environmental or pathological factors
Zinc deficiency patterns can be enhanced by citrus blight disease. When trees have blight, leaf symptoms will look the same as Zn deficiency. Leaves are reduced in size, off-color, and small blotches of yellow between green-colored veins in the leaf will appear. In many cases, the leaf Zn deficiency pat-tern may not be evenly distributed within the tree canopy.
Iron deficiency can result from flooding injury to the citrus root system. Root damage can occur if the root zone soil is flooded for several days in the summer but may take weeks to occur in the cooler winter months. The pattern will first appear on young, expanding leaves. The leaf turns light green, while the veins and midrib remain darker green.
Nitrogen deficiency, or “winter chlorosis,” can occur in late winter or early spring when rapid tree growth begins and soil temperature is too cool for normal root function and nutrient uptake. When this occurs the midrib will begin to yellow while the remaining portion of the leaf remains darker green.
Phytophthora-induced N deficiency occurs when the roots or tree trunk become infected resulting in partial or complete girdling that causes the tree to decline. Leaves express visual symptoms of vein yellowing typical of N deficiency. The deficiency pattern may be associated with individual limbs in the case or foot rot or could involve the entire tree in the case of root damage. The deficiency appears as the ability of the roots or trunk to transport N upward into the tree canopy is reduced.
11.9. Organic citrus production
11.9.1. General information
The exclusive use of certified organic nutrient sources in an organic production program may not be a viable alterna-tive for large scale Florida commercial citrus production. Limitations include an insufficient supply of non-synthetic fertilizers (manures, composts, etc.), sometimes slow avail-ability of nutrients with time from these materials, and the logistics of their transport, storage, and application. For the small producer, organic citrus production may be feasible depending on the availability and quality of ac-ceptable sources, customer acceptance of the product, and expected returns on investment. Yields, production costs, and market returns for organic citrus production have not been clearly defined in Florida.
Certified organic groves must have distinct, defined boundaries between fields managed organically and those

72 73
managed conventionally. Storage facilities and records for certified organic fields must be maintained separately from non-certified fields. A production unit may be certified as organic only if harvest occurs at least 36 months after the most recent use of prohibited pesticides or fertilizers. Records of all fertilizer and soil amendment use must be kept for at least 3 years prior to certification.
Organic fertilization programs for citrus emphasize methods to improve soil fertility and health through the use of organic fertilizers and soil amendments. Soil management includes increasing soil organic matter (humus) content by mowing, grazing, growing green manure and N-fixing cover crops in row middles, and applying manures, composts, and natural fertilizers. Annual nutrient application rates for organically-grown young trees and bearing trees should be similar to those recommended for conventionally-grown trees.
Citrus production operations applying for initial or ongo-ing organic certification must comply with regulations established under the National Organic Program (NOP) and applicable organic production regulations. Informa-tion about various aspects of the NOP is available on the internet at http://www.ams.usda.gov/NOP/NOPhome.html. This web page provides links to several other web pages where additional information can be found.
The U.S. Dept. of Agriculture (USDA) does not provide organic certification, but instead accredits state, private, and foreign organizations, groups, or persons to become certifying agents. FDACS has not assumed this role, so growers must choose a private USDA-accredited organic certification agency.
11.9.2. Soil fertility and crop nutrient management guidelines
( These guidelines are summarized from Section 205.203 of the NOP final rule.)• Producers should implement tillage and cultivation prac-
tices to maintain or improve the physical, chemical, and biological condition of soil and minimize soil erosion.
• Producers should manage crop nutrients and soil fertil-ity through rotations, cover crops, and application of plant and animal materials.
• Producers should manage plants and animal materials to maintain or improve soil organic matter in a man-ner that does not contribute to contamination of crops, soil, or water by plant nutrients, pathogenic organisms, heavy metals, or residues of prohibited substances. Ani-mal and plant materials include:o Raw animal manure (feces, urine, other excrement,
and bedding produced by livestock that has not been composted):Can be applied to land used for a crop not intend-
ed for human consumption.Must be incorporated into the soil not less than
120 days before harvesting a product that comes into contact with the soil surface or soil particles.
Must be incorporated into the soil not less than 90 days before harvesting a product that does not come into contact with the soil surface or soil particles.
o Composted plant and animal materials produced through a process that:Established an initial carbon-to-nitrogen ratio
between 25:1 and 40:1; andMaintained temperature between 131° F and 170°
F for 3 days using an in-vessel or static aerated pile system, or
Maintained temperature between 131° F and 170° F for 15 days using a windrow composting system, turning the materials at least five times.
o Non-composted plant materials.A producer may apply:Crop nutrients or soil amendments allowed for
use in organic production;Mined substances of low solubility;Mined substances of high solubility, provided
that it is used in compliance with the conditions established on the National List of non-synthetic materials prohibited for crop production;
Ash obtained from the burning of a plant or animal material, provided it has not been treated or combined with a prohibited substance or the ash is not included on the National List of non-synthetic substances prohibited for use in organic crop production; and
Plant or animal material that has been chemically altered by a manufacturing process, as long as it is included on the National List of synthetic sub-stances allowed for use in organic crop production.
A producer may not use:Any fertilizer or composted plant and animal
material that contains a synthetic substance not in-cluded on the National List of synthetic substances allowed for use in organic crop production.
Biosolids.Burning as a means of disposal for crop residues
produced on the operation. (Exception: burning may be used to suppress the spread of disease.)

74 75
12.1.Refereedjournalarticles
Albrigo, L. Gene. 1999. Effects of foliar applications of urea or Nutriphite on flowering and yields of Valencia orange trees. Proc. Fla. State Hort. Soc. 112:1-4.
Alva, A. K. 1993. Comparison of Mehlich 3, Mehlich 1, ammonium bicarbonate-DTPA, 1.0M ammonium acetate, and 0.2M ammonium chloride for extraction of calcium, magnesium, phosphorus, and potassium for a wide range of soils. Commun. Soil Sci. Plant Anal. 24(7&8):603-612.
Alva, A. K., and S. Paramasivam. 1998. Nitrogen management for high yield and quality of citrus in sandy soils. Soil Sci. Soc. Am. J. 62:1335-1342.
Alva, A. K., S. Paramasivam, and W. D. Graham. 1998. Impact of nitrogen management practices on nutritional status and yield of Valencia orange trees and groundwater nitrate. J. Environ. Qual. 27:904-910.
Alva, A. K., S. Paramavisam, W. D. Graham, and T. A. Wheaton. 2003. Best nitrogen and irrigation management practices for citrus production in sandy soils. Water, Air, and Soil Pollution 143:139-154.
Alva, A. K., S. Paramasivam, T. A. Obreza, and A. W. Schumann. 2006. Nitrogen best management practice for citrus trees I. Fruit yield, quality, and leaf nutritional status. Scientia Horticulturae 107:233-244.
Alva, A. K., S. Paramasivam, A. Fares, T. A. Obreza, and A. W. Schumann. 2006. Nitrogen best management practice for citrus trees II. Nitrogen fate, transport, and components of N budget. Scientia Horticulturae 109:223-233.
Boman, B. J., M. Zekri, and E. Stover. 2005. Managing salinity in citrus. HortTechnology 15(1):108-113.
Hanselman, T. A., D. A. Graetz, and T. A. Obreza. 2004. A comparison of in situ methods for measuring net nitrogen mineralization rates of organic soil amendments. J. Env. Qual. 33:1098-1105.
He, Z. L., D. V. Calvert, A. K. Alva, D. J. Banks, and Y. C. Li. 2003. Thresholds of leaf nitrogen for optimum fruit production and quality in grapefruit. Soil Sci. Soc. Am. J. 67:583-588.
Lamb, S. T., W. D. Graham, C. B. Harrison, and A. K. Alva. Impact of alternative citrus management practices on groundwater nitrate in the central Florida ridge I. Field investigation. Trans. ASAE 42:1653-1668.
Lea-Cox, J. D., and J. P. Syvertsen. 1995. Nitrogen uptake by Citrus leaves. J. Amer. Soc. Hort. Sci. 120:505-509.
Mattos, Jr., D., D. A. Graetz, and A. K. Alva. 2003. Biomass distribution and nitrogen-15 partitioning in citrus trees on a sandy Entisol. Soil Sci. Soc. Am. J. 67:555-563.
Mattos, Jr., D., J. A. Quaggio, H. Cantarella, and A. K. Alva. 2003. Nutrient content of biomass components of Hamlin sweet orange trees. Scientia Agricola 60(1):155-160.
Obreza, T. A., R. E. Rouse, and J. B. Sherrod. 1999. Economics of controlled-release fertilizer use on young citrus trees. J. Prod. Agric. 12:69-73.
Obreza, T. A., and R. E. Rouse. 2006. Long-term response of ‘Hamlin’ orange trees to controlled-release fertilizers. HortScience 41(2):423-426.
Orbovic, V., D. Achor, P. Petracek, and J. P. Syvertsen. 2001. Air temperature, humidity, and leaf age affect penetration of urea through grapefruit leaf cuticles. J. Amer. Soc. Hort. Sci. 126:44-50.
Ozores-Hampton, M., T. A. Obreza, and G. Hochmuth. 1998. Using composted wastes on Florida vegetable crops. HortTechnology 8:130-137.
Paramasivam, S., and A. K. Alva. 1997. Leaching of nitrogen forms from controlled-release nitrogen fertilizers. Commun. Soil Sci. Plant Anal. 28:1663-1674.
Paramasivam, S., A. K. Alva, K. H. Hostler, G. W. Easterwood, and J. S. Southwell. 2000. Fruit nutrient accumulation of four orange varieties during fruit development. J. Plant Nutrition 23(3):313-327.
Paramasivam, S., A. K. Alva, A. Fares, and K. S. Sajwan. 2001. Estimation of nitrate leaching in an Entisol under optimum citrus production. Soil Sci. Soc. Am. J. 65:914-921.
12. References and Further Reading(Note: References in Sections 12.1 through 12.3 are the information sources from which new material in this second edition of “Nutrition of Florida Citrus Trees” was obtained.)

74 75
Parsons, L. R., T. A. Wheaton, and W. S. Castle. 2001. High application rates of reclaimed water benefit citrus tree growth and fruit production. HortScience 36:1273-1277.
Parsons, L. R., and B. J. Boman. 2006. Best management practices for Florida citrus. HortTechnology 16(3):389-393.
Schumann, A. W., W. M. Miller, Q. U. Zaman, K. H. Hostler, S. Buchanon, and S. Cugati. 2006. Variable rate granular fertilization of citrus groves: spreader performance with single-tree prescription zones. Applied Engineering in Agriculture 22(1):19-24.
Wang, F. L., and A. K. Alva. 1996. Leaching of nitrogen from slow-release urea sources in sandy soils. Soil Sci. Soc. Am. J. 60:1454-1458.
Zekri, M., L. R. Parsons, and R. C. J. Koo. 2000. Irrigation of Florida citrus orchards with reclaimed municipal wastewater. Proc. International Soc. Citriculture. IX Congr. 1:554-558.
12.2. Non-refereed journal articles
Boman, B. J. 1997. Effectiveness of fall potassium sprays on enhancing grapefruit size. Proc. Fla. State Hort. Soc. 110:1-7.
Boman, B. J., and J. W. Hebb. 1998. Post bloom and summer foliar K effects on grapefruit size. Proc. Fla. State Hort. Soc. 111:128-135.
Boman, B. J. 2001. Foliar nutrient sprays influence yield and size of ‘Valencia’ orange. Proc. Fla. State Hort. Soc. 114:83-88.
Futch, S. H. (ed.). 2003. Nutrient management for optimum citrus tree growth and yield – short course proceedings. Fla. Coop. Extension Serv., Gainesville, FL.
Koo, 1973. Irrigation of citrus with citrus processing waste water. Proc. Fla. State Hort. Soc. 86:233-237.
Koo, R. C. J. 1988. Fertilization and irrigation effects on fruit quality. p. 35-42. In J. J. Ferguson and W. F. Wardowski (eds.). Factors affecting fruit quality – citrus short course proceedings. Fla. Coop. Extension Serv., Gainesville, FL.
Morgan, K. T., T. A. Obreza, and T. A. Wheaton. 2006. The basis for mature citrus nitrogen fertilizer recommendations. Proc. Fla. State Hort. Soc. 119:168-171.
Sartain, J. B. 1978. Adaptability of the double-acid extractant to Florida soils. Soil Crop Sci. Soc. Proc. 37:204-208.
Schumann, A. W., A. Fares, A. K. Alva, and S. Paramasivam. 2003. Response of ‘Hamlin’ orange to fertilizer source, annual rate, and irrigated area. Proc. Fla. State Hort. Soc. 116:256-260.
Schumann, A. W., K. H. Hostler, S. M. Buchanon, and Q. Zaman. 2006. Relating citrus canopy size and yield to precision fertilization. Proc. Fla. State Hort. Soc. 119:148-154.
12.3. Extension publications, articles, and books
Boman, B. J. 2002. Water and Florida Citrus: Use, Regulation, Irrigation, Systems, and Management. Univ. of Florida-IFAS SP 281.
Lovatt, C. J., and R. L. Mikkelsen. 2006. Phosphite fertilizers: What are they? Can you use them? What can they do? Better Crops Plant Food 90(4):11-13.
Obreza, T. A. 2004. Maintenance guide for Florida microirrigation systems. Univ. of Florida-IFAS Circular 1449.
12.4. Historical documents
Koo, R. C. J., C. A. Anderson, I. Stewart, D. P. H. Tucker, D. V. Calvert, and H. K. Wutscher. 1984. Recommended fertilizers and nutritional sprays for citrus. Fla. Coop. Extension Serv. Bulletin 536D.
Tucker, D. P. H., A. K. Alva, L. K. Jackson, and T. A. Wheaton. 1995. Nutrition of Florida citrus trees. Univ. of Florida-IFAS Publication SP 169.

76 77
Acid-forming fertilizer – A fertilizer capable of increasing soil acidity, derived principally from the nitrification of ammonium salts by soil bacteria.
Adsorption - the adhesion in an extremely thin layer of molecules (as of gases, solutes, or liquids) to the surfaces of solid bodies or liquids with which they are in contact.
Association of American Plant Food Control Officials – An organization of officers and their deputies charged by law with regulating the sale of fertilizers, and of research workers employed by state or federal agencies engaged in the investigation of fertilizers. Its object is to promote uniform and effective legislation, definitions, and rulings, and to enforce the laws relating to the control of sale and distribution of fertilizers and fertilizer materials.
Basic fertilizer – A fertilizer capable of decreasing soil acidity.
Biuret – A phytotoxic impurity formed when urea molecules condense (combine) during fertilizer manufacture.
Brand – Term, design, or trademark used in connection with one or several grades of commercial fertilizer.
Bulk fertilizer – A fertilizer distributed in a non-packaged form, usually in semi-trailers.
Clear liquid fertilizer – A fertilizer in which the N-P-K and other materials are completely dissolved.
Commercial fertilizer – Any substance containing one or more recognized plant nutrients that is designed for use or claimed to have value in promoting plant growth or that is designed for use or claimed to have value in controlling soil acidity or alkalinity (except non-manipulated animal and vegetable manures).
Complete fertilizer – A mixed fertilizer that contains the three major plant nutrient elements: nitrogen, phosphorus, and potassium.
Coning – The formation of a pyramidal pile or cone of dry bulk mixed fertilizer such as may occur while being loaded into a holding hopper or transport vehicle and cause separation and segregation of the fertilizer components.
Dealer – Any person, other than the manufacturer, who offers for sale, sells, barters, or otherwise supplies commercial fertilizer.
Deconing – Any accepted process employed by a manufacturer that will prevent or minimize coning.
Deficiency – The amount of nutrient found by analysis less than that guaranteed, which may result from lack of nutrient ingredients or from lack of uniformity.
Dry bulk blending – The process of mechanically mixing solid fertilizer materials.
Excess – The amount found by analysis over and above that guaranteed on the label.
Fertilizer – Any substance containing one or more recognized plant nutrients that is used for its plant nutrient content. Unprocessed animal and vegetable manures, marl, lime, limestone, wood ashes, and other products are exempt from this definition.
Fertilizer formula – An expression of the quantity and analysis of the materials in a mixed fertilizer.
Fertilizer grade – The percentages in mixed fertilizer of total nitrogen (N), available phosphoric acid (P2O5), and the soluble potash (K2O), stated in whole numbers in the same terms, order, and percentages as in the “guaranteed analysis” form (15-5-15, for example). Mixed fertilizer containing a total of 5% or less of total N, P2O5, and K2O may be guaranteed in other than whole percentages; however, a minimum guarantee shall be established by rule.
Fertilizer material – A fertilizer that either:• containsimportantquantitiesofnomorethan
one of the primary plant nutrients nitrogen (N), phosphoric acid (P2O5), and potash (K2O); or
• has85%ormoreofitsplantnutrientcontentpresentin the form of a single chemical compound; or
• isderivedfromaplantoranimalresidueorby-product or natural material deposit that has been processed in such a way that its content of plant nutrients has not been materially changed except by purification and concentration.
Fertilizer ratio – Refers to the relative percentages of N, P2O5, and K2O (a 15-5-15 has a 3-1-3 ratio).
Filler – A “make-weight” material added to a mixed fertilizer or fertilizer material to make up the difference between the weight of the added ingredients required to supply the plant nutrients in a ton of a given analysis and 2000 lbs.
13. Glossary

76 77
Fluid fertilizer – Clear or suspension liquid fertilizers.
Granulation – The process of manufacturing fertilizer particles of reasonably uniform size and stability.
Label – A display of written, printed, or graphic matter upon the immediate container of any commercial fertilizer or accompanying same when moved in bulk.
Manufacturer – A person engaged in the business of importing, preparing, mixing, blending, or manufacturing commercial fertilizer for sale, either to direct consumers or through other media of distribution.
Marl – A friable earthy deposit consisting of clay and calcium carbonate.
Mixed fertilizer – A fertilizer containing any combination or mixtures of commercial fertilizers designed for use or claimed to have value in promoting plant growth.
Non-acid-forming, or “neutral” fertilizer – A fertilizer that is guaranteed to leave neither an acidic nor a basic residue in the soil.
Official sample – Any sample of commercial fertilizer taken by FDACS or its representative, in accordance with the provisions of the fertilizer law.
Organic – A material containing carbon and one or more elements, other than hydrogen and oxygen, essential for plant growth. When the term “organic” is used on the label, it shall be qualified as either “synthetic organic” or “natural organic,” with the percentage of each specified. When the term “organic” is used, it must be clearly indicated that it refers only to the nitrogen or other applicable portion of the fertilizer.
• “Natural organic” is a byproduct from processing of animal or vegetable substances that contain sufficient plant nutrients to be of value as fertilizers.
• “Syntheticorganic”isamaterialthatismanufacturedchemically (by synthesis) from its elements or other chemicals, as contrasted to those found ready-made in nature.
Percent – Indicates percentage by weight.
Primary plant nutrient – Any form of nitrogen, phosphoric acid, or potash, or any combination of these substances.
Registrant – The person who registers commercial fertilizer under the provisions of the fertilizer law.
Secondary plant nutrient – Any element or substance useful as plant nutrient other than the primary plant nutrients.
Slow or controlled-release fertilizer – A fertilizer containing a plant nutrient in a form that delays its availability for plant uptake and use after application, or which extends its availability to the plant significantly longer than a reference “rapidly available nutrient fertilizer,” like ammonium nitrate or urea, ammonium phosphate, or potassium chloride. When slow or controlled-release nutrient is claimed or advertised, the guarantee for such a nutrient shall be shown as a footnote and shall be expressed as percent of actual nutrient. When a slowly released nutrient is less than 15% of the guarantee for either total nitrogen, available phosphoric acid, or soluble potash, as appropriate, the label shall bear no reference to such designations.
Soil amendment – A material applied to improve or enhance soil characteristics for plant growth.
Sorb – To take up and hold by either adsorption or absorption.
Specialty fertilizer – Commercial fertilizer in packages sold or offered for sale for home use.
Suspension fertilizer – A fertilizer in which some of the fertilizer materials are suspended as fine particles.
Tolerance – The variation authorized by law or regulation from the guaranteed analysis.
Unit of plant nutrient – 1% of a ton, or 20 lbs.
Water insoluble nitrogen – Nitrogen not soluble in water. All organic nitrogen soluble in water shall be classified as “water-soluble organic nitrogen.” However, soluble organic nitrogen derived from urea may be classified either as “urea nitrogen” or “water-soluble organic nitrogen,” at the option of the registrant. Nitrogen in the nitrate or ammoniacal forms shall be so classified.

78 79

78 79
14. Appendices

80 81

80 81
Appendix A. Physical and chemical properties of typical Florida citrus soils.Table A.1. Typical root zone1 soil physical and chemical properties for common soil series found in Florida citrus groves.
Physical properties Chemical propertiesSoil texture Organic
matterWater-holding capacity
pH
Cation exchange capacitySoil series
Sand Silt Clay inches per ft
inches in the root
zone% meq/100 gENTISOLSAstatula 98.5 0.75 0.75 0.5 – 1.0 0.3 – 0.6 0.9 – 1.8 4.5 – 6.5 2 – 4Basinger 98.5 0.5 1.0 0.5 – 1.0 0.4 – 0.8 0.6 – 1.2 3.6 – 7.3 2 – 4Candler 97.5 1.25 1.25 0.5 – 1.0 0.3 – 0.7 0.9 – 2.1 4.5 – 6.0 2 – 4Tavares 97.0 1.5 1.5 0.5 – 1.0 0.3 – 0.6 0.9 – 1.8 3.6 – 6.0 2 – 4ALFISOLSBoca 94.0 3.0 3.0 1.0 – 2.5 0.4 – 0.9 0.6 – 1.4 5.1 – 8.4 6 – 10Holopaw 94.0 3.5 2.5 1.0 – 2.5 0.7 – 1.2 1.1 – 1.8 5.1 – 7.3 3 – 7Pineda 96.0 2.5 1.5 0.5 – 2.0 0.3 – 0.6 0.5 – 0.9 5.6 – 7.3 2 – 6Riviera 96.5 2.0 1.5 0.5 – 2.0 0.6 – 1.0 0.9 – 1.5 4.5 – 6.5 2 – 6Winder 85.0 6.0 9.0 1.0 – 3.0 0.7 – 1.2 1.1 – 1.8 5.6 – 7.8 14 – 18SPODOSOLSImmokalee 98.5 1.0 0.5 1.0 – 2.0 0.4 – 0.8 0.6 – 1.2 3.6 – 6.0 2 – 6Myakka 98.5 1.0 0.5 1.0 – 2.0 0.4 – 0.8 0.6 – 1.2 3.6 – 6.5 2 – 6Oldsmar 98.0 1.5 0.5 1.0 – 2.0 0.3 – 0.6 0.5 – 0.9 3.6 – 7.3 2 – 6Pomona 96.0 3.5 0.5 1.0 – 2.0 0.4 – 1.0 0.6 – 1.5 3.6 – 5.5 2 – 6Smyrna 97.0 2.5 0.5 1.0 – 3.0 0.4 – 0.8 0.6 – 1.2 3.6 – 7.3 2 – 6Wabasso 97.5 1.5 1.0 1.0 – 2.0 0.3 – 0.6 0.5 – 0.9 4.5 – 7.0 2 – 6
1Top 36 inches of soil for central ridge Entisols and top 18 inches of soil for flatwoods Alfisols, Spodosols, and Entisols.
Table A.2. Physical and chemical properties of the subsurface diagnostic layers of typical Alfisols and Spodosols found in Florida flatwoods citrus groves. These layers may reside in an undisturbed state beneath the root zone, or they may be partially excavated and mixed into the root zone soil during the bedding process.
Physical properties Chemical propertiesSoil texture Organic
matterWater-holding
capacity pH
Cation exchange capacitySoil series Layer
Sand Silt Clay
% inches per ft meq/100 gALFISOLSBoca Loamy 81.0 4.0 15.0 0.3 – 1.2 1.2 – 1.8 5.1 – 8.4 16 – 24Holopaw Loamy 80.0 7.0 13.0 0.2 – 0.4 1.8 – 2.4 5.1 – 8.4 11 – 22Pineda Loamy 77.0 3.5 19.5 0.1 – 0.3 1.2 – 1.8 5.1 – 8.4 4 – 18Riviera Loamy 77.0 4.5 18.5 0.2 – 0.3 1.4 – 1.8 6.1 – 8.4 9 – 24Winder Loamy 80.0 4.0 16.0 0.1 – 0.3 1.2 – 1.8 6.6 – 8.4 12 – 26SPODOSOLSImmokalee Organic 95.0 2.5 2.5 2.5 – 3.8 1.2 – 3.0 3.3 – 4.4 14 – 25Myakka Organic 90.5 5.0 4.5 2.8 – 4.5 1.2 – 2.4 4.0 – 4.7 13 – 18Oldsmar Organic 92.0 3.5 4.5 1.8 – 3.0 1.2 – 1.8 4.7 – 5.3 7 – 15Pomona Organic 93.0 5.5 1.5 1.0 – 1.5 1.2 – 1.8 4.0 – 4.7 5 – 15Smyrna Organic 90.5 5.0 4.5 3.3 – 3.9 1.2 – 1.8 4.3 – 4.7 19 – 21Wabasso Organic 93.0 2.0 5.0 1.8 – 2.1 1.2 – 1.8 4.7 – 5.2 5 – 12

82 83
Appendix B. Nutrient concentrations of fertilizer materials.Table B.1. Conventional and slow-release sources.
MaterialPercentage composition
AvailabilityN P2O5 K2O Ca Mg S Other
Conventional sourcesAmmonium molybdate 54 Mo RapidAmmonium nitrate 34 RapidAmmonium polyphosphate 10 34 RapidAmmonium sulfate 21 23 RapidAmmonium thiosulfate 12 26 RapidBorax 10 – 15 B RapidCalcitic limestone 32 SlowCalcium ammonium nitrate 27 6 RapidCalcium nitrate 15.5 20 RapidCalcium sulfate (gypsum) 23 18 ModerateCopper sulfate 12 25 – 35 Cu RapidDiammonium phosphate 18 46 0 – 2 RapidDolomitic limestone 8 - 20 22 Ca SlowIron (ferrous) sulfate 20 Fe RapidIron oxy-sulfate 45 – 50 Fe SlowIron DTPA 10 Fe RapidIron EDTA 9 – 12 Fe RapidIron EDDHA 6 Fe RapidIron HEDTA 5 – 9 Fe RapidIron humate 25 – 28 Fe ModerateIron sucrate 50 Fe ModerateMagnesium oxide 56 ModerateMagnesium sulfate 10 RapidManganese oxide 41 – 68 Mn ModerateManganese sulfate 13 24 Mn ModerateMonoammonium phosphate 11 48 0 – 2 RapidPhosphoric acid 54 RapidPhosphorous acid 40 - 60 ModeratePotassium chloride 60 44 Cl RapidPotassium-magnesium sulfate 22 11 22 ModeratePotassium nitrate 13 48 RapidPotassium phosphite 28 26 ModeratePotassium sulfate 46 18 RapidPotassium thiosulfate 25 17 RapidSodium molybdate 39 Mo RapidSulfur, elemental 30 - 99 ModerateSuperphosphate, ordinary 20 20 10 - 14 RapidSuperphosphate, concentrated 46 16 1 - 2 Rapid
(continued on p. 83)

82 83
MaterialPercentage composition
AvailabilityN P2O5 K2O Ca Mg S Other
Urea 46 RapidUrea-ammonium nitrate 28 - 32 RapidZinc oxide 50 – 78 Zn ModerateZinc sulfate 12 21 – 36 Zn ModerateZinc EDTA 9 – 14 Zn RapidZinc HEDTA 9 Zn RapidSlow-release sourcesSulfur-coated urea 32 - 38 3 - 6 mo.Urea formaldehyde 38 - 40 6 - 12 mo.Isobutylidene diurea (IBDU) 31 3 - 6 mo.
Table B.2. Organic sources.
MaterialPercentage composition
AvailabilityN P2O5 K2O Ca Mg S Other
Organic sourcesOrganiform 30 SlowMunicipal biosolids 3 - 7 1 - 7 0.5 - 1 ModerateActivated biosolids 6 2 0.5 ModerateBlood meal 8 - 13 2 1 RapidBone meal 1 - 4 18 - 34 SlowCottonseed meal 6 3 1 MediumFish meal 9 4 - 6 RapidAlfalfa meal 2.5 0.3 2 MediumSoybean meal 7 1.5 2 MediumPoultry manure 3 3 Rapid (depends on bedding)Poultry litter pellets 4 2 2 RapidPoultry manure compost 5 3 2 RapidCow manure 1 1 Rapid (if fresh)
Table B.1. (continued)

84 85
Appendix C. Salt index of fertilizer materials.Table C.1. Salt index of water-soluble fertilizers.
Salt index
Material and analysis Per equal weights of materials (Basis: sodium nitrate = 100)
Per unit (20 lbs) of plant nutrients
NitrogenAmmonium nitrate, 34% N 104.0 3.059Ammonium sulfate, 21% N, 24% S 68.3 3.252Calcium nitrate,15.5% N 65.0 4.194Sodium nitrate, 16% N 100.0 6.060Urea 74.4 1.618Urea-ammonium nitrate solution, 28% N 63.0 2.250Urea-ammonium nitrate solution, 32% N 71.1 2.221PhosphateDiammonium phosphate, 18% N, 46% P2O5 29.2 0.456Superphosphate, ordinary, 20% P2O5 7.8 0.390Superphosphate, concentrated, 45% P2O5 10.1 0.224Ammonium polyphosphate, 10% N, 34% P2O5 20.0 0.455PotassiumPotassium chloride, 60% K2O 116.2 1.936Potassium hydroxide, 83% K2O --- 1.015Potassium nitrate, 13% N, 44% K2O 69.5 1.219Potassium sulfate, 50% K2O, 18% S 42.6 0.852Monopotassium phosphate, 52% P2O5, 34% K2O 8.4 0.097Potassium-magnesium sulfate, 22% K2O, 11% Mg, 22% S 43.4 1.971
Table C.2. Example salt index calculation for a dry fertilizer.
15-4-15 dry granular Nutrient units Salt index
Material Nutrient conc. lbs/ton N P2O5 K2O per unit (20 lbs)
(from table C.1) in the formula
Ammonium nitrate 34% N 882 15 3.059 45.9Conc. superphosphate 45% P2O5 178 4 0.224 0.9Potassium chloride 60% K2O 500 15 1.936 29.0Filler 440Total 2000 15 4 15 75.8
Table C.3. Example salt index calculation for a solution fertilizer.
8-0-8 solution Nutrient units Salt index
Material % Nutrient lbs/ton N P2O5 K2O per unit (20 lbs) (from table C.1) in the formula
Ammonium nitrate 34% N 329 5.6 3.059 17.1
Potassium nitrate 13% N 44% K2O 364 2.4 8 1.219 9.8
Water 1307Total 2000 8 0 8 26.9
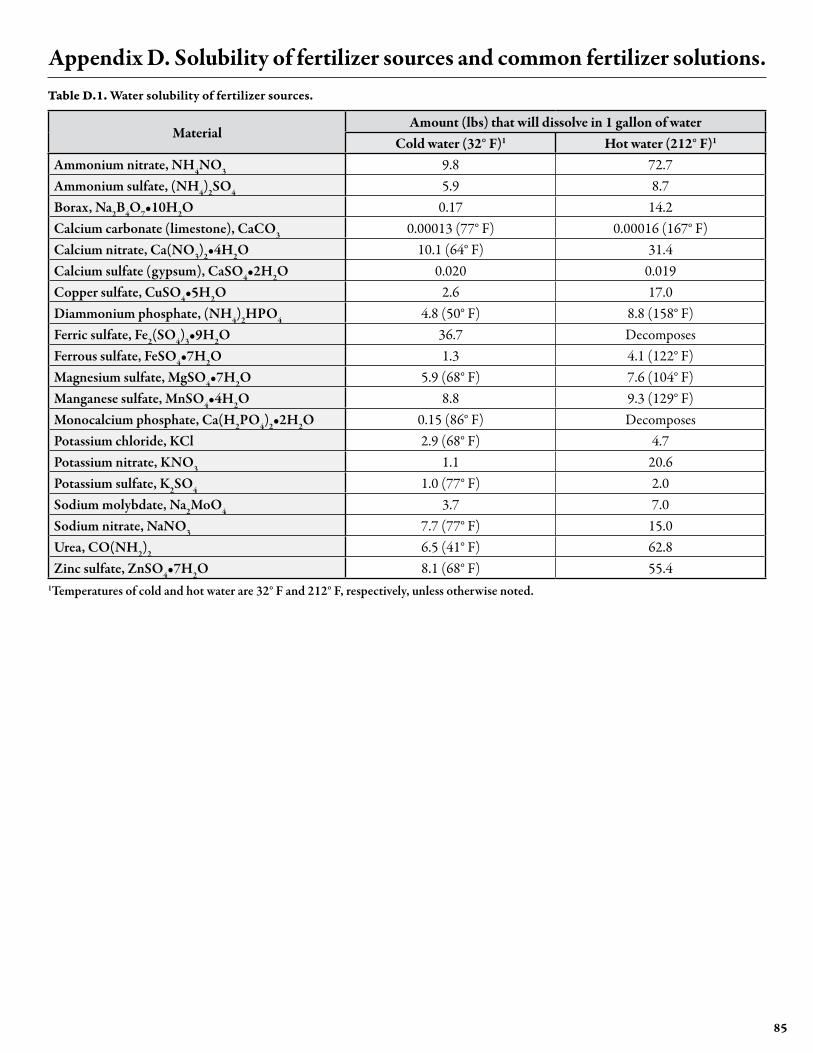
84 85
Appendix D. Solubility of fertilizer sources and common fertilizer solutions.Table D.1. Water solubility of fertilizer sources.
MaterialAmount (lbs) that will dissolve in 1 gallon of water
Cold water (32° F)1 Hot water (212° F)1
Ammonium nitrate, NH4NO3 9.8 72.7Ammonium sulfate, (NH4)2SO4 5.9 8.7Borax, Na2B4O7•10H2O 0.17 14.2Calcium carbonate (limestone), CaCO3 0.00013 (77° F) 0.00016 (167° F)Calcium nitrate, Ca(NO3)2•4H2O 10.1 (64° F) 31.4Calcium sulfate (gypsum), CaSO4•2H2O 0.020 0.019Copper sulfate, CuSO4•5H2O 2.6 17.0Diammonium phosphate, (NH4)2HPO4 4.8 (50° F) 8.8 (158° F)Ferric sulfate, Fe2(SO4)3•9H2O 36.7 DecomposesFerrous sulfate, FeSO4•7H2O 1.3 4.1 (122° F)Magnesium sulfate, MgSO4•7H2O 5.9 (68° F) 7.6 (104° F)Manganese sulfate, MnSO4•4H2O 8.8 9.3 (129° F)Monocalcium phosphate, Ca(H2PO4)2•2H2O 0.15 (86° F) DecomposesPotassium chloride, KCl 2.9 (68° F) 4.7Potassium nitrate, KNO3 1.1 20.6Potassium sulfate, K2SO4 1.0 (77° F) 2.0Sodium molybdate, Na2MoO4 3.7 7.0Sodium nitrate, NaNO3 7.7 (77° F) 15.0Urea, CO(NH2)2 6.5 (41° F) 62.8Zinc sulfate, ZnSO4•7H2O 8.1 (68° F) 55.4
1Temperatures of cold and hot water are 32° F and 212° F, respectively, unless otherwise noted.

86 87
Table D.2. Common fertilizer solutions.
AnalysisDensity
Materials and formulation Additional nutrientsN P K
% lbs/gallonComponent solutions
21 0 0 10.8 Ammonium nitrate solution9 0 0 10.4 Ammonium sulfate solution 10 S
10 34 0 11.8 Ammonium polyphosphate12 0 0 11.0 Ammonium thiosulfate 26 S17 0 0 12.6 Calcium ammonium nitrate solution 9 Ca9 0 0 11.3 Calcium nitrate solution 11 Ca
32 0 0 11.1 Urea ammonium nitrate solution0 54 0 14.5 Phosphoric acid, merchant grade3 0 11 9.7 Potassium nitrate solution0 0 62 16.5 Potassium chloride solution7 0 0 11.3 Magnesium nitrate 6 Mg7 0 0 13.4 Manganese nitrate 15 Mn7 0 0 13.3 Zinc nitrate 17 Zn
Fertilizer solutions5 0 10 10.0 Ammonium nitrate, potassium chloride5 0 10 10.5 Ammonium nitrate, potassium chloride, magnesium nitrate Micronutrients8 0 8 9.8 Ammonium nitrate, potassium nitrate8 0 8 9.7 Ammonium nitrate, potassium chloride8 0 8 11.6 Calcium nitrate, potassium nitrate8 0 8 12.0 Calcium nitrate, potassium chloride8 0 8 10.2 Ammonium nitrate, potassium chloride, magnesium nitrate 1 Mg8 2 8 10.3 Ammonium nitrate, potassium nitrate, phosphoric acid8 2 8 10.0 Ammonium nitrate, potassium chloride, phosphoric acid8 4 8 10.3 Ammonium nitrate, potassium nitrate, phosphoric acid8 4 8 10.0 Ammonium nitrate, potassium chloride, phosphoric acid9 0 9 10.2 Ammonium nitrate, potassium nitrate9 0 9 10.2 Ammonium nitrate, potassium chloride9 2 9 10.7 Ammonium nitrate, potassium nitrate, phosphoric acid9 2 9 10.6 Ammonium nitrate, potassium chloride, phosphoric acid9 4 9 10.7 Ammonium nitrate, potassium nitrate, phosphoric acid9 4 9 10.6 Ammonium nitrate, potassium chloride, phosphoric acid
10 0 10 10.4 Ammonium nitrate, potassium nitrate10 0 10 10.3 Ammonium nitrate, potassium chloride

86 87
The following table summarizes the above calculations.
Table E.1. Components of a fertilizer blend with 16-5-16-3.6 Mg nutrient ratio.
MaterialTotal material
weight N P2O5 K2O Mg
lbs per tonDiammonium phosphate (18-46-0) 174 31 80Potassium-magnesium sulfate (0-0-22-11Mg) 655 144 72Ammonium nitrate (34-0-0) 850 289Potassium chloride (0-0-60) 293 176Filler 28Totals 2000 320 80 320 72
1. Assume that the annual fertilizer recommendation for a citrus grove is 160 lbs of N, 40 lbs of P2O5, 160 lbs of K2O, and 36 lbs of Mg per acre, and that the yearly rate will be split into four applications.
2. The nutrients required per application are 40 lbs of N, 10 lbs of P2O5, 40 lbs of K2O, and 9 lbs of Mg per acre. The fertilizer blend to be used contains 16% N, 4% P2O5, 16% K2O, and 3.6% Mg.
3. The amount of this fertilizer needed is: (40 lbs N per acre) ÷ (0.16) = 250 lbs per acre. If the grove is 80 acres, then the amount of fertilizer to order is: (250 lbs per acre) × (80 acres) = 20,000 lbs = 10 tons.
4. One ton of this fertilizer contains 320 lbs of N, 80 lbs of P2O5, 320 lbs of K2O, and 72 lbs of Mg. In this example, 1 ton will be blended using the following materials: Ammonium nitrate (34% N), diammonium phosphate, or DAP (18% N, 46% P2O5), potassium chloride (60% K2O); and potassium-magnesium sul-fate, or SPM (22% K2O, 11% Mg).
5. The P fertilizer is supplied by only one source, DAP. The amount needed is: (80 lbs P2O5) ÷ (0.46) = 174 lbs DAP.
6. The Mg fertilizer is also supplied by only one source, SPM. The amount needed is: (72 lbs Mg) ÷ (0.11) = 655 lbs SPM.
7. In addition to supplying P, DAP also supplies some N: (174 lbs DAP) × (0.18) = 31 lbs N.
8. The balance of the N, to be obtained from ammonium nitrate, is: (320 lbs N) – (31 lbs N) = 289 lbs N. Thus, the amount needed is: (289 lbs N) ÷ (0.34) = 850 lbs ammonium nitrate.
9. In addition to supplying Mg, SPM also supplies some K2O: (655 lbs SPM) × (0.22) = 144 lbs K2O.
10. The balance of the K2O, to be obtained from potassi-um chloride, is: (320 lbs K2O) – (144 lbs K2O) = 176 lbs K2O. Thus, the amount needed is: (176 lbs K2O) ÷ (0.60) = 293 lbs potassium chloride.
Appendix E. Fertilizer mixture formulation example.The following illustrates the procedure a bulk blending plant uses to formulate a fertilizer mixture. The formula is only an example and should not be regarded as a recommendation.

88 89
Appendix F. Example determination of the fertilizer requirement for bearing citrus trees.
We have a 40 acre block of 10-year old Hamlin orange trees on Carrizo citrange rootstock with an average yield of 567 boxes/acre during the past 3 years. How much fertilizer should the grove receive this year? Assume that we want to apply dry fertilizer material in three equal split applications.
1. Determine the annual N fertilizer requirement from the recommendations in Chapter 8, which for this example is 180 lbs/acre. The rate selection assumes healthy trees and optimum leaf N as indicated by leaf analysis.
2. Determine the annual K2O requirement. The rate recommendation for K2O in most cases will be the same as for N. Assuming trees in good condition and optimum leaf analysis for K, we will use 180 lbs K2O/acre/year.
3. Determine the need (if any) for P2O5 from Table 8.3. We will assume that our grove tests very low in Mehlich 1 P and a leaf test shows P in the low range. Therefore, we will supply P2O5 at 72 lbs P2O5/acre/year based on the previous year’s yield.
4. Determine if Mg is needed by inspecting leaves for deficiency symptoms, analyzing leaf tissue, and/or testing the soil. If tests reveal a deficiency, it could be corrected by including Mg in the fertilizer. If soil pH is below 5.3, dolomite should be applied to raise the pH to 6.0 – 6.5. We will assume that no Mg is needed.
5. Determine other nutritional deficiencies or excesses by inspecting leaves and confirming with leaf analysis. In this grove, corrections (if any) will be made by ap-plying a foliar nutritional spray that is not part of the routine soil-applied fertilizer program.
6. Establish the ratio of the fertilizer mix to be used, assigning a value of 1 to the N rate. In this example the relative values are N = 1, P2O5 = 0.4, and K2O = 1, so the ratio is 1-0.4-1.
7. Choose a fertilizer analysis that will provide the desired ratio. Examples of analyses that will provide a 1-0.4-1 ratio would be 10-4-10, 15-6-15, or 20-8-20. In this example, we will use a 10-4-10 fertilizer.
8. Determine the application frequency and distribution of the fertilizer in each application. This publication recommends applying at least one-half of the an-nual fertilizer rate between January and June. In this example we will fertilize three times during the year, applying one-third in February, one-third in May, and one-third in October. This schedule supplies two-thirds of the fertilizer during the January-June period.
9. Determine how many lbs/acre of 10-4-10 fertilizer are needed for each application to deliver the required amounts of N, P2O5, and K2O. Only the N value needs to be determined since P2O5 and K2O will be present in the appropriate amounts in the 10-4-10 mixed fertilizer.
The annual N fertilizer rate requirement is 180 lbs/acre, divided as follows:
February application (1/3) = 60 lbs/acre. May application (1/3) = 60 lbs/acre. October application (1/3) = 60 lbs/acre.
10. Determine how much 10-4-10 fertilizer to apply to each acre to achieve the required N, P2O5, and K2O rates.
Divide 60 lbs by 10%: (60 ÷ 0.10) = 600. Thus, we will apply 600 lbs of 10-4-10 to each acre in February, May, and October.
11. Multiply the lbs/acre of fertilizer needed by the number of acres in the grove to get amount needed per application.
600 lbs/acre of 10-4-10 × 40 acres = 24,000 lbs = 12 tons/application
Total amount of fertilizer needed for the year = 12 tons/application × 3 applications = 36 tons.

88 89
A1 Symptoms originate only on new growth, but often persist in mature growth.
B1 Leaves uniform in color; growth reduced; inter-nodes shortened, giving a bushy appearance.
C1 Leaves usually large and dark green. Shoots long and willowy in early stages, may have short and bushy secondary growth follow-ing dieback of long shoots; gum blisters may form along vigorous shoots at base of each petiole; multiple buds or sprouts may form at the nodes; fruit may show gum in tips of locules and brownish eruption on peel surface (exanthema)……COPPER
C2 New leaves pale green, turning yellow-green as they enlarge; growth is sparse……NITROGEN
C3 New growth is drab green, lusterless, sparse, with some misshapen leaves; fruit has gum deposits in the albedo peel layer……BORON
B2 Leaves with chlorosis patterns C1 Leaves reduced in size, pointed, narrow, with
sharply contrasting bright yellow mottling on a green background……ZINC
C2 Leaves approximately normal in size and shape.
D1 Pale green mottle over entire leaf; or, mottle may be a marbled pattern with dark green color following a crooked network of veins with light green color in between……MANGANESE
D2 Feather-like straight green veins on a light green or yellow background; in severe cases, leaves may be totally yellow, reduced in size, and twigs may die on the outer end of branches……IRON
A2 Symptoms originating on mature leaves, with young leaves appearing normal or nearly so.
B1 Pattern formed by fading of chlorophyll in local-ized areas, with gradual enlargement with time.
C1 Fading of chlorophyll starts in basal part of leaf between midrib and lateral leaf margin; spread is usually outward, leaving a green “wedge” pattern at the base of the leaf; however, it may be inward, causing a yel-low wedge; entire leaf may fade to a golden bronze color……MAGNESIUM
C2 Fading of chlorophyll starts along lateral leaf margins and moves inward about halfway to midrib with an irregular front margin……CALCIUM
C3 Fading of chlorophyll starts as blotches in dis-tal half of leaf; blotches are pale yellow at first, but deepen to bronze as they spread and co-alesce; foliage is drab, fruit is greatly reduced in size but of good quality……POTASSIUM
C4 Chlorophyll fading in spots randomly dis-tributed over the leaf blade; spots develop brown centers with a yellow or orange halo; spots range from one-quarter to one-half inch in diameter and appear only in the fall……MOLYBDENUM
B2 Fading of chlorophyll not localized. C1 Fading of leaf to dull green and eventually to
orange-yellow; in extreme cases, burned tips or spots may develop; fruit is coarse, spongy, and hollow-centered with thickened peel and above-normal acid……PHOSPHORUS
C2 General pale green to yellow foliage color with whitish veins; fruit is sparse and pale-colored both externally and internally; quality is good, but juice content is low……NITROGEN
Appendix G. Key to citrus nutrient deficiency symptoms. (Excerpted with minor modification from the book Nutrition of Fruit Crops. 1966. Horticultural publications, New Brunswick, NJ. Permission granted by the author of the article “Citrus Nutrition,” P. F. Smith, and the editor of the book, N. F. Childers.)
Many citrus nutrient deficiency symptoms are distinctive and can be diagnosed by skillful observation without the benefit of leaf analysis. Initial symptoms of nutrient deficiencies can be transient. As they become more severe, symptoms begin to intensify and will become permanent until corrected. Severe deficiencies in most cases are not easily corrected on the current crop of leaves and fruit, and correction may not be possible until new growth starts. To the untrained eye, injury from residual herbicides or other soil-applied chemicals may be confused with nutritional disorders. Multiple deficiencies may be encoun-tered where a distinctive pattern is not readily recognized. In such cases leaf analysis is essential in interpreting the condition.

90 91
Mongi Zekri
Mongi Zekri
Fig. H1. Nitrogen deficiency. Top: Moderate leaf N deficiency. Center: Severe leaf N-deficiency. Bottom: Severely N-deficient leaf at left compared with increasing N status to the right.
P deficient
Normal
IPNI
Fig. H2. Phosphorus deficiency. Note the thicker peel and hollow core of P-deficient fruit compared with normal fruit.
Appendix H. Color plates.
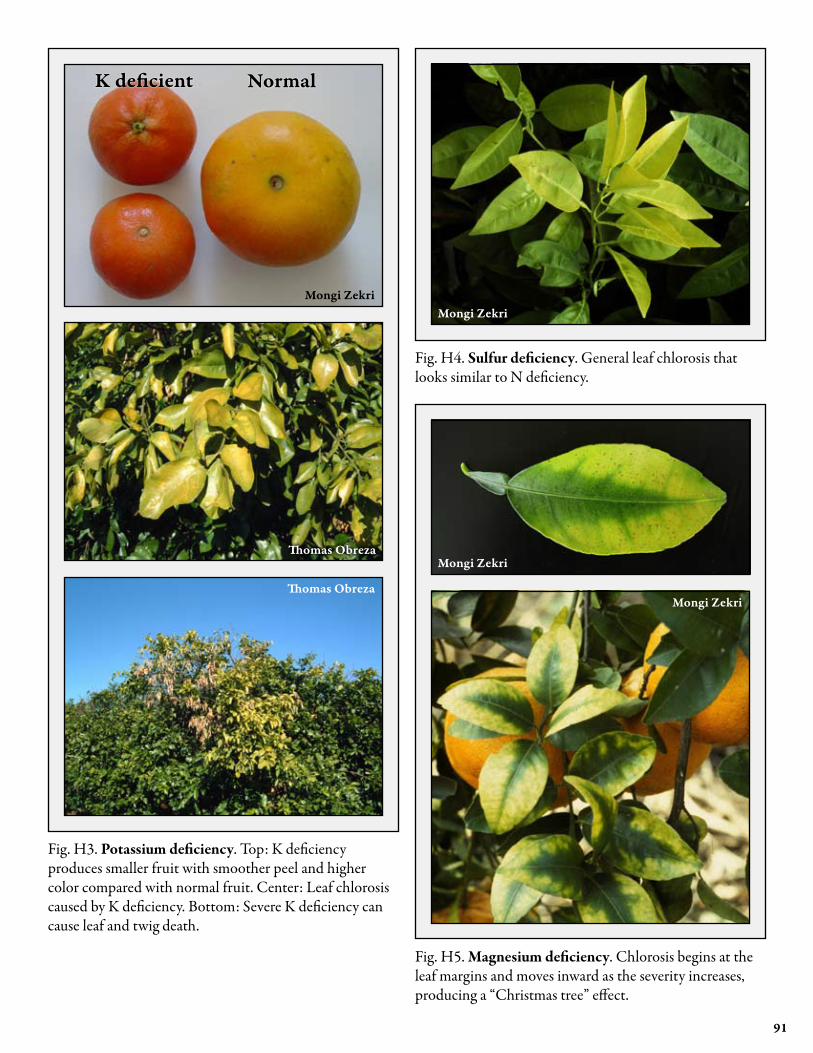
90 91
NormalK deficient
Mongi Zekri
Thomas Obreza
Thomas Obreza
Fig. H3. Potassium deficiency. Top: K deficiency produces smaller fruit with smoother peel and higher color compared with normal fruit. Center: Leaf chlorosis caused by K deficiency. Bottom: Severe K deficiency can cause leaf and twig death.
Mongi Zekri
Fig. H4. Sulfur deficiency. General leaf chlorosis that looks similar to N deficiency.
Mongi Zekri
Mongi Zekri
Fig. H5. Magnesium deficiency. Chlorosis begins at the leaf margins and moves inward as the severity increases, producing a “Christmas tree” effect.

92 93
Mongi Zekri
Mongi Zekri
Thomas Obreza
Fig. H6. Iron deficiency. Mild to severe from top to bottom. The major symptom is inter-veinal chlorosis. In severe cases, leaves are small and almost white, with twig die-back.
Mongi Zekri
Mongi Zekri
Fig. H7. Zinc deficiency. The major symptoms are inter-veinal chlorosis and smaller than normal leaves.

92 93
Mongi Zekri
Mongi Zekri
Fig. H8. Manganese deficiency. The main symptom is inter-veinal chlorosis of normal-size leaves.
Mongi Zekri
Fig. H9. Copper deficiency. Top: “Ammoniation” of fruit. Center: Gum pockets and twig dieback. Bottom: Vigorous, drooping branches and unusually dark green leaves with a “bowing up” of the midrib characterize Cu-N imbalance.

94 95
Fig. H10. Boron deficiency. Top: External symptoms on grapefruit. Center: Internal symptoms on grapefruit (thick peel, gum pockets in peel, gumming around core). Bottom: Close-up of gum pockets in peel.
Mongi Zekri
Fig. H11. Molybdenum deficiency. The main symptom is large yellow spots.

94 95
Mongi Zekri
Mongi Zekri
Mongi Zekri
Fig. H12. Salt damage. Top: Burn on leaf edges compared with normal leaf at right. Center: Salinity-induced chlorosis. Bottom: Severe leaf burn in the field.
Mongi Zekri
Mongi Zekri
Mongi Zekri
Fig. H13. Biuret toxicity (top and center). Urea spray burn (bottom).
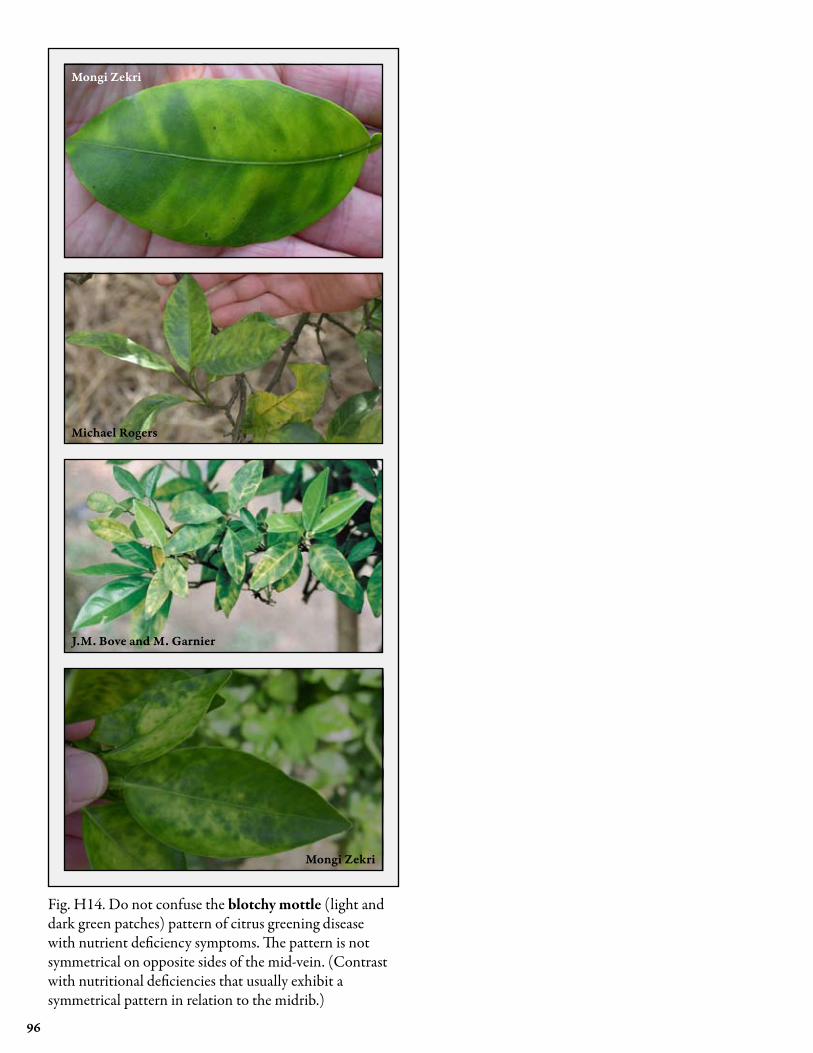
96
Mongi Zekri
Michael Rogers
J.M. Bove and M. Garnier
Mongi Zekri
Fig. H14. Do not confuse the blotchy mottle (light and dark green patches) pattern of citrus greening disease with nutrient deficiency symptoms. The pattern is not symmetrical on opposite sides of the mid-vein. (Contrast with nutritional deficiencies that usually exhibit a symmetrical pattern in relation to the midrib.)

96

The Institute of Food and Agricultural Sciences (IFAS) is an Equal Opportunity Institution authorized to provide research, educational information and other services only to individuals and institutions that function with non-discrimination with respect to race, creed, color, religion, age, disability, sex, sexual orientation, marital status, national origin, political opinions or affiliations. For more information on obtaining other UF/IFAS Extension publications, contact your county’s UF/IFAS Extension office.
U.S. Department of Agriculture, UF/IFAS Extension Service, University of Florida, IFAS, Florida A & M University Cooperative Extension Program, and Boards of County Commissioners Cooperating. Nick T. Place, dean for UF/IFAS Extension.
SL 253
Nutrition of Florida Citrus Trees