nutrition education in public elementary and …nces.ed.gov/pubs/96852.pdfnutrition education in...
TRANSCRIPT

NATIONAL CENTER FOR EDUCATION STATISTICS
Survey Report July 1996
Nutrition Education inPublic Elementary andSecondary Schools
Carin CelebuskiElizabeth FarrisWestat, Inc.
Judi CarpenterProject OfficerNational Center for Education Statistics
U.S. Department of EducationOffice of Educational Research and Improvement NCES 96-852

U.S. Department of Education U.S. Department of AgricultureRichard W. Riley Dan GlickmanSecretary Secretary
Office of Educational Research and Improvement Ellen HaasSharon P. Robinson Under Secretary for Food, Nutrition, andAssistant Secretary Consumer Services
National Center for Education Statistics Food and Consumer ServicePascal D. Forgione, Jr. William E. LudwigCommissioner Administrator
Jeanne E. Griffith Office of Analysis and EvaluationAssociate Commissioner Michael E. Fishman
Acting Director
National Center for Education Statistics"The purpose of the Center shall be to collect, and analyze,and disseminate statistics and other data related toeducation in the United States and in other nations."—Section 406(b) of the General Education Provisions Act, asamended (20 U.S. C. 1221e-1).
July 1996
Contact:Judi Carpenter(202) 219-1333
This report was prepared by Westat, Inc., under contract with the National Center for EducationStatistics and under a cooperative agreement with the Food and Consumer Service, U.S.Department of Agriculture.

iii
Highlights • Practically all public schools (99 percent) offer nutritioneducation somewhere within the curriculum, and many integrate itwithin the total curriculum (70 percent). Nutrition education isconcentrated within the health curriculum (84 percent), scienceclasses (72 percent), and school health program (68 percent)(table 1). Although nutrition education is an active area, theintensity and quality of the nutrition messages students arereceiving is not known.
• For each grade from kindergarten through eighth, 50 percent or
more of all schools have district or state requirements for studentsto receive nutrition education. However, only 40 percent havethese requirements for ninth and tenth grades; and about 20percent for eleventh and twelfth grades (figure 1).
• Topics in nutrition covered by more than 90 percent of all schools
are: the relationship between diet and health, finding and choosinghealthy foods, nutrients and their food sources, the Food GuidePyramid, and the Dietary Guidelines and goals (table 4).However, with the exception of the Food Guide Pyramid, less thanhalf of schools cover these topics thoroughly.
• Overall, schools focus on increasing students’ knowledge about
what is meant by good nutrition, with less emphasis on influencingstudents’ motivation, attitudes, and eating behaviors. Four of thefive topics covered by more than 90 percent of all schools arerelated to knowledge. With the exception of finding and choosinghealthy foods, less than one-third of schools provide thoroughcoverage of topics related to motivation, attitudes, and eatingbehaviors (table 4).
• Research has shown that schools or districts where the nutrition
education efforts are coordinated by a person or group have anopportunity to present a more focused message to students aboutthe importance of healthy eating. However, the majority ofschools (61 percent) have no nutrition education coordination,meaning each teacher is responsible for his or her own lessons(table 6).
• Most schools use materials developed by teachers in their schools
(90 percent), health or science textbooks (89 percent), andmaterials developed for a specific grade level (83 percent) (table10).
• Ninety-seven percent of schools report receiving nutrition lesson
materials from at least one source outside the school, most oftenfrom professional or trade associations (87 percent), and the foodindustry (86 percent). However, for any given outside source,only 37 percent or less of schools used all or

iv
most of the materials received. Of the materials from sourcesoutside the school, schools reported the highest classroom usagefor those received from the food industry or commodities groups,professional or trade associations, the USDA Food and NutritionInformation Center, and state education agencies (table 8).
• Over 90 percent of all schools offer nutrition education through
the school meals program. Most information is offered throughbulletin boards with nutrition displays (65 percent) or duringschool lunch week (51 percent). Less than half of school mealsprograms offer nutrient information, serve meals to correspondwith classroom activities, give tours or provide nutrition input tonewsletters. Less than one quarter of school meals programsprovide nutrition education in the classroom or conduct tastingparties (table 11).
• Most respondents (84 percent) are of the opinion that the meals
programs in their schools follow generally healthy eating practices(figure 5). Schools reporting that their meals programs followhealthy eating practices are substantially more likely to beinvolved in nutrition education activities than those that do notreport following them (table 14).

v
Table of Contents
Page
Highlights ..................................................................................................................... iii
Introduction ..................................................................................................................... 1
Nutrition Education in the School Curriculum.................................................................... 4
Nutrition Education Topics ............................................................................................... 7
Coordination of Nutrition Education.................................................................................. 10
Resources for Nutrition Education..................................................................................... 13
Materials Used to Teach Nutrition................................................................. 13Sources of Materials ..................................................................................... 13School Meals Program .................................................................................. 15Other Resources............................................................................................ 19
Summary and Conclusions ................................................................................................ 20
List of Appendices
Appendix
A Survey Methodology and Data Reliability...................................................... 23
B Tables of Standard Errors ............................................................................. 31
C Survey Form................................................................................................. 51
D U.S. Public Law 103-448. 103d Cong. 2 Nov. 1994. Child NutritionAct of 1966. Section 19(a) ........................................................................... 57

vi
List of Figures
Figure Page
1 Percent of public schools where nutrition is taught and where nutrition educationis required, by grade: 1995........................................................................................ 5
2 Percent of public schools where nutrition is taught and where nutrition educationis required in at least one grade, by instructional level: 1995...................................... 7
3 Percent of coordinators with various highest levels of training in nutrition or anutrition-related area: 1995....................................................................................... 12
4 Percent of public schools that report student and parent input into the mealsprogram, by geographic region: 1995 ........................................................................ 17
5 Percent of respondents who are of the opinion that their school meals programfollows generally healthy eating practices, by instructional level: 1995....................... 18
6 Percent of public schools that use special events for nutrition education: 1995 ........... 19

vii
List of Tables
Table Page
1 Percent of public schools offering nutrition education within the school curriculum,by school characteristics: 1995 ................................................................................. 4
2 Percent of public schools where nutrition is taught, by grade and geographicregion: 1995 ............................................................................................................. 6
3 Percent of public schools where nutrition education is required, by grade andgeographic region: 1995............................................................................................ 6
4 Percent of public schools that cover various topics in nutrition education, thepercent that cover them thoroughly, and the percent for whom the topicrepresents a main focus of nutrition education at their school: 1995 ............................ 8
5 Percent of public schools that cover various topics in nutrition education, byinstructional level: 1995............................................................................................ 9
6 Percent of public schools with various types of nutrition education coordination,by school characteristics: 1995 ................................................................................. 11
7 Percent of public schools offering nutrition education within the school curriculum,by person or group responsible for coordinating nutrition education: 1995 ................. 12
8 Percent of public schools that use various types of materials to teach nutritioneducation, by instructional level: 1995....................................................................... 13
9 Percent of public schools that receive and use materials for nutrition educationfrom various sources: 1995....................................................................................... 14
10 Percent of public schools that receive and use materials for nutrition educationfrom the Cooperative Extension Service, by school characteristics: 1995 ................... 15
11 Percent of public schools where the school meals program provides nutritioneducation or coordinates with classroom efforts, by instructional level: 1995 ............. 16
12 Percent of public schools where the school meals program provides nutritioneducation or coordinates with classroom efforts, by geographic region: 1995 ............. 16
13 Percent of public schools where the school meals program solicits input througha student advisory group or pretesting new foods, by instructional level: 1995 ........... 17
14 Percent of public schools that report various meals program efforts, bywhether the respondent is of the opinion that their school meals program followsgenerally healthy eating practices: 1995 .................................................................... 19

viii

1
Introduction The link between food and health has been well documented bynumerous studies and reports describing the impact of dietary intakeon disease prevention and health promotion. Dietaryrecommendations and long-term health objectives, including theDietary Guidelines for Americans1 and the Year 2000 HealthObjectives for the Nation, 2 call for Americans to reduce intake of totalfat, saturated fat, and cholesterol; increase intake of fruits, vegetables,grain products, and foods rich in calcium; and moderate intake ofsugars, salt, and alcohol.
Many Americans consume excess calories for their level of activity,and have diets inconsistent with the Dietary Guidelines for Americans--too high in fat, sodium, and sugar, with not enough grains, fruits, andvegetables. These unhealthy eating patterns may contribute to illnessand premature death in the long term.
Dietary factors are associated with 5 of the 10 leading causesof death: coronary heart disease, some types of cancer,stroke, noninsulin-dependent diabetes mellitus, andatherosclerosis.3
Because eating habits developed during childhood have the potential tolast a lifetime, it is important for children to learn about the benefits ofgood nutrition. Therefore, the Child Nutrition Act of 1966 viewsnutrition education as “a matter of highest priority.”4 Its importanceis further addressed in Healthy People 2000, the list of healthobjectives developed by the U.S. Public Health Service, in which thepublic health community seeks, by the year 2000, to increase to atleast 75 percent the proportion of the Nation’s schools that providenutrition education from preschool through 12th grade, preferably as apart of quality school health education. Education to establish healthyeating habits early in life can “assure that individuals have theinformation and skills they need to protect and enhance their ownhealth and the health of their families.”5
1 Dietary Guidelines for Americans. U.S. Department of Agriculture and U.S. Department of Health and Human
Services. Home and Garden Bulletin No. 232. Fourth Edition. 1995.
2Healthy People 2000: National Health Promotion and Disease Prevention Objectives. 1991. U.S. Departmentof Health and Human Services. Public Health Service. (PHS) 91-50212.
3Healthy People 2000, p. 112.
4 See Appendix D, Child Nutrition Act: P.L. 103-448, Sec. 19(a).
5 Healthy People 2000, p. 251.
2
The education community is also supportive of nutrition educationgoals. A guide for the education community, the National EducationGoals in the Goals 2000: Educate America Act states that, by theyear 2000, “all students will have access to physical education andhealth education to ensure they are healthy and fit.”
The U.S. Department of Agriculture (USDA) actively supports theseYear 2000 Goals through its School Meals Initiative for HealthyChildren,6 which promotes proper nutrition and nutrition educationfor children based on the Dietary Guidelines for Americans and theFood Guide Pyramid. This initiative requires schools to serve mealsthat meet Federal Dietary Guidelines and to teach children aboutnutrition so they will choose foods that are good for them. The USDAestablished Team Nutrition to help schools implement the newrequirements in the School Meals Initiative. The mission of TeamNutrition is to improve the health and education of young people bycreating innovative public and private partnerships that promote foodchoices for a healthful diet through media, schools, families, and thecommunity. Team Nutrition is working toward its goals through twoinitiatives which include training and technical assistance to schoolfood service personnel and adequate nutrition education for children.7
In-school efforts emphasize the importance of nutrition education tothe success of nutrition policy changes in school meals.
It is not enough to change the food on the plate. We must alsoprovide the knowledge and the skills that enable children tomake choices that lead to a nutritious diet and improvedhealth. It also is vital that local meal providers receivetraining on how to improve meal quality. This dual initiativeto educate children and assist meal providers offers manyopportunities to influence both what foods are offered byschools and what foods are eaten by children.8
These efforts are supplemented with materials developed anddistributed through partner networks and directly by USDA’s Foodand Consumer Service and its Cooperative State Research, Education,and Extension Service, as well as other government agencies such asthe Department of Education and the Department of Health andHuman Services.
6 Part of the implementation of the National School Lunch Program. 7CFR Parts 210 and 220.
7 Team Nutrition. 1995. U.S. Department of Agriculture.
8 Federal Register, June 13, 1995.

3
This report presents the findings from the survey Nutrition Educationin Public Schools, K-12 that was requested by the Food andConsumer Service of the USDA. It was designed to provide data onthe status of nutrition education in U.S. public schools in order to helptrack current and future initiatives. The survey was conducted duringthe spring of 1995 through the Fast Response Survey System (FRSS)of the National Center for Education Statistics (NCES) by Westat,Inc., a research firm in Rockville, Maryland.
The questionnaires were sent to 1,000 school principals of a nationallyrepresentative sample of U.S. public elementary, middle, and highschools (see Appendix A for survey methodology). The principalswere asked to assign the completion of the survey to the person mostknowledgeable about nutrition education at the school. Respondentswere encouraged to consult with others if they were unsure of theanswer to a question. The survey requested information about thefollowing issues:
• The placement of nutrition education in the curriculum, • The content of nutrition instruction, • The coordination of nutrition education, and • Resources for nutrition education.
Survey findings are presented for all schools and frequently by thefollowing school characteristics:
• School instructional level: elementary school; middle school;and high school.
• School enrollment size: small (less than 300); moderate (300-499); and large (500 or more).
• Metropolitan status of school: city; urban fringe; town; and
rural. • Geographic region: Northeast; Southeast; Central; and West.
Data have been weighted to national estimates of public schools. Allcomparative statements made in this report have been tested forstatistical significance though chi-square tests or t-tests adjusted formultiple comparisons using the Bonferroni adjustment and are

4
significant at the .05 level or better. However, not all statisticallysignificant comparisons have been presented.
NutritionEducation inthe SchoolCurriculum
Practically all public schools (99 percent) offer nutrition educationsomewhere within the curriculum and many integrate it within thetotal curriculum (70 percent ) (table 1). The most common placementis within the health curriculum (84 percent), but many schools alsoteach nutrition through science classes (72 percent), or through aschool health program (68 percent). While this does not provideinformation about the intensity or quality of the nutrition messagesstudents are receiving, it shows that the messages are being conveyedin a variety of ways within the schools.
Table 1.—Percent of public schools offering nutrition educationwithin the school curriculum, by school characteristics:1995
School characteristic
Some-wherewithincurric-ulum
Integratedwithin the
totalcurricu-
lum
Healthcurric-ulum
Sciencecurric-ulum
Schoolhealth
program
Homeeconom-
ics curric-ulum
All public schools... 99 70 84 72 68 41
Instructional levelElementary school ..... 100 80 81 73 67 16Middle school............ 99 55 85 71 66 72High school ............... 99 50 93 71 73 92
Size of enrollmentSmall......................... 99 71 82 69 66 44Moderate................... 99 72 83 74 68 27Large......................... 99 68 86 74 69 49
Metropolitan statusCity ........................... 99 78 83 73 66 29Urban fringe.............. 99 68 82 70 69 36Town......................... 99 69 85 70 69 44Rural ......................... 100 65 85 76 68 53
Geographic regionNortheast................... 100 72 79 75 71 40Southeast................... 100 71 78 71 70 38Central ...................... 100 68 88 69 69 45West.......................... 98 69 88 75 65 41
NOTE: Respondents could report nutrition education in more than one place.
SOURCE: U.S. Department of Education, National Center for Education Statistics, Fast ResponseSurvey System, “Nutrition Education in U.S. Public Schools, K-12,” FRSS 52, 1995.

5
Given their classroom organization, elementary schools (80 percent)tend more than schools at other instructional levels to offer nutritioneducation integrated within the total school curriculum, although halfor more of middle and high schools also reported this. High schoolsare most likely to place nutrition education within the healthcurriculum (93 percent) and the home economics curriculum (92percent). The health curriculum is also the most common placementfor nutrition education in middle schools (85 percent). Fifty-threepercent of rural schools offer nutrition education through the homeeconomics curriculum, compared with 29 percent of city schools.
Nutrition is taught in each and every grade from kindergarten throughtenth grade in over 90 percent of all public schools; it is taught ineleventh and twelfth grades in over 80 percent of schools (figure 1 andtable 2). These statistics do not reflect the proportion of studentsparticipating at each grade level, but give a broad overview ofnutrition education offerings. The percent of schools with nutritioneducation requirements is substantially lower at each grade level thanthe percent of schools that teach nutrition. For each grade fromkindergarten through eighth, at least 50 percent of all schools havedistrict or state requirements for students to receive nutritioneducation; 40 percent have these requirements for ninth and tenthgrades; about 20 percent for eleventh and twelfth grades (figure 1 andtable 3).
Figure 1.—Percent of public schools where nutrition is taught andwhere nutrition education is required, by grade: 1995
0
20
40
60
80
100
K 1 2 3 4 5 6 7 8 9 10 11 12
Grade
Percent
Taught
Required
SOURCE: U.S. Department of Education, National Center for Education Statistics, Fast ResponseSurvey System, “Nutrition Education in U.S. Public Schools, K-12,” FRSS 52, 1995.
6
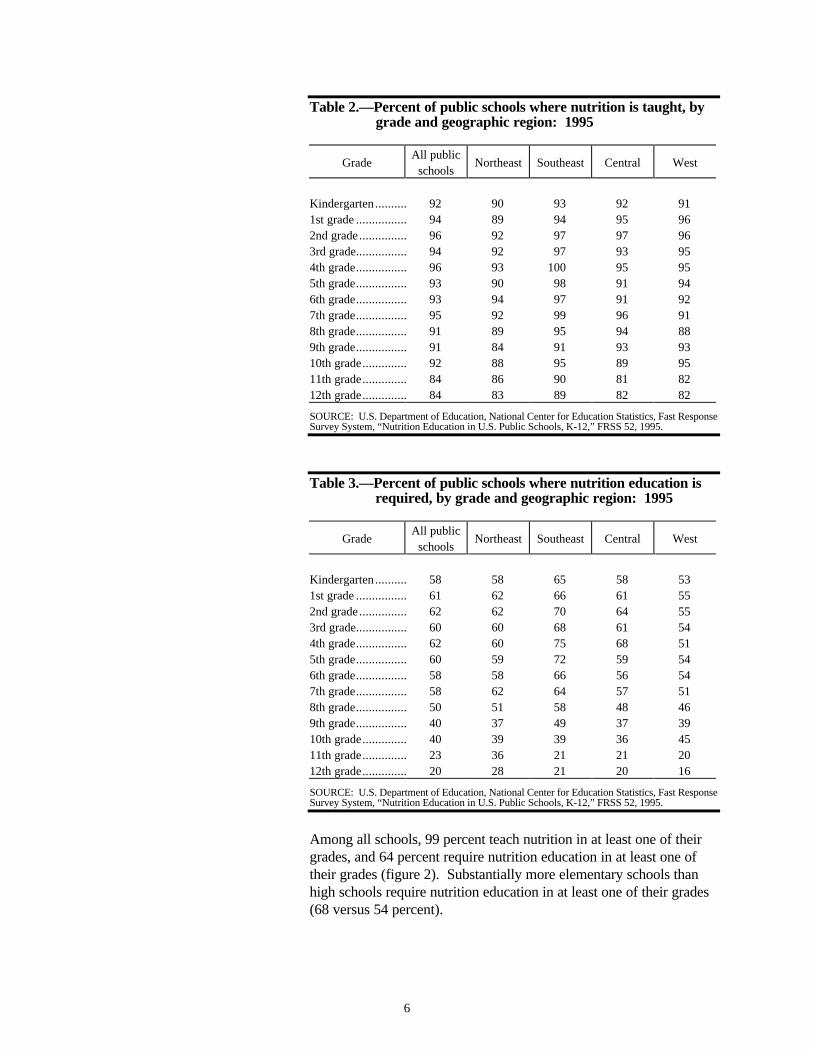
Table 2.—Percent of public schools where nutrition is taught, bygrade and geographic region: 1995
GradeAll public
schoolsNortheast Southeast Central West
Kindergarten .......... 92 90 93 92 911st grade ................ 94 89 94 95 962nd grade............... 96 92 97 97 963rd grade................ 94 92 97 93 954th grade................ 96 93 100 95 955th grade................ 93 90 98 91 946th grade................ 93 94 97 91 927th grade................ 95 92 99 96 918th grade................ 91 89 95 94 889th grade................ 91 84 91 93 9310th grade.............. 92 88 95 89 9511th grade.............. 84 86 90 81 8212th grade.............. 84 83 89 82 82
SOURCE: U.S. Department of Education, National Center for Education Statistics, Fast ResponseSurvey System, “Nutrition Education in U.S. Public Schools, K-12,” FRSS 52, 1995.
Table 3.—Percent of public schools where nutrition education isrequired, by grade and geographic region: 1995
GradeAll public
schoolsNortheast Southeast Central West
Kindergarten .......... 58 58 65 58 531st grade ................ 61 62 66 61 552nd grade............... 62 62 70 64 553rd grade................ 60 60 68 61 544th grade................ 62 60 75 68 515th grade................ 60 59 72 59 546th grade................ 58 58 66 56 547th grade................ 58 62 64 57 518th grade................ 50 51 58 48 469th grade................ 40 37 49 37 3910th grade.............. 40 39 39 36 4511th grade.............. 23 36 21 21 2012th grade.............. 20 28 21 20 16
SOURCE: U.S. Department of Education, National Center for Education Statistics, Fast ResponseSurvey System, “Nutrition Education in U.S. Public Schools, K-12,” FRSS 52, 1995.
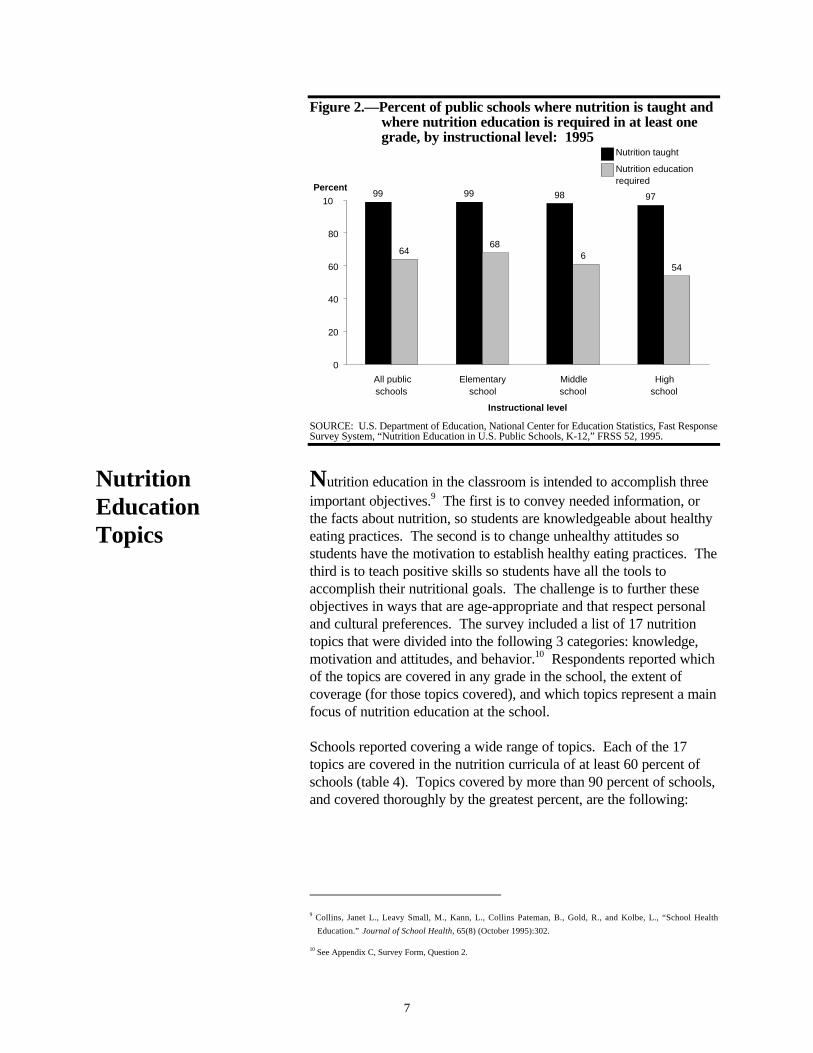
Among all schools, 99 percent teach nutrition in at least one of theirgrades, and 64 percent require nutrition education in at least one oftheir grades (figure 2). Substantially more elementary schools thanhigh schools require nutrition education in at least one of their grades(68 versus 54 percent).
7
Figure 2.—Percent of public schools where nutrition is taught andwhere nutrition education is required in at least onegrade, by instructional level: 1995
99 99 98 97
6468
61 54
0
20
40
60
80
10
All publicschools
Elementaryschool
Middleschool
Highschool
Instructional level
Percent
Nutrition taught
Nutrition educationrequired
SOURCE: U.S. Department of Education, National Center for Education Statistics, Fast ResponseSurvey System, “Nutrition Education in U.S. Public Schools, K-12,” FRSS 52, 1995.
NutritionEducationTopics
Nutrition education in the classroom is intended to accomplish threeimportant objectives.9 The first is to convey needed information, orthe facts about nutrition, so students are knowledgeable about healthyeating practices. The second is to change unhealthy attitudes sostudents have the motivation to establish healthy eating practices. Thethird is to teach positive skills so students have all the tools toaccomplish their nutritional goals. The challenge is to further theseobjectives in ways that are age-appropriate and that respect personaland cultural preferences. The survey included a list of 17 nutritiontopics that were divided into the following 3 categories: knowledge,motivation and attitudes, and behavior.10 Respondents reported whichof the topics are covered in any grade in the school, the extent ofcoverage (for those topics covered), and which topics represent a mainfocus of nutrition education at the school.
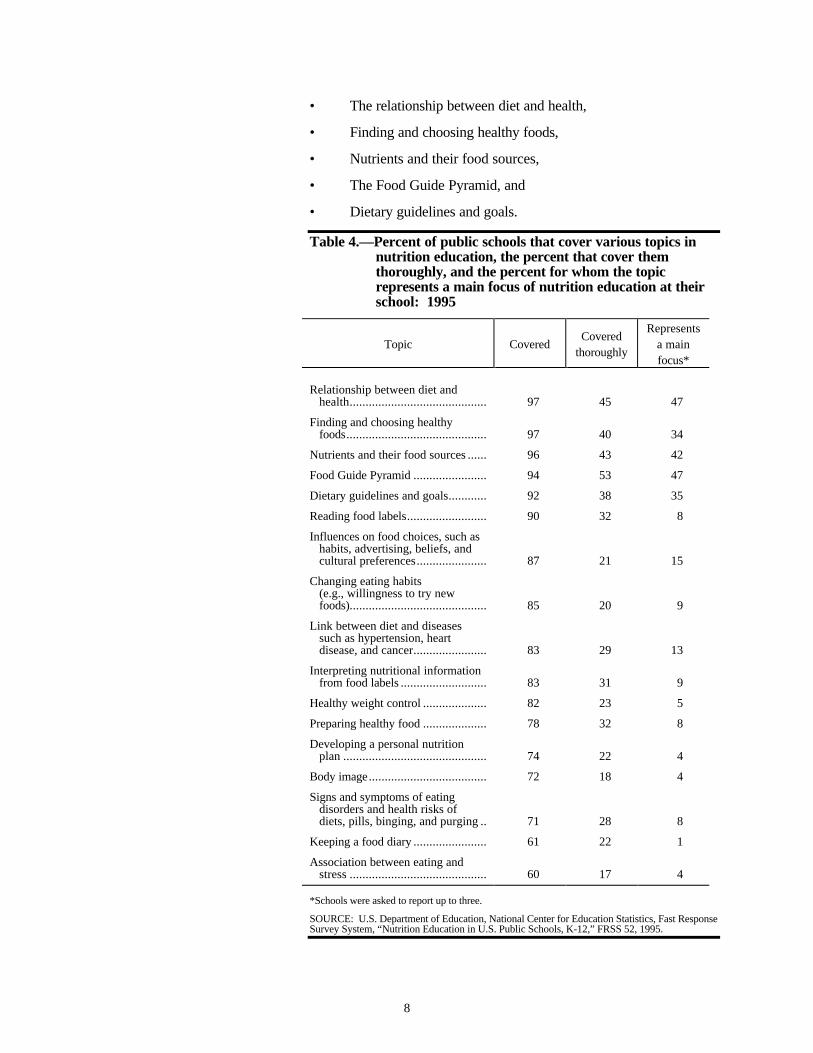
Schools reported covering a wide range of topics. Each of the 17topics are covered in the nutrition curricula of at least 60 percent ofschools (table 4). Topics covered by more than 90 percent of schools,and covered thoroughly by the greatest percent, are the following:
9 Collins, Janet L., Leavy Small, M., Kann, L., Collins Pateman, B., Gold, R., and Kolbe, L., “School Health
Education.” Journal of School Health, 65(8) (October 1995):302.
10 See Appendix C, Survey Form, Question 2.
8
• The relationship between diet and health,
• Finding and choosing healthy foods,
• Nutrients and their food sources,
• The Food Guide Pyramid, and
• Dietary guidelines and goals.
Table 4.—Percent of public schools that cover various topics innutrition education, the percent that cover themthoroughly, and the percent for whom the topicrepresents a main focus of nutrition education at theirschool: 1995
Topic CoveredCovered
thoroughly
Representsa mainfocus*
Relationship between diet andhealth........................................... 97 45 47
Finding and choosing healthyfoods............................................ 97 40 34
Nutrients and their food sources ...... 96 43 42
Food Guide Pyramid ....................... 94 53 47
Dietary guidelines and goals............ 92 38 35
Reading food labels......................... 90 32 8
Influences on food choices, such ashabits, advertising, beliefs, andcultural preferences...................... 87 21 15
Changing eating habits(e.g., willingness to try newfoods)........................................... 85 20 9
Link between diet and diseasessuch as hypertension, heartdisease, and cancer....................... 83 29 13
Interpreting nutritional informationfrom food labels ........................... 83 31 9
Healthy weight control .................... 82 23 5
Preparing healthy food .................... 78 32 8
Developing a personal nutritionplan ............................................. 74 22 4
Body image..................................... 72 18 4
Signs and symptoms of eatingdisorders and health risks ofdiets, pills, binging, and purging .. 71 28 8
Keeping a food diary ....................... 61 22 1
Association between eating andstress ........................................... 60 17 4
*Schools were asked to report up to three.
SOURCE: U.S. Department of Education, National Center for Education Statistics, Fast ResponseSurvey System, “Nutrition Education in U.S. Public Schools, K-12,” FRSS 52, 1995.

9
Many topics are covered at all instructional levels. However, highschools are more likely to cover such age-appropriate topics ashealthy weight control, body image, eating disorders, and theassociation between eating and stress; middle schools are next mostlikely; and elementary schools are least likely to cover these topics(table 5).
Table 5.—Percent of public schools that cover various topics innutrition education, by instructional level: 1995
TopicAll public
schoolsElementary
schoolMiddleschool
Highschool
Relationship between diet andhealth................................... 97 96 97 99
Finding and choosing healthyfoods.................................... 97 96 96 99
Nutrients and their foodsources................................. 96 95 96 99
Food Guide Pyramid ............... 94 93 94 96
Dietary guidelines and goals.... 92 90 93 97
Reading food labels................. 90 86 94 98
Influences on food choices,such as habits, advertising,beliefs, and culturalpreferences........................... 87 83 90 96
Changing eating habits(e.g., willingness to try newfoods)................................... 85 82 84 96
Link between diet and diseasessuch as hypertension, heartdisease, and cancer............... 83 76 93 96
Interpreting nutritionalinformation from food labels 83 77 91 97
Healthy weight control ............ 82 74 91 98
Preparing healthy food ............ 78 69 89 95
Developing a personal nutritionplan ..................................... 74 66 81 90
Body image............................. 72 62 82 93
Signs and symptoms of eatingdisorders and health risks ofdiets, pills, binging, andpurging ................................ 71 57 89 98
Keeping a food diary ............... 61 51 71 82
Association between eating andstress ................................... 60 46 75 92
SOURCE: U.S. Department of Education, National Center for Education Statistics, Fast ResponseSurvey System, “Nutrition Education in U.S. Public Schools, K-12,” FRSS 52, 1995.

10
Schools were asked to select the three topics that represent a mainfocus of nutrition education at their schools. The Food GuidePyramid and the relationship between diet and health were eachselected by 47 percent of all schools surveyed. Nutrients and theirfood sources were selected by 42 percent of schools, and 35 percentselected dietary guidelines and goals as part of the school’s main focus(table 4).
Coordinationof NutritionEducation
Research has shown that schools or districts where the nutritioneducation efforts are coordinated by a person or group have anopportunity to present a more focused message to students about theimportance of healthy eating. Coordination can integrate thecurriculum across grades so the nutrition lessons at each grade levelbuild on the previous year’s lessons, can integrate the nutritionmessages across subjects within a grade, and can integrate classroomnutrition lessons with related nonclassroom activities. In addition,coordinators can act as repositories and resources for materialsreceived by the school or district.
Schools reported the manner in which their nutrition education effortsare coordinated by a person or group. The majority of public schools(61 percent) have no nutrition education coordination, meaning eachteacher is responsible for his or her nutrition lessons (table 6). About9 percent of the schools have one person within the schoolcoordinating nutrition education; 24 percent coordinate using a groupor committee; and about 6 percent have someone outside the school,for example from the district, coordinate nutrition education.Coordination from outside the school is more likely for elementaryschools (8 percent) compared with middle schools (3 percent), and forcity schools (13 percent) compared with town (3 percent) or ruralschools (3 percent). A school’s type of nutrition educationcoordination does not affect the curriculum placement of nutritioneducation within the school (table 7).11
11 Because of the smaller sample sizes for each type of coordination, the standard errors for these percents were
large (see Table 7a in Appendix B). Therefore, the differences shown in table 7 are not statistically significant.

11
Table 6.—Percent of public schools with various types of nutritioneducation coordination, by school characteristics: 1995
School characteristicOne person
for the wholeschool
Severalteachers, agroup or
committee
Someoneoutside the
school*
Nocoordination
effort
All public schools.... 9 24 6 61
Instructional levelElementary school ...... 7 19 8 66Middle school ............ 14 40 3 44High school................ 12 25 4 59
Size of enrollmentSmall ......................... 10 19 6 66Moderate ................... 10 21 6 62Large ......................... 9 28 6 57
Metropolitan statusCity............................ 8 20 13 59Urban fringe............... 9 24 7 60Town ......................... 13 28 3 56Rural.......................... 8 23 3 67
Geographic regionNortheast ................... 13 21 7 59Southeast ................... 6 25 9 60Central....................... 11 28 5 56West .......................... 8 19 6 67
*For example, from the district.
SOURCE: U.S. Department of Education, National Center for Education Statistics, Fast ResponseSurvey System, “Nutrition Education in U.S. Public Schools, K-12,” FRSS 52, 1995.

12
Table 7.—Percent of public schools offering nutrition educationwithin the school curriculum, by person or groupresponsible for coordinating nutrition education: 1995
Placement of nutritioneducation
One personfor the whole
school
Severalteachers, agroup or
committee
Someoneoutside the
school*
Nocoordination
effort
Integrated within thetotal curriculum......... 60 68 83 70
Health curriculum ......... 79 88 90 82Science curriculum........ 65 72 70 74School health program... 68 81 74 62Home economics
curriculum................. 47 52 17 39
*For example, from the district.
SOURCE: U.S. Department of Education, National Center for Education Statistics, Fast ResponseSurvey System, “Nutrition Education in U.S. Public Schools, K-12,” FRSS 52, 1995.
The educational background and training of the people responsible forcoordination of nutrition education varies among the small number ofschools that have a single coordinator on staff (figure 3). Seventy-twopercent have a coordinator with a bachelor’s degree or higher innutrition or a nutrition-related area. About 61 percent have acoordinator, regardless of education level, who has completed someinservice or other training in nutrition or a nutrition-related area (notshown in a table).
Figure 3.—Percent of coordinators with various highest levels oftraining in nutrition or a nutrition-related area: 1995
1%
5%
20%
38%
34%
2%
Graduate degreeBachelor's degreeAssociate's degreeCollege courseworkInservice trainingNone
Highest training
NOTE: Based on the estimated number of public schools with a single nutrition educationcoordinator: 7,290 (9 percent).
SOURCE: U.S. Department of Education, National Center for Education Statistics, Fast ResponseSurvey System, “Nutrition Education in U.S. Public Schools, K-12,” FRSS 52, 1995.

13
Resources forNutritionEducation
Nutrition education resources available to schools include not onlycurriculum and other lesson materials but also the school mealsprogram, guest speakers, and assemblies and other events. All ofthese can be coordinated to enhance positive nutrition messages. TheFRSS survey asked schools about receiving these resources and theextent to which resources received are used at their schools.
Materials Used toTeach Nutrition
Various types of materials are commonly used by schools to teachnutrition in the classroom. Most schools use materials developed byteachers in their schools (90 percent), health or science textbooks (89percent), and materials developed for a specific grade level (83percent) (table 8). High schools are more likely than schools at otherinstructional levels to use state-recommended (79 percent) or state-mandated (58 percent) materials for nutrition instruction, andelementary schools (44 percent) are more likely than middle schools(33 percent) to use materials developed by a district-level curriculumcoordinator (table 8).
Table 8.—Percent of public schools that use various types ofmaterials to teach nutrition education, by instructionallevel: 1995
Type of material usedAll public
schoolsElementary
schoolMiddleschool
High school
From external sources ........... 92 93 90 94
Developed by teachers in theschool ................................. 90 90 87 93
Health or science textbooks ... 89 87 90 93
Developed for a specificgrade level .......................... 83 87 81 74
State-recommended............... 65 61 64 79
State-mandated ..................... 44 40 43 58
Developed by district-levelcurriculum coordinator ........ 40 44 33 35
SOURCE: U.S. Department of Education, National Center for Education Statistics, Fast ResponseSurvey System, “Nutrition Education in U.S. Public Schools, K-12,” FRSS 52, 1995.
Sources ofMaterials
Many schools use packaged materials and lesson plans for nutritioninstruction. Given a list of 10 outside sources, schools were asked toidentify those from which they received nutrition education resourcesfor teaching, and the extent to which the resources were used at theirschool. Ninety-seven percent of schools report receiving nutritionlesson materials from at least one source outside of the school, mostoften from professional or trade

14
associations (87 percent) and the food industry or commoditiesgroups, such as the Dairy Council or the Potato Board (86 percent)(table 9).
Table 9.—Percent of public schools that receive and use materialsfor nutrition education from various sources: 1995
SourceMaterialsreceived
All or mostmaterials used*
All sources ............................ 97 -
Professional or trade association.... 87 32
Food industry or commoditiesgroup......................................... 86 37
School library................................ 71 33
Cooperative Extension Service ...... 65 22
USDA Food and NutritionInformation Center .................... 64 32
State education agency .................. 58 31
State Nutrition Education Training(NET) Program ......................... 42 29
American School Food ServiceAssociation................................ 40 26
Colleges or universities ................. 35 18
National Food Service ManagementInstitute..................................... 26 24
*Of schools that received the materials.
SOURCE: U.S. Department of Education, National Center for Education Statistics, Fast ResponseSurvey System, “Nutrition Education in U.S. Public Schools, K-12,” FRSS 52, 1995.
The two Federal government sources, the Cooperative ExtensionService (also known as the USDA Extension Service) and the USDAFood and Nutrition Information Center, were identified by over 60percent of schools as sources for lesson materials and other resources.The Cooperative Extension Service has as its mission to diffusepractical information about agriculture, home economics, and ruralenergy. Rural schools (78 percent) and small schools (75 percent) aremost likely to receive materials from this source (table 10). Becauseof the sample size for this survey, the effects of school size cannot bedistinguished from the effects of metropolitan status through amultivariate analysis, but among all public schools in the U.S., smallschools tend to be rural and rural schools tend to be small.

15
Table 10.—Percent of public schools that receive and usematerials for nutrition education from the CooperativeExtension Service, by school characteristics: 1995
School characteristicMaterialsreceived
All or mostmaterials used*
All public schools .................. 65 22
Size of enrollmentSmall ........................................ 75 24Moderate................................... 67 18Large......................................... 57 23
Metropolitan statusCity........................................... 57 24Urban fringe.............................. 45 19Town......................................... 72 25Rural......................................... 78 20
*Of schools that received the materials.
SOURCE: U.S. Department of Education, National Center for Education Statistics, Fast ResponseSurvey System, “Nutrition Education in U.S. Public Schools, K-12,” FRSS 52, 1995.
Of the materials from sources outside the school, schools reported thehighest classroom usage for those received from the food industry orcommodities groups, professional or trade associations, the USDAFood and Nutrition Information Service, and state education agencies(table 9).
School MealsProgram
Healthy People 2000 states that “optimally, school nutritioneducation should include educational cafeteria experiences as well asclassroom work.”12 It appears that most schools are taking some stepstoward achieving this goal. Ninety-one percent of all schools offernutrition education for students in some way through the school mealsprogram: 93 percent of elementary, 88 percent of middle, and 86percent of high schools (table 11). More than half of elementaryschools reported displaying nutrition information on the cafeteriabulletin board and sponsoring a “school lunch week” where parentseat with students and participate in other activities. Meals programs inelementary schools are more likely than those at other instructionallevels to provide kitchen tours.
12 Healthy People 2000, p. 127.

16
Table 11.—Percent of public schools where the school mealsprogram provides nutrition education or coordinateswith classroom efforts, by instructional level: 1995
Meals program effortAll public
schoolsElementary
schoolMiddleschool
Highschool
Any effort .......................... 91 93 88 86
Bulletin board with nutritiondisplays................................. 65 68 63 57
School lunch week .................. 51 57 45 37
Nutrient information ............... 48 49 46 47
Serves meals to correspondwith classroom activities ....... 46 49 44 37
Tours ...................................... 35 39 27 28
Nutrition input to newsletter ... 32 36 29 20
Education in classroom............ 22 25 16 18
Tasting parties ........................ 21 24 19 15
SOURCE: U.S. Department of Education, National Center for Education Statistics, Fast ResponseSurvey System, “Nutrition Education in U.S. Public Schools, K-12,” FRSS 52, 1995.
Table 12.—Percent of public schools where the school mealsprogram provides nutrition education or coordinateswith classroom efforts, by geographic region: 1995
Meals program effortAll public
schoolsNortheast Southeast Central West
Any effort ........................ 91 91 96 89 88
Bulletin board with nutritiondisplays............................... 65 57 85 60 60
School lunch week ................ 51 40 69 49 46
Nutrient information ............. 48 49 61 41 44
Serves meals to correspondwith classroom activities ..... 46 51 60 37 41
Tours .................................... 35 28 51 28 34
Nutrition input to newsletter . 32 34 41 29 26
Education in classroom.......... 22 16 38 18 19
Tasting parties ...................... 21 17 39 15 18
SOURCE: U.S. Department of Education, National Center for Education Statistics, Fast ResponseSurvey System, “Nutrition Education in U.S. Public Schools, K-12,” FRSS 52, 1995.

17
In addition to actively providing education, the meals program cansupport nutrition education by involving students in school menuplanning and making healthy foods available at school for students tochoose. About a third of all school meals programs solicit input fromstudent advisory groups, and about 1 in 5 ask parents and students topretest new foods (table 13 and figure 4).
Table 13.—Percent of public schools where the school mealsprogram solicits input through a student advisorygroup or pretesting new foods, by instructional level:1995
Type of inputAll public
schoolsElementary
schoolMiddleSchool
Highschool
Student advisory groupprovides input to the mealservice .................................... 34 34 37 34
School food service director hasparents and students pretestnew foods for the cafeteria.......
20 20 24 17
SOURCE: U.S. Department of Education, National Center for Education Statistics, Fast ResponseSurvey System, “Nutrition Education in U.S. Public Schools, K-12,” FRSS 52, 1995.
Figure 4.—Percent of public schools that report student andparent input into the meals program, by geographicregion: 1995
34
20
34
18
46
2629
19
31
18
0
20
40
60
80
100Percent All public schools
NortheastSoutheastCentralWest
Input from student advisory group to the meal service
Parents and students pretest new foods for the cafeteria
SOURCE: U.S. Department of Education, National Center for Education Statistics, Fast ResponseSurvey System, “Nutrition Education in U.S. Public Schools, K-12,” FRSS 52, 1995.

18
Most respondents (84 percent) are of the opinion that their schoolmeals programs follow generally healthy eating practices (as definedby the respondent) (figure 5). In schools where this is not the case,students can receive inconsistent messages about food choices. Inaddition, schools reporting that their meals programs follow healthyeating practices are substantially more likely to be involved innutrition education activities than those that are reported as notfollowing them. For example, 25 percent of meals programs describedas healthy provide nutrition education in the classroom versus7 percent of those not described as healthy. Those described ashealthy also more often serve meals coordinated with classroomactivities (51 versus 17 percent), and more often have cafeteriabulletin boards with nutrition displays (72 versus 29 percent)(table 14).
Figure 5.—Percent of respondents who are of the opinion thattheir school meals program follows generally healthyeating practices, by instructional level: 1995
8488
76 77
0
20
40
60
80
100
All public schools Elementary school Middle school High school
Instructional level
Percent
SOURCE: U.S. Department of Education, National Center for Education Statistics, Fast ResponseSurvey System, “Nutrition Education in U.S. Public Schools, K-12,” FRSS 52, 1995.

19
Table 14.—Percent of public schools that report various mealsprogram efforts, by whether the respondent is of theopinion that their school meals program followsgenerally healthy eating practices: 1995
Meals program effort
Reportedfollowinggenerally
healthy eatingpractices
Reported notfollowinggenerally
healthy eatingpractices
Bulletin board with nutrition displays.......... 72 29
School lunch week ...................................... 57 19
Nutrient information ................................... 54 18
Serves meals to correspond with classroomactivities ................................................. 51 17
Tours .......................................................... 39 13
Nutrition input to newsletter ....................... 37 6
Education in classroom................................ 25 7
Tasting parties ............................................ 25 3
SOURCE: U.S. Department of Education, National Center for Education Statistics, Fast ResponseSurvey System, “Nutrition Education in U.S. Public Schools, K-12,” FRSS 52, 1995.
Other Resources Nutrition lessons can also be imparted through special events such asassemblies, guest speakers, or health fairs. Just about three-quartersof schools reported using special events in the past year: 63 percentused guest speakers on nutrition and 25 percent held health fairs(figure 6).
Figure 6.—Percent of public schools that use special events fornutrition education: 1995
74
63
25
0
20
40
60
80
100
Guestspeakersor health
fairs
Guestspeakers
Healthfairs
Percent
SOURCE: U.S. Department of Education, National Center for Education Statistics, Fast ResponseSurvey System, “Nutrition Education in U.S. Public Schools, K-12,” FRSS 52, 1995.
20
Summary andConclusions
Nutrition education is important because it has the potential toimprove the health and extend the lives of generations of Americans.The results of this survey indicate that nutrition education is of greatinterest to educators. It is offered by most public schools, is coveredin many grades, and a wide range of topics are covered. However,even though nutrition education is an active area, the intensity andquality of the nutrition messages students are receiving is not known.In addition, because nutrition education is concentrated in the healthcurriculum, science classes, and school health programs, theproportion of students participating at each grade level is not known.There appears to be room for additional coordination of nutritioneducation across different subjects within the curriculum, across gradelevels, and between the curriculum and the school meals program.
The survey findings also indicate that schools are focusing onincreasing students’ knowledge about what is meant by good nutrition,with less emphasis on influencing students’ motivation, attitudes, andeating behaviors. One objective of nutrition education is to increaseknowledge. Other objectives are to change unhealthy attitudes sostudents have the motivation to establish healthy eating practices andteach positive skills so students have all the tools to accomplish theirnutritional goals. However, less than one-third of schools that coveredtopics related to motivation, attitudes, or behavior provided thoroughcoverage of those topics.
Schools use various types of materials to teach nutrition in theclassroom. However, while almost all schools receive nutrition lessonmaterials from sources outside the school, schools do not use all ormost of the materials received. Most schools use materials developedby teachers in the school and developed for a specific grade level.These results may suggest that nutrition education could benefit fromdevelopment of appropriate materials, including age-appropriatematerials and materials designed to assist teachers in preparing theirown nutrition education lessons.
There is potential for the school meals program to assume a moreactive role in nutrition education. Most schools are taking only somesteps toward achieving the Healthy People 2000 goal of includingeducational cafeteria experiences as well as classroom work in schoolnutrition education. The majority of effort consists of displaying abulletin board with nutrition messages, with few school mealsprograms offering nutrient information, providing nutrition educationin the classroom, or conducting other educational activities.
21
Although schools or districts where the nutrition education efforts arecoordinated have an opportunity to present a more focused message tostudents about the importance of healthy eating, most schools do nothave a nutrition coordinator. A person or group with responsibilityfor coordination can integrate the curriculum across grades so thenutrition lessons at each grade level build on the previous year’slessons, integrate the nutrition messages across subjects within agrade, and integrate classroom nutrition lessons with relatednonclassroom activities. A nutrition education coordinator can alsobring a background and skills in nutrition to schools. In the schoolsthat do have a single nutrition education coordinator, 72 percent havea bachelor’s degree or higher in nutrition or a nutrition-related area.
The overall findings indicate that although nutrition education isalready of interest to public schools, there is room for additionaleffort. In particular, opportunities exist for development ofappropriate materials and greater coordination across differentsubjects within the curriculum, across grade levels, and between thecurriculum and other school resources like the school meals programso the messages received by students are consistent, pervasive, andaimed at motivating children to choose a healthy diet.

22
23
Appendix A
Survey Methodologyand
Data Reliability

24
25
SurveyMethodologyand DataReliability
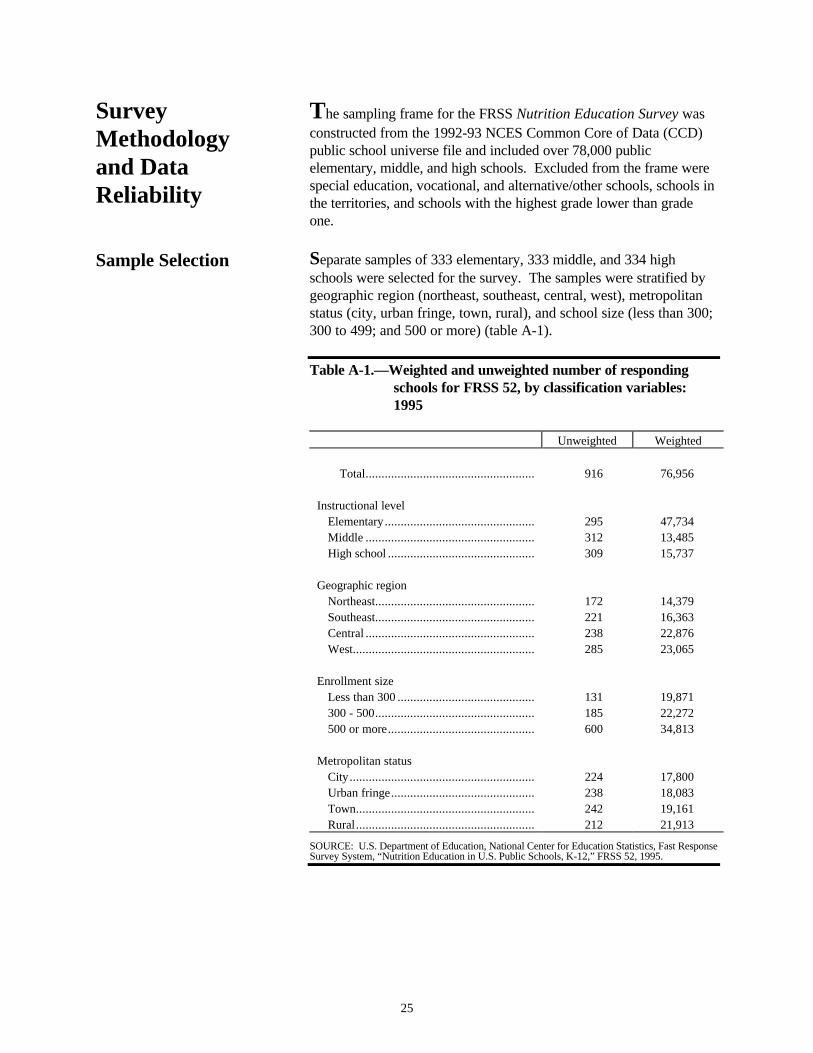
The sampling frame for the FRSS Nutrition Education Survey wasconstructed from the 1992-93 NCES Common Core of Data (CCD)public school universe file and included over 78,000 publicelementary, middle, and high schools. Excluded from the frame werespecial education, vocational, and alternative/other schools, schools inthe territories, and schools with the highest grade lower than gradeone.
Sample Selection Separate samples of 333 elementary, 333 middle, and 334 highschools were selected for the survey. The samples were stratified bygeographic region (northeast, southeast, central, west), metropolitanstatus (city, urban fringe, town, rural), and school size (less than 300;300 to 499; and 500 or more) (table A-1).
Table A-1.—Weighted and unweighted number of respondingschools for FRSS 52, by classification variables:1995
Unweighted Weighted
Total..................................................... 916 76,956
Instructional levelElementary............................................... 295 47,734Middle ..................................................... 312 13,485High school .............................................. 309 15,737
Geographic regionNortheast.................................................. 172 14,379Southeast.................................................. 221 16,363Central ..................................................... 238 22,876West......................................................... 285 23,065
Enrollment sizeLess than 300 ........................................... 131 19,871300 - 500.................................................. 185 22,272500 or more.............................................. 600 34,813
Metropolitan statusCity.......................................................... 224 17,800Urban fringe............................................. 238 18,083Town........................................................ 242 19,161Rural........................................................ 212 21,913
SOURCE: U.S. Department of Education, National Center for Education Statistics, Fast ResponseSurvey System, “Nutrition Education in U.S. Public Schools, K-12,” FRSS 52, 1995.

26
Respondents andResponse Rates
In April of 1995, questionnaires (see appendix C) were mailed to1,000 public school principals. The principals were asked to directthe survey to the person most knowledgeable about nutrition educationin the school and ask that person to complete the survey. Of theschools sampled, 12 were found to be out of scope (no longer at thesame location or serving the same population), leaving 988 eligibleschools in the sample. Telephone followup was initiated in mid-Mayand data collection was completed on July 7, with 916 respondents.The final response rate was 93 percent. Item nonresponse ratesranged from 0.0 percent to 1.0 percent.
Sampling andNonsamplingErrors
The responses were weighted to produce national estimates. Theweights were designed to adjust for the variable probabilities ofselection and differential nonresponse. The findings in this report areestimates based on the sample selected and, consequently, are subjectto sampling variability.
The survey estimates are also subject to nonsampling errors that canarise because of nonobservation (nonresponse or noncoverage) errors,errors of reporting, and errors made in the collection of the data.These errors can sometimes bias the data. Nonsampling errors mayinclude such problems as the differences in the respondents’interpretations of the meaning of the questions; memory effects;misrecording of responses; incorrect editing, coding, and data entry;differences related to the particular time the survey was conducted; orerrors in data preparation. While general sampling theory can be usedin part to determine how to estimate the sampling variability of astatistic, nonsampling errors are not easy to measure and, formeasurement purposes, usually require that an experiment beconducted as part of the data collection procedures or that dataexternal to the study be used.
To minimize the potential for nonsampling errors, the questionnairewas pretested with knowledgeable respondents like those whocompleted the survey. During the design of the survey and the surveypretest, an effort was made to check for consistency of interpretationof questions and to eliminate ambiguous terms. The questionnaire andinstructions were extensively reviewed by the Food and ConsumerService and the National Center for Education Statistics. Manual andmachine editing of the questionnaire responses were conducted tocheck the data for accuracy and consistency. Cases with missing orinconsistent items were recontacted by telephone. Imputations foritem nonresponse were not implemented, as item nonresponse rateswere very low. Data were keyed with 100 percent verification.

27
Variances The standard error is a measure of the variability of estimates due tosampling. It indicates the variability of a sample estimate that wouldbe obtained from all possible samples of a given design and size.Standard errors are used as a measure of the precision expected froma particular sample. If all possible sampled were surveyed undersimilar conditions, intervals of 1.96 standard errors below to 1.96standard errors above a particular statistic would include the truepopulation parameter being estimated in about 95 percent of thesamples. This is what is called a 95 percent confidence interval. Forexample, the estimated percentage of public elementary schools withno nutrition education coordination is 66 percent and the estimatedstandard error is 3.0 percent. The 95 percent confidence interval forthis statistic extends from [66 - (1.96 x 3) to 66 + (1.96 x 3)], or from61.5 to 70.5.
Estimates of standard errors were computed using a technique knownas jackknife replication. As with any replication method, jackknifereplication involved constructing a number of subsamples (replicates)from the full sample and computing the statistic of interest for eachreplicate. The mean square error of the replicate estimates around thefull sample estimate provides an estimate of the variance of thestatistic. To construct the replications, 50 stratified subsamples of thefull sample were created and then dropped, one at a time, to define 50jackknife replicates. A proprietary computer program (WESVAR),available at Westat, Inc., was used to calculate the estimates ofstandard errors.
BackgroundInformation
The survey was conducted under contract with Westat, Inc., using theNCES Fast Response Survey System (FRSS). Westat’s projectdirector was Elizabeth Farris, and the survey manager was CarinCelebuski. Judi Carpenter was the NCES project officer. The datawere requested by Leslie Christovich and Marie Mitchell from theFood and Consumer Service of the USDA. Marie Mitchellcoordinated the project for the USDA.
The survey instrument was developed with input from several personsin the field of nutrition education, including individuals from theNutrition Education and Training Program and the EducationInformation Advisory Committee (EIAC) of the Council of ChiefState School Officers. The EIAC committee members were thefollowing:
• John Perkins, Texas • Kathy Kuser, New Jersey • Joe Worden, Florida

28
• Josephine Busha, Vermont • Betty Marcelynas, Washington • Jim Burke, Illinois • Maria Balakshin, California • Michael Smith, Wyoming
The report was reviewed by the following individuals:
Outside NCES
• Leslie Lytle, University of Minnesota • Barbara Shannon, Pennsylvania State University Inside NCES
• Jonaki Bose, NCES
• Mike Cohen, NCES • Edith McArthur • Mary Rollefson, NCES • Peter Stowe, NCES
For more information about the Fast Response Survey System or theNutrition Education Survey, contact Judi Carpenter,Elementary/Secondary Statistics Division, Office of EducationalResearch and Improvement, National Center for Education Statistics,555 New Jersey Avenue, NW, Washington, DC 20208-5651,telephone (202) 219-1333.
Terms Defined on theSurvey Questionnaire
Nutrition education - refers to curricula, courses, lesson plans andunits, and activities designed to provide instruction with regard to thenutritional value of foods and the relationship between food andhuman health. Nutrition education can also be provided throughnonclassroom activities and events such as special assemblies andhealth fairs, etc.
School health program - a program that may include school healtheducation and physical education; school-linked or school-based

29
health services designed to prevent, detect, and address healthproblems; psychological assessment and counseling to promote childdevelopment and emotional health; healthful school food serviceselections; schoolsite health promotion for faculty and staff; andintegrated school and community health promotion efforts.
Nutrients - the nourishing components in food, such as vitamins,minerals, proteins, carbohydrates, fats, etc.
Nutrition-related area - academic subject areas related to nutrition(e.g., home economics, science, health, physical education, dietetics).
Cooperative Extension Service - a public-funded, nonformaleducational system that links the USDA, land-grant universities, andcounties. Its purpose is to diffuse practical information on subjectsrelated to agriculture, home economics, and rural energy.
Materials - lesson plans, curriculum guides, posters, pamphlets, andmultimedia, etc., designed to improve health, achieve positive changein dietary habits, and emphasize the relationship between diet andhealth.
ClassificationVariables
Metropolitan Status
Urban - a central city of a Metropolitan Statistical Area (MSA).
Urban fringe - a place within an MSA, but not primarily its centralcity.
Town - a place not within an MSA, but with a population greaterthan or equal to 2,500, and defined as urban by the U.S. Bureau of theCensus.
Rural - a place with a population less than 2,500 and defined as ruralby the U.S. Bureau of the Census.
Geographic Region
Northeast - Connecticut, Delaware, District of Columbia, Maine,Maryland, Massachusetts, New Hampshire, New Jersey, New York,Pennsylvania, Rhode Island, and Vermont.
Southeast - Alabama, Arkansas, Florida, Georgia, Kentucky,Louisiana, Mississippi, North Carolina, South Carolina, Tennessee,Virginia, and West Virginia.

30
Central - Illinois, Indiana, Iowa, Kansas, Michigan, Minnesota,Missouri, Nebraska, North Dakota, Ohio, South Dakota, andWisconsin.
West - Alaska, Arizona, California, Colorado, Hawaii, Idaho,Montana, Nevada, New Mexico, Oklahoma, Oregon, Texas, Utah,Washington, and Wyoming.
Instructional Level
Elementary school- Schools beginning with grade 6 or lower andwith no grade higher than 8.
Middle school - Schools with a low grade of 4 to 7 and a high gradeof 4 to 9.
High school - Schools with a grade 12 and no grade lower than 9.Combined schools, with both elementary and secondary grades, wereincluded with high schools for sampling purposes.

31
Appendix B
Tables of Standard Errors

32

33
List of Tables of Standard Errors
Table Page
1a Standard errors of the percent of public schools offering nutrition education withinthe school curriculum, by school characteristics: 1995............................................... 35
2a Standard errors of the percent of public schools where nutrition is taught, bygrade and geographic region: 1995............................................................................ 36
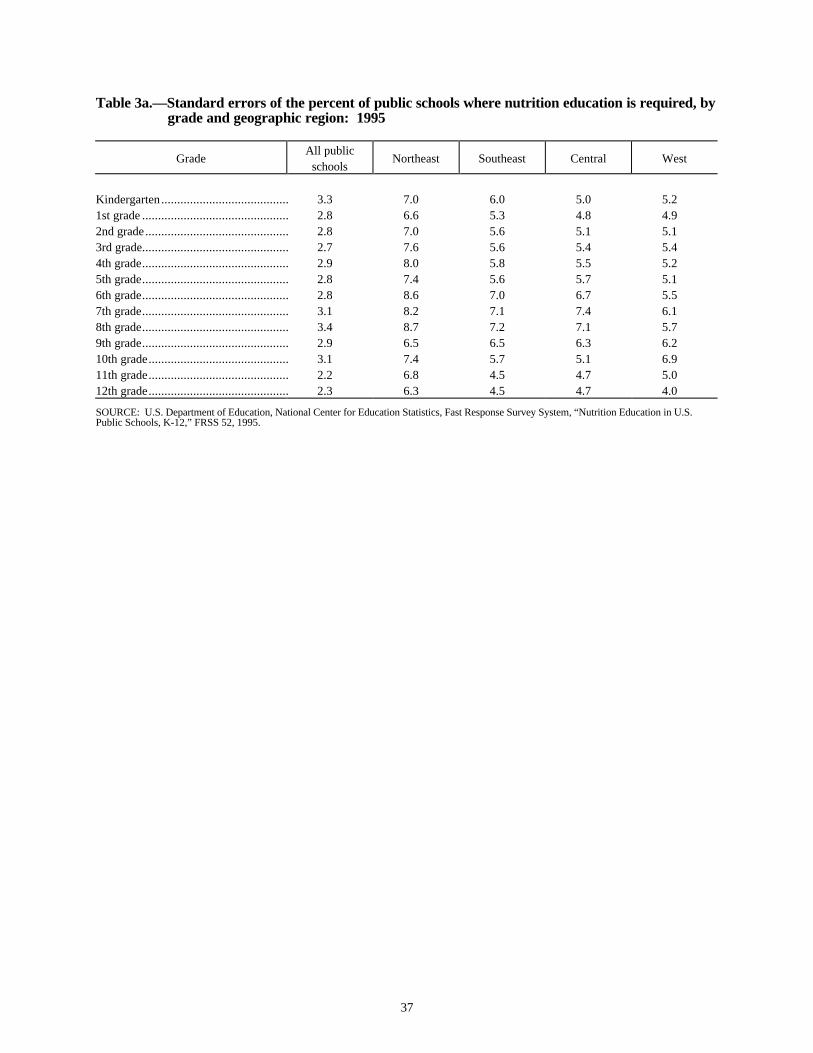
3a Standard errors of the percent of public schools where nutrition education isrequired, by grade and geographic region: 1995......................................................... 37
4a Standard errors of the percent of public schools that cover various topics innutrition education, the percent that cover them thoroughly, and the percent forwhom the topic represents a main focus of nutrition education at theirschool: 1995.............................................................................................................. 38
5a Standard errors of the percent of public schools that cover various topics innutrition education, by instructional level: 1995......................................................... 39
6a Standard errors of the percent of public schools with various types of nutritioneducation coordination, by school characteristics: 1995 ............................................. 40
7a Standard errors of the percent of public schools offering nutrition education withinthe school curriculum, by person or group reponsible for coordinatingnutrition education: 1995 .......................................................................................... 41
8a Standard errors of the percent of public schools that use various types of materialsto teach nutrition education, by instructional level: 1995............................................ 42
9a Standard errors of the percent of public schools that receive and use materialsfor nutrition education from various sources: 1995 .................................................... 43
10a Standard errors of the percent of public schools that receive and use materials fornutrition education from the Cooperative Extension Service, by schoolcharacteristics: 1995................................................................................................. 44
11a Standard errors of the percent of public schools where the school meals programprovides nutrition education or coordinates with classroom efforts, by instructionallevel: 1995................................................................................................................ 45
12a Standard errors of the percent of public schools where the school meals programprovides nutrition education or coordinates with classroom efforts, bygeographic region: 1995............................................................................................ 46
13a Standard errors of the percent of public schools where the school meals programsolicits input through a student advisory group or pretesting new foods,by instructional level: 1995 ....................................................................................... 47

34
List of Tables of Standard Errors (continued)
Table Page
14a Standard errors of the percent of public schools that report various meals programefforts, by whether the respondent is of the opinion that their school meals programfollows generally health eating practices: 1995 .......................................................... 48
15a Estimates and standard errors for the figures: 1995 ................................................... 49

35
Table 1a.—Standard errors of the percent of public schools offering nutrition education within theschool curriculum, by school characteristics: 1995
School characteristicWithin
curriculum
Integratedwithin the
totalcurriculum
Healthcurriculum
Sciencecurriculum
School healthprogram
Homeeconomicscurriculum
All public schools ............................. 0.3 1.6 1.6 1.9 2.0 1.5
Instructional levelElementary school ............................... 0.5 2.1 2.3 2.7 3.0 2.3Middle school ...................................... 0.5 2.5 2.2 2.7 2.5 2.9High school.......................................... 0.5 3.0 1.5 3.0 2.8 2.0
Size of enrollmentSmall ................................................... 1.2 4.9 3.9 4.3 4.1 4.1Moderate ............................................. 0.3 3.3 2.9 4.0 4.1 2.2Large ................................................... 0.2 1.6 1.7 2.0 2.0 1.8
Metropolitan statusCity...................................................... 1.3 2.4 3.2 3.5 4.3 3.2Urban fringe ........................................ 0.3 3.3 3.4 3.8 3.5 2.8Town ................................................... 0.4 3.0 2.9 4.4 3.8 3.6Rural.................................................... 0.0 3.6 3.0 3.7 3.5 3.9
Geographic regionNortheast ............................................. 0.0 4.0 3.9 4.8 4.5 4.0Southeast ............................................. 1.4 3.0 3.8 4.2 4.5 3.4Central................................................. 1.3 3.5 3.0 4.5 4.4 3.8West .................................................... 0.4 3.2 2.6 3.1 3.4 2.6
NOTE: Respondents could report nutrition education in more than one place.
SOURCE: U.S. Department of Education, National Center for Education Statistics, Fast Response Survey System, “Nutrition Education in U.S.Public Schools, K-12,” FRSS 52, 1995.

36
Table 2a.—Standard errors of the percent of public schools where nutrition is taught, by grade andgeographic region: 1995
GradeAll public
schoolsNortheast Southeast Central West
Kindergarten ........................................ 1.6 4.1 3.4 3.1 3.21st grade .............................................. 1.4 4.6 3.2 2.6 2.02nd grade............................................. 1.3 4.1 2.5 2.2 1.83rd grade.............................................. 1.5 4.3 2.5 3.2 2.34th grade.............................................. 1.2 4.0 0.0 2.6 2.55th grade.............................................. 1.4 4.2 2.1 3.6 2.56th grade.............................................. 1.6 2.9 1.8 3.8 3.17th grade.............................................. 1.3 3.9 0.9 2.0 2.88th grade.............................................. 1.5 4.7 2.1 2.6 3.19th grade.............................................. 1.7 4.3 4.1 3.1 2.610th grade............................................ 1.9 5.1 2.7 4.2 2.711th grade............................................ 2.5 4.1 3.4 4.8 4.712th grade............................................ 2.5 4.9 3.4 4.2 4.7
SOURCE: U.S. Department of Education, National Center for Education Statistics, Fast Response Survey System, “Nutrition Education in U.S.Public Schools, K-12,” FRSS 52, 1995.
37
Table 3a.—Standard errors of the percent of public schools where nutrition education is required, bygrade and geographic region: 1995
GradeAll public
schoolsNortheast Southeast Central West
Kindergarten ........................................ 3.3 7.0 6.0 5.0 5.21st grade .............................................. 2.8 6.6 5.3 4.8 4.92nd grade............................................. 2.8 7.0 5.6 5.1 5.13rd grade.............................................. 2.7 7.6 5.6 5.4 5.44th grade.............................................. 2.9 8.0 5.8 5.5 5.25th grade.............................................. 2.8 7.4 5.6 5.7 5.16th grade.............................................. 2.8 8.6 7.0 6.7 5.57th grade.............................................. 3.1 8.2 7.1 7.4 6.18th grade.............................................. 3.4 8.7 7.2 7.1 5.79th grade.............................................. 2.9 6.5 6.5 6.3 6.210th grade............................................ 3.1 7.4 5.7 5.1 6.911th grade............................................ 2.2 6.8 4.5 4.7 5.012th grade............................................ 2.3 6.3 4.5 4.7 4.0
SOURCE: U.S. Department of Education, National Center for Education Statistics, Fast Response Survey System, “Nutrition Education in U.S.Public Schools, K-12,” FRSS 52, 1995.

38
Table 4a.—Standard errors of the percent of public schools that cover various topics in nutritioneducation, the percent that cover them thoroughly, and the percent for whom the topicrepresents a main focus of nutrition education at their school: 1995
Topic CoveredCovered
thoroughly
Representsa mainfocus*
Relationship between diet and health ................................................................. 0.8 2.0 1.8
Finding and choosing healthy foods .................................................................... 0.8 1.6 2.0
Nutrients and their food sources ......................................................................... 0.8 2.0 1.8
Food Guide Pyramid .......................................................................................... 1.0 2.3 2.1
Dietary guidelines and goals............................................................................... 1.1 1.8 1.7
Reading food labels............................................................................................ 1.2 2.0 1.4
Influences on food choices, such as habits, advertising, beliefs, and culturalpreferences...................................................................................................... 1.2 1.7 1.4
Changing eating habits (e.g., willingness to try new foods) ................................. 1.6 1.6 1.2
Link between diet and diseases such as hypertension, heart disease, and cancer.. 1.9 1.9 1.1
Interpreting nutritional information from food labels .......................................... 1.7 2.1 1.0
Healthy weight control ....................................................................................... 1.9 1.7 0.8
Preparing healthy food ....................................................................................... 1.9 2.2 0.9
Developing a personal nutrition plan .................................................................. 2.1 1.7 0.7
Body image........................................................................................................ 2.3 1.6 0.8
Signs and symptoms of eating disorders and health risks of .diets, pills, binging,and purging..................................................................................................... 2.0 1.9 1.1
Keeping a food diary .......................................................................................... 1.9 1.8 0.4
Association between eating and stress ................................................................ 2.1 1.8 0.7
*Schools were asked to report up to three.
SOURCE: U.S. Department of Education, National Center for Education Statistics, Fast Response Survey System, “Nutrition Education in U.S.Public Schools, K-12,” FRSS 52, 1995.

39
Table 5a.—Standard errors of the percent of public schools that cover various topics in nutritioneducation, by instructional level: 1995
TopicAll public
schoolsElementary
schoolMiddleschool
Highschool
Relationship between diet and health ............................................................... 0.8 1.3 1.0 0.8
Finding and choosing healthy foods .................................................................. 0.8 1.1 1.0 0.6
Nutrients and their food sources ....................................................................... 0.8 1.2 1.2 1.5
Food Guide Pyramid ........................................................................................ 1.0 1.5 1.4 1.4
Dietary guidelines and goals............................................................................. 1.1 1.7 1.7 1.2
Reading food labels.......................................................................................... 1.2 1.9 1.5 1.0
Influences on food choices, such as habits, advertising, beliefs, and culturalpreferences.................................................................................................... 1.2 2.0 1.7 1.2
Changing eating habits (e.g., willingness to try new foods) ............................... 1.6 2.5 2.2 1.3
Link between diet and diseases such as hypertension, heart disease, andcancer ........................................................................................................... 1.9 3.0 1.5 1.4
Interpreting nutritional information from food labels ........................................ 1.7 2.7 1.6 1.4
Healthy weight control ..................................................................................... 1.9 3.0 1.7 1.2
Preparing healthy food ..................................................................................... 1.9 3.0 1.8 1.5
Developing a personal nutrition plan ................................................................ 2.1 3.4 2.4 2.1
Body image...................................................................................................... 2.3 3.5 2.7 1.6
Signs and symptoms of eating disorders and health risks of diets, pills, binging, and purging ..................................................................................... 2.0 3.2 1.7 0.9
Keeping a food diary ........................................................................................ 1.9 3.0 2.8 2.7
Association between eating and stress .............................................................. 2.1 3.0 2.6 2.2
SOURCE: U.S. Department of Education, National Center for Education Statistics, Fast Response Survey System, “Nutrition Education in U.S.Public Schools, K-12,” FRSS 52, 1995.

40
Table 6a.—Standard errors of the percent of public schools with various types of nutrition educationcoordination, by school characteristics: 1995
School characteristicOne person for the
whole school
Several teachers,a group orcommittee
Someone outsidethe school*
No coordinationeffort
All public schools........................................ 1.4 1.8 1.0 2.2
Instructional levelElementary school .......................................... 1.8 2.4 1.6 3.0Middle school ................................................ 2.3 2.8 1.0 2.8High school.................................................... 1.8 2.7 1.1 3.1
Size of enrollmentSmall ............................................................. 2.9 3.6 3.0 4.8Moderate ....................................................... 2.2 3.5 2.2 4.0Large ............................................................. 1.4 2.1 1.2 2.3
Metropolitan statusCity................................................................ 2.4 2.5 2.8 4.3Urban fringe................................................... 2.5 3.4 2.3 3.7Town ............................................................. 2.4 3.7 1.5 4.5Rural.............................................................. 2.2 3.1 1.5 3.4
Geographic regionNortheast ....................................................... 3.3 3.4 2.6 5.1Southeast ....................................................... 2.2 3.4 2.6 3.8Central........................................................... 2.8 3.9 1.9 4.4West .............................................................. 1.8 2.6 1.6 3.1
*For example, from the district.
SOURCE: U.S. Department of Education, National Center for Education Statistics, Fast Response Survey System, “Nutrition Education in U.S.Public Schools, K-12,” FRSS 52, 1995.

41
Table 7a.—Standard errors of the percent of public schools offering nutrition education within theschool curriculum, by person or group responsible for coordinating nutrition education:1995
Placement of nutrition educationOne person for the
whole school
Several teachers,a group orcommittee
Someone outsidethe school*
No coordinationeffort
Integrated throughout curriculum....................... 6.7 3.3 6.8 2.2Health curriculum ............................................. 4.9 2.3 5.9 2.2Science curriculum............................................ 5.8 4.4 8.2 2.2School health program....................................... 5.9 2.7 7.5 2.7Home economics curriculum ............................. 5.7 3.8 4.3 2.0
*For example, from the district.
SOURCE: U.S. Department of Education, National Center for Education Statistics, Fast Response Survey System, “Nutrition Education in U.S.Public Schools, K-12,” FRSS 52, 1995.

42
Table 8a.—Standard errors of the percent of public schools that use various types of materials toteach nutrition education, by instructional level: 1995
Type of material usedAll public
schoolsElementary
schoolMiddleschool
High school
From external sources .................................................................................. .9 1.4 1.4 1.4
Developed by teachers in your school ........................................................... 1.3 1.8 2.2 1.6
Health or science textbooks .......................................................................... 1.2 1.8 1.6 1.5
Developed for a specific grade level ............................................................. 1.6 2.2 2.6 2.9
State-recommended...................................................................................... 2.3 3.6 2.9 2.4
State-mandated ............................................................................................ 2.4 3.8 2.8 3.0
Developed by district-level curriculum coordinator ....................................... 2.0 3.1 3.0 2.8
SOURCE: U.S. Department of Education, National Center for Education Statistics, Fast Response Survey System, “Nutrition Education in U.S.Public Schools, K-12,” FRSS 52, 1995.

43
Table 9a.—Standard errors of the percent of public schools that receive and use materials fornutrition education from various sources: 1995
SourceMaterialsreceived
All or mostmaterials used*
All sources .................................................................................................. 0.7 -
Professional or trade association.......................................................................... 1.4 2.4
Food industry or commodities group.................................................................... 1.5 2.1
School library...................................................................................................... 1.7 2.5
Cooperative Extension Service ............................................................................ 1.9 2.2
USDA Food and Nutrition Information Center..................................................... 2.1 2.7
State education agency ........................................................................................ 2.5 3.1
State Nutrition Education Training (NET) Program ............................................. 2.6 3.4
American School Food Service Association ......................................................... 2.8 2.8
Colleges or universities ....................................................................................... 1.9 3.0
National Food Service Management Institute....................................................... 2.7 4.0
*Of schools that received the materials.
SOURCE: U.S. Department of Education, National Center for Education Statistics, Fast Response Survey System, “Nutrition Education in U.S.Public Schools, K-12,” FRSS 52, 1995.

44
Table 10a.—Standard errors of the percent of public schools that receive and use materials fornutrition education from the Cooperative Extension Service, by school characteristics:1995
School characteristicMaterialsreceived
All or mostmaterials used*
All public schools ................................................................................... 1.9 2.2
Size of enrollmentSmall ......................................................................................................... 4.4 5.4Moderate.................................................................................................... 4.8 4.1Large.......................................................................................................... 2.4 2.9
Metropolitan statusCity............................................................................................................ 4.6 5.3Urban fringe............................................................................................... 4.8 5.2Town.......................................................................................................... 3.8 4.3Rural.......................................................................................................... 3.5 3.9
*Of schools that received the materials.
SOURCE: U.S. Department of Education, National Center for Education Statistics, Fast Response Survey System, “Nutrition Education in U.S.Public Schools, K-12,” FRSS 52, 1995.

45
Table 11a.—Standard errors of the percent of public schools where the school meals programprovides nutrition education or coordinates with classroom efforts, by instructionallevel: 1995
Meals program effortAll public
schoolsElementary
schoolMiddleschool
Highschool
Any effort .............................................................................................. 1.1 1.0 1.2 1.3
Bulletin board with nutrition displays.......................................................... 1.9 2.7 2.8 3.5
School lunch week ...................................................................................... 2.1 3.0 2.5 3.2
Nutrient information ................................................................................... 1.9 2.9 3.2 2.9
Serves meals to correspond with classroom activities................................... 1.9 2.8 3.0 2.7
Tours .......................................................................................................... 2.3 3.2 3.1 2.9
Nutrition input to newsletter ....................................................................... 1.9 2.9 3.0 2.8
Education in classroom................................................................................ 2.0 3.0 2.5 2.2Tasting parties ............................................................................................ 1.8 2.8 2.1 2.1
SOURCE: U.S. Department of Education, National Center for Education Statistics, Fast Response Survey System, “Nutrition Education in U.S.Public Schools, K-12,” FRSS 52, 1995.

46
Table 12a.—Standard errors of the percent of public schools where the school meals programprovides nutrition education or coordinates with classroom efforts, by geographicregion: 1995
Meals program effortAll public
schoolsNortheast Southeast Central West
Any effort ......................................................................................... 1.1 2.0 1.4 2.5 2.2
Bulletin board with nutrition displays..................................................... 1.9 4.9 2.6 3.5 4.1
School lunch week ................................................................................. 2.1 4.3 3.5 3.6 3.9
Nutrient information .............................................................................. 1.9 5.9 3.9 4.2 3.7
Serves meals to correspond with classroom activities.............................. 1.9 4.5 3.9 3.5 3.6
Tours ..................................................................................................... 2.3 4.1 4.2 3.1 4.0
Nutrition input to newsletter .................................................................. 1.9 4.7 4.3 3.5 3.1
Education in classroom........................................................................... 2.0 3.5 4.8 3.1 3.3
Tasting parties ....................................................................................... 1.8 3.9 3.9 2.7 2.9
SOURCE: U.S. Department of Education, National Center for Education Statistics, Fast Response Survey System, “Nutrition Education in U.S.Public Schools, K-12,” FRSS 52, 1995.

47
Table 13a.—Standard errors of the percent of public schools where the school meals program solicitsinput through a student advisory group or pretesting new foods, by instructional level:1995
Type of inputAll public
schoolsElementary
schoolMiddleSchool
Highschool
Student advisory group provides input to the meal service ............................ 2.4 3.4 3.2 2.8
School food service director has parents and students pretest new foods forthe cafeteria ............................................................................................... 1.5 2.2 2.7 2.4
SOURCE: U.S. Department of Education, National Center for Education Statistics, Fast Response Survey System, “Nutrition Education in U.S.Public Schools, K-12,” FRSS 52, 1995.

48
Table 14a.—Standard errors of percent of public schools that report various meals program efforts,by whether the respondent is of the opinion that their school meals program followsgenerally healthy eating practices: 1995
Meals program effortReported followinggenerally healthyeating practices
Reported notfollowing generally
healthy eatingpractices
Bulletin board with nutrition displays............................................................. 2.1 1.3
School lunch week ......................................................................................... 2.5 3.6
Nutrient information ...................................................................................... 2.2 3.8
Serves meals to correspond with classroom activities...................................... 2.1 3.6
Tours ............................................................................................................. 2.2 3.1
Nutrition input to newsletter .......................................................................... 2.3 2.9
Education in classroom................................................................................... 2.0 4.8
Tasting parties ............................................................................................... 2.2 2.8
SOURCE: U.S. Department of Education, National Center for Education Statistics, Fast Response Survey System, “Nutrition Education in U.S.Public Schools, K-12,” FRSS 52, 1995.
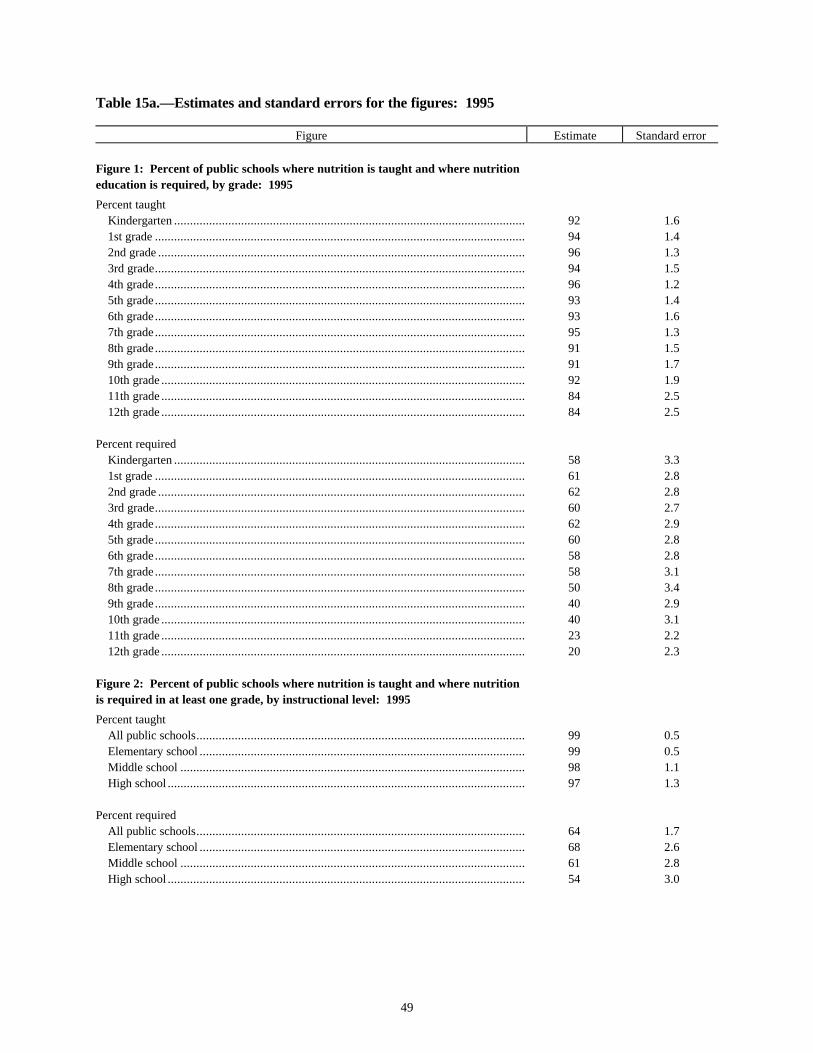
49
Table 15a.—Estimates and standard errors for the figures: 1995
Figure Estimate Standard error
Figure 1: Percent of public schools where nutrition is taught and where nutritioneducation is required, by grade: 1995
Percent taughtKindergarten .............................................................................................................. 92 1.61st grade .................................................................................................................... 94 1.42nd grade ................................................................................................................... 96 1.33rd grade.................................................................................................................... 94 1.54th grade .................................................................................................................... 96 1.25th grade .................................................................................................................... 93 1.46th grade .................................................................................................................... 93 1.67th grade .................................................................................................................... 95 1.38th grade .................................................................................................................... 91 1.59th grade .................................................................................................................... 91 1.710th grade .................................................................................................................. 92 1.911th grade .................................................................................................................. 84 2.512th grade .................................................................................................................. 84 2.5
Percent requiredKindergarten .............................................................................................................. 58 3.31st grade .................................................................................................................... 61 2.82nd grade ................................................................................................................... 62 2.83rd grade.................................................................................................................... 60 2.74th grade .................................................................................................................... 62 2.95th grade .................................................................................................................... 60 2.86th grade .................................................................................................................... 58 2.87th grade .................................................................................................................... 58 3.18th grade .................................................................................................................... 50 3.49th grade .................................................................................................................... 40 2.910th grade .................................................................................................................. 40 3.111th grade .................................................................................................................. 23 2.212th grade .................................................................................................................. 20 2.3
Figure 2: Percent of public schools where nutrition is taught and where nutritionis required in at least one grade, by instructional level: 1995
Percent taughtAll public schools....................................................................................................... 99 0.5Elementary school ...................................................................................................... 99 0.5Middle school ............................................................................................................ 98 1.1High school ................................................................................................................ 97 1.3
Percent requiredAll public schools....................................................................................................... 64 1.7Elementary school ...................................................................................................... 68 2.6Middle school ............................................................................................................ 61 2.8High school ................................................................................................................ 54 3.0

50
Table 15a.—Estimates and standard errors for the figures: 1995 (continued)
Figure Estimate Standard error
Figure 3: Percent of coordinators with various highest levels of training innutrition or a nutrition-related area: 1995
Highest trainingGraduate degree ......................................................................................................... 34 6.4Bachelor’s degree....................................................................................................... 38 5.0Associate’s degree...................................................................................................... 1 0.8College coursework .................................................................................................... 5 2.8Inservice training........................................................................................................ 20 6.9None .......................................................................................................................... 2 1.8
Figure 4: Percent of public schools that report student and parent input into themeals program, by geographic region: 1995
Input from student advisory group to the meal serviceAll public schools....................................................................................................... 34 2.4Northeast ................................................................................................................... 34 5.3Southeast ................................................................................................................... 46 4.8Central ....................................................................................................................... 29 4.3West .......................................................................................................................... 31 3.4
Figure 5: Percent of respondents who are of the opnion that their school mealsprogram follows general healthy eating practices, by instructional level: 1995
Instructional levelAll public schools....................................................................................................... 84 1.6Elementary school ...................................................................................................... 88 2.1Middle school ............................................................................................................ 76 2.5High school ................................................................................................................ 77 2.7
Parents and students pretest new foods for the cafeteriaAll public schools....................................................................................................... 20 1.5Northeast ................................................................................................................... 18 3.6Southeast ................................................................................................................... 26 3.8Central ....................................................................................................................... 19 3.0West .......................................................................................................................... 18 2.2
Figure 6. Percent of public schools that use special events for nutrition education:1995
Guest speakers or health fairs......................................................................................... 74 2.1Guest speakers ............................................................................................................... 63 2.5Health fairs .................................................................................................................... 25 2.0
SOURCE: U.S. Department of Education, National Center for Education Statistics, Fast Response Survey System, “Nutrition Education in U.S.Public Schools, K-12,” FRSS 52, 1995.

51
Appendix C
Survey Form

52
U.S. DEPARTMENT OF EDUCATION OMB NO.: 1850-0715NATIONAL CENTER FOR EDUCATION STATISTICS EXPIRATION DATE: 5/31/96
WASHINGTON, D.C. 20208-5651
NUTRITION EDUCATION INU.S. PUBLIC SCHOOLS, K-12
FAST RESPONSE SURVEY SYSTEMThis survey is authorized by law (20 U.S.C. 1221e-1). While you are not required to respond, your cooperation isneeded to make the results of this survey comprehensive, accurate, and timely.
DEFINITIONS FOR THIS SURVEY:
Nutrition education - refers to curricula, courses, lesson plans and units, and activities designed to provide instruction withregard to the nutritional value of foods and the relationship between food and human health. Nutrition education can also beprovided through nonclassroom activities and events such as special assemblies and health fairs, etc.
School health program - a program that may include school health education and physical education; school-linked orschool-based health services designed to prevent, detect, and address health problems; psychological assessment andcounseling to promote child development and emotional health; healthful school food service selections; schoolsite healthpromotion for faculty and staff; and integrated school and community health promotion efforts.
Nutrients - the nourishing components in food, such as vitamins, minerals, proteins, carbohydrates, fats, etc.
Nutrition-related area - academic subject areas related to nutrition (e.g., home economics, science, health, physicaleducation, dietetics).
Cooperative Extension Service - a public-funded, nonformal educational system that links the U.S. Department ofAgriculture, land-grant universities, and counties. Its purpose is to diffuse practical information on subjects relating toagriculture, home economics, and rural energy.
Materials - lesson plans, curriculum guides, posters, pamphlets, and multimedia, etc., designed to improve health, achievepositive change in dietary habits, and emphasize the relationship between diet and health.
NA - grade is not taught in this school.
AFFIX LABEL HERE
IF ABOVE INFORMATION IS INCORRECT, PLEASE MAKE CORRECTIONS DIRECTLY ON LABEL.
Name of person completing form: _______________________________ Title: _________________________
Telephone: _________________ Fax: ________________________ E:mail: _______________________
Best days and times to reach you (in case of questions): _____________________________________________
PLEASE RETURN COMPLETED FORM TO: IF YOU HAVE ANY QUESTIONS, CONTACT:
WESTAT Carin Celebuski1650 Research Boulevard 800-937-8281, ext. 3986Rockville, Maryland 20850 Fax: 301-294-3992Attention: 900131-Celebuski E:mail: [email protected]
The time required to complete this information collection is estimated to average 30 minutes per response, including the time to review instructions,search existing data resources, gather and maintain the data needed, and complete and review the information collection. If you have anycomments concerning the accuracy of the time estimate(s) or suggestions for improving this form, please write to: U.S. Department ofEducation, Washington, DC 20202-4651.
NCES Form No. 52
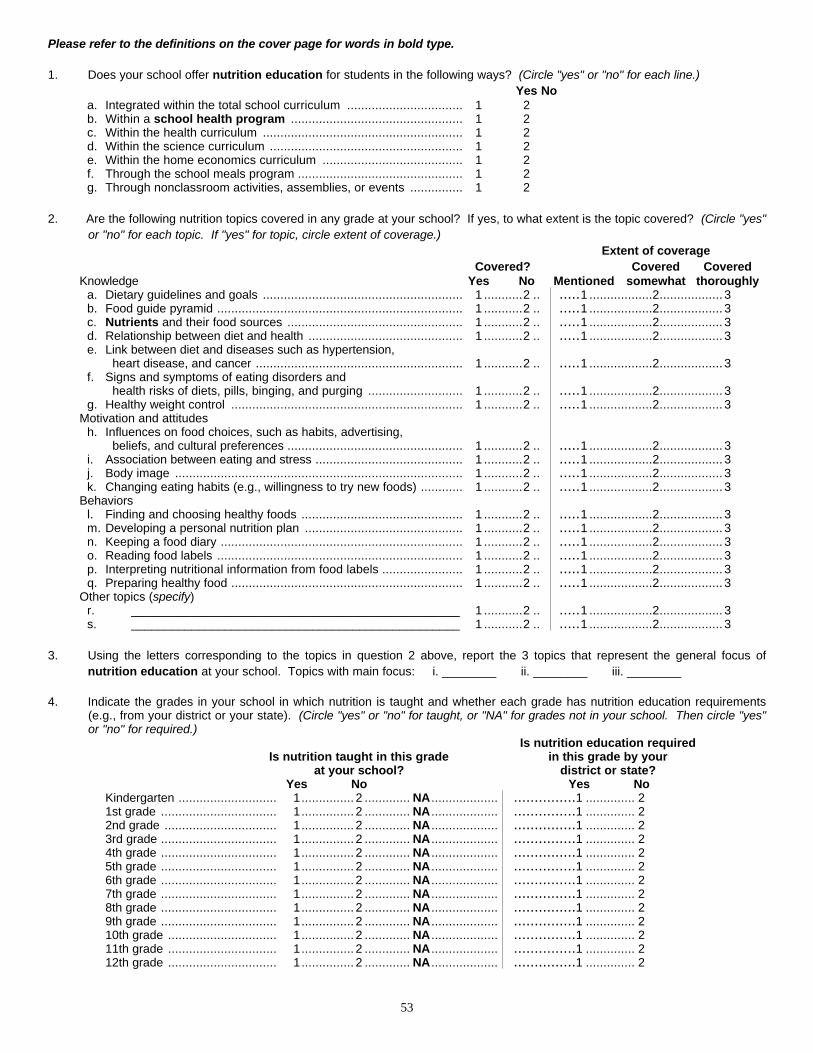
53
Please refer to the definitions on the cover page for words in bold type.
1. Does your school offer nutrition education for students in the following ways? (Circle "yes" or "no" for each line.)Yes No
a. Integrated within the total school curriculum ................................. 1 2b. Within a school health program ................................................. 1 2c. Within the health curriculum ......................................................... 1 2d. Within the science curriculum ....................................................... 1 2e. Within the home economics curriculum ........................................ 1 2f. Through the school meals program ............................................... 1 2g. Through nonclassroom activities, assemblies, or events ............... 1 2
2. Are the following nutrition topics covered in any grade at your school? If yes, to what extent is the topic covered? (Circle "yes"or "no" for each topic. If "yes" for topic, circle extent of coverage.)
Extent of coverageCovered? Covered Covered
Knowledge Yes No Mentioned somewhat thoroughlya. Dietary guidelines and goals ......................................................... 1 ...........2 .. .....1 ..................2.................. 3b. Food guide pyramid ...................................................................... 1 ...........2 .. .....1 ..................2.................. 3c. Nutrients and their food sources .................................................. 1 ...........2 .. .....1 ..................2.................. 3d. Relationship between diet and health ............................................ 1 ...........2 .. .....1 ..................2.................. 3e. Link between diet and diseases such as hypertension,
heart disease, and cancer ........................................................... 1 ...........2 .. .....1 ..................2.................. 3f. Signs and symptoms of eating disorders and
health risks of diets, pills, binging, and purging ........................... 1 ...........2 .. .....1 ..................2.................. 3g. Healthy weight control .................................................................. 1 ...........2 .. .....1 ..................2.................. 3
Motivation and attitudesh. Influences on food choices, such as habits, advertising,
beliefs, and cultural preferences .................................................. 1 ...........2 .. .....1 ..................2.................. 3i. Association between eating and stress .......................................... 1 ...........2 .. .....1 ..................2.................. 3j. Body image .................................................................................. 1 ...........2 .. .....1 ..................2.................. 3k. Changing eating habits (e.g., willingness to try new foods) ............ 1 ...........2 .. .....1 ..................2.................. 3
Behaviorsl. Finding and choosing healthy foods .............................................. 1 ...........2 .. .....1 ..................2.................. 3m. Developing a personal nutrition plan ............................................. 1 ...........2 .. .....1 ..................2.................. 3n. Keeping a food diary ..................................................................... 1 ...........2 .. .....1 ..................2.................. 3o. Reading food labels ...................................................................... 1 ...........2 .. .....1 ..................2.................. 3p. Interpreting nutritional information from food labels ....................... 1 ...........2 .. .....1 ..................2.................. 3q. Preparing healthy food .................................................................. 1 ...........2 .. .....1 ..................2.................. 3
Other topics (specify)r. _________________________________________________ 1 ...........2 .. .....1 ..................2.................. 3s. _________________________________________________ 1 ...........2 .. .....1 ..................2.................. 3
3. Using the letters corresponding to the topics in question 2 above, report the 3 topics that represent the general focus ofnutrition education at your school. Topics with main focus: i. ________ ii. ________ iii. ________
4. Indicate the grades in your school in which nutrition is taught and whether each grade has nutrition education requirements(e.g., from your district or your state). (Circle "yes" or "no" for taught, or "NA" for grades not in your school. Then circle "yes"or "no" for required.)
Is nutrition education requiredIs nutrition taught in this grade in this grade by your
at your school? district or state?Yes No Yes No
Kindergarten ............................ 1............... 2 ............. NA ................... ...............1 .............. 21st grade ................................. 1............... 2 ............. NA ................... ...............1 .............. 22nd grade ................................ 1............... 2 ............. NA ................... ...............1 .............. 23rd grade ................................. 1............... 2 ............. NA ................... ...............1 .............. 24th grade ................................. 1............... 2 ............. NA ................... ...............1 .............. 25th grade ................................. 1............... 2 ............. NA ................... ...............1 .............. 26th grade ................................. 1............... 2 ............. NA ................... ...............1 .............. 27th grade ................................. 1............... 2 ............. NA ................... ...............1 .............. 28th grade ................................. 1............... 2 ............. NA ................... ...............1 .............. 29th grade ................................. 1............... 2 ............. NA ................... ...............1 .............. 210th grade ............................... 1............... 2 ............. NA ................... ...............1 .............. 211th grade ............................... 1............... 2 ............. NA ................... ...............1 .............. 212th grade ............................... 1............... 2 ............. NA ................... ...............1 .............. 2
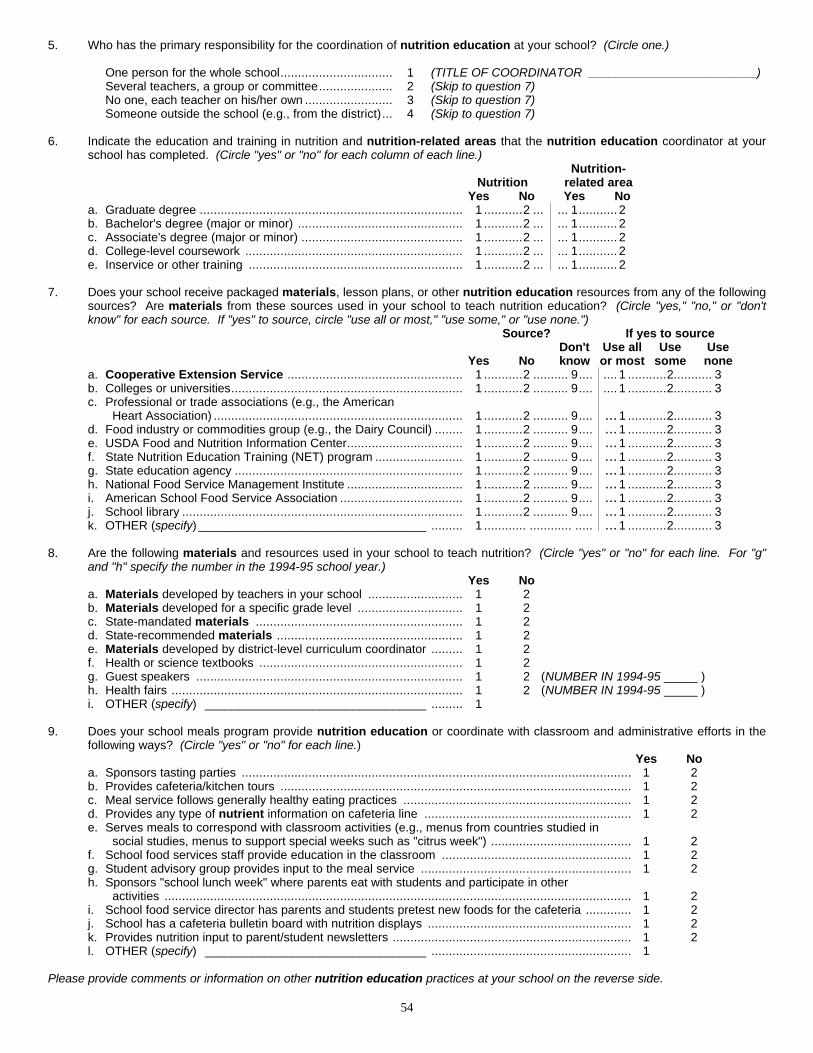
54
5. Who has the primary responsibility for the coordination of nutrition education at your school? (Circle one.)
One person for the whole school................................ 1 (TITLE OF COORDINATOR _________________________)Several teachers, a group or committee..................... 2 (Skip to question 7)No one, each teacher on his/her own ......................... 3 (Skip to question 7)Someone outside the school (e.g., from the district)... 4 (Skip to question 7)
6. Indicate the education and training in nutrition and nutrition-related areas that the nutrition education coordinator at yourschool has completed. (Circle "yes" or "no" for each column of each line.)
Nutrition-Nutrition related area
Yes No Yes Noa. Graduate degree ........................................................................... 1 ...........2 ... ... 1........... 2b. Bachelor's degree (major or minor) ............................................... 1 ...........2 ... ... 1........... 2c. Associate's degree (major or minor) .............................................. 1 ...........2 ... ... 1........... 2d. College-level coursework .............................................................. 1 ...........2 ... ... 1........... 2e. Inservice or other training ............................................................. 1 ...........2 ... ... 1........... 2
7. Does your school receive packaged materials, lesson plans, or other nutrition education resources from any of the followingsources? Are materials from these sources used in your school to teach nutrition education? (Circle "yes," "no," or "don'tknow" for each source. If "yes" to source, circle "use all or most," "use some," or "use none.")
Source? If yes to sourceDon't Use all Use Use
Yes No know or most some nonea. Cooperative Extension Service .................................................. 1 ...........2 .......... 9.... .... 1 ...........2........... 3b. Colleges or universities.................................................................. 1 ...........2 .......... 9.... .... 1 ...........2........... 3c. Professional or trade associations (e.g., the American
Heart Association) ....................................................................... 1 ...........2 .......... 9.... ...1 ...........2........... 3d. Food industry or commodities group (e.g., the Dairy Council) ........ 1 ...........2 .......... 9.... ...1 ...........2........... 3e. USDA Food and Nutrition Information Center................................. 1 ...........2 .......... 9.... ...1 ...........2........... 3f. State Nutrition Education Training (NET) program ......................... 1 ...........2 .......... 9.... ...1 ...........2........... 3g. State education agency ................................................................. 1 ...........2 .......... 9.... ...1 ...........2........... 3h. National Food Service Management Institute ................................. 1 ...........2 .......... 9.... ...1 ...........2........... 3i. American School Food Service Association ................................... 1 ...........2 .......... 9.... ...1 ...........2........... 3j. School library ................................................................................ 1 ...........2 .......... 9.... ...1 ...........2........... 3k. OTHER (specify) __________________________________ ......... 1 ............ ............ ..... ...1 ...........2........... 3
8. Are the following materials and resources used in your school to teach nutrition? (Circle "yes" or "no" for each line. For "g"and "h" specify the number in the 1994-95 school year.)
Yes Noa. Materials developed by teachers in your school ........................... 1 2b. Materials developed for a specific grade level .............................. 1 2c. State-mandated materials ........................................................... 1 2d. State-recommended materials ..................................................... 1 2e. Materials developed by district-level curriculum coordinator ......... 1 2f. Health or science textbooks .......................................................... 1 2g. Guest speakers ............................................................................ 1 2 (NUMBER IN 1994-95 _____ )h. Health fairs ................................................................................... 1 2 (NUMBER IN 1994-95 _____ )i. OTHER (specify) _________________________________ ......... 1
9. Does your school meals program provide nutrition education or coordinate with classroom and administrative efforts in thefollowing ways? (Circle "yes" or "no" for each line.)
Yes Noa. Sponsors tasting parties ............................................................................................................... 1 2b. Provides cafeteria/kitchen tours .................................................................................................... 1 2c. Meal service follows generally healthy eating practices ................................................................. 1 2d. Provides any type of nutrient information on cafeteria line ........................................................... 1 2e. Serves meals to correspond with classroom activities (e.g., menus from countries studied in
social studies, menus to support special weeks such as "citrus week") ........................................ 1 2f. School food services staff provide education in the classroom ...................................................... 1 2g. Student advisory group provides input to the meal service ............................................................ 1 2h. Sponsors "school lunch week" where parents eat with students and participate in other
activities ..................................................................................................................................... 1 2i. School food service director has parents and students pretest new foods for the cafeteria ............. 1 2j. School has a cafeteria bulletin board with nutrition displays .......................................................... 1 2k. Provides nutrition input to parent/student newsletters .................................................................... 1 2l. OTHER (specify) _________________________________ ......................................................... 1
Please provide comments or information on other nutrition education practices at your school on the reverse side.

55
May we have your comments or information on other nutrition education practices at your school?Tell us about the interesting things you are doing.
____________________________________________________________________________________________________
____________________________________________________________________________________________________
____________________________________________________________________________________________________
____________________________________________________________________________________________________
____________________________________________________________________________________________________
____________________________________________________________________________________________________
____________________________________________________________________________________________________
____________________________________________________________________________________________________
____________________________________________________________________________________________________
____________________________________________________________________________________________________
____________________________________________________________________________________________________
____________________________________________________________________________________________________
____________________________________________________________________________________________________
____________________________________________________________________________________________________
____________________________________________________________________________________________________
____________________________________________________________________________________________________
____________________________________________________________________________________________________
____________________________________________________________________________________________________
The Food and Nutrition Information Center located at the National Agricultural Librarycan help you locate nutrition education materials.
Contact the Center to receive a free copy of:Nutrition Education Printed Materials and Audiovisuals, Grades Preschool - 6, or
Nutrition Education Printed Materials and Audiovisuals, Grades 7 - 12.
You can reach them by phone at: 301-504-5791,by fax at: 301-504-6409,
by Internet e:mail at: [email protected],or by writing:
Food and Nutrition Information CenterNational Agricultural Library/USDA
10301 Baltimore BoulevardRoom 304
Beltsville, MD 20705-2351
THANK YOU!

56
Appendix D
U.S. Public Law 103-448. 103d Cong., 2 Nov. 1994. Child Nutrition Act of 1966
Section 19(a)
“Congress finds that -- (1) the proper nutrition of the Nation’s children is a matter of highest priority; (2)the lack of understanding of the principles of good nutrition and their relationship to health can contributeto a child’s rejection of highly nutritious foods and consequent plate waste in school food serviceoperations; (3) many school food service personnel have not had adequate training in food servicemanagement skills and principles, and many teacher and school food service operators have not hadadequate training in the fundamentals of nutrition or how to convey this information so as to motivatechildren to practice sound eating habits; (4) parents exert a significant influence on children in thedevelopment of nutritional habits and lack of nutritional knowledge on the part of parents can havedetrimental effects on children’s nutritional development; and (5) there is a need to create opportunities forchildren to learn about the importance of the principles of good nutrition in their daily lives and how theseprinciples are applied in the school cafeteria.”