nutrition and children with developmental disabilities ... · nutrition and children with...
TRANSCRIPT

Nutrition And Children with Developmental Disabilities: Assessment, Impact and
Evidence-Based Management
Aimee Henrikson, MPH, RDN, LDN
Medical Scientific Liaison
Nestlé Health Science

Disclosure: This presentation has been prepared by and is being presented by an employee of Nestlé Health Science. The material herein is accurate as of the date it
was presented, and is for educational purposes only and not intended as a substitute for medical advice. Reproduction or distribution of these materials is
prohibited.
Copyright 2017 Nestlé. All rights reserved.
2

Objectives
1. Define cerebral palsy (CP), and describe the prevalence
2. Discuss the importance of nutritional care for children with developmental disabilities, and the impact of nutrition on this population
3. Identify tools that can be used to assess the nutritional status of children with developmental disabilities
4. Describe issues that may interfere with adequate nutrition in this population
5. Review the evidence around improving feeding tolerance in this population 3

Cerebral Palsy
• Neurological disorder caused by a non-progressive brain injury or malformation that occurs while the child’s brain is under development.
• CP primarily affects body movement and muscle coordination.
• Estimated prevalence: 17 million people worldwide
• Most common cause of childhood-onset disability in most countries
Rosenbaum P, Paneth N, Leviton A et al. A report: the definition and classification of cerebral palsy April 2006. Dev Med Child Neurol Suppl. 2007 Feb;109:8-14; Graham et al. Cerebral palsy. Nature Rev Dis Primers 2016 Jan 7: 2;15082

Classification of CP
Classified according to motor abnormalities :
• Spastic (~80%)
• Diplegia
• Hemiplegia
• Quadriplegia
• Dyskinetic (10-15%) have variable movement that is involuntary
• Dystonia: twisting and repetitive movements
• Athetosis: slow, ‘stormy’ movements
• Chorea: irregular, unpredictable movements
• Ataxic (<5%) means ‘without order’ or ‘incoordination’ and be unsteady, shaky movements or tremor; difficulties maintaining balance
Rosenbaum P, Paneth N, Leviton A et al. A report: the definition and classification of cerebral palsy April 2006.. 2007 Feb;109:8-14. Dev Med Child Neurol Suppl

Motor Patterns of CP

Classification of CP
The Gross Motor Function Classification System for CP (GMFCS)
System developed to consider changes in motor function with age and development in these children.
• GMFCS objectively classifies a child’s current gross motor function
• Function is divided into 5 levels (Level I most independent motor function to level 5 being least)
Palisano RJ, Rosenbaum P, Bartlett D et al. Content validity of the expanded and revised Gross Motor Function Classification System. Dev Med Child Neurol 2008, 50 (10): 744-50.

Importance of Nutrition In Developmentally Delayed Children
• Malnutrition affects a large proportion of neurologically impaired children
• Overnutrition
• 8%-14% based on weight-for-height or triceps skinfold thickness criteria1,2
• Undernutrition
• 29% to 46% of children with CP, linear stunting in 23%3-5
• Malnutrition should not be considered part of the disease
• Historically, poor nutritional status believed to be unavoidable in children with severe neurodisability
• We now understand that result = poor outcomes such as malnutrition, dehydration and poor growth
1. Stallings VA, et al. Dev Med Child Neurol 1993;35:997Y1006. 2. Dahl M, et al. Acta Paediatr 1996;85:697Y701 . 3. Troughton KE, Hill AE. Dev Med Child Neurol2001;43:187Y90. 4. Sanchez-Lastres J, et al. Acta Paediatr 2003;92:747Y53. 5. Stevenson RD, Hayes RP, Cater LV, et al. Dev Med Child Neurol 1994;36:135Y42

Importance of Nutrition In Developmentally Delayed Children
9
Malnutrition Is Associated With:
• Increased risk of infections
• Increased hospital length of stay (LOS)
• Increased healthcare costs
• Increased complication rates & readmission rates
• Increased mortality risk
• Poor long-term growth
• Reduced mental and psychomotor development
• Increased behavioral problems
Agarwal E, et al. Clinical Nutrition. 2013;32(5):737-745. Correia MI, Waitzberg DL. Clin Nutr. 2003;22(3):235-239. Kyle UG, et al. Curr Opin Clin Nutr Metab Care. 2005;8(4):397-402. Lim SL, et al. Clin Nutr. 2012;31(3):345-350. Chima CS, et al. J Am Diet Assoc. 1997;97(9):975-980. Somanchi M, et al. JPEN J Parenter Enteral Nutr. 2011;35(2):209-216. Schoonhoven L, et al. Qual Saf Health Care. 2006;15(1):65-70. Fry DE, et al. Arch Surg. 2010;145(2):148-151. Schneider SM, et al. Br J Nutr. 2004;92(1): 105-111. Allaudeen N, et al. J Hosp Med. 2011;6(2):54-60. Mudge AM, et al. J Hosp Med. 2011;6(2):61-67. Gariballa S, Forster S. Br J Nutr. 2007;98(2):332-336. Galler JR, et al. J Am Acad Child Psy. 1983; 22(1):16-22. Galler JR, et al. Am J Psychiatry. 2005;162(9):1760-1761. Black RE, et al. Lancet.2008;371(9608):243-260.

Importance of Nutrition In Developmentally Delayed Children
Improving nutritional
status
Improves quality of
life and overall health
Improves gross motor
abilities
Decreases irritability
and spasticity
Improves peripheral circulation
Helps heal pressure
ulcers
May improve GE
reflux
10
Campanozzi A et al. Impact of malnutrition on gastrointestinal disorders and gross motor abilities in children with cerebral palsy. Brain Dev 2007; 29:25-29.

Non-Nutritional Factors Affecting Growth
Related to neurological disease• Severity of malnutrition correlates with
severity of neurological disease
• Neurological disease affects growth even in the absence of malnutrition
• Correction of malnutrition does not correct statural growth completely
• Patients with spastic hemiplegia have significantly smaller measures of breadth/length on affected side
11
Stevenson RD et al. Dev Med Child Neurol 1994;36:135-42.Stevenson RD et al. Dev Med Child Neurol 1995;37:124-30.

Nutritional Factors Affecting Growth
Inadequate intake
• Caloric intake has been shown to be lower than age-matched controls
• Those able to feed themselves may lack coordination and speed
• Those dependent on a caregiver may not be able to communicate hunger and satiety
12Stallings VA et al. Am J Clin Nutr 1996;64:627-34.Reilly S et al. J Pediatr 1996;129:877-82.

What is Known?
1. Children with neurological impairment have feeding and swallowing problems
2. Poor nutritional status is secondary to insufficient caloric intake
3. The spectrum of the clinical conditions associated includes respiratory infections, gastroesophageal reflux and chronic aspiration
4. The goals of the management is to improve the quality of life for both the child and family
13
Romano C, et al. ESPGHAN Guidelines for the Evaluation and Treatment of Gastrointestinal and Nutritional Complications in Children with Neurological Impairment. Journal of Pediatric Gastroenterology and Nutrition, 2017. Ahead of Print.

Feeding difficulties in children with CP
The Oxford Feeding Study evaluated 271 children with CP and found common feeding problems included:
• Need for help with feeding (89%),
• Choking with food (56%)
• Feeding time > 3hrs per day (28%)
• Constipation (26%)
• Frequent vomiting (22%)
• Feeding described as stressful and un-enjoyable (20%)
• Never had feeding/nutritional assessment (64%)
Andrew MJ, Parr JR, Sullivan PB. Arch Dis Child Educ Pract Ed (2011). doi:10.1136/archdischild-2011-300914

15

Nutritional Factors Affecting Growth
Altered metabolism
• REE is lower than in age and weight-matched controls
• Total Energy Expenditure is affected by
• Type of neurological involvement (athetoid)
• Muscle tone (spasticity, hypotonia)
• Activity level (bedridden, wheelchair bound, ambulatory)
Azcue MP et al. J Pediatr 1996;129:870-6. Bandini LG et al. J Pediatr 1995;126:828-
16

Illness-Related Factors Affecting Growth
• Oral motor dysfunction
o Inadequate suction
o Dysfunctional swallowing
o Persistent extrusion reflex
o Inadequate lip closure
o Reduced ability to chew
• Nutrient losses
• Altered energy expenditure
• Inflammation
• Decreased nutrient intake/altered nutrient utilization17
Mehta NM, Corkins MR, Lyman B, et al. Defining Pediatric Malnutrition: A Paradigm Shift Toward Etiology-Related Definitions. Journal of Parenteral and Enteral Nutrition 2013;37:460-81.

Nutritional Factors Affecting Growth
Oral motor dysfunction
• Affects up to 90% of patients with CP
• Up to 80% of patients with CP have been fed non-orally at least once as infants
• Is a major contributor to malnutrition
• Affected children have lower weight-for-height
• Prolonged mealtime does not compensate for feeding inefficiency
18
Sullivan PB et al. Dev Med Child Neurol 2000;42:674-80.; Sullivan PB et al. Dev Med Child Neurol 2002;44:461-7.Troughton KE et al. Dev Med Child Neurol 2001;43:187-90.

Evaluate the Nutritional Needs of NI Patients
Growth standards Nutritional assessment

Multidisciplinary Assessment
Couriel JM, Bisset R, Miller R, Thomas A, Clarke M. Assessment of feeding problems in
neurodevelopmental handicap: a team approach. Arch Dis Child. 1993 Nov;69(5):609-13.
Child with CP
Dietitian
Neurologist
Speech therapist
Respiratory
Radiologist
GI

Assessing Nutrition Status in Children with NI
• There are many ways to assess the nutritional status in children with NI, varying from simple to more complex methods
• The methods can be divided into:
• Anthropometrics
• Body composition
• Methods for assessing bone status
• Laboratory methods
21
Romano C, et al. ESPGHAN Guidelines for the Evaluation and Treatment of Gastrointestinal and Nutritional Complications in Children with Neurological Impairment. Journal of Pediatric Gastroenterology and Nutrition, 2017. Ahead of Print.

CP Growth Charts
First growth charts for children with CP
• Based on 1,630 observations in 360 patients
• Weight, height and weight-for-height
22
Krick J et al. J Am Diet Assoc 1996;96:680-5.

CP Growth ChartsBrooks J, Day SM, Shavelle RM, Strauss DJ (2011).
Pediatrics, 128; e299; (DOI 10.1542/peds.2010-2801).
• 2011 growth charts for patients with CP
• 102,163 measurements from 25,545 patients (1988-2002)
• Stratified by GMFCS; level 5 additionally divided into those requiring a feeding tube (TF) and those not (NT).
Level I: Walks without limitations
Level II: Walks with limitations
Level III: Walks using a hand-held mobility device
Level IV: Self-mobility with limitations, may use powered mobility
Level V: Transported in a manual wheelchair
• Weight, Height and BMI
http://www.lifeexpectancy.org/articles/NewGrowthCharts.shtml23

GMFCS I, Boys 2-20 YearsBrooks J, Day SM, Shavelle RM, Strauss DJ (2011).
Pediatrics, 128; e299; (DOI 10.1542/peds.2010-2801).
24
Increased mortality risk
Evidence based link between low weight and mortality risk in children with CP

Weight-For-Age and Mortality
• For GMFCS levels III-V, children with weight for age below the 20th percentile had significantly higher mortality rates compared with children with weight for age in the 20th to 80th percentile range
25
Brooks J, Day SM, Shavelle RM, Strauss DJ (2011). Pediatrics, 128; e299; (DOI 10.1542/peds.2010-2801).

• CP- specific growth charts describe growth which is not necessarily ideal as they include many children with other health conditions affecting growth, mostly malnutrition.
• Thus cannot be considered as a measure of how this group of children should ideally grow2
• Furthermore, clinicians often need a growth chart that indicates ideal growth based on a standardized reference population, such as the WHO growth standards3
• Although there is no relevant data, experts often recommend the use of WHO growth charts in children with NI in whom a reliable height or calculated height can be obtained up to 2 (or 5) years of age and in older children a relevant national growth chart should be used4
26
3B ESPGHAN WG does not recommend the use of CP-specific growth charts to identify undernutrition1
status in NI
children should not be based solely on weight and height measurements3e
1. Romano C, et al. ESPGHAN Guidelines for the Evaluation and Treatment of Gastrointestinal and Nutritional Complications in Children with Neurological Impairment. Journal of Pediatric Gastroenterology and Nutrition, 2017. Ahead of Print. 2. Stevenson RD, Conaway M. Growth assessment of children with cerebral palsy: the clinician's conundrum. Dev Med Child Neurol 2007;49:164. 3.Turck D, Michaelsen KF, Shamir R, et al. World Health Organization 2006 child growth standards and 2007 growth reference charts: A discussion paper by the committee on Nutrition of the European Society for Pediatric Gastroenterology, Hepatology, and Nutrition. J Pediatr Gastroenterol Nutr 2013;57:258-64. 4. Samson-Fang L, Bell KL. Assessment of growth and nutrition in children with cerebral palsy. Eur J Clin Nutr 2013;67 Suppl 2:S5-8.

3c: ESPGHAN WG suggests the use of one or more of the following red flag warning signs for the identification of undernutrition in
NI children:
1. Physical signs of undernutrition such as decubitus skin problems, poor peripheral circulation
2. Weight for Age z-score < -2
3. Triceps skinfold thickness < 10th centile for age and sex
4. Mid-upper arm fat or muscle area < 10th percentile
5. Faltering weight and/or failure to thrive
27
Romano C, et al. ESPGHAN Guidelines for the Evaluation and Treatment of Gastrointestinal and Nutritional Complications in Children with Neurological Impairment. Journal of Pediatric Gastroenterology and Nutrition, 2017. Ahead of Print.

Z-Scores
• Z-score comparisons preferred for assessment of growth parameters
• Negative z-score can indicate malnutrition
• Shows how a single data point compares to the norm
• More sensitive to small changes than percentiles
• Vs. percentiles, which are a point of reference to the total population
28
Mehta NM et al. Defining pediatric malnutrition: a paradigm shift toward etiology related definitions. JPEN J Parenter Enteral Nutr, 2013.

Median
29
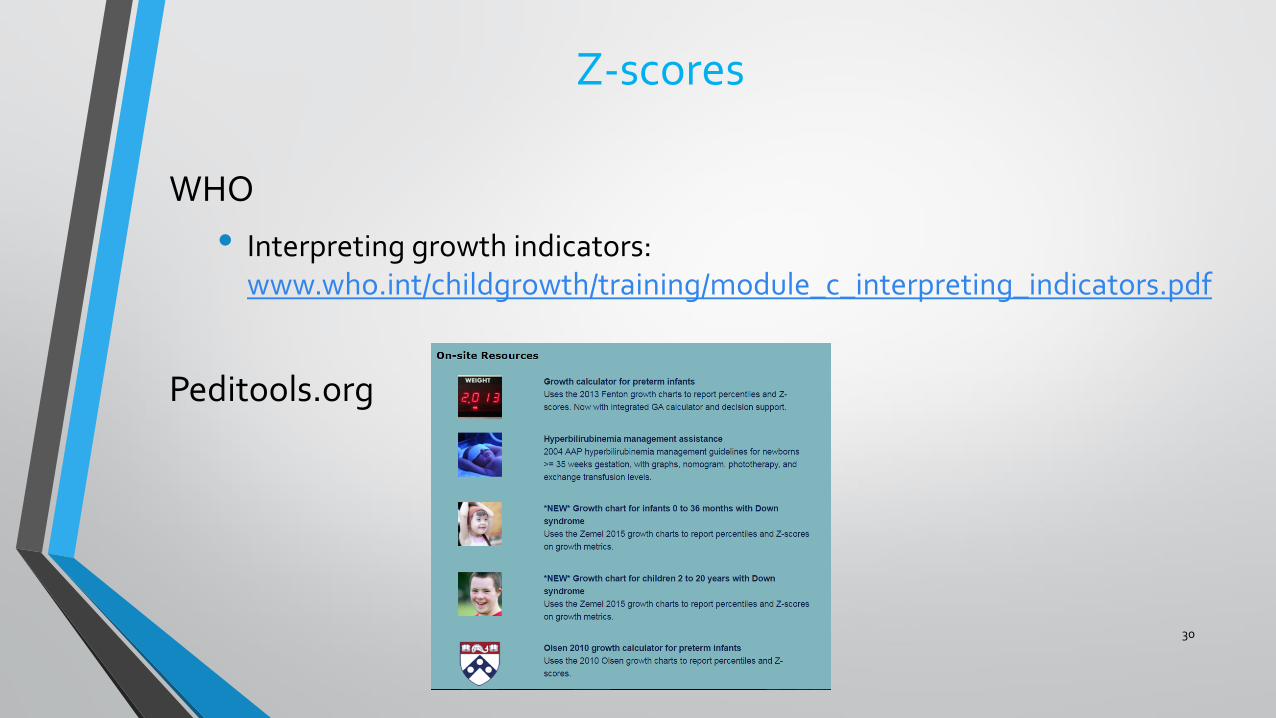
Z-scores
WHO
• Interpreting growth indicators: www.who.int/childgrowth/training/module_c_interpreting_indicators.pdf
Peditools.org
30

Weight and Height1
• Significant proportion of children with NI not able to stand upright, or have joint contractions, spasticity and/or scoliosis, making height measurements difficult.
• Alternative measurements such as knee-heel length (KHL), tibia length and ulnar length can be assessed using sliding calipers.
• These measures shown to have a high interrater reliability and be highly repeatable; therefore may be used on their own to monitor growth2
• Several formulas available to estimate height from the segmental lengths but limits of agreement with recumbent length found to be wide, usually in the range of ± 10 cm
31
2A ESPGHAN WG recommends that the assessment of nutritional status in NI children
should not be based solely on weight and height measurements
2B ESPGHAN WG recommends that measurements of knee height or tibial length in NI children should
be performed routinely in order to assess linear growth, when height cannot be measured
1. Romano C, et al. ESPGHAN Guidelines for the Evaluation and Treatment of Gastrointestinal and Nutritional Complications in Children with Neurological Impairment. Journal of Pediatric Gastroenterology and Nutrition, 2017. Ahead of Print. 2. Haapala H, Peterson MD, Daunter A, et al. Agreement Between Actual Height and Estimated Height Using Segmental Limb Lengths for Individuals with Cerebral Palsy. Am J PhysMed Rehabil 2015;94:539-46.

Estimation of Stature from Segmental Measures
Age 0-12North American Growth in Cerebral Palsy Project: www.healthsystem.virginia.edu
(4.35 x UAL) + 21.8
(3.26 x TL) + 30.8
(2.68 x KH) + 24.2
Age 6-18Chumlea WC et al. J Am Diet Assoc, 1994.
White male: (2.22 x KH) + 40.54
AA male: (2.18 x KH) + 39.60
White female: (2.15 x KH) +43.21
AA female: (2.02 x KH) + 46.59
32

Upper-arm Length
33
Obtained with an anthropometer to measure distance between acromion and head of the radius

Lower-leg (Tibial) Length
34
Measure distance between superomedialborder of tibia and inferior border of medial malleolus with child sitting, one leg crossed horizontally across the other

• Skinfold thickness measurements show changes in total body fat
• Triceps skin fold thickness is the easiest to measure:
• Using the thumb and index finger, grasp and pull the skinfold with subcutaneous fat so that it is separate from the muscle
• Place the calipers around the skinfold
• Record the measurement in millimeters (mm)
• Compare with z-scores in a WHO standardized chart:http://www.who.int/childgrowth/standards/tsf_for_age/e/
Measuring skinfold thickness
Olecranon
Halfway
point
Acromion
Tak
e m
ea
su
rem
en
ts h
ere
2C ESPGHAN WG recommends that the measurement of fat mass by skinfold thickness should be a routine
component of the nutritional assessment in NI children
Romano C, et al. ESPGHAN Guidelines for the Evaluation and Treatment of Gastrointestinal and Nutritional Complications in Children with Neurological Impairment. Journal of Pediatric Gastroenterology and Nutrition, 2017. Ahead of Print.

Mid Upper Arm Circumference
• Correlates with BMI but more sensitive to changes in muscle or fat mass
36Mehta NM et al. JPEN J Parenter Enteral Nutr, 2013.
• Age 6-59 months• Useful in children with edema or ascites

Energy Requirements
• Several studies indicate that the energy requirements of this patient population are reduced:
• Bandini et al: RMR, FFM and TEE in a group of 9 adolescents with CP were significantly lower than in healthy adolescents.
• Stallings et al: measured EE in 61 non-ambulatory children with spastic quadriplegia and 37 controls:
• REE was found to be significantly lower in the group of SQCP subjects vs controls.
• Total daily energy expenditure was significantly lower in the SQCP group than in the controls. 37

Energy Requirements
• Bandini et al: measured RMR in 12 patients (10-30 yrs) with severe CNS impairment who were fed exclusively by g-tube:
• RMR predicted from Harris-Benedict or WHO overestimated measured RMR by 24-36%.
• Azcue et al: found that energy intake in the CP population they studied was 1.1 x RMR.
• Evidence available shows that EE and associated energy requirements are significantly reduced compared to age-matched controls.
38

Estimating Energy1
• The assessment of energy needs of the child with NI is difficult because there are no appropriate specific recommendations for this category of patients
• Patients with NI have lower body fat, muscle mass, and protein
• Energy intake is linked to mobility and activity level
• Schofield equation is reasonable in estimating calorie needs2
• Other special equations can be used, but these are a starting point and the effect of dietary intervention must be reassessed
391. Romano C, et al. ESPGHAN Guidelines for the Evaluation and Treatment of Gastrointestinal and Nutritional Complications in Children with Neurological Impairment. Journal of Pediatric Gastroenterology and Nutrition, 2017. Ahead of Print. 2. Mascarenhas MR, Meyers R, Konek S. Outpatient Nutrition Management of theNeurologically Impaired Child. Nutrition in Clinical Practice 2008;23:597-607.
5a ESPGHAN WG recommends the use of the dietary reference standards for typically developing children to
estimate calorie needs for NI children
5b ESPGHAN WG recommends regular monitoring of body weight and fat mass as an indicator of energy
requirements

Protein Needs
LEAN BODY MASS:
• Ambulant children and adults with CP have reduced muscle volumes in their lower limbs
• as low as 50% of their weight-matched typically-developing peers
• The most significant muscle impairment may be lack of muscle growth
40
Shortland A. Developmental Medicine & Child Neurology 2009, 51 (Suppl. 4): 59–63.

Total Body Protein
• Children with developmental disabilities tend to experience declines in LBM related to inactivity and ambulatory status.
• Compounded by malnutrition and poor growth.
• Previously published studies demonstrate a reduction in body protein in children with spastic quadriplegic CP.
• Significantly reduced for age and height.
41Arrowsmith FE, et al. Dev Med Child Neurol.2010; 52(11):1043-1047. Arrowsmith FE, et al. Am J Clin Nutrition. 2006; 83(3):613-618.

Protein Needs
• Adequate protein still required to support growth & development despite lower energy needs
• Adequate protein may be especially important, as further loss of LBM may result from a protein-deficient diet
• In absence of evidence-based guidelines re: protein needs for NI children, DRI is recommended
• Providing adequate protein may be more difficult in tube-fed children who require lower calorie intake to prevent overfeeding
42
Mascarenhas MR, Meyers R, and Konek S. Outpatient nutrition management of the neurologically impaired child. Nutr Clin Pract 23: 597-607, 2008. Wolff JS. Enteral Management of Children with Neurologic Disability. Support Line 33: 3-10, 2011.

Estimating Protein Needs
43
1. Romano C, et al. ESPGHAN Guidelines for the Evaluation and Treatment of Gastrointestinal and Nutritional Complications in Children with Neurological Impairment. Journal of Pediatric Gastroenterology and Nutrition, 2017. Ahead of Print.
6a ESPGHAN WG recommends the use of the dietary reference intake for protein in typically
developing children to estimate the appropriate protein intake for NI children
6b ESPGHAN WG recommends the use of supplementary protein intake in specific
clinical situations such as decubitus ulcers or in children with a very low calorie requirement

Nutrition Support
Enteral nutrition
• Indications:
• If oral intake is unsafe (risk of aspiration)
• Insufficient oral intake
• Excessive duration of meals
44
Romano C, et al. ESPGHAN Guidelines for the Evaluation and Treatment of Gastrointestinal and Nutritional Complications in Children with Neurological Impairment. Journal of Pediatric Gastroenterology and Nutrition, 2017. Ahead of Print.
20 ESPGHAN WG recommends considering the use of enteral feeding if total oral feeding time
exceeds 3 hours per day

Assessment Algorithm
45
Romano C, et al. ESPGHAN Guidelines for the Evaluation and Treatment of Gastrointestinal and Nutritional Complications in Children with Neurological Impairment. Journal of Pediatric Gastroenterology and Nutrition, 2017. Ahead of Print.

Problems that may Interfere with Adequate Nutrition
Gastroesophageal Reflux/Delayed Gastric Empyting
Gut motility
Feeding intolerance
Osteoporosis
Constipation

Gastric Emptying
• GE reflux, a frequent complication in patients with CP, may result in undernutrition and aspiration pneumonia1
• Delayed gastric emptying is an important factor in GER in children >3 years, especially those with CP1,2
• The rate of gastric emptying associated with formula affected by the type of protein:
• GE occurs more slowly in patients fed a casein-predominant formula than in those fed whey-based formulas3-5
47
1. Sondheimer JM & Morris BA. The Journal of Pediatrics 1979;94(5):710-714. 2. Di Lorenzo C, et al. Arch Dis Child 1987;62: 449-453. 3. Billeaud C, et al. Eur J Clin Nutr 1990;44(8): 577–583. 4. Fried M & Feinle C. Gut2002;51:154–157(suppl 1). 5. Fried MD, et al. J Pediatr1992;120(4):569–572.

Factors Affecting Gastric Emptying
• Protein type:
• Typical protein sources: Casein, whey, soy
• Whey protein
• Remains liquid in acidic environment of the stomach
• May be helpful with motility disorders
48
Fried MD, et al. Decrease in gastric emptying time and episodes of regurgitation in children with spastic quadriplegia fed a whey-based formula. J Pediatr. 1992 Apr;120(4 Pt 1):569-72.

Effects of a Whey-Based Formula on Gastric Emptying Time
49
0
20
40
60
80
100
60 Minutes 120 Minutes
Casein Predominant
Whey Predominant
Whey Hydrolysate
Whey Hydrolysate (70%
MCT)
Fried MD et al. J Pediatr 1992;120 (4), 569-72.

Nutrition Management of GOR: ESPGHAN Guidelines
50
14a ESPGHAN WG suggests modification of enteral nutrition (thickening of liquid enteral formulas, whey-
based formulas) in addition to other therapeutic options of GOR disease in NI children

Formula Switch Leads to Enteral Feeding Tolerance Improvements in Children with Developmental Delays
Retrospective trial designed to:
• Evaluate changes in feeding tolerance in children with developmental delays who were switched from an intact protein-based feeding to a 100% whey, peptide-based formula
• Assess feeding intolerance parameter(s) identified before formula switch (gagging/retching, vomiting, abdominal distention/gas, stool consistency issues)
• Assess medications utilized to facilitate feeding tolerance and bowel management before and after formula switch
51
Minor G, Storm H. Global Pediatric Health, 2016. (3):1-6.

Study Design: Inclusion and Exclusion Criteria
Inclusion Criteria• Diagnosis of developmental delay
• 13 months to < 18 years of age on admission to facility
• Prescribed to receive >90% energy needs via tube feeding before formula switch
• On intact protein formula for 2+ weeks before formula switch
• Switched to a 100% whey, peptide-based formula from an intact protein due to feeding intolerance
• Formulas received must be indicated for use in children or adults (not infant formulas)
Exclusion Criteria:• Abdominal surgery or change in tube
position within past 30 days prior to switch
• Any infection within two weeks prior to switch
• Documented cow’s milk protein allergy at time of switch
• Medical record lacking documentation on reason for, or response to, formula switch
52

RESULTS
• 92% of subjects (12/13) with improved feeding tolerance resulting from switch to 100% whey, peptide-based formula
• 75% of subject (9/12) had tolerance improvements within 7 days of formula switch
• 71% of subject (5/7) were able to tolerate increased feeding volumes after formula switch
• Of the 8 different medications administered for feeding intolerance-related issues
• 6 medications were used in fewer subjects after switch
• None of these medications were increased after switch53

54
• 86% had improvement in vomiting (6/7)
• 75% had improvement in gagging & retching (3/4)
• 63% had improvement in high residual volumes (5/8)
• 43% had a decrease in constipation (3/7)
• 100% had a decrease in diarrhea (3/3)
• 100% had improved weight gain (5/5)

CONCLUSION
Switching to a 100% whey peptide-based formula improved symptoms of feeding intolerance in developmentally delayed children suffering from these symptoms
55

• Subgroups of pediatric patients with neurological impairment expend less energy and are susceptible to excessive weight gain
• Many are dependent on tube feedings and may need an energy intake of less than 800 kcals/day
• As standard enteral formulas for children traditionally meet protein and energy needs in >1000 kcals, these formulas are often manipulated to meet protein and other nutrient requirements without exceeding energy needs
• This may involve the use of a base enteral formula plus additives such as protein modulars, vitamins, minerals and water.
56
The Effect of A Low Calorie, Nutrient Dense Formula on the Use of Modular Nutrition Supplements in Children with Developmental
Disabilities

Study Objective
• Assess the impact of a low calorie, high protein, micronutrient-enhanced enteral product on types & quantities of modular nutrition supplements required to meet nutritional needs of children 1-13 years with developmental disabilities.
57

Results
• Prior to initiation of study formula all subjects were receiving at least 1 modular supplement or water, and 94% were receiving 2 or more.
• Modulars included protein supplements, MVI, vitamin D, calcium and free water
• Following initiation of study formula no additional modular supplements were used to meet the patients nutrient needs.
58

Formula Recommendations for Children with NI: ESPGHAN WG Recommendations
21a Recommend using standard (1.0 kcal/mL) polymeric age appropriate formula including fiber for NI children older than one year
21b Recommend using a high-energy density formula (1.5 kcal/ml) containing fiber in cases of poor volume tolerance in NI children, provided hydration is carefully monitored
21c Recommend using human milk, a standard infant formula or nutrient dense infant enteral formula as clinically indicated in NI infants
21d Recommend using a low-fat, low-calorie, high fiber, and micronutrient replete formula for the maintenance of enteral tube feeding after nutritional rehabilitation in immobile NI children
21e Recommend using a trial of whey-based formula in cases of gastrooesophageal reflux, gagging and retching in NI children
21f Recommend caution if pureed food is used for enteral tube feeding in NI children, because of concerns regarding nutritional adequacy and safety
1. Romano C, et al. ESPGHAN Guidelines for the Evaluation and Treatment of Gastrointestinal and Nutritional Complications in Children with Neurological Impairment. Journal of Pediatric Gastroenterology and Nutrition, 2017. Ahead of Print.

Increased Risk of Fracture
• Osteoporosis more common in patients with CP
• A number of studies report reduced BMD and increased fracture rates in children with neuromuscular disorders.
• Significant reductions in BMD found in nearly all non-ambulatory children with moderate to severe CP >10 years
• fractures reported in more than one fourth of children this age
Henderson RC, Lark RK, Gurka MJ, Worley G, Fung EB, Conaway M, Stallings VA, and Stevenson RD. Bone density and metabolism in children and adolescents with moderate to severe cerebral palsy. Pediatrics 110: e5, 2002

Increased Risk of Fracture
Risk factors:• Lack of weight bearing activity• Lack of exposure to sun• Insufficient calcium & vitamin D intake• Anticonvulsants
Treatment:• Supplements: calcium, phosphorus, vitamin D• Biphosphonates: reduces bone turnover and bone resorption
Henderson RC. J Pediatr 2002;141:644-51.61

Increased Risk of Fracture
Drug-Nutrient Interactions
• Anticonvulsant meds alter Vitamin D and calcium metabolism
• Holick et al: recommended that institutionalized patients on at least 2 antiseizure meds receive 1000 IU vitamin D/day to maintain serum 25(OH) D levels within range of 25-45 ng/ml
• This should prevent the osteomalacia and vitamin D deficiency associated with antiseizure medications
62

Micronutrient Status Monitoring
63
2e ESPGHAN WG recommends the assessment of micronutrient status (e.g. vitamin D, iron status,
calcium, phosphorus) as part of nutritional assessment of NI children

Constipation
• Reported to occur in 60-75% of children with neurological impairment, leading to complications such as hemorrhoids, fecal obstruction or anal fissures1
• Attributed to:
• Decreased muscle tone
• Decreased physical activity
• Lack of fluid/fiber
• Fiber and fluid intakes are inadequate in 53% of NI children2
• Certain medications (phenytoin, baclofen, and anticholinergics) may accacerbate
64
Dietary Fiber
1. Del Giudice E, et al. Gastrointestinal manifestations in children with cerebral palsy. Brain Dev 21: 307-311, 1999; Sullivan PB, et al. Prevalence and severity of feeding and nutritional problems in children with neurological impairment: Oxford Feeding Study. Dev Med Child Neurol 42: 674-680, 2000. Sullivan PB. Gastrointestinal disorders in children with neurodevelopmental disabilities. Dev Disabil Res Rev 14: 128-136, 2008
2. Fischer M, Adkins W, Hall L, et al. The effects of dietary fibre in a liquid diet on bowel function of mentally retarded individuals. J Ment Defic Res 1985;29 ( Pt 4):373-81.

Prebiotic Fiber
• Food ingredients that selectively stimulate a limited number of bacterial species for the benefit of the host
• Resistance to upper GI digestion
• Selectivity of fermentation
•Promotes growth of beneficial bacteria in colon
• Production of the SCFA butyrate
65

Prebiotic Fiber
• Supports colonic health
• Association w/improved cardiovascular health
• Supports bone health
• can increase uptake and deposition of minerals (calcium/magnesium) into the bone
• Anti-inflammatory effects
• Production of SCFA has anti-inflammatory effect in colon
66Slavin J. Fiber and Prebiotics: Mechanisms and health benefits. Nutrients 2013: 22;5(4):1417-35.

Insoluble Fiber
•Common types:
•Cellulose
•Hemicellulose
•Lignin
•Poorly fermentable
•Key functions
•Promotes more favorable stool consistency
67

Nutritional Management of Constipation
68
17b ESPGHAN WG suggests increasing fluid and fiber intake as an additional strategy to
treat constipation in NI children

Summary
• Evaluation the nutritional needs of these patients is complex:
• Impaired nutritional status can affect health, healthcare cost and quality of life
• Issues can include malnutrition, GE reflux and oral motor dysfunction
• Standard growth charts and alternative anthropometric measurements are recommended as part of nutritional assessment for this population
• EN is indicated in many of these patients
• Lower energy density formula, whey-based formulas or energy dense formulas with fiber or may be recommended for some
• Protein adequacy is important to support LBM
• Nutrition-related issues can include:
• Delayed GE, impaired motility, feeding intolerance: protein source may influence
• Osteoporosis: supplementation and bisphosphonates to manage
• Constipation: fiber/prebiotics and additional fluid can be beneficial69

Questions?
70
Nutrition-related resources and tools are available from Nestlé Nutrition Institute:
www.nestlenutrition-institute.org
Visit the New and improved MyCE site atMyCEeducation.com
Offering CE to dietitians and nurses