nusantara infrastructure not...
TRANSCRIPT
Asiamoney’s
2013
Best Domestic
Equity House
Corporate flash
29 January 2014
Disclosure: Bahana Securities does and seeks to do business with companies covered in its research reports. Investors should consider this report as only a single factor
in making their investment decision.
Please see the important disclaimer information on the back of this report
*Based on consensus’ recent changes ↑ (up), ↓ (down), ↔ (unchanged)
THIS RESEARCH REPORT IS NOT TO BE DISTRIBUTED TO ANY INVESTORS OR OTHER PERSONS IN THE UNITED STATES. IF ANY INVESTOR OR OTHER PERSON IN THE UNITED STATES
MISTAKENLY RECEIVES OR OTHERWISE COMES INTO POSSESSION OF THIS RESEARCH REPORT, NONE OF DAIWA SECURITIES CO. LTD., PT. BAHANA SECURIITES OR ANY OF THEIR
AFFIILIATES SHALL HAVE ANY RESPONSIBILITY FOR THE CONTENTS HEREOF OR FOR ANY SUBSEQUENT TRANSACTIONS EXECUTED IN RELIANCE HEREON.
Nusantara Infrastructure Sector: Construction and toll road (Neutral)
NOT RATED
Salman Fajari Alamsyah E-mail: [email protected]
Phone: +6221 250 5081 ext. 3605
PX: IDR263 JCI: 4,417
Site visit note: Back to profitability
� Diversified infrastructure portfolio with focus on toll roads: META is
a holding infrastructure company owned by the Rajawali Group as the
largest shareholder. As a toll road operator, META has four routes (see
exhibit 7) through its subsidiary Margautama Nusantara (MUN). In July
2013, META divested 5% of its stake (to 75%) in MUN to CAIF lll
Infrastructure Holdings Sdn Bhd, resulting in one-off income of IDR114bn.
Additionally, META operates three other subsidiaries dealing in seaport,
water infrastructure and renewable energy industry.
� 4 toll roads with 35km total length: META’s toll road portfolio,
reaching 35km in length, consists of: 1. Bosowa Marga Nusantara (BMN)
(5.9km) and 2. Jalan Tol Seksi Empat (JTSE) (11.6km), both of which are
located in Makasar, South Sulawesi and provide access to Soekarno Hatta
seaport and Hasanuddin airport; 3. Bintaro Serpong Damai (BSD) located
in Tangerang connecting Serpong-Pondok Aren (7.25km); 4. 10km JORR
W1 Jakarta Lingkar Baratsatu (JLB) connecting Kebon Jeruk-Penjaringan
(10km), in which META owns a 25% stake. A 2009-12 CAGR of 13% (ex-
JLB) in traffic volume led to a 12% toll-revenue CAGR over the period.
� Non-toll road businesses coming on-stream: On its non-toll road
businesses, META’s plans include: 1. Increased seaport tank storage
capacity in Lampung to 105k mt in 2014 (2013: 48k mt); 2. Phase 1
water project (100liter/sec.) this month and phase 2 (150liter/sec) by end
May 2014 in Medan Industrial Estate, North Sumatra; 3. Completion of
2x7.95MW hydro plant in North Sumatra by end 2015. However, META
expects minimum contribution from these segments in the next 2-3 years.
� Entering new telecommunication sector: Through its subsidiary,
Telekom Infranusantara (TI), META has further diversified its portfolio by
acquiring Towerco, a running tower company owning 500 towers, for
IDR598bn. With META holding a 70% stake in KING (exhibit 6), Towerco
will be fully consolidated, adding expected IDR100bn revenue in 2014.
Outlook: META looks at tariff hikes and non-toll business to drive EPS
Following a period of net losses from 2009-11, META restructured its debt in
2010 and streamlined its operations, resulting in a return to profitability in 2012.
For 2013 management is targeting EBIT of IDR119bn (+15% y-y) and net profit
of IDR122bn (+181% y-y), backed in part by its MUN divestment. Based on
management guidance, META shares are trading at a 2013 PE of 24.4x, versus
its toll road peers in JSMR (2013 PE: 25.2x) and CMNP (2013 PE:20.1x), on our
forecasts. However, based on our rough calculation, META’s guidance translates
to an annualized core net profit of IDR53bn (+23% y-y), reflecting 2013 core PE
of 75.0x. Management expects tariff hikes on 3 of its toll roads in 2013 (exhibit
7) to provide positive earnings support in 2014. After 2-3 years, management
expects non-toll businesses’ increased contribution to help support earnings.
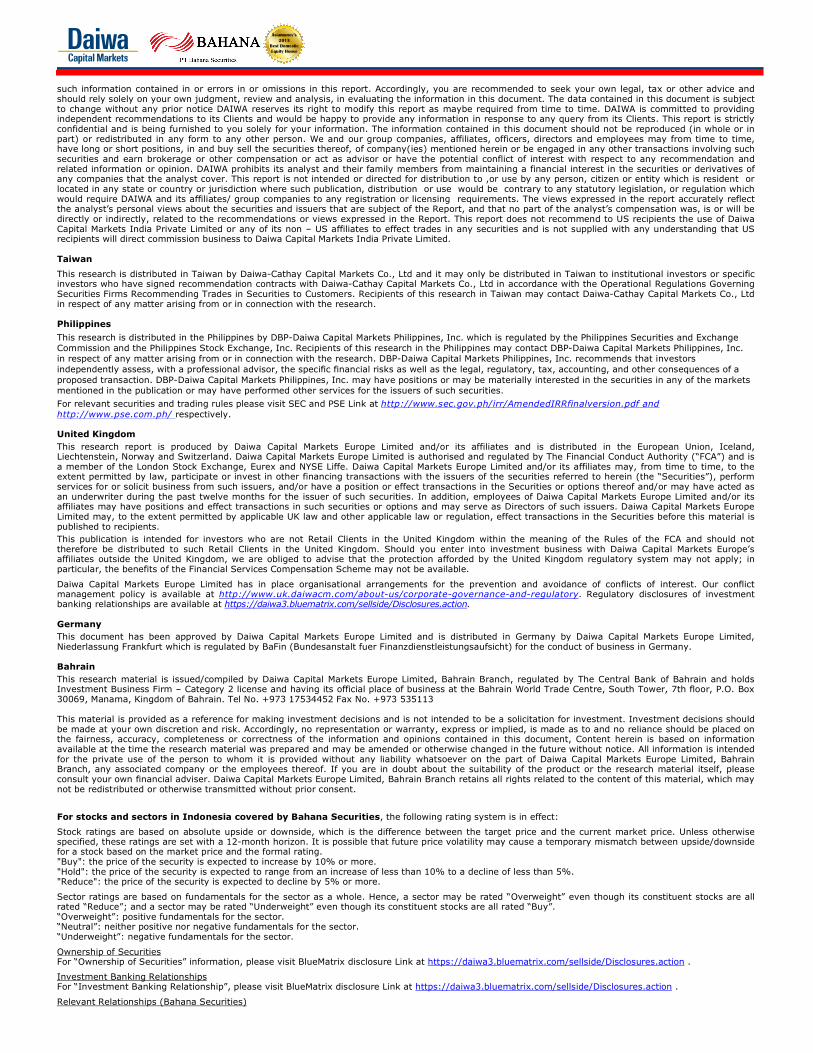
Over the past year, META shares have outperformed the JCI by 29% (exhibit 4).
Exhibit 1. Company information
Market cap (IDRb/USDm) : 4,007/329
3M avg.daily t.o.(IDRb/USDm) : 29.6/2.5
Bloomberg code : META IJ
Exhibit 2. Shareholders information
Eagle Infrastructure (%) : 21.7 Hijau Makmur Sejahtera (%) : 21.0
CGML Proprietary (%) : 9.7
Bosowa Corporindo (%) : 7.0
UBS AG/Singapore (%) : 6.0
Barclays PCL (%) : 5.8
Free float (%) : 28.8
Exhibit 3. Key forecasts and valuations
Year to 31 Dec 2010 2011 2012 9M13
Revenue (IDRb) 188 232 270 220
EBIT (IDRb) 69 88 104 81
Net profit (IDRb) (34) (27) 43 97
EPS (IDR) (2) (2) 3 6
EPS growth (%) (165.0) (21.4) (260.1) 310.5
EV/EBITDA (x) 35.9 30.3 26.8 31.9
PER* (x) (116.2) (147.9) 92.4 30.9
FCFPS (IDR) (2.5) (9.3) (3.7) (9.2)
FCF yield (%) (1.0) (3.5) (1.4) (3.5)
BVPS (IDR) 64 64 66 96
PBV (x) 4.1 4.1 4.0 2.7
DPS (IDR) 0 0 0 0
Yield (%) na na na na
ROAA (%) (2.1) (1.4) 2.3 5.8
ROAE (%) (4.6) (2.8) 4.4 10.6
EBIT margin (%) 36.7 37.9 38.5 37.0
Net gearing (%) 66.5 44.1 43.5 9.0Source: Company *Annualized
Pricing as of closing on 29 January 2014
Exhibit 4. Relative share price performance
(0.2)
(3.7)
15.1
10.9
17.8
28.8
(10)
(5)
0
5
10
15
20
25
30
(10)
(5)
0
5
10
15
20
25
30
ytd 1M 3M 6M 9M 12M
(%) (%)
META IJ relative to JCI
Source: Bloomberg

Disclosure: Bahana Securities does and seeks to do business with companies covered in its research reports. Investors should consider this report as only a single factor
in making their investment decision.
Please see the important disclaimer information on the back of this report
Asiamoney’s
2013
Best Domestic
Equity House
Nusantara Infrastructure
Year to 31 December 2010 2011 2012 9M12 9M13 PROFIT & LOSS (IDRb) Sales (Toll revenue) 188 232 270 200 220 EBITDA 130 146 166 126 130 Depreciation 61 58 62 50 48 EBIT 69 88 104 76 81 Net interest income/(expense) (103) (67) (63) (48) (36)
Forex gains/(losses) (0) (0) 2 1 8 Other incomes/(expenses) (39) (41) 11 3 117 Pre-tax profit (73) (20) 54 32 171
Taxes 15 (8) (6) (5) (59) Minority interest 3 1 (5) (4) (15) Proforma 21 - - - -
Net profit (34) (27) 43 24 97
BALANCE SHEET (IDRb) Cash and equivalents 200 312 323 350 617 S-T investments 25 0 0 0 0 Trade receivables 7 10 1 9 1
Inventories 0 0 0 0 0 Fixed assets 1,107 1,210 1,208 1,193 1,250 Other assets 571 304 488 437 623 Total assets 1,909 1,835 2,020 1,989 2,490 Interest bearing liabilities 852 738 760 763 748 Trade payables 5 31 0 1 0 Other liabilities 34 62 211 197 61
Total liabilities 890 831 971 961 810 Minority interest 38 37 43 41 216 Shareholders’ equity 981 968 1,006 987 1,464
CASH FLOW (IDRb)
EBIT 69 88 104 76 81 Depreciation 61 58 62 50 48 Working capital 158 94 144 99 144 Other operating items (240) (238) (235) (191) (228) Operating cash flow 48 2 75 34 46
Net capital expenditure (276) (144) (131) (86) (185) Free cash flow (228) (142) (56) (52) (140) Equity raised 745 0 0 0 489 Net borrowings (2) (113) 22 25 (11) Other financing (322) 367 46 66 (44) Net cash flow 192 112 11 39 294 Cash flow at beginning 8 200 312 312 323
Cash flow at end 200 312 323 350 617
RATIOS
ROAE (%) (4.6) (2.8) 4.4 3.2 10.6 ROAA (%) (2.1) (1.4) 2.3 1.6 5.8 EBITDA margin (%) 69.2 63.0 61.3 62.9 58.8 EBIT margin (%) 36.7 37.9 38.5 37.9 37.0 Net margin (%) (18.4) (11.7) 16.0 11.9 44.2 Payout ratio (%) 0.0 0.0 0.0 0.0 0.0 Current ratio (x) 15.0 3.2 1.8 1.8 6.3
Interest coverage (x) 0.7 1.3 1.6 1.6 2.3 Net gearing (%) 66.5 44.1 43.5 41.8 9.0
Debts to assets (%) 44.6 40.2 37.6 38.4 30.1 Debtor turnover (days) 54 13 7 13 6 Creditor turnover (days) 10 28 21 22 1 Inventory turnover (days) na na na na na Source: Company
Other income in 9M13
originates from META’s 5%
stake sale in MUN ...
… which increased META’s cash levels over the period
Additional equity raising from
MUN …
… net gearing has come down in 9M13
Salman Fajari Alamsyah ([email protected]) +6221 2505081 ext. 3605

Disclosure: Bahana Securities does and seeks to do business with companies covered in its research reports. Investors should consider this report as only a single factor
in making their investment decision.
Please see the important disclaimer information on the back of this report
Asiamoney’s
2013
Best Domestic
Equity House
Exhibit 5. Corporate structure
Source: Company
Exhibit 6. Telekom Infranusantara (TI) structure
Source: Company
Exhibit 7. Toll road portfolio and tariff hike increase
Toll road Length Avg tariff hike Operation start Concession end BSD 7.25km 10.1% (May 2013) 1999 2028
BMN 5.9km 15.5% (Oct 2013) 1998 2028
JTSE 11.6km 12.6% (Oct 2013) 2008 2041
JLB* 10km Planned in 2014 2010 2042 Source: Company *Owns minority (25%) stake
Business segments
include toll road
operators (BSD,
BMN, JLB & JTSE)
Seaport (ISAB),
Water (TBN&DCC))
Energy (IME) and
Telecommunication
(KING)
Holding a majority
stake (70%) in
KING through its
subsidiary, Telekom
Infranusantara (TI)
META’s toll road
portfolio amounts to
35km

Disclosure: Bahana Securities does and seeks to do business with companies covered in its research reports. Investors should consider this report as only a single factor
in making their investment decision.
Please see the important disclaimer information on the back of this report
Asiamoney’s
2013
Best Domestic
Equity House
Exhibit 8. Traffic volumes, 2009-9M13
22
24
27
29
23
13
14
16
18
14
6
8
10
11
910
17
20
17
0
5
10
15
20
25
30
2009 2010 2011 2012 9M13
(m)
BSD BMN JTSE JLB
Source: Company
Exhibit 9. Toll revenue breakdown, 9M13*
BSD
52%
JTSE
30%
BMN
18%
9M13 toll revenue: IDR220bn
Source: Company *Excluding revenue from JBL due to its minority ownership
2009-2012 CAGR of
24% in traffic
volumes
BSD was the largest contributor (52%) to
META’s toll revenue in 9M13, followed by
JTSE (30%) and BMN (18%)

Asiamoney’s
2013
Best Domestic
Equity House
Ricardo Silaen, CFA
[email protected] Salesext 2524
Harry [email protected]
Senior Associate DirectorHead of Equities & Research
Strategy, Consumerext 3600
direct: +62 21 250 5735
Dealing Room: +62 21 527 0808 (Foreign Institutional)
Research: +62 21 250 5081
+62 21 250 5508 (Domestic Institutional) +62 31 535 2788 (Surabaya Branch)
Teguh Hartanto
[email protected] Director
Deputy Head of Research
Banks, Cementext 3610
Leonardo Henry Gavaza
[email protected] Research Manager
Auto, Plantations, Heavy equipment,
Property, Industrial estateext 3608
Arga [email protected]
Economistext 3602
Aditya Eka [email protected]
Research AnalystPoultry, Telco, Aviation
ext 3603
Salman Fajari [email protected] Analyst
Property, Industrial estate, Steel, Cement, Toll roads
ext 3605
Jennifer Frederika Yapply
[email protected] Analyst
Coal, Oil and gas, Metalsext 3606
Chandra [email protected] Analyst, Transportation
ext 3609
Maxi [email protected] Analyst
Auto, Construction, Consumer, Mediaext 3615
Nuriah Sari
[email protected] Executive
ext 3001
Nurul [email protected]
Equity Salesext 2543
Siti Fathia Maisa Syafurah
[email protected] Salesext 2547
Ashish Agrawal
[email protected] President
Institutional Equity Salesext 2550 / 2553
Reynard [email protected]
Equity Salesext 2528
John M. [email protected]
Equity Salesext 2549
Yohanes Adhi Handoko
[email protected], Surabaya Branch
ext 7250
Angky Amarylis
[email protected] Traderext 2525
Suwardi Widjaja [email protected]
Equity Salesext 2548
Ricardo Silaen, [email protected]
Vice PresidentInstitutional Equity Sales
ext 2524
Nurul Farida
[email protected] Salesext 2543
Amelia Husada
[email protected] President
Institutional Equity Salesext 2552
Made Ayu [email protected]
Research Executiveext 3607
Laurensius [email protected]
Research Associateext 3601
Nico Laurens
[email protected] Associate
ext 3614
Zefanya Angeline [email protected] Associate
ext 3612
Giovanni Aristo
[email protected] Research Associate
ext 3604
Head Office Surabaya Branch
Graha Niaga, 19th Floor Wisma BII, Ground Floor
Jl. Jend. Sudirman Kav. 58 Jl. Pemuda 60-70
Jakarta 12190 Surabaya 60271
Indonesia Indonesia
Tel. 62 21 250 5081 Tel. 62 31 535 2788
Fax. 62 21 522 6049 http://www.bahana.co.id Fax. 62 31 546 1157

Asiamoney’s
2013
Best Domestic
Equity House
Disclaimer This publication is prepared by PT.Bahana Securities and reviewed by Daiwa Securities Group Inc. and/or its non-U.S. affiliates, and distributed outside Indonesia by Daiwa Securities Group Inc. and/or its non-U.S. affiliates, except to the extent expressly provided herein. Certain copies of this publication may be distributed inside and outside of Indonesia by PT. Bahana Securities in accordance with relevant laws and regulations. This publication and the contents hereof are intended for information purposes only, and may be subject to change without further notice. Any use, disclosure, distribution, dissemination, copying, printing or reliance on this publication for any other purpose without our prior consent or approval is strictly prohibited. Neither Daiwa Securities Group Inc. nor any of its respective parent, holding, subsidiaries or affiliates, nor any of its respective directors, officers, servants and employees, represent nor warrant the accuracy or completeness of the information contained herein or as to the existence of other facts which might be significant, and will not accept any responsibility or liability whatsoever for any use of or reliance upon this publication or any of the contents hereof. Neither this publication, nor any content hereof, constitute, or are to be construed as, an offer or solicitation of an offer to buy or sell any of the securities or investments mentioned herein in any country or jurisdiction nor, unless expressly provided, any recommendation or investment opinion or advice. Any view, recommendation, opinion or advice expressed in this publication constitutes the views of the analyst(s) named herein and does not necessarily reflect those of Daiwa Securities Group Inc. and/or its affiliates nor any of its respective directors, officers, servants and employees except where the publication states otherwise. This research report is not to be relied upon by any person in making any investment decision or otherwise advising with respect to, or dealing in, the securities mentioned, as it does not take into account the specific investment objectives, financial situation and particular needs of any person.
Neither Daiwa Securities Group Inc. nor any of its affiliates is licensed to undertake any business within the Republic of Indonesia. Any display of any trade name or logo of the Daiwa Securities Group Inc. on this publication shall not be deemed to be an undertaking of any business within the Republic of Indonesia.
Daiwa Securities Group Inc., its subsidiaries or affiliates, or its or their respective directors, officers and employees from time to time have trades as principals, or have positions in, or have other interests in the securities of the company under research including derivatives in respect of such securities or may have also performed investment banking and other services for the issuer of such securities. The following are additional disclosures.
Japan
Daiwa Securities Co. Ltd. and Daiwa Securities Group Inc.
Daiwa Securities Co. Ltd. is a subsidiary of Daiwa Securities Group Inc.
Investment Banking Relationship
Within the preceding 12 months, The subsidiaries and/or affiliates of Daiwa Securities Group Inc. * has lead-managed public offerings and/or secondary offerings (excluding straight bonds) of the securities of the following companies: CITIC Securities Company Limited (6030 HK); China Outfitters Holdings Limited (1146 HK); The People's Insurance Company (Group) of China Limited (1339 HK); China Precious Metal Resources Holdings Company Limited (1194 HK); Jiangnan Group Limited (1366 HK); Blackgold International Holdings Ltd (BGG AU); Tosei Corporation (8923 JP); Modern Land (China) Co. Ltd (1107 HK).
*Subsidiaries of Daiwa Securities Group Inc. for the purposes of this section shall mean any one or more of:
• Daiwa Capital Markets Hong Kong Limited
• Daiwa Capital Markets Singapore Limited
• Daiwa Capital Markets Australia Limited
• Daiwa Capital Markets India Private Limited
• Daiwa-Cathay Capital Markets Co., Ltd.
• Daiwa Securities Capital Markets Korea Co., Ltd
Disclosure of Interest of Bahana Securities
Investment Banking Relationship
Within the preceding 12 months, Bahana Securities has lead-managed public offerings and/or secondary offerings (excluding straight bonds) of the securities of the following companies: Sri Rejeki Isman (SRIL IJ); Semen Baturaja (Persero) (SMBR IJ); Tiphone Mobile Indonesia (TELE IJ); Austindo Nusantara Jaya (ANJT IJ); Telekomunikasi Indonesia (Persero) (TLKM IJ); Garuda Indonesia (Persero) (GIAA IJ)
Hong Kong
This research is distributed in Hong Kong by Daiwa Capital Markets Hong Kong Limited (“DHK”) which is regulated by the Hong Kong Securities and Futures Commission. Recipients of this research in Hong Kong may contact DHK in respect of any matter arising from or in connection with this research.
Ownership of Securities
For “Ownership of Securities” information, please visit BlueMatrix disclosure Link at https://daiwa3.bluematrix.com/sellside/Disclosures.action.
Investment Banking Relationship
For “Investment Banking Relationship”, please visit BlueMatrix disclosure Link at https://daiwa3.bluematrix.com/sellside/Disclosures.action.
Relevant Relationship (DHK)
DHK may from time to time have an individual employed by or associated with it serves as an officer of any of the companies under its research coverage.
DHK market making
DHK may from time to time make a market in the securities covered by this research.
Singapore
This research is distributed in Singapore by Daiwa Capital Markets Singapore Limited and it may only be distributed in Singapore to accredited investors, expert investors and institutional investors as defined in the Financial Advisers Regulations and the Securities and Futures Act (Chapter 289), as amended from time to time. By virtue of distribution to these category of investors, Daiwa Capital Markets Singapore Limited and its representatives are not required to comply with Section 36 of the Financial Advisers Act (Chapter 110) (Section 36 relates to disclosure of Daiwa Capital Markets Singapore Limited’s interest and/or its representative’s interest in securities). Recipients of this research in Singapore may contact Daiwa Capital Markets Singapore Limited in respect of any matter arising from or in connection with the research.
Australia
This research is distributed in Australia by Daiwa Capital Markets Stockbroking Limited and it may only be distributed in Australia to wholesale investors within the meaning of the Corporations Act. Recipients of this research in Australia may contact Daiwa Capital Markets Stockbroking Limited in respect of any matter arising from or in connection with the research.
Ownership of Securities
For “Ownership of Securities” information, please visit BlueMatrix disclosure Link at https://daiwa3.bluematrix.com/sellside/Disclosures.action.
India
This research is distributed by Daiwa Capital Markets India Private Limited (DAIWA) which is an intermediary registered with Securities & Exchange Board of India. This report is not to be considered as an offer or solicitation for any dealings in securities. While the information in this report has been compiled by DAIWA in good faith from sources believed to be reliable, no representation or warranty, express of implied, is made or given as to its accuracy, completeness or correctness. DAIWA its officers, employees, representatives and agents accept no liability whatsoever for any loss or damage whether direct, indirect, consequential or otherwise howsoever arising (whether in negligence or otherwise) out of or in connection with or from any use of or reliance on the contents of and/or omissions from this document. Consequently DAIWA expressly disclaims any and all liability for, or based on or relating to any
Asiamoney’s
2013
Best Domestic
Equity House
such information contained in or errors in or omissions in this report. Accordingly, you are recommended to seek your own legal, tax or other advice and should rely solely on your own judgment, review and analysis, in evaluating the information in this document. The data contained in this document is subject to change without any prior notice DAIWA reserves its right to modify this report as maybe required from time to time. DAIWA is committed to providing independent recommendations to its Clients and would be happy to provide any information in response to any query from its Clients. This report is strictly confidential and is being furnished to you solely for your information. The information contained in this document should not be reproduced (in whole or in part) or redistributed in any form to any other person. We and our group companies, affiliates, officers, directors and employees may from time to time, have long or short positions, in and buy sell the securities thereof, of company(ies) mentioned herein or be engaged in any other transactions involving such securities and earn brokerage or other compensation or act as advisor or have the potential conflict of interest with respect to any recommendation and related information or opinion. DAIWA prohibits its analyst and their family members from maintaining a financial interest in the securities or derivatives of any companies that the analyst cover. This report is not intended or directed for distribution to ,or use by any person, citizen or entity which is resident or located in any state or country or jurisdiction where such publication, distribution or use would be contrary to any statutory legislation, or regulation which would require DAIWA and its affiliates/ group companies to any registration or licensing requirements. The views expressed in the report accurately reflect the analyst’s personal views about the securities and issuers that are subject of the Report, and that no part of the analyst’s compensation was, is or will be directly or indirectly, related to the recommendations or views expressed in the Report. This report does not recommend to US recipients the use of Daiwa Capital Markets India Private Limited or any of its non – US affiliates to effect trades in any securities and is not supplied with any understanding that US recipients will direct commission business to Daiwa Capital Markets India Private Limited.
Taiwan
This research is distributed in Taiwan by Daiwa-Cathay Capital Markets Co., Ltd and it may only be distributed in Taiwan to institutional investors or specific investors who have signed recommendation contracts with Daiwa-Cathay Capital Markets Co., Ltd in accordance with the Operational Regulations Governing Securities Firms Recommending Trades in Securities to Customers. Recipients of this research in Taiwan may contact Daiwa-Cathay Capital Markets Co., Ltd in respect of any matter arising from or in connection with the research.
Philippines
This research is distributed in the Philippines by DBP-Daiwa Capital Markets Philippines, Inc. which is regulated by the Philippines Securities and Exchange Commission and the Philippines Stock Exchange, Inc. Recipients of this research in the Philippines may contact DBP-Daiwa Capital Markets Philippines, Inc. in respect of any matter arising from or in connection with the research. DBP-Daiwa Capital Markets Philippines, Inc. recommends that investors
independently assess, with a professional advisor, the specific financial risks as well as the legal, regulatory, tax, accounting, and other consequences of a
proposed transaction. DBP-Daiwa Capital Markets Philippines, Inc. may have positions or may be materially interested in the securities in any of the markets mentioned in the publication or may have performed other services for the issuers of such securities.
For relevant securities and trading rules please visit SEC and PSE Link at http://www.sec.gov.ph/irr/AmendedIRRfinalversion.pdf and http://www.pse.com.ph/ respectively.
United Kingdom
This research report is produced by Daiwa Capital Markets Europe Limited and/or its affiliates and is distributed in the European Union, Iceland, Liechtenstein, Norway and Switzerland. Daiwa Capital Markets Europe Limited is authorised and regulated by The Financial Conduct Authority (“FCA”) and is a member of the London Stock Exchange, Eurex and NYSE Liffe. Daiwa Capital Markets Europe Limited and/or its affiliates may, from time to time, to the extent permitted by law, participate or invest in other financing transactions with the issuers of the securities referred to herein (the “Securities”), perform services for or solicit business from such issuers, and/or have a position or effect transactions in the Securities or options thereof and/or may have acted as an underwriter during the past twelve months for the issuer of such securities. In addition, employees of Daiwa Capital Markets Europe Limited and/or its affiliates may have positions and effect transactions in such securities or options and may serve as Directors of such issuers. Daiwa Capital Markets Europe Limited may, to the extent permitted by applicable UK law and other applicable law or regulation, effect transactions in the Securities before this material is published to recipients.
This publication is intended for investors who are not Retail Clients in the United Kingdom within the meaning of the Rules of the FCA and should not therefore be distributed to such Retail Clients in the United Kingdom. Should you enter into investment business with Daiwa Capital Markets Europe’s affiliates outside the United Kingdom, we are obliged to advise that the protection afforded by the United Kingdom regulatory system may not apply; in particular, the benefits of the Financial Services Compensation Scheme may not be available.
Daiwa Capital Markets Europe Limited has in place organisational arrangements for the prevention and avoidance of conflicts of interest. Our conflict management policy is available at http://www.uk.daiwacm.com/about-us/corporate-governance-and-regulatory. Regulatory disclosures of investment banking relationships are available at https://daiwa3.bluematrix.com/sellside/Disclosures.action.
Germany
This document has been approved by Daiwa Capital Markets Europe Limited and is distributed in Germany by Daiwa Capital Markets Europe Limited, Niederlassung Frankfurt which is regulated by BaFin (Bundesanstalt fuer Finanzdienstleistungsaufsicht) for the conduct of business in Germany.
Bahrain
This research material is issued/compiled by Daiwa Capital Markets Europe Limited, Bahrain Branch, regulated by The Central Bank of Bahrain and holds Investment Business Firm – Category 2 license and having its official place of business at the Bahrain World Trade Centre, South Tower, 7th floor, P.O. Box 30069, Manama, Kingdom of Bahrain. Tel No. +973 17534452 Fax No. +973 535113
This material is provided as a reference for making investment decisions and is not intended to be a solicitation for investment. Investment decisions should be made at your own discretion and risk. Accordingly, no representation or warranty, express or implied, is made as to and no reliance should be placed on the fairness, accuracy, completeness or correctness of the information and opinions contained in this document, Content herein is based on information available at the time the research material was prepared and may be amended or otherwise changed in the future without notice. All information is intended for the private use of the person to whom it is provided without any liability whatsoever on the part of Daiwa Capital Markets Europe Limited, Bahrain Branch, any associated company or the employees thereof. If you are in doubt about the suitability of the product or the research material itself, please consult your own financial adviser. Daiwa Capital Markets Europe Limited, Bahrain Branch retains all rights related to the content of this material, which may not be redistributed or otherwise transmitted without prior consent.
For stocks and sectors in Indonesia covered by Bahana Securities, the following rating system is in effect:
Stock ratings are based on absolute upside or downside, which is the difference between the target price and the current market price. Unless otherwise specified, these ratings are set with a 12-month horizon. It is possible that future price volatility may cause a temporary mismatch between upside/downside for a stock based on the market price and the formal rating. "Buy": the price of the security is expected to increase by 10% or more. "Hold": the price of the security is expected to range from an increase of less than 10% to a decline of less than 5%. "Reduce": the price of the security is expected to decline by 5% or more.
Sector ratings are based on fundamentals for the sector as a whole. Hence, a sector may be rated “Overweight” even though its constituent stocks are all rated “Reduce”; and a sector may be rated “Underweight” even though its constituent stocks are all rated “Buy”. “Overweight”: positive fundamentals for the sector. “Neutral”: neither positive nor negative fundamentals for the sector. “Underweight”: negative fundamentals for the sector.
Ownership of Securities For “Ownership of Securities” information, please visit BlueMatrix disclosure Link at https://daiwa3.bluematrix.com/sellside/Disclosures.action .
Investment Banking Relationships For “Investment Banking Relationship”, please visit BlueMatrix disclosure Link at https://daiwa3.bluematrix.com/sellside/Disclosures.action .
Relevant Relationships (Bahana Securities)

Asiamoney’s
2013
Best Domestic
Equity House
Bahana Securities may from time to time have an individual employed by or associated with it serves as an officer of any of the companies under its research coverage.
Bahana Securities market making Bahana Securities may from time to time make a market in securities covered by this research.
Additional information may be available upon request.
Japan - additional notification items pursuant to Article 37 of the Financial Instruments and Exchange Law
(This Notification is only applicable where report is distributed by Daiwa Securities Co. Ltd.)
If you decide to enter into a business arrangement with us based on the information described in materials presented along with this document, we ask you to pay close attention to the following items.
• In addition to the purchase price of a financial instrument, we will collect a trading commission* for each transaction as agreed beforehand with you. Since commissions may be included in the purchase price or may not be charged for certain transactions, we recommend that you confirm the commission for
each transaction.
• In some cases, we may also charge a maximum of ¥ 2 million (including tax) per year as a standing proxy fee for our deposit of your securities, if you are
a non-resident of Japan. • For derivative and margin transactions etc., we may require collateral or margin requirements in accordance with an agreement made beforehand with
you. Ordinarily in such cases, the amount of the transaction will be in excess of the required collateral or margin requirements. • There is a risk that you will incur losses on your transactions due to changes in the market price of financial instruments based on fluctuations in interest
rates, exchange rates, stock prices, real estate prices, commodity prices, and others. In addition, depending on the content of the transaction, the loss could exceed the amount of the collateral or margin requirements.
• There may be a difference between bid price etc. and ask price etc. of OTC derivatives handled by us.
• Before engaging in any trading, please thoroughly confirm accounting and tax treatments regarding your trading in financial instruments with such experts
as certified public accountants.
*The amount of the trading commission cannot be stated here in advance because it will be determined between our company and you based on current market conditions and the content of each transaction etc.
When making an actual transaction, please be sure to carefully read the materials presented to you prior to the execution of agreement, and to take responsibility for your own decisions regarding the signing of the agreement with us.
Corporate Name: Daiwa Securities Co. Ltd.
Financial instruments firm: chief of Kanto Local Finance Bureau (Kin-sho) No.108
Memberships: Japan Securities Dealers Association, Financial Futures Association of Japan
Japan Securities Investment Advisers Association
Type II Financial Instruments Firms Association