nursing manpower allocation in hospitals - home - הנדסת · pdf file ·...
TRANSCRIPT

Nursing Manpower Allocation - Assignments Vs. Quality 1
Nursing Manpower Allocation in HospitalsStaff Assignment Vs. Quality of Care
Issachar Gilad, Ohad KhabiaIndustrial Engineering and Management, Technion
Andris FreivaldsHal and Inge Marcus Department of Industrial & Manufacturing Engineering
Penn State University

Nursing Manpower Allocation - Assignments Vs. Quality 2
Dilemmas
Can a hospital establishment be managed like an industrial or commercialservice organization?
In case we have a partial yes, than..
Can Industrial Engineering tools be used to enhance productivity measuresin daily management (like it does to industry)?
If possible, than..
Can the largest workforce in this operation - the nursing force, providebetter performance rates, according to economical criteria?
If yes, than..
Can an IE based methodology be used, to determine optimal nursingassignment in hospitals, to provide better quality care?

Nursing Manpower Allocation - Assignments Vs. Quality 3
Dilemma – in practical terms
Can a pre-calculated performance time be a factor, to enhanceanonymous patient’s quality care?
orCan quality of nursing care be presented by calculated operationaltime - for nursing activities, at any given clinical ward in hospitals?
and
Is it practical to determined the best ‘mix of nurses’ for a random‘blend of patients’ in a ward?Can we then provide pre-determined values for quality of service?

Nursing Manpower Allocation - Assignments Vs. Quality 4
There is an enormous demand for nurses in the immediate future, muchmore than can and will be available
Nurses FTE’s (Full Time Equivalent) doesn’t satisfy operational requirements
Nursing assignment are planed by the ‘head nurse’ according pastexperience – ‘guts feelings’
There is a non homogeneous distribution of work content among nurses
Quality of ‘nursing job’ does not play any factor in determination of nursingassignments
Forecasting the ward’s patients blend - doesn’t exist
Current state

Nursing Manpower Allocation - Assignments Vs. Quality 5
Allocating a fixed number of nurses per shift while patient’s number and complexityvary from shift to shift
Nursing allocation pattern - Internal ward C, Sheba Med. Center
4
4.5
5
5
5
Morning
?23Friday
?23.5Monday
?24Sunday
?24Saturday
?23.5Tuesday - Thursday
Real needNightEveningDay / Shift
Current state - Example

Nursing Manpower Allocation - Assignments Vs. Quality 6
� Develop a nursing manpower allocation model which dealswith workload, assignment and best fit between patient’sdemands and nurses availability - in clinical wards
� Establish a quantitative method that relates to productivityissues and to quality of care - for nursing activities
Objectives of study

Nursing Manpower Allocation - Assignments Vs. Quality 7
� Redefine nursing activities to allocate productive ways to deal withdynamics of patients variability
� Define nursing skills suitable for proper handling at different nursinglevels for various patient’s needs
� Determine work load and nursing activities in a quantitative way - onbasis of performance measurement
� Exercise findings and study approach in 2 Internal Med. Wards and 1Surgery Ward in Sheba Med. Center
� Use simulation procedures to forecast best nurse and patient mixture– create a decision tool for management
Method

Nursing Manpower Allocation - Assignments Vs. Quality 8
Method
Patientsclassification
Establishing time database for nursing activities
in target unit
Forecasting patientsblend
Nursing allocationpolicies definition
Converting the simulatorresults to a nursing FTE’s
Influence of the nursing FTE’son the nursing quality of care
Simulation

Nursing Manpower Allocation - Assignments Vs. Quality 9
Design of study
Develop a patient’s classification routine
Establish time data base for nursing activities, to target departments
Develop a forecasting patients blend program
Introduce a nursing allocation policies
Simulate patients needs to nursing assignments along 4 steps
Integrate quality of treatment in a manpower allocation equation

Nursing Manpower Allocation - Assignments Vs. Quality 10
Patients classification
Patient’s needs, in a time for care terms, varies as result of ‘nursingcomplexity’Nursing complexity, defines the scope of patient’s needs - equivalent to adiagnosis, related to the difficulty and measures of needed nursing careA five level scale to nursing complexity:
Level 1
Minimal nursing care – A patient that hisnursing needs are fulfilled by a routineactivity of the nursing staff
Partial nursing care – A patient with achronic disease that is not depended onthe nursing staff in implementation ofhis daily activities
Full nursing care – A patient that isconfined to his bed or depended on thenursing staff in implementation of hismajor daily activities
Complex nursing care – A patientthat needs an intensive nursing care
Special nursing care – A ventilatedpatient that his condition fits toemergency unit
Level 2Level 3
Level 4
Level 5

Nursing Manpower Allocation - Assignments Vs. Quality 11
Nursing allocation policies, theoretical
ExpertNurseNurse
Levels4-5
Levels1-3
- PolicyNversion #1
ExpertNurse Nurse
Levels4-5
Levels1-3
N - PolicyVersion #2
Nurse
Levels1-5
- PolicyI
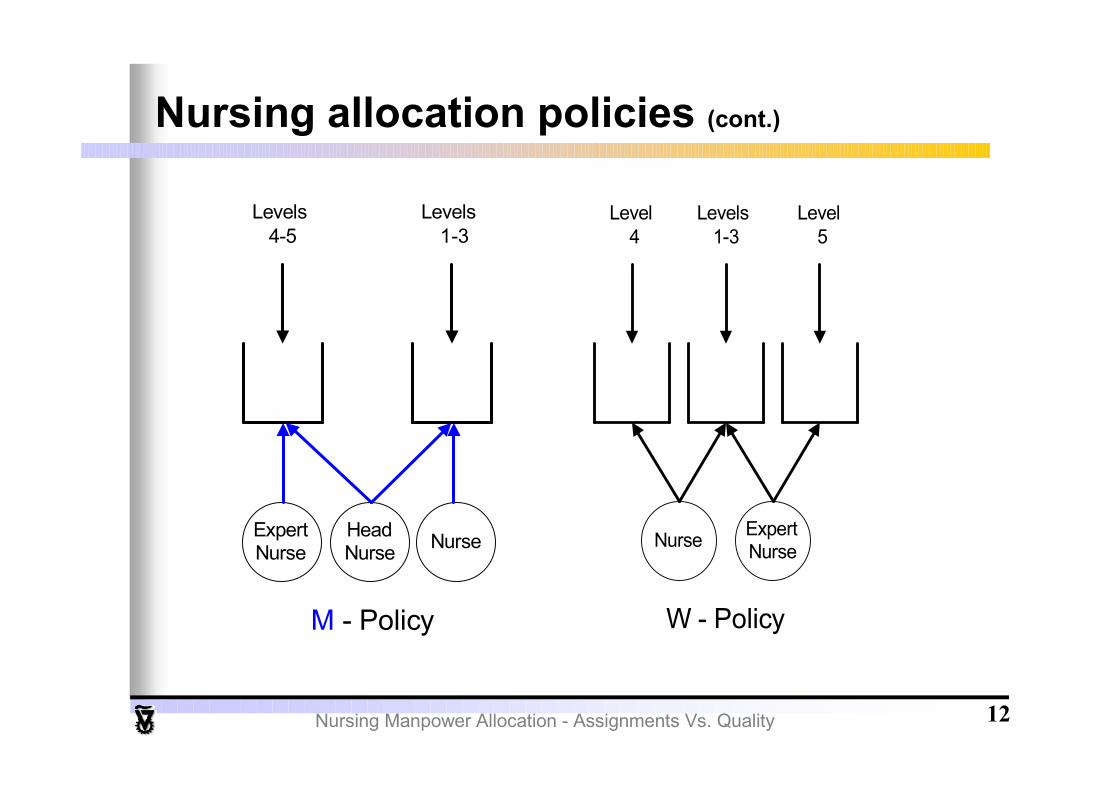
Nursing Manpower Allocation - Assignments Vs. Quality 12
NurseExpertNurse
HeadNurse
Levels1-3
Levels4-5
M - Policy
ExpertNurseNurse
Level5
Levels1-3
Level4
W - Policy
Nursing allocation policies (cont.)
Nursing Manpower Allocation - Assignments Vs. Quality 13
Performance time
The daily nursing work is a very complex work which characterized witha great random activitiesMore than 65% of the work performed by a nurse influenced by others,including physicians, administrators or professionals from otherdisciplinesOn average 74 different activities are executed by a nurse in oneshift (Murphy et al. ,1997)
Establishing a nursing time values (for core activities) can bemade by the following techniques:
Time studyWork samplingPMTSEvaluation

Nursing Manpower Allocation - Assignments Vs. Quality 14
Collecting core time values

Nursing Manpower Allocation - Assignments Vs. Quality 15
Procedures for collecting time data
Operativevalue
Simulator
currentstate
Evaluation
classicapproach
Worksampling
classicapproach
Time studyIncl. PMTS
Managerstool ?
Implementation
Level ofaccuracy
Appliedor used
Characterization
Technique
was notdone high
based ondata
very slow
varies
fairly fast
fast
justifiesitself
bad
problematic
good
non
quantitative
promising
problematic
Yes
(for pros.)
proposedstate
Classical approaches vs. current and proposed state
done inpast
usedoften
was notdone
low
intuitive

Nursing Manpower Allocation - Assignments Vs. Quality 16
The core activities approachUnlike traditional industries, measuring outputs in the health care industryis very difficultHigh variability, random and frequency of calls for nursing care, contributeto complex definitions for ‘quality of care’ - such will not be adoptedA different approach is proposed, based on “time for core activities” whichwill spread along time from selected activities to all activitiesThe term for ‘quality of nursing care’ will gradually expand by self learning
Nursing coreactivities
Nursing activities

Nursing Manpower Allocation - Assignments Vs. Quality 17
Time study technique was chosen as the best technique for establishingnursing time foundation
A time study analyst observes Nurse / Expert Nurse / Head Nurse / Aid Nurse andmeasures the actual time taken to perform an activityThe description for each activity and its duration are recorded in a time study form (Excel)
The nursing activities were divided into 2 groups:
Direct nursing activities (A): tasks that can be connected to the assigned patientcaring handled by his nurse such as: bandaging, medication, family interaction, patienthygiene etc.Indirect nursing activities (B): tasks that can not be connected to the assigned patientcaring handled by his nurse: unit related tasks (administration, clerical, team meetings etc.)co-ordination of care, breaks etc.
Direct time distributions were derived for each level of nursing complexity(for 3 shifts)
Establishing nursing time database

Nursing Manpower Allocation - Assignments Vs. Quality 18
Simulation
A simulation model is developed using the Matlab software
Patients classification, nursing time database, patient’s blend forecastingand 5 nursing allocation policies are the basic “ingredients” in this Matlabsimulation program
GUI (Graphic User Interface) to provides an easy way for inserting datawhich determine both the planning period and the nursing policy
The simulator provides the following results:1. FTE’s for the nursing mix2. Total forecasted direct time3. Total number of forecasted patients

Nursing Manpower Allocation - Assignments Vs. Quality 19
ThursdaySunMonTueWedThuFriSatPlanning day
Method implementation
Phase 1 => Backward assignment
Manpower planning using current method, by Head NurseAt end of week re-planning, by simulatorEvaluate the differences
Simulation

Nursing Manpower Allocation - Assignments Vs. Quality 20
Phase 2 => Parallel assignment
Manpower planning, by Head Nurse and by Simulator - in parallelEvaluate the differences by the two planeres
Simulation
ThursdaySunMonTueWedThuFriSatPlanning day
Method implementation

Nursing Manpower Allocation - Assignments Vs. Quality 21
Phase 3 => Assignment by simulator
Manpower planning, by SimulatorEvaluate outcomesDebugging
Simulation
ThursdaySunMonTueWedThuFriSatPlanning day
Method implementation

Nursing Manpower Allocation - Assignments Vs. Quality 22
Introducing Quality
Phase 4 => Plan according quality
Plan according quality – use of quality measures while planingEvaluate results
Simulation+ Quality
ThursdaySunMonTueWedThuFriSatPlanning day

Nursing Manpower Allocation - Assignments Vs. Quality 23
Patient’s blend forecastingNursing staff mix will depend on the blend and volume of patientsadmitted and applicable nurses - demanding complexitymanpower allocation procedure occurs in a 2 weeks planning horizonA model has been developed in order to forecast the patient mixFor patients blend we define 3 patients ‘populations’:
Released – patients that were released during the shift from the ward to the community(home or institute), to other ward or to vacationAdmissions - patients that were accepted during the shift to the ward from another ward orfrom ERVeterans – patients that are not related to the 2 above populations
In order to forecast the patients blend, in a given shift, a 9 stagesstatistical analysis procedure was implemented

Nursing Manpower Allocation - Assignments Vs. Quality 24
Patient’s blend forecasting1. Define the parameters that need to be forecasted(1) Released patients(2) Admissions(3) Veteran patients
2. Mine historical data for the parametersData from 1996 till 2006 was gathered
3. Divide the data to 2 groups: (1) Learning, and (2) Testing
(1) Learning group – data from 1996 till 2005 ; (2) Testing group – data from 2006
4. Search for any patterns in the learning data
Season patterns for the weeks days and exceptional patterns for some of the holidaysperiods were revealed
5. Select appropriate forecasting methods3 forecasting methods were selected : (1) Simple moving average ; (2) Weightedmoving average ; and (3) Exponnential smoothing
6. Select a measure for evaluation the forecasting goodness
MAPE - Mean AbsolutePercentage Error
7. Choose the best forecasting methodThis was done according to the value of the MAPE
8. Forecast to the test periodA forecast was made to 2006
9. Evaluate the forecasts goodnessThis was done by the following measures : (1)Forecast average errors ; (2) Forecast standarddeviation error ; and (3) Forecast error distribution

Nursing Manpower Allocation - Assignments Vs. Quality 25
Quality of nursing care
109876
#
Measuring pulse,temperature and bloodpressure
Falling risk estimationLansky estimationPain estimationNorton estimation
Core activity
Admissions ward explanation5Patients classification4Measuring pain in a daily basis3Filling nursing report2Wearing identifying brace1
Core activity#
Quality of nursing care’s grade is a weighted averageThis will be calculated by the relative importance of each nursing coreactivity’s grade (AHP by Satty)10 nursing core activities were selected:

Nursing Manpower Allocation - Assignments Vs. Quality 26
The Quality equation
The result of a nursing core activity is the percentage of patients for whom themeasured activity was fulfilled
Step 1 – converting the result of a nursing core activity to a nursing quality grade
The nursing quality grade for a nursing core activity result is computed as follows:
Step 2 – computing the weighted average grade for the Quality of nursing care (Satty, 1994)
The average grade for the quality of nursing care is computed as the sum of the products of eachnursing quality grade and its relative weight
The relative weight for each nursing quality grade determined by the PairedComparisons technique
)( iQ )( iR
∑=
⋅=10
1iii WQQ
( )iQ ( )iW
=∀≥
=Otherwise
iRRQ iii 0
10,...,1%80

Nursing Manpower Allocation - Assignments Vs. Quality 27
Findings
2 Internal Wards (C and D) and 1 Surgery ward in the Sheba Med. Centerwere in the scope of a pilot studyAssignments, as determined for internal ward C and for internal ward D, are:
333434Night
454465Evening
56-58-Morning
Aid nurseNurseHead nurseAid nurseNurseHead nurseInternal ward DInternal ward C
Time study in the Sheba medical center

Nursing Manpower Allocation - Assignments Vs. Quality 28
Patients blend
Blend of patients in C & D wards
18%
43%
27%
7% 5%
32%23%
38%
7%0%
0%
10%
20%
30%
40%
50%
1 2 3 4 5nursing level
Internal ward C Internal ward D
Based on the historical data an average percentages of each nursing level ofcare for both internal wards were calculated

Nursing Manpower Allocation - Assignments Vs. Quality 29
Nursing operation time – pilot studyMaximal valueMininmal valueStandard div.Average (minutes)nDistributionNursing levelShift
29.312.66.619.51012 + 18 * Beta (0.644, 0.791)1Morning
41.712.39.424.92012 + 30 * Beta (0.654, 0.862)265.613.616.033.91813 + Weibull (21.9, 1.18)397.924.327.252.1724 + Gamma (39.6, 0.709)4
138.084.124.9101.0484 + 54 * Beta (0.255, 0.348)536.37.37.919.719Triangular (7, 15, 37)1Evening
39.97.47.622.437Normal (22.4, 7.54)238.116.26.726.12116 + 23 * Beta (0.844, 1.11)381.013.517.838.311Normal (38.3, 17)492.923.128.556.15Uniform (23, 93)511.20.82.75.124Normal (5.06, 2.64)1Night
20.81.94.79.3401 + Weibull (9.36, 1.88)220.75.04.612.0335 + Weibull (7.28, 1.21)378.812.124.941.36Uniform (12, 79)493.89.624.338.4119 + Weibull (30.8, 1.16)5
Maximal valueMininmal valueStandard div.Average (minutes)nDistributionAdmissions/ReleaseShift
59.715.213.430.81015 + Exponential (15.8)(*) AdmissionsMorning23.613.34.218.3713 + 11 * Beta (0.72, 0.779)Release59.715.213.430.81015 +Exponential (15.8)AdmissionsEvening
21.82.45.39.715Normal (9.73, 5.13)Release73.524.116.648.810Uniform (24, 74)AdmissionsNight

Nursing Manpower Allocation - Assignments Vs. Quality 30
Selecting the forecasting days

Nursing Manpower Allocation - Assignments Vs. Quality 31
Selecting a month

Nursing Manpower Allocation - Assignments Vs. Quality 32
Selecting a predicted day

Nursing Manpower Allocation - Assignments Vs. Quality 33
Selecting nursing policy

Nursing Manpower Allocation - Assignments Vs. Quality 34
Findings of simulation - pilot study

Nursing Manpower Allocation - Assignments Vs. Quality 35
-' פנימית ג
-' פנימית ד
Simulating – Wards C & D - morning shift

Nursing Manpower Allocation - Assignments Vs. Quality 36
-' פנימית ג
-' פנימית ד
Simulating – Wards C & D - Eveninging shift

Nursing Manpower Allocation - Assignments Vs. Quality 37
-' פנימית ג
-' פנימית ד
Simulating – Wards C & D - Night shift

Nursing Manpower Allocation - Assignments Vs. Quality 38
So far…