nureg/la-0017, 'assessment of trac-pf1/mod1 against a …
TRANSCRIPT

NUREG/lA-001 7
InternationalAgreement Report
Assessment of TRAC-PF1/MOD1Against a Loss-of-Grid Transientin Ringhals 4 Power PlantPrepared byA. Sjoberg, J. Almberger, 0. Sandervag
Swedish Nuclear Power InspectorateS-102 52 Stockholm, Sweden
Office of Nuclear Regulatory ResearchU.S. Nuclear Regulatory CommissionWashington, DC 20555
July 1989
Prepared as pan ofThe Agreement on Research Participation and Technical ExchangeunOer the International Thermal- Hydraulic Code Assessmentana Avoticatton Program (ICAP)
Published byU.S. Nuclear Regulatory Commission

NOTICE
This report was prepared under an international cooperativeagreement for the exchange of technical information; Neitherthe United States Government nor any agency thereof, or any oftheir employees, makes any warranty, expressed or implied, orassumes any legal liability or responsibility for any third party'suse, or the results of such use, of any information, apparatus pro-duct or process disclosed in this report, or represents that its useby such third party would not infringe privately owned rights..
Available from
Superintendent of DocumentsU.S. Government Printing Office
P.O. Box 37082Washington, D.C. 20013-7082
and
National Technical Information ServiceSpringfield, VA 22161

NUREG/IA-00 17
InternationalAgreement Report
Assessment of TRAC-PF1/MOD1Against a Loss-of-Grid Transientin Ringhals 4 Power PlantPrepared byA. Sjoberg. J. Almberger. 0. Sandervag
Swedish Nuclear Power InspectorateS-102 52 Stockholm. Sweden
Office of Nuclear Regulatory ResearchU.S. Nuclear Regulatory CommissionWashington, DC 20555
July 1989
Prepared as part of"h* Agreement on Research Participatlon and Technical Exchangeunder the International Thermal-Hydraulic Code Assessmentand Apptlcation Program (ICAP)
Published byU.S. Nuclear Regulatory Commission

NOTICE
This report documents work performed under the sponsorship of the SKI/STUDSVIK
of Sweden. The information in this report has been provided to the USNRC
under the terms of an information exchange agreement between the United States
and Sweden (Technical Exchange and Cooperation Arrangement Between the United
States Nuclear Regulatory Commission and the Swedish Nuclear Power
Inspectorate and Studsvik Enerigiteknik AB of Sweden in the field of reactor
safety research and development, February 1985). Sweden has consented to the
publication of this report as a USNRC document in order that it may receive
the widest possible circulation among the reactor safety community. Neither
the United States Government nor Sweden or any agency thereof, or any of their
employees, makes any warranty, expressed or implied, or assumes any legal
liability of responsibility for any third party's use, or the results of such
use, or any information, apparatus, product or process disclosed in this
report, or represents that its use by such third party would not infringe
privately owned rights.

STUDSVIK ENERGITEKNIK AB Project BIV - 670219
Swedish State Power Board
Anders SjdbergJan Almberger ')OddbjtOrn Sandervig
ICAP
Assessment of TRAC-PFI/MODI Against a Loss of GridTransient in Ringhals 4 Power Plant.
ABSTRACT
A loss of grid transient in a three loopWestinghouse PWR has been simulated with thefrozen version of TRAC-PFI/MODI computer code. Theresults reveal the capability of the code toqualitatively predict the different pertinentphenomena and the data comparison was quiteencouraging. Accurate predictions of the systemresponse required careful determination of theboundary conditions simulating the turbinegovernor valves and steam dump valves behaviour.An explicit modeling of the steam generatorinternals was also found to be important for theresults. It was also revealed that the pressurizersystem including spray and heaters and theiroperation should be modeled in some detail forproper response.
*) Swedish State Power Board
Approyvd by:
I
NPi1 M)-LX

STUDSVIK ENERGITEKNIK AB STUDSVIK/NP-87/10 21987-03-18
EXECUTIVE SUMMARY
A TRAC-PFI/MODI simulation has been conducted to
assess the capability of the code to predict a
loss of grid transient.
The measured data was obtained from a loss of gridtest at full power operation conducted in Ringhals4 power plant. Ringhals 4 is a Westinghouse PWRwith three loops and two turbines of Stal-Lavaldesign. The nominal thermal power is 2775 MW and915 MW electrical. It is equipped with threeWestinghouse steam generators model D3 with afeedwater preheater section located at the cold
leg side and a division is made of the feedwaterflow between this lower feedwater inlet and the
top inlet at the upper part of the downcomer.
During the test the total feedwater was apportion-ed so that about 10% of the flow was delivered to
the top inlet and the rest to the preheater. Thecirculation ratio at this conditions was about2.43. The test was manually initiated by releasingthe station breakers thereby isolating the plant
from the external grid. At that instant about 95%of the turbine load was rejected and the plant
started to automatically regulate to a power levelcorresponding to the house load demand by means ofsteam dumping and control rod insertion.
In the TRAC-simulation only a single looprepresentation was used and the core was modeledwith a neutron point kinetics specified with
beginning-of-cycle conditions. The complete model
comprised 30 components made up by 133 nodes with
the boundary condition components excluded.
NPIlI M-LK

STUDSVIK ENERGITEKNIK AB STUDSVIK/NP-87/10 31987-03-18
The boundary conditions were taken from the testrecordings and were:
- The flow area of the turbine governor valves
- The flow area of the steam dump valves- The reactor coolant pump revolution speed- The feedwater flow and temperature- The control rod position
- The spray cooling power in the pressurizer steamvolume.
For the calculation the control rod position wasconverted into a table providing the control rodreactivity versus time.
The result of the simulation revealed the import-ance of proper modeling of steam generator second-ary side internals and valve characteristics. Alsomodeling of the signal processing devices wasfound to be of importance for simulAting time
delays. Although adequate information to provide aproper modeling of the time delays was scarce the
outcome of the data comparison was quiteencouraging. On the average the calculated steamflow was within about 8 1, the calculated steam
line pressure within 2 % and the calculated steamgenerator level within about 10 % of measuredvalues. On the primary side the calculated mass
flow was within about 3 %, the calculated corepower within 3 S, the pressurizer level within I%and the calculated pressure within about 5 % ofmeasured values.
NP111 M-LK

STUDSV:K ENERGITEKNIK AB STUDSVIK/NP-87/10 41987-03-18
From the run statistics it was found that the 40 stransient made use of 550 time steps requiring1813 CPU-seconds on a CDC CYBER 180-835 computer.The time step sizes were forced to be within thefollowing limits. During the first 10 8 of thetransient the maximum time step was set to 0.05 swhile for the rest of the transient 0.1 s was
specified.
NP111 M-LK

STUDSVIK ENERGITEKNIK AB STUDSVIK/NP-87/10 51987-03-18
LIST OF CONTENTS
ABSTRACT
EXECUTIVE SUMNARY
I INTRODUCTION
2 PLANT AND TEST DESCRIPTION
3 CODE AND MODEL DESCRIPTION3.1 Primary system nodalization3.2 Secondary system nodalization
4 STEADY-STATE CALCULATION
5 DATA COMPARISON5.1 Boundary conditions used in the
transient5.2 Results from the simulatioU5.3 Estimation of accuracy and run
statistics
6 CONCLUSIONS
7 REFERENCES
NP111 M-LK

STUDSVIK ENERGITEKNIK AB STUDSVIK/NP-87/10 61987-03-18
1 INTRODUCTION
The International Thermal-Hydraulic Code
Assessment and Applications Program (ICAP) isbeing conducted by several countries andcoordinated by the USNRC. The goal of ICAP is tomake quantitative statements regarding theaccuracy of the current state-of-the-artthermal-hydraulic computer programs developed
under the auspices of the USNRC.
Sweden's contributions to ICAP relate both to
TRAC-PWR (2) and RELAP5 (2). The assessmentcalculations of RELAPS are being conducted by
Studsvik Energiteknik AB for the Swedish NuclearPower Inspectorate while the TRAC calculationsare being carried out as a joint effort betweenthe Swedish State Power Board and Studsvik. Theassessment matrix is shown in Table 1.
In this report the results of in assessment of
TRAC-PFI/MOD1 against a loss of grid transientis presented. The ability of TRAC tc simulate
this transient is assessed by comparison to datafrom a loss of grid test conducted at full powercondition in the Ringhals 4 power plant.
The background for the transient is the Swedishelectrical grid blackout which occurred on Dec
27, 1983. Because of a grid disturbance in thesouth of Sweden scram occurred in eight out ofnine operating nuclear reactors and a relatively
long time passed before the reactor plants couldresume the electricity production.
The event illustrated the advantage in being
able to transfer the reactors from nominalservice load into a stable operation mode with
external load rejected and maintaining this modeNPl11 M-LK

STUDSVIK ENERGITEKNIK AB iTUDSVIK/NP-87/10 71987-03-18
while the external grid is being restored. In
this mode the turbine load corresponds to thein-plant electricity consumption only (giving itthe name "house turbine operation') and excesssteam is dumped to the condenser. During the"December blackout' the success of this kind of
operation would have shortened the outage timesconsiderably.
Already in the design specifications of the
plants the possibility of 'house turbine opera-tion" was recognized. Thus sufficient dumpsystem capacity is provided to accomodate suchan operation. However, the transition to 'house
turbine operation" has previously always failedresulting in tripping of the reactor. Review ofthe "blackout' event and previously unsuccessful
tests indicated that the transient interactionbetween important system components and controlsystems was the main reason for small or non-
existent trip margins.
After modification of the steam dump valvecontrol along with introduction of some othermeasures a successful "house-turbine' transition
test was demonstrated in Ringhals 4 PWR on Sept7, 1985. The test was carried out at beginning-of-cycle fuel conditions. The plant recordingsystem had been extended making the test suit-
able for code assessment purposes. This test isused as an assessment case for the frozenversion of TRAC-PFl/MOD1.
A description of the plant and the test tran-
sient is given in section 2. The nodalization isdescribed in section 3 and the steady-statecalculation is reviewed in section 4. Datacomparison is outlined in section 5 and the
conclusions are given in section 6.NP111 M-LK

STUDSVIK ENERGITEKNIX AB STUDSVIK/NP-87/101987-03-18
8
Table 1
ICAP Assessment Matrix - Sweden
Code Facility Type Description
Sep.effect Integral
RELAP5 Marviken2l X Subcooled Critical Flow
RELAP5 Marvikenll X Critical Flow, level swell
RELAP5 FIX-II X Recirculation Line (10%) break
RELAP5 FIX-Il X Recirculation Line (31%) break
RELAPS FIX-I1 X Recirculation Line (200%) break
RELAP5 LOFT X Cold Leg Break (4") pumps off
RELAP5 LOFT X Cold Leg Break (4") pumps on
RELAP5 FRIGG X Subcooled Void Distribution
RELAP5 FRIGG X Critical Heat Flux
PELAP5 R1T X Post Dryout Heat Transfer
TRAC-PFI Ringhals X Loss of Load
NP11 M-LK

STUDSVIK ENERGITEKNIK AB STUDSVIE/NP-87/10 91987-03-18
2 PLANT AND TEST DESCRIPTION
Ringhals 4 is a 3-loop, 2 turbine PWR of
Westinghouse-Stal Laval design. The power is
normally 2775 MW thermal and 915 MW electrical.
It is equipped with three Westinghouse steam
generators model D3 with a feedwater preheater
section located at the cold leg side. The
feedwater is divided between the top feedwater
inlet, which enters into the upper part of the
downcomer, and the preheater section at the
lower end of the riser. Normally only a smaller
part of the total feedwater flow is delivered to
the top inlet and the rest to the preheater.
In the preheater section the flow is apportioned
due to the flow restrictions in support plates
etc. According to specifications at nominal load
and no top feedwater 54.5 % of the flow is fed
to the upper part of the riser (U-tube boiler
section) while the remaining flow is fed
downward and enters the lower end of the riser
on the hotleg side where it mixes with the
downcomer flow. The circulation ratio at this
condition is specified to be 2.43.
The 'house turbine" transition test was conducted
with the plant initially operating at full power
and about equally loaded turbines. The external
400 kV electrical grid was connected to the
plant in a way to facilitate manual initiali-
zation of the test.
The test was initiated by manually releasing the
station breakers thereby isolating the plant
from the external grid. At that instant about
95 % of the turbine load was rejected while
still the steam flow was maintained and conse-
NPIll M-LK

STUDSVIK ENERG:TEKNIK AB STUDSVIK/NP-87/10 101987-03-18
quently the turbines started to accelerate. Theturbine acceleration limiter was activatedcausing fast closure of the turbine governorvalves. Subsequently these valves were auto-matically adjusted to cover the in-plant loaddemand. Also the control rod insertion systemand the steam dump system were activated.
The turbine overspeed resulted in an increase ofthe internal electrical grid frequency which in
turn caused an instantaneous overspeed of thereactor coolant pumps. The increased reactorcoolant flow resulted in a somewhat lower coretemperature and thus an increase in reactor
power occurred. After a few seconds the reactorpower started to decrease because of reducedpump speed which originated from the turbinefrequency regulation, control rod insertion ofthe D-bank and increased moderator temperature.
The mismatch between the core power and the
turbine load was controlled by dumping steam tothe condensers. Due to delays in the control and
steam dump activation system a temporary inter-ruption of the steam flow and heat removaloccurred when the turbine governor valves were
closed. Thus the heat was temporarily stored inthe system and the pressure increased.
Once the steam dump valves were activated, the
produced steam could be removed and the pressuredecreased. The control rod insertion of theD-bank continued at maximum speed until a signal
on low rod position was achieved at about 35 sinto transient. At the reception of this signal
the emergency boration was manually initiated aswell as manual regulation of the control rodsfor prolonged 'house turbine operation".
NP111 M-LK

STUDSVIR ENERGITEXNIK AB STUDSVIX/NP-87/10 111987-03-28
After 15 minutes stable operating conditionswere maintained with a core power level about 40
percent and the test was terminated. Unfortunately
the reactor scramnmed during the synchronizationof the generators with the external grid fre-quency. Due to imbalances in the magnetization
of the generators low voltage on the internal
grid occurred which resulted in a shut down ofthe ordinary generators and a start up of the
auxiliary diesel power supply. This sequence
also implied that one reactor coolant pump
stopped and the reactor was scrammed on theoccurrence of low coolant flow in one loopconcurrent with high core power level (higherthan 34 %).
The major subject of concern for this type of
transients is the power mismatch in the beginning
of the transient caused by interacting processesassociated with closure of the turbine governorvalves and opening of the steam dump valves.
Review of the "December blackout" and analysesof unsuccessful load rejection tests revealed
that the major cause for large transient over-
shoots and scram were delays in the steam dumpsystem. These delays resulted in a heat build up
in the primary coolant and a challenge to theDNB protection system.
Also the protection limit on negative rate of
change in neutron flux could be challenged
because of the increased moderator temperature.The decrease in neutron flux would be
accentuated by the decrease in pump speed and
the insertion of control rods. Analysis hasshown that the limit on high positive rate of
change in neutron flux could be challenged whenthe pump speed first increased due to the
turbine frequency swings.
NPiI1 M-LK
STUDSVIK ENERGITEKNIK AB STUDSVIK/NP-87/10 121987-03-18
Prior to the test modifications of the hardwarein the plant were made in order to reduce thedelays in the steam dump system. Also setpointswere modified to increase the operational margin
for both positive and negative rate of change inneutron flux. The limit on negative rate waschanged from -5 per cent to -8 while on thepositive side the limit was increased by a
corresponding amount.
NP121 M-LK

STUDSVIK ENERGITEKNIK AB STUDSVIK/NP-87/10 131987-03-28
3 CODE AND MODEL DESCRIPTION
The simulation of the 'house turbine" transitionwas made with version 12.4 of the TRAC-PFI/MOD1computer code (2). The program was run on a CDCCYBER 180-835 computer under NOS 2.5 operatingsystem with no SCM and LCM partition of thememory. Instead the central processor primarymemory was used together with an extended memory
capability. TRAC was also locally modified toallow writing of signal variables and controlblock output on a separate file for later
plotting with a separate program. Thus the EXCONand TRAP programs were not used for producingthe graphics.
In the simulation only a single loop representa-tion was used as shown in Figure 1. Differencesbetween the three loops were considered to
produce effects of secondary order during the
transient. It should be noted that trip marginsare usually dependent on conditions in individual
loops. For instance, the trip on DNB-protection
is initiated by the conditions in the two mostextreme loops. Since the symmetry between theloops was not perfect this will influence thecomparison between calculated and measured tripmargins.
The TRAC-model of Ringhals 4 nuclear steamsupply system is depicted in Figures I and 2.The nodalization comprised 14 components with 73
nodes on the primary side and 16 components with60 nodes on the secondary side making a total of30 components with 133 nodes if the boundary
condition components are excluded.
NP111 M-LX

STUDSVIK ENERGITEKNIK AB STUDSVIK/NP-87/10 141987-03-18
3.1 Primary system nodalization
The reactor core, denoted by component 5, was
divided into seven vertical nodes; five nodesrepresenting the active core and one unheated
inlet and outlet node respectively. The neutronkinetics was simulated by a point model withbeginning-of-cycle characteristics.
The upper plenum (component 6) and hot leg inletwas divided into three nodes. The hot leg andsurge line, denoted 710 , was represented by atee-component with five nodes in each branch.
The pressurizer was modeled by two pipe
components; the upper one representing the partof the pressurizer expected to contain steamonly throughout the transient. The water phaseoccupied about 50 per cent of the pressurizer
height. This nodalization was chosen to be ableto introduce coolant spray explicitly into thesteam phase. The spray effect was provided bymeans of a predefined negative power added to
the fluid (steam) in component 60. Two PORVs(power operated relief valves) were modeled(components 52 and 53) on top of the pressurizer.
For this specific transient the PORVs did notopen and the valves were assumed to be blockedin the calculation.
The primary side of the steam generator is
modeled by 18 nodes; one each for the inlet andoutlet plena and sixteen nodes for the U-tube.
The cold leg leading from the steam generator tothe vessel inlet was represented by 10 nodes;
five on each side of the recirculation pump. Thevessel inlet section was modeled by three nodes,
and the downcomer and lower plenum were repre-
sented by two nodes and one node, respectively.
NP111 M-LK

STUDSVIK ENERGITEKNIK AB STUDSVIX/NP-87/10 151987-03-18
3.2 Secondary system nodalization
An outline of the steam generator is depicted inFigure 2. Feedwater was supplied to the steamgenerator at two locations. Ten percent of the
feedwater was supplied as top feed into the
downcomer and ninety percent into the preheatersection near the outlet of the cold leg side of
the U-tube. In the model the ratio between the
top feed and preheater feed was kept constant
even under transient conditions because theactual distribution was unknown.
The hot leg boiler and the explicitly modeledpreheater section were both divided into five
nodes with the node boundaries located at thesame elevations. The U-tube boiler was repre-
sented by three nodes. An ideal separator whichallowed only steam to escape upwards was assumed
at the top of the riser. A connection was madebetween the separator node and the upper separa-
tor drain flow path. The downcomer was represen-ted by totally nine nodes.
The steam generator level measurement repre-sented by a differential pressure, was expli-
citly modeled in order to estimate dynamiccontributions from flow and mass content.
The steam line was divided into a number oftee-components and the secondary pressure (steam
line pressure) was measured in the tee-component752. Also safety and relief valves were
connected to the steam line. None of thesevalves were activated during the transientalthough the activation logic was modeled. The
part of the steam line denoted by 753 was
NP111 M-LK

STUDSVIK ENERGITEKNIK AB STUDSVIK/NP-87/10 161987-03-18
represented by a valve component with two nodessimulating the main steam stop valve.
The steam flow was divided into two streams -
one for each turbine - in the steam line header(754) which was represented by three nodes. The
line for each turbine was further split into two
flow paths - one containing the turbine valveand the other containing the dump valve. Timedependent characteristics of these valves were
given as boundary conditions for the thermal-hydraulic problem.
NP111 M-LK

STUDSVIK ENERGITEKNIK AB STUDSVIK/NP-87/10 171987-03-18
4 STEADY-STATE CALCULATION
Prior to the transient simulation the TRAC modelwas adjusted to replicate the plant stationary
pre-test conditions. This was done by means of astep-wise procedure starting with identificationof the appropriate steady-state of the TRAC
steam generator component which handled all theprimary-to-secondary heat transfer (enclosed bydashed line in Figure 2). It is usually diffi-cult to attain a specified heat transfer without
applying special measures in this type ofmodeling. The reason can partly be found in thedonor cell formulation but also in the substan-tial amount of counterflow and crossflow in the
secondary side riser. The crossflow enhances theheat transfer considerably and is not taken intoaccount in the ordinary heat transfer correlations.
Key parameters in the steady-state adjustments
were the primary temperature, secondary pressureand the heat transfer distribution on thehot-leg boiler, the preheater, and U-tubeboiler. By increasing the heat transfer area inthese three sections the total measured heattransfer could be attained at a given primary
flow as well as the apportionment of the heattransfer between the sections according todesign specifications. Evaluation of flowdistribution from the preheater revealed that 55
percent of the feedwater flow would enter theU-tube boiler while the rest would enter thehot-leg boiler. Appropriate loss coefficientswere applied to the preheater to achieve thisratio. Also, by applying appropriate losscoefficients, the specified flow distribution onthe secondary side was met. It was found thatthe nominal heat transfer areas in the hot-legboiler and the U-tube boiler had to be increased
NP111 M-LK

STUDSVIK ENERGITEKNIK AB STUDSVIK/NP-87/10 181987-03-18
by factors 1.33 and 1.559, respectively. Themultipliers for the preheater were 1.29 in theupper part, 3.46 at the feed water inlet and1.82 in the lower part. The high number at thefeed water inlet was justified by an expectedlarge crossflow at this location.
The rest of the steam generator components wereadded and, by adjusting the downcomer losscoefficients and the secondary side liquid
inventory, the specified circulation ratio anddowncomer liquid level were attained.
The primary side loop and the steam line systemwere then adjusted to meet the steam generator
condition and as a final step the different
subsystems were joined together. With only minorcorrections the complete model could be brought
to the stable plant pre-test condition.
NPll1 M-LK

STUDSVIK ENERGITEKNIK AB STUDSVIK/NP-87/10 191987-03-18
5 DATA COMPARISON
The simulation was made using a single looprepresentation. The measured thermal-hydraulicdata were obtained for each loop, thus an
averaging procedure had to be applied in orderto provide data for an average single loop. The
averaged parameters were
- Cold leg temperature
- Hot leg temperature
- Mass flows- Secondary pressures- Steam flows- Feedwater flows and temperatures
- Steam generator levels
It was noted that the averaged measured valueshad some minor inconsistencies and did notcompletely satisfy the heat and mass balance.
Small shifts in the measured valves were there-
fore introduced to meet the TRAC-requirements onan adequate steady-state.
5.1 Boundary conditions used in thesimulation
The time histories of the boundary conditionswere either obtained directly from the test
recordings or taken as average values from thethree loops. In the simulation the followingboundary conditions were used:
The flow area of the turbine governor
valves
- The flow area of the steam dump valves
- The reactor coolant pump revolutionspeed
NPIll M-LK

STUDSVIK ENERGITEKNIK AB STUIDSVIK/NP-87/10 201987-03-18
- The feedwater flow
- The feedwater temperature
- The control rod position
- The spray cooling power in the upperpart of the pressurizer
The areas of the turbine governor valves and thesteam dump valves as a function of time aredepicted in Figure 3. In the calculations it wasassumed that the turbine valves were closed overa period of 0.4 s according to specified charac-
teristics and thereafter remained closed through-out the transient. In reality these valves werefully closed only for some seconds and thenregulated to a partly open position correspondingto the plant internal power demand of approxi-
mately 5 per cent of nominal power. This wastaken into account by adding capacity to the
steam dump valves corresponding to this extrasteam flow. A reasonable downstream boundary
condition for the steam line could thus beprovided.
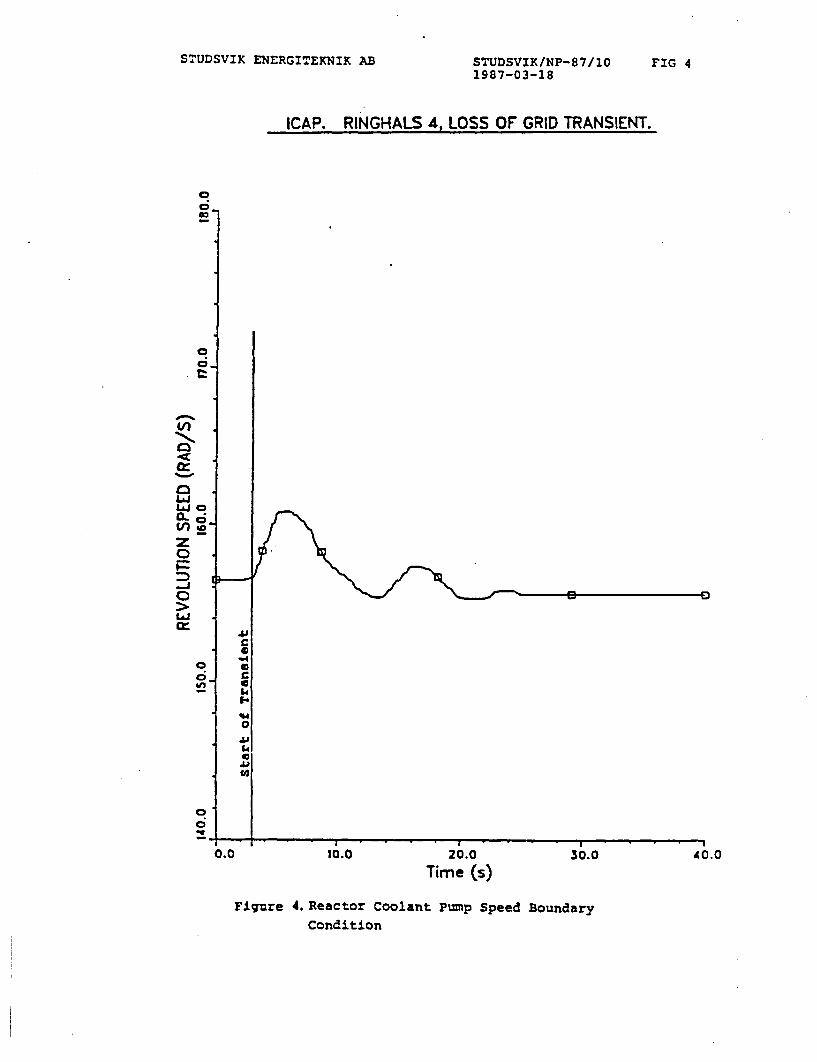
The pump speed as a function of time is given inFigure 4. This boundary condition was taken from
the recording in the plant. By comparison withthe measured data of the primary massflow it was
realized that the recorded pump speed datainherently contained a time delay of approxi-mately 0.95 s which has been accounted for inFigure 4. The oscillatory behaviour of the pump
speed was caused by the plant internal elec-trical grid frequency control that required some
time to stabilize.
The feedwater flow boundary conditions werecontrolled by the steam flow and steam generator
NPIII M-LK

STUDSVIK ENERGITEKNIK AB STUDSV1X/NP-87/10 211987-03-18
level and are given in Figure 5. The feedwatertemperature is given in Figure 6. The rapidsecondary pressure rise caused void collapse andan apparent low level which at first increased
the feedwater flow. Thereafter, the feedwaterflow decreased due to decreased steam flow. Thefeedwater boundary conditions were provided by
the two fill-components 741 and 744 by means of
trip controlled tables.
In order to use the reactivity as a boundarycondition the control rod position, Figure 7,was converted into a trip controlled tablegiving the reactivity as a function of time.
The spray cooling power, Figure 8, was obtainedfrom a recorded pressurizer control signal. In
reality the balance between a small continuousspray flow and control heater power regulatesthe primary pressure. In the simulated transienta primary pressure increase will occur whichimplies an increased spray flow with a lowapproximately constant heater power level. Thus
the control signal will essentially onlyinfluence the spray flow. By assuming a constant
spray flow temperature (i.e the cold leg tempera-ture) along with a completely vaporization ofthe spray in the pressurizer a resulting coolingpower was obtained. Through proper specificationof the pipe-component a trip controlled tablewas set up providing the power to be deposited
directly in the fluid of component 60. In thisway there was no need for modeling and adjustingof the pressurizer control system and the
pressurizer system could be kept on a very basiclevel.
NPII1 M-LK

STUDSVIK ENERGITEKNIK AB STUDSVIK/NP-87/10 221987-03-18
5.2 Results from the simulation
When the turbine valves were closing the steamflow experienced a rapid decrease with a laterrecovery when the steam dump values opened,
Figure 9. The calculated steam flow was obtainedby means of a differential pressure between thesteam generator dome and a point downstream inthe steam line. In order to simulate the regis-tered signal a first order lag function wasapplied on the differential pressure with a timeconstant equal to 0.5 s. From Figure 9 it can beseen that the oscillatory behaviour obtained inthe beginning of the transient was also found inthe calculation but more pronounced althoiugh the
frequency was about correct. A better comparisoncould probably be obtained if a more sophisticatedsignal processing had been simulated.
.The dump valve capacity was prior to the simu-lation adjusted to provide specified flow atspecified pressure. The figure reveals thecorrectness of this capacity at the prolonged
dump condition.
Also the pressure upstream the turbine valves,Figure 10, indicates proper dump valvecharacteristics. The measured oscillationsoccurring after 14 s resulted from the contrclfunction of the turbine governor valves. This
function was not simulated in the calculation.
The calculated steam line pressure signal
registered at a point just downstream the steamgenerator showed about the same increasefollowing the closure of the turbine valves asthe measured data, Figure 11. An assumed first
NPl11 M-LK

STUDSVIX ENERGITEKNIK AB STUDSVIX/NP-87/l0 231987-03-18
order lag function with a 0.5 s time constant
was applied in the model in order to simulate
the pressure signal processing. The maximum
pressure was about 6.9 MPa compared to themeasured value of 6.7 MPa.
The current calculated pressure response wasconsiderably improved compared to a previous
simulation as shown in Figure 11. The maindifferences between these two simulations were:
review and modification of the turbinegovernor valve closure characteristicsand the opening sequence of the steamdump valves.
.inclusion of steam line pipe walls andsteam generator dome internals. Theinternals were modeled in some detailto simulate the proper thermal capacityand time response of structural material.
modeling of the signal processingdevice. In the plant the measured steamline pressure was actually an outputsignal from some devices (amplifiersetc). In order to make at least a crudesimulation of these devices a firstorder lag function was used with a0.5 s time constant.
The second and third items were the majorcontributors to the obtained improvement and
revealed the importance of proper modeling ofthermal capacities and of having some under-
standing concerning the basic signal processingin the plant measurement systems.
The level in the steam generator downcomer
calculated as a differential pressure betweenthe two upper pressure taps in Figure 2 isdepicted in Figure 12. An initial discrepancybetween the measured and calculated values isapparent. When the secondary side pressureincreased a void collapse in the riser occurred
NP111 M-LK
STUDSVIK ENERGITEKNIX AB STUDSVIX/NP-87/10 241987-03-18
causing the downcomer level to decrease due to
an OU-tube manometer effect". The decrease indowncomer level was less pronounced in thecalculation compared to data and the reason forthis discrepancy was believed to be twofold:
the dynamical contribution of thedowncomer flow was not properly ac-counted for in the model. The originfor this dynamical part in the pressuredrop was the flow disturbances causedby the top feedwater flow, which addeda directional momentum to the downcomerflow, and also the area change from theupper to the lower part of the downcomer.This caused three-dimensional floweffects which were ignored in theone-dimensional modeling approach usedin the nodalization.
the registered downcomer level was aprocessed differential pressure signal.The actual signal processing was notfully known but the importance ofhaving this properly modeled is in-dicated in Figure 12 by comparing theunfiltered and filtered signals. Theunfiltered signal was taken as theunaffected differential pressure whilethe filtered signal was obtained byapplying a first order lag functionwith a 0.5 a time constant to theunfiltered signal.
Comparisons between calculated and measured coldand hot leg temperatures are shown in Figure 13.
The cold leg temperature increased quickly dueto the increase of the secondary side pressure
which reduced the heat transfer rate between theprimary and secondary side. Later on also the
hot leg temperature started to increase when the
hotter water arrived. The hot leg temperatureincreased slower though because of the reducedreactor power. Thereafter the temperatures
slowly adjusted to the mew power level.
NPIll M-LK

STUDSVIK ENERGITEKNIK AB STUDSVIX/NP-87/10 251987-03-18
The measured data was delayed because ofmeasurement pipelines, temperature sensors etc.However, in the TRAC simulation the correspond-ing delay algorithm ( a second-order transferfunction) was not properly functioning and thecalculated curves in Figure 13 were taken as the
unaffected process variables. Thus the measuredand calculated curves in Figure 13 are notdirectly comparable.
Figure 14 shows the calculated and measuredreactor coolant flow rate normalized to thesteady state value. The measured flow signal was
the output from an amplifier device which had tobe accounted for. The transfer function was not
known but an assumed first order lag functionwith 0.5 s time constant was suggested for the
model. Both the unaffected mass flow, taken as aTRAC signal variable, and the output from the
assumed transfer function are depicted in Figure14. It is clear that the unaffected signalsimulated the measured curve somewhat betterthan the processed signal which indicated that
the assumed transfer function was not a propermodel of the amplifier device.
Also the pump characteristics will influence themass flow behaviour. TRAC internal pump
homologous curves based on data for the LOFTtest facility pump were used in the simulationwith the rated conditions corresponding to the
operating point of the actual plant pumps. It isvery probable that the actual plant pump and the
LOFT pump are not quite comparable in theirbehaviour when the pump speed is varying. No
comparison between the pump curves was made.However it was believed that differences in pump
curves were one reason for the differencesbetween the calculated and measured mass flows.
NPIll M-LK

STUDSVIK ENERGITEKNIK AB STUDSVIK/NP-87/10 261987-03-18
Another reason could be found in the difficultyof determining a precise time point of the pump
speed table in the simulation boundary condi-tion. The scanning frequency used in the pumpspeed recordings was I Hz which results in anuncertainty of an order that could explainthe differences between calculated and measured
flow, at least during the very first period ofthe transient.
Comparisons between calculated and measured core
nuclear power are depicted in Figure 15. Thepower increased quickly after start of transientbecause of the increased pump speed and primary
flow which lowered the core-average temperature
and improved the neutron moderation. At about2 s into the transient the maximum power wasobtained both in the calculation and in the
measurement and the power started to decrease.
The power reduction occurred due to severalcombined effects. A small contribution came fromthe control rods that just had started to move
into the core. The major contribution originated
from the decrease in the primary coolant flowand the arrival of warmer cold leg water to thecore.
The initial increase in nuclear power wasunderpredicted by about 40 MW in the calculation
(1.4 %). This could most easily be explained ifthe moderator temperature reactivity feedbackcoefficient (an) was chosen too small. Apart
from this and the uncertainty in the measurementthere could be basically two more reasons forthe discrepancy:
NP111 M-LX

STUDSVIK ENERGITEKNIK AB STUDSVIK/NP-87/10 271987-03-18
A neutron point kinetics model was usedto represent the conditions in thecore. Thus the axial redistribution ofthe core coolant temperature when theflow increased was taken into accountthrough weighting functions to arriveat the core coolant average temperaturefor the kinetics. If a one-dimensionalmodel had been used the nodewisecoolant temperature reactivity feedbackwould have resulted in a change in theaxial power distribution and a somewhatdifferent total core power would beexpected.
The increase of the coolant mass flowwhen the reactor coolant pump speedincreased was less pronounced in thesimulation than in the plant due tonon-matching pump curves. This tendencywas also found when comparing thecalculated and measured coolant massflows as outlined above.
From Figure 16 it is revealed that the minimum
margin against trip on negative nuclear rate ofchange was about 2.5 1 in the test whereas the
corresponding margin was about 3.5 % in thesimulation. This curve was essentially the timederivative of the nuclear power with a 2 s time
constant included. Thus the discrepanciesbetween the calculated and measured nuclear
power curves also influenced the rate curves.
The possible underestimate of an suggested abovecould in fact contribute to the discrepanciesboth for the initial positive peak and the
subsequent negative dip of the nuclear ratecurves in Figure 16. It should also be notedthat the test was performed with a core at
beginning-of-cycle. The trip on negative rate of
change is more critical at end-of-cycle con-ditions and the accuracy of the prediction mayhave to be improved for adequate simulation ofsuch conditions.
NP11 M-LK

STUDSVIK ENERGITEKNIK AB PTUDSVIK/NP-87/10 281987-03-18
The pressurizer level trend was due to having asomewhat higher primary side heat up in the
simulation than in the plant as seen forinstance in Figure 13. This caused a larger
liquid inventory expansion resulting in thesomewhat higher level, Figure 17.
Also the pressurizer pressure experienced a
rapid increase when the level started to risebut before the pressurizer spray was activated,Figure 18. The registered pressure was aprocessed signal and in the calculation this was
simulated by means of a first order lag functionwith 0.5 s time constant. It has to be realizedthat' this function was only an unrefined attemptto simulate the signal processing andconsequently has to be included when viewing thediscrepancy between the calculated and measuredsignals.
In the model the spray flow was not explicitlytaken into account but was reformulated into aneffective spray cooling power according toFigure 8. This negative power was added directlyto the fluid (i.e. vapor) in component 60. Thusthe pressure increase up to about 6 s when thecooling power was activated, could be expressedin terms of an adiabatic compression of aninitially saturated steam volume correspondingto the level increase. This also resulted in afew degrees superheated vapor condition at 6 s.
In the plant the ordinary pressurizer controlsystem was influencing the pressurizer responsethroughout the transient. Thus in the stationarypre-test situation a continuous spray flow wasprovided which was balanced by the pressurizer
NPI11 M-LK
STUDSVIK ENERGITEKNIK AB STUDSVIK/NP-87/10 291987-03-18
heater power. During the initial phase of the
pressure increase this spray flow, although
small in magnitude, was certainly enough to keepthe condensation rate on a level that resultedin a more moderate pressure increase.
Thus it could be expected that the ccnditions inthe upper vapor region of the pressurizer were
somewhat dissimilar in the model and the plant
during the test. In the model a superheatedcondition was prevailing with no condensation
during the initial phase of the transient
resulting in a higher pressure increase. In the
actual pressurizer a saturated or somewhat-
superheated vapor condition with a continuouscondensation could be assumed resulting in a
lower pressure increase.
Consequently the comparison between the
calculated and measured pressurizer pressure asfound in Figure 18 could be improved if the
pressurizer system was modeled in more detail.However even if a more realistic modeling
approach had been used, analysis has revealed a
tendency that TRAC-PFI/MOD1 overpredicts thepressure increase of pressurizer insurges (3). A
contributing factor appeared to be too littleinterfacial heat transfer between the vapor andthe subcooled spray flow.
5.3 Estimation of Accuracy and RunStatistics
When making an estimation of the accuracyseveral sources of uncertainty should be takeninto account (4) in order to sort out the codealone accuracy. For the simulation presentedherein the major contributors to the totaluncertainty were judged to be:
NP111 M-LK

STUDSVIX ENERGITEKNIK AB STUDSVIK/NP-87/10 301987-03-18
- vexp, the uncertainty in the measured data
- Cyinput' the variability of the results due touncertainty in initial and boundaryconditions
-Vuser, .the variability of the results due tonodalization, time step selection,modeling of head slabs, etc
However none of these were easily quantified forthis specific transient. When using a testconducted in a real plant one has to limit thedata comparison to those parameters that aremonitored by the plant ordinary monitoringsystem and also realizing that this system isnot intended for providing data of the kindfound in test facility data acquisition systems.Different measured parameters were usually
represented by signals which were output fromsome signal processing devices, thecharacteristics of which were not fully known.
These devices of course had some influences onthe signal response (time delays) whichconsequently could not be completely accountedfor. Also the data obtained for each of thethree loops had to be combined to provide single
loop representative values, a procedure thatadded to the uncertainty of the data. It wasalso realized that in some cases the datascanning frequency was fairly moderate (up to 1Hz) resulting in time resolution difficulties.All these were embedded in cexp thus making itdiffucult to estimate.
Also Ginput and auser were found difficult toquantify. The initial conditions were taken fromthe stationary pre-test recordings after makingthe averaging to provide data for a single loop.
NP111 M-LK

STUDSVIK ENERGITEKNIK AB STUDSVIK/NP-87/10 311987-03-18
In this averaging process the small imbalancesbetween the loops were smoothed out and alsosmall adjustments of some parameters had to be
done in order to fulfill the TRAC heat balance.Unfortunately the pre-test plant heat balancewas not fully known and a more precise evalua-
tion of that condition could not be performed.
The boundary conditions were taken from somerecorded signals and thus inherently contained
the sources of uncertainty mentioned above tofind out the influences of the boundary condi-
tions on the result a sensitivity study wouldhave been required which is very involved whenusing a complex plant model. No such study was
for that reason performed and the same was
argued for the nodalization study when estimat-
ing auser* However a combined effect of includ-ing steam generator secondary side internals, a
simple signal processing simulation and somewhatmodified turbine- and steam dump valve area
boundary conditions on the steam line pressure
can be found in Figure 11.
The curve represented by the previous calcula-tion shows the result without any internals and
signal processing whereas these were included inthe current calculation along with small correc-
tions of the valve area versus time characteris-
tics. This resulted in a decrease of the peakpressure with about 0.2 MPa and a more closecomparison with the measured data.
NP1l1 M-LK

STUDSVIK ENERGITEKNIK AB STUDSVIK/NP-87/10 321987-03-18
Only a crude estimate of the total uncertaintywas made by viewing measured and calculatedsignals in the diagrams, Table 2. Thus it couldbe expected that the code alone accuracy shouldbe somewhat better than the values given in theTable.Parameter Uncertainty" (M
Core power 3.0Primary mass flow 3.0Pressurizer pressure 5.0Pressurizer level 1.0
Steam flow 8.0Steam line pressure 2.0Steam generator level 10.0
Absolute value of difference betweencalculated and measured value relatedto measured value
Table 2. Estimated uncertainty of someparameters
During the simulation the time step size waslimited by means of program input. This was donein order minimize the time delay (one time step)between fulfillment of trip conditions and theresulting actions (opening of valves etc).During the first period of the transient(0-10 s) where the severity was somewhat
pronounced a maximum time step size of 0.05 swas allowed while during the rest of transient
0.1 s was specified. For the 40 s transient thisresulted in 550 time steps and 1813 CPU-secondsor about 3.3 CPU-seconds per time step.
NP111 M-LK

STUDSVIK ENERGITEKNIK AB STUDSVIK/NP-87/10 331987-03-18
6 CONCLUSIONS
From the result of an analysis of a loss of grid
transient test at full power conducted at
Ringhals 4 PWR it is clear that version 12.4 of
TRAC-PFI/MOD1 is capable of performing a favour-
able simulation. When using test results obtainedin a real plant it is important to realize that
the registered data often are not direct measuresof different process variables but the outputfrom some signal processing devices. Thus these
devices also had to be modeled in a simulation
in order to make a true data comparison. For the
present analysis a detailed performance of thesedevices was not known and a simple first order
lag function with an assumed time constant wasused in most cases.
Despite these shortcomings the outcome of
comparisons between calculated re~sults and testdata was quite encouraging although the results
could even be improved if a more sophisticated
modeling had been used to simulate the signalprocessing. On the average, the calculated steam
flow was within about 8 %, the calculated steam
line pressure within 2 % and the calculatedsteam generator downcomer level response withinabout 10 % of measured values. On the primary
side the calculated mass flow was within about3 %, the calculated core power within 3 %, thecalculated pressurizer level within 1 % and the
calculated pressurizer pressure within about 5 %of measured values.
The analysis also revealed the importance of
accurate modeling of valve characteristics andoperating sequences as well as the modeling of
structual material in the steam generators. Itwas also realized that a more sophisticated
NP1I1 M-LK

STUDSVIK ENERGITEKNIX AB STUDSVIK/NP-87/10 341987-03-18
modeling of the pressurizer control system
including spray and heaters would probably haveimproved the pressurizer pressure responseduring the insurge period. In the present
analysis an excess pressure increase was ob-
tained during the initial phase of the transientwhich was believed to be less pronounced if a
correct pressurizer control system had beenmodeled. As a result the vapor in the pressu-
rizer top now was superheated. The degree ofsuperheating would have been quite less if a
continuous subcooled spray had been simulated
during the compression phase resulting in a
condensation process throughout the transient.
NPi1l M-LK

STUDSVIX ENERGITEKNIK AB
2
STUDSVIK/NP-87/101987-03-18
35
REFERENCES
TRAC-PFI/MODIAn Advanced Best-Estimate ComputerProgram for Pressurized Water ReactorThermal-Hydraulic AnalysisNUREG/CR-3858July 1986
V Ransom et alRELAP5/MOD2 Code ManualNUREG/CR-4312August 1985
3
4
A C PetersonTRAC-PFl/MOD1 IndependentNEPTUNUS Pressurizer TestNUREG/CR-3919SAND84-1534
.December 1984
Assessment:Y05
D E Bessette. CoordinatorGuideline and Procedures for theInternational Thermal-Hydraulic CodeAssessment and Applications ProgramUSNRCApril 1986
NP111 M-LK


763-
761
52 51 53
270
tn'-I
22 CA270 0 C
$.-I 1co
0
6,
k
716
Figure 1. TRAC-PFI/MODI Model of Ringhals 4

STUDSVIK ENERGITEKNIK AB -r..,_ a NP-87/10 FIG 2
pO- C"F3
Figure 2. Steam Generator Nodalization

•q• M99•Q ..........5TuDSvIK ENERGITEKNIK AB STUDSVIK/NP-87/1O FIG 3
1987-03-18
ICAP. RINGHALS 4, LOSS OF GRID TRANSIENT.
LEGEND= HTVI-AREA
o =HTV2-AREA= SDV1-AREA= SDV2-AREA
I
&L
-J
>0 4JJ
elf
L.. C
0"4 1
I-a
00.0
0.0 10.0 20.0 50.0 40.0
Time (s)
Figure 3. Valve Area Bou'ndary Condition
STUDSVIR ENERGITEKNIK AB STUDSVIK/NP-87/101987-03-18
FIG 4
ICAP. RINGHALS 4, LOSS OF GRID TRANSIENT.
0CD
00~
0
0LaJLaJO0~*
0~
z0F:-40
L~J
00~U,
CC
P--
0J
cca
-i--i
0.0 10.0 20.0
Time (s)30.0 40.0
Figure 4. Reactor Coolant Pump Speed BoundaryCondition

STUDSVIK ENERGITEKNIK AB STUDSVIX/NP-87/101987-03-16
FIG 5
ICAP. RINGHALS 4, LOSS OF GRID TRANSIENT.
0c;
4-
CCC-C
Ca
e
0-J
C,,U,
CCC-In
LEGEND= FEED WATER TOP
o = FEED WATER BOTTOM
.4CEaCUI
U.
C
.4.II
.1.(V
C
I
0.0 10.0 20.0Time (s)
30.0 A0.0
Figure S. Steam Generator Feed Water Flow BoundaryCondition

STUDSVIK ENERGITEMjIX AB STUDSVIK/NP-87/101987-03-18
FIG 6
ICAP. RINGHALS 4, LOSS OF GRID TRANSIENT.
00
In
on
0
0
I---
0.
<0
L3 a s -
CS
SCSk
I..'06..
S
U)
0D.. + - I
I0. 0 10.0 20.0 30.0
Time (s)
Figure 6. Steam Generator Feed Water TemperatureBoundary Condition
040.0

STUDSVIK ENERGITEKNIK AB STUDSVIK/NP-87/1D FIG 71987-03-18
ICAP. RINGHALS 4, LOSS OF GRID TRANSIENT.
c;
6(N
0
0
"'.
EN
zc
go6
00Co
I . . m0..0 1002. 004.
Time (s)
Figure 7. Control Rod Position

STUDSVIK ENERGITEKNIK AB STUDSVIK/NP-87/101§87-03-18FIG 8
ICAP. RINGHALS 4, LOSS OF GRID TRANSIENT.
LaJ
0a.
IL
IAL,
i,
o.OD
0U,
0
Time (s)
Figure 8. Pressurizer Spray Power Boundary Condition

STtJDSVIK MNERGITEKNIK AB STUDSVIK/NP-87/101987-03-18
FIG 9
ICAP. RINGHALS 4, LOSS OF GRID TRANSIENT.
LEGEND0= FROM DPo = S-G DOME OUTLET MEAS.
000
0
C
'I)N0
0
(A(A4
m
000'
C
e0
R00
0.0
Time (s)
Figure 9. Steam Line Mass Flow

STUDSVIK ENERGITEKNIK AB STUDSVIK/NP-87/101987-03-18
ICAP. RINGHALS 4, LOSS OF GRID TRANSIENT.
FIG 10
LEGENDo = UPSTREAM HIVIo = UPSTREAM HTV2A = UPSTREAM HTV MEAS.
&
C
'I,~o.
Uj0k:
10.0 20.0 30.0 40.0
Time (s)
Figure 10. Steam Line Pressure Upstream Turbine
Governor Valves

STUDSVIK ENIRGITEKNIK AB STUDSVIX/NP-87/101987-03-18
ICAP. RINGHALS 4, LOSS OF GRID TRANSIENT.
FIG 21
LEGENDo = STEAM LINE PREVIOUS CALC.
C? o = STEAM LINE CURRENT CALC.'ID & = STEAM LINE MEAS.
a
to,
0X
Wa
CLJ
p
10.0 20.0
Time (s)Figure 11. Steam Line Pressure Downstream the
Steam Generator

STUDSVIX ENERGITEKNIK AB STUDSVIK/NP-87/101987-03-18
FIG 12
ICAP. RINGHALS 4, LOSS OF GRID TRANSIENT.
LEGENDo = S-G DP NARROW RANGE, UN-FILTEREDo = S-G DP NARROW RANGE, FILTEREDa = S-G DP NARROW RANGE MEAS.
L&J
L~j-j
00.0
00
0.0 10.0 20.0
Time (s)30.0 40.0
Figure 12. Steam Generator Downcomer Level

STUDSVIR M ~RGITERNIK AB STuDSVIK/NP-87/101987-03-18 FIG 13
ICAP. RINGHALS 4, LOSS OF GRID TRANSIENT.
0
40
LEGENDHOT LEG
o = COLD LEGA = HOT LEG MEAS.+ = COLD LEG MEAS.
C
fC5
40.030.020.0Time (s)
Figure 13. H~ot and Cold Leg Temperatur~e

STUDSVIK ENERGITEKNIK AB STUDSVIK/NP-87/101987-03-18
FIG 14
ICAP. RINGHALS 4, LOSS OF GRID TRANSIENT.
00~IN
LEGEND= RC-LOOP TOT. UN-FILTERED
o = RC-LOOP TOT. FILTEREDa = RC-LOOP TOT. MEAS.
00
Li,Li,
00
06
L
64
ta
0.0 10.0
Time (s)
I
30.0 40.0
Figure 14. Primary Side Mass Flow

STUDSVIK ENERGITEKNIK AB STUDSVIK/NP-87/10 FIG 251987-03-18
ICAP. RINGHALS 4, LOSS OF GRID TRANSIENT.
LEGENDR c) = REACTOR COREo o = REACTOR CORE MEAS.a
ain
C) , in
,,
C4
C
ev00
r-
0
I-1
0
O 0
1; I.o 20.0 30.0 40.0.'rime (~s)
Figure 15. Reactor Core Power

STUDSVIK.ENERGITEKNIK AB STUDSVIK/NP-87/101987-03-18
FIG 16
ICAP. RINGHALS 4, LOSS OF GRID TRANSIENT.
LEGENDc,=RATEo = RATE MEAS.C
21
on
Cý
IN.
Li
za
Set Point
20.0 40.0
Time (s)Figure 16. Reactor Core Nuclear Rate

STUDSVIK ENERGITEKNIK AB. STUDSVIK/NP-a7/1o19B7-03-1B
FIG 17
ICAP. RINGHALS 4, LOSS OF GRID TRANSIENT.
C0-
00
LEGENDLEVELLEVEL MEAS.
C;_-
C-_Lin
a~.
61~a
4J
S
SS.'I-
0.4j14S
.4'(I)
0.0 10.0 20.0
Time (s)
Figure 17. Pressurizer Level
30.0040.0

STUDSVIX flNERGITEKNIK AB STUDSVIK/NP-87/101987-03-18
FIG 18
ICAP. RINGHALS 4, LOSS OF GRID TRANSIENT.
LEGENDo = PRESSUREo = PRESSURE MEAS.0D
C
a-
LaiD.
U,C,)
a-LI
nv,.
U,LI
0
0
0.0 10.0 40.0
Time (s)
Figure 18. Pressurizer Pressure
hA0C FORM 23. U 2 NhUCLEAR AIQULATONV COOMMI111041 [IMn J.O.V , o, r 4 O12 -4'%AC-1,07 NUREG/I AoO017"
M 1,0'2 BIBLIOGRAPHIC DATA SHEET20 1 1 O 0STUDSVIK/NP-87/10
Si TINSRUTIONS 0% 1-11 0IIv I
f tITLt 4f.NL•It . iJ LIAVI OLANI
Assessment of TRAC-PF1/MOD1 Against a Loss-of-GridTransient in Ringhals 4 Power Plant __DATE______ _________' __
4 DAtE NtO*n •. B "E
MONT. I 'EARI A•Tl.ONISi
Auders Sjoberg, Jan Almberger, Oddbjorn Sandervag %AE,,REPOR,,toMO~N T. 'E ¢AR
July 1989? P|INPORUINO OGA..1Z&tO'/v .MI ANO/,t mt.I. AOOMIS$S/t;.• •'J C,8 PROJECTITASKWOAK UNIt NINJ&.IA
Swedish Nuclear Power Inspectorate ,-9N GRANT kv-of
P.O. Box 27106S-102 52 Stockholm, Sweden
10 SPONSORING ORGANIZATION NAME AND MAILING AOOA9SS II•I•.•. #1t II. TIPS OF AIFO•T
Office of Nuclear Regulatory Research Technical ReportU.S. Nuclear Regualtory Commission
Washington, DC 20555 8 ,SoOVERED .. ..
I SUPP"LIMINTANY NOTES
s• AII•TIqA•T i•we•, 4vm•;
I A loss of grid transient in a three loop Westinghouse PWR has been simulatedwith the frozen version of TRAC-PFI/MODI computer code. The results revealthe capability of the code to qualitatively predict the different pertinentphenomena and the data comparison was quite encouraging. Accurate predictionsof the system response required careful determination of the boundaryconditions simulating the turbine governor valves and steam dump valvesbehavior. An explicit modeling of the steam generator internals was alsofound to be important for the results. It was also revealed that thepressurizer system including spray and heaters and their operation shouldbe modeled in some detail for proper response.
-4 OCI.tM&Nt .N•lSS A IA"•OROS'OI Co..II •OM S VA VASA.L.,t
TRAC-PFI/M0D1, Loss-of-Grid, ICAP Program STTE"N
Unl imitedISf ICUR•IT •'CLASS. O.CATIO.
. oN,,. D .,To '( aY assi fied
UnclassifiedI? NuMSetA 0F 'AGES