nureg/cp-0152, vol. 4 - nrc
TRANSCRIPT

Session 2(c)
OM Code Issues
Session Chair
Joseph Colaccino U.S. Nuclear Regulatory Commission

Role of Nuclear Industry Check Valve Group in the Development and Implementation
of ASME OM Code Requirements for Check Valves Tony Maanavi, Exelon Nuclear Corporation, Byron Nuclear Station Robert Perry, North Atlantic Services Company, Seabrook Station
Robert Dixon, Duke Power, McGuire Nuclear Station Domingo Cruz, Constellations Energy, Nine Mile Point
Ken Hart, Pennsylvania Power & Light Co., Susquehanna Steam Electric Station Mike Robinson, K&M Consulting, Inc.
Abstract
Since 1988, the Nuclear Industry Check Valve Group (NIC) has supported the industry in regard to check valve issues. NIC, through the years, has helped the Industry to progress to new levels of attention in the area of check valves that have made it possible for utilities to be able to increase their reliability. NIC accomplishments include Phase 1-3 Test programs which verified the capabilities of commercially available non-intrusive technologies, supporting the revision of the Check Valve Applications Guide that was published by Electric Power Research Institute (EPRI), development of the Check Valve Maintenance Guide and the non-intrusive application guide, developing and maintaining the "Check Valve Performance Database," and supporting the activities of the American Society of Mechanical Engineers Operation and Maintenance (ASME OM) Check Valve Working Group and many others.
Most of these activities have supported changes made by ASME ISTC 1995 Edition through summer 1996, Appendix II which provides an option to implement a check valve condition-monitoring program. In
1999 the NRC included these changes in their rulemaking. NIC is continuing in its tradition of support by taking on new activities which will help utilities in the transition to these new codes. Presently NIC activities include development of valve templates that can be used in determining attributes that cause check valve failures, continued development and maintenance of the Check Valve Performance Database, conducting new programs to quantify testing method's / technologies' capability to trend parameters that would be helpful in detecting various types of valve degradations, and as always NIC will continue to be a forum for member nuclear utility representatives formed for the exchange of technical information relating to the application, testing, and maintenance of check valves among the utilities and in coordination with other organizations within the nuclear industry for increased reliability and safety.
Background
In 1986 the Institute of Nuclear Power Operations (INPO) issued a Significant Operating Event Report SOER 86-03, "Check Valve Failures or Degradations." This Report was sent because of concerns that there were
NUREG/CP-0152, Vol. 42C-1

NRC/ASME Symposium on Valve and Pump Testing
an increasing number of check valve failures starting to occur due to aging, misapplication, and inadequate maintenance.
In response to the INPO 86-03 report, all utilities developed non-code check valve programs that were outside ASME code scope to increase the reliability of their valves. These programs were developed to verify that check valves in systems that were important to the operation and safe shutdown of the plant were designed for their specific application, that there was no experience of repetitive failures, enhance methods for monitoring valve performance: upgrade procedures to ensure proper detection of valve performance, and to apply new predictive monitoring techniques / technologies which would trend valve performance. Most utilities continue to use these programs to monitor their check valves.
In developing these programs, a need for testing technologies to determine check valve condition became apparent. At the time, several vendors had developed new technologies to verify the condition and operability of check valves. However, as an industry, utilities were skeptical and needed to have validation of these technologies. Several utilities investigated validating these technologies in-house. During this process, Baltimore Gas & Electric (now Constellations Energy), Philadelphia Electric (now Exelon) and Gulf States Utilities (now Entergy) decided to meet and determine if there was a possible collaboration that would be of benefit to all three utilities.
As a product of these initial discussions twenty-one utilities met at the EPRI Monitoring & Diagnostic Center near Philadelphia in late 1988. This was the first indication that the industry could work together to resolve check valve concerns. At
the meeting the utilities present indicated that there were many issues that could be resolved by working together. Five of the utilities were elected to develop a charter for the formation of a utility users group that would work independently of manufacturers for resolving check valve issues and increasing the reliability of check valves. The issues that needed to be resolved included developing effective condition based check valve monitoring programs, resolving performance issues, developing guidance for check valve program maintenance activities, and determine the capabilities and limitations of commercially available technologies for determining check valve performance.
Discussion
On April 19, 1989, in Baltimore Maryland the Nuclear Industry Check Valve Group was formed. The purpose of the Nuclear Industry Check Valve Group (NIC) was, and still is, to provide a forum for member nuclear utility representatives to exchange technical information relating to the application, testing, and maintenance of check valves, and coordinate with other organizations within the nuclear industry to increase reliability and safety. The NIC charter provides for utilities only membership. However, other organizations are encouraged to participate.
NIC then developed objectives that remain a focus of the group even today. Those objectives are the following:
" To provide a forum for the joint discussion and resolution of generic check valve issues through communication between members of the group and other organizations,
" To provide a mechanism for making recommendations on generic check valve issues,
NUREG/CP-0152, Vol. 4 2C-2

NRC/ASME Symposium on Valve and Pump Testing
" To provide an effective vehicle for communication on check valve interests to INPO, NUCLEAR MANAGEMENT AND RESOURCE COUNCIL (NUMARC), ASME, and other industry organizations, and
" To maintain plant safety and availability through recommendation of programs which address generic issues.
To achieve the goals four working groups were formed:
" Check Valve Applications and Maintenance Working Group (CAMP) (now known as the Check Valve Performance Working Group}.
"* Technical Information Committee (TIC) {now the NIC Web Working Group}
"* Non-Intrusive Examination of Check Valve Working Group (NEC)
" Code Compliance Working Group (CCC) {now knowA as the Liaison Working Group to the ASME Working Group on Check Valves}
During the past thirteen years the committees grew and evolved as needs and technologies changed. An overview of each of the committee's accomplishments is included here.
Check Valve Performance Working
Group
Accomplishments since 1989 include:
The Performance Working Group supported the development of NRC NUREG/CR-5944, ORNL-6734, "A Characterization of Check Valve Degradation and Failure Experience in the Nuclear Power Industry," Volumes 1 & 2, and Evaluations of Component Ageing Effects with Applications to Check Valves. This work
concluded that the magnitude of concerns thought to exist in INPO SOER 86-03 was not as extensive as originally thought. It found that in general check valve condition though needing improvemrfent was not as serious an issue as previously portrayed.
In response to these activities, the working group developed a comprehensive Check Valve Performance Database which includes check valve information from 1984 and is current through the previous year. The database is updated on an annual basis. Utilities can use this database to determine the past performance of check valves in the industry and evaluate it against their own experience. Every check valve record that was included in the old INPO Nuclear Plant Reliability Data System (NPRDS) Database was retrieved, reviewed, and updated before being included in the NIC Performance Database.
Many of the records that had been coded as failures were determined to be valves which had degraded conditions but did not fail to perform their function. These included Local Leak Rate Test (LLRT) valves that had been determined to be leaking near their administrative limits and not their failure limits. Based on our review, it was concluded that that LLRT Programs were working well. Other "reported" failures were preventative maintenance activities and not corrective maintenance. Much of the concern that INPO based the SOER 86-03 on, was placed on the failure rate that had been derived from this old NPRDS data.
In addition, the working group also developed specific templates (a guide for determining valve performance and application) which can be used based on manufacture / type to help check valve engineers in best determining valve failure components and rates. These
NUREG/CP-0 152, Vol. 42C-3

NRC/ASME Symposium on Valve and Pump Testing
templates and the NIC Performance Database are available on the NIC website (www.check-valve.org'.
Past accomplishments of the Performance Working Group are:
"Supporting EPRI on revising the "Applications Guide for Check Valves," EPRI NP-5479. Though the EPRI applications guide was good, utilities found that much of it was based on limited information. As utilities developed Check Valve Programs they found that the guide needed updating. With the support of NIC EPRI revised the guide.
"* Developing an industry response to ASME Section XI / Generic Letter 89-04 issue in relationship to check valves. There was concern that each utility would respond to the issues differently. NIC decided that the best response would be one which would be accepted industry wide.
" Developing the Nuclear Maintenance Applications Center (NMAC) "Check Valve Maintenance Guide," TR- 100857. Many utilities were developing programs which included maintenance activities. NIC in response to this issue laid the groundwork, information, and development which went into this guide.
" Publishing the NIC "Check Valve Analysis Guide" which is available to all NIC members. Concerns as to the parameters and the capabilities of non-intrusive technologies prompted NIC to develop this guide. This guide provides the basis for personnel who evaluate non-intrusive data to make their conclusions. In addition this guide provides guidance to the level of qualifications a person needs.
" Publishing the Evaluation of Nonintrusive
Diagnostic Technologies for Check Valves Check (Phase 1, 2 & 3). This effort was the largest endeavor taken on by NIC. NIC conducted an experimental research program to investigate the ability of existing non-intrusive techniques to study the condition of check valves. The study included evaluating three technologies: acoustics, magnetics, & ultrasonics.
The Performance Working Group still has many challenges ahead of it. Presently they continue to update the Check Valve Performance Database, develop new valve templates, support outside activities such as the EPRI "Preventive Maintenance Program Basis: Check Valves," and support ASME needs.
Non-Intrusive Examination of Check Valves Working Group.
The NEC working group, which was the basis for NIC's development, is responsible for making sure that the technologies that are employed for determining check valve conditions do work. From 1989 through 1991 this group performed a test program that assessed the abilities of technologies to determine the condition and operability of check valves.
The study included evaluating three technologies, testing eleven check valves in six different sizes, three types and made of two different materials. The three technologies were acoustics, ultrasonics and magnetics. Each technology was evaluated to see if it could determine the position and movement of the disc and detect numerous valve degradations. Tests were made at various flow rates and flow conditions including uniform approach flow, artificially induced turbulence, cavitation, forward flow and seat leakage. Tests were conducted with a new
NUREG/CP-0152, Vol. 4 2C-4

NRC/ASME Symposium on Valve and Pump Testing
valve (undegraded condition) to provide baseline data for subsequent degradation tests. With the baseline data for reference, the three technologies in general were able to distinguish beyond a new valve and a valve with degraded internals. They could identify the source of the degradation and in some cases were able to distinguish 15 and 30 percent degradations. They also could determine if the disc was missing, stuck or operating normally throughout its entire stroke. The ultrasonic and magnetic techniques were able to determine mean disc position and identify magnitude and frequency of disc flutter. A secondary objective of the study was to collect data on the minimum velocity required to fully open (Vo) and firmly backseat (Vr) each check valve tested. These research activities were completed in 1993 and are available through NIC in three separate reports (Phase 1, 2 & 3).
In the first phase, the evaluation of acoustics, magnetics, and ultrasonics to detect if a valve has gone full open, closed, or if a part is wearing in a valve in a liquid system, was performed. The conclusion was that these technologies could determine specific parameters if a baseline was established.
NEC continued to probe the abilities of non-intrusives to detect check valve conditions. In a second phase, Phase 1 testing was repeated this time using air as the medium. Again the conclusions showed similar results, with some limitations. UT could not be evaluated since it will not work where air or gas is the medium.
A third phase was performed this time using steam as the medium. This was to detect how well the equipment worked under temperature. Again the conclusions were similar with some limitations. The first phase took NIC less than 2 years from start to finish. Phase two was
completed in one year. Phase three required over two years to complete because of the complexity of taking data on high temperature mediums and the collection of actual plant operating system data.
Now that the abilities of most of three technologies had been characterized, the issue of guidance arose. This working group then set out to develop a guide to help support check valve engineers with their knowledge base. Over several more years the NEC working committee developed the "Check Valve Non-intrusive Analysis Guide," NIC-699. This guide is available by CD or on the NIC web site.
NEC in June of 2001 developed a unified response to NRC Information Notice 2000-21 (Reference Figure 1). Per the NIC Charter one of the objectives of NIC is "to provide a forum for the joint discussions and resolutions of generic check valve issues through communications between members." This issue was determined to be of significance to the entire industry; therefore, the NEC committee was given the task to develop an industry response. This response was sent to all check valve engineers and the site VP / managers. This again showed that the industry could jointly answer specific issues in a unified way.
ASME Working Group on Check Valves
This group was formed in order to support changes to the ASME OM Code in relationship to check valve testing. Earlier versions of the ASME Section XI and OM Code required that the owner verify the safety function of the valve. This meant that, if the valve only had a safety function to allow water to flow through it, the only test required was a forward flow test. The Working Group
NUREG/CP-0152, Vol. 42C-5

NRC/ASME Symposium on Valve and Pump Testing
on Check Valve along with NIC believed this was not the original intent of the Code. Code activities were going through the motions rather then assuring that, if called upon, the valve would perform its function. Not all testing was in question, but much was. If you put full flow through a valve (required by Code of record for many sites) to prove it would operate if called upon, what did it tell you? In many instances it would tell you that in a piece of pipe there was no obstruction. Was this then the intent? It did not tell you that the obturator was present and that it went from the closed to open direction. No, the intent was to prove that the obturator in the valve goes from a closed position to an open position. One of the first changes needed to the Code was to make sure that the intent of the testing was clarified. The 1995 Code subsection ISTC-5221 states that "Each check valve exercise test shall include open and closed test." NIC played a supporting role in defining this clarification in changes to the ASME OM ISTC Code 1995 through summer 1996 addenda, making bi-directional testing necessary.
Over the next 11 years the Nuclear Industry Check Valve Group and the ASME continued working side by side to resolve over 60 issues (i.e., test frequency, non-intrusive testing, records, etc.) that were related to check valves. One change to the ASME OM Code, Appendix II, "Check Valve Condition Monitoring Program," takes most of these issues and the lessons learned from the INPO 86-03 programs and allows utilities to develop programs that will provide a higher rate of reliability. What does condition monitoring involve?
/ A Written Program must exist and has to identify all valves.
" The program will define the testing and
methods, which should be performed to determine the operational requirements.
" It will verify that the testing methodology demonstrates the required function of the valves.
- Maintenance and failure review have been conducted and that the results of this review have been documented.
V The valve performance and failures are being documented and that this information is being used to determine performance/predictive testing frequency.
, Design Review was conducted and that the results of this review have been effectively incorporated into the program.
, Look at the present test methods to determine if they provide validity as to whether the valve is operating properly and as to its condition.
/ Evaluate the predictive maintenance practices (i.e., Non-Intrusive Examination, Disassembly and conventional testing methods)
/ Review the past failures and verify that they are getting the needed attention.
/ Define all the discipline responsibilities and have their concurrence.
/ A feedback mechanism is in place, which will make sure trends, and probable failures are fed back through the program.
Condition Monitoring allows a utility to choose the type of testing, method, and periodicity (up to the 10 year maximum placed by the NRC) based on its performance and failure mechanism. The test which is chosen to monitor each valve should be qualified for determining the condition of the valve. In most cases, this is done by
NUREG/CP-0152, Vol. 4 2C-6

NRC/ASME Symposium on Valve and Pump Testing
trending the data. Testing frequency should be determined based on operating time and probable degradation which would first cause the valve to need corrective maintenance. The overall method allows utilities to perform the right testing using the method most reliable for detecting the valve degradation before it fails.
The NRC has put three additional requirements on a utility that elects Condition Monitoring. First, you must put all your IST valves in the program. You are allowed to remove any valve from the program at a later date; however if you do, you must invoke the latest code that has been adopted by the NRC rulemaking. The second condition is you must bi-directional test all the valves. Even if you don't elect to go to Condition Monitoring you will, at your next ten year IST update, have to start bi-directional testing your check valves because it is a requirement in the 1995 code of record. Finally, the third condition is the ten year maximum requirement between testing. NIC still feels this is unreasonable for a few valves who's test intervals could go longer (ones that have good history and are never in service, i.e., containment spray valves).
NIC supports Condition Monitoring by providing workshops to help utilities with the transition from their present code to Condition Monitoring.
NIC overall has supported all the ASME check valve changes and activities. The NIC and ASME relationship is very strong. For the past 8 years NIC has coincided all of its meetings with the ASME Working Group on Check Valve Meetings. NIC plans to continue working with the ASME for the foreseeable future.
NIC Web Page Working Group
The NIC Web Page Working Group takes care of maintaining and archiving all the NIC and Check Valve related material. Prior to the web page all information was stored in a Library. In 1997 NIC started a web page which today contains check valve related documents including plant specific procedures, vendor information, the NIC performance database, past meeting minutes, NIC documents, and links to other check valve related sites. All of these items are downloadable by members. Some of the information is controlled by password for members only; however, much of the information is available to everyone.
With new information always coming out and an ever-changing industry there is still plenty for this group to do. To find out more about NIC and its activities, publications, presentations, meetings, minutes, or other check valve publications, visit the NIC web page at: www.checkvalve.org.
Conclusions
What lies ahead for NIC
"* Continue with the Review of EPRI "Preventive Maintenance Program Basis: Check Valves"
" Initiate efforts to review all check valve issues reported to INPO, NRC, etc., and attempt to initiate other means to search out and capture check valve performance.
" Continue the development of the following new templates Anchor Darling Tilting Disk S&K Swing Generic Nozzle Vogt Piston checks Rockwell Edwards Tilting Disk Edwards Piston checks Borg Warner Piston checks
NUREG/CP-0152, Vol. 42C-7

NRC/ASME Symposium on Valve and Pump Testing
"* Maintain the Check Valve Performance Database.
"* Continue to maintain the Check Valve Web Site.
" Continue the effort to increase the
reliability of check valves by performing a Check Valve Performance Trending Initiative. A recommended practice by the NRC and INPO is to trend check valve conditions, so that maintenance is performed prior to failure. In addition, based on recent regulatory activity (NRC issued IN 2000-21, Detached Check Valve Disc Not Detected by Use of Acoustic and Magnetic Non-intrusive Test Techniques; INPO re-emphasized SOER 86-03, Check Valve Failures or Degradation) there is increased scrutiny on check valve trending.
" Due to the lack of knowledge as to which parameters can be trended, most utilities only trend check valve failures. Many check valve monitoring techniques and technologies, are currently employed, but the resultant parameters that can be trended have not been identified. NIC is proposing a test initiative to address this industry need, which is scheduled to start in the summer of 2002 and expected to conclude in the summer of 2003. The test initiative will provide the basis for the parameters that can be trended.
" Continue to support ASME Code change activities.
" Continue the exchange of information among sites and utilities.
" And most importantly, NIC will continue as an industry to work together on increasing the reliability of check valves.
The Nuclear Industry Check Valve group because of its past efforts has helped the industry in increasing the reliability of check valves. Because of this, NIC is one of the most recognized organizations with regard to check valve issues and solutions. This includes the ASME and NRC. The NRC acknowledged and recognized NIC in December 1989 (Figure 2).
NIC continues to be the leader for member utility representatives for the exchange of technical information relating to the application, testing and maintenance of check valves among the utilities and in coordination with other organizations.
References:
1. ASME OMa-1996 Code, 10 CFR 50.55a rule amendment (1999).
2. ASME ISTC OM 1995 thrugh 1996 OMa.
3. NIC "Check Valve Nonintrusive Analysis Guide," July 1999.
4. NUREG/ CR-5944, ORNL-6734/V2, Volumes 1 & 2, "A Characterization of Check Valve Degradation and Failure Experience in the Nuclear Power Industry," September 1993 & July 1995.
5. NUREG/CR-6508, ORNL-6909, "Component Unavailability Versus Inservice Test (ISR) Interval Evaluations of Component Aging Effects with Applications to Check Valves," July 1997.
6. EPRI TR-100857, "Check Valve Maintenance Guide," August 1995.
7. NIC-01, "Evaluation of Nonintrusive Diagnostic Technologies for Check Valves," February 1991.
NUREG/CP-0152, Vol. 4 2C-8

NRC/ASME Symposium on Valve and Pump Testing
8. NIC-02-ALR, "Evaluation of Nonintrusive Diagnostic Technologies for Check Valves," February 1992.
9. NIC-03-Steam, "Evaluation of Nonintrusive Diagnostic Technologies for Check Valves" March 1996.
10. NIC 693, EPRI NP-5479R1, "Applications Guide for Check Valves in Nuclear Power Plants," Rev 1.
11. The Nuclear Industry Check Valve Group Charter, Rev. 1, September 1990.
NUREG/CP-0152, Vol. 42C-9

NRC/ASME Symposium on Valve and Pump Testing
Nuclear Industry Check Valve Group
June 7, 2001
Site VP
SUBJECT: The Nuclear Industry Check Valve Group (NIC) Response to: NRC INFORMATION NOTICE 2000-21
On December 15, 2000, the Nuclear Regulatory Commission (NRC) issued the subject Information Notice to Licensees. Although the Notice did not require response, the issues raised are of sufficient importance that NIC chooses to inform the members of its perspective.
NIC supports the continued use of nonintrusive testing. NIC performed, in the early 1990's, Phase 1, 2, & 3 studies that evaluated technologies that have been successfully and reliably demonstrated to assist in determining check valves operational readiness. Since then the NIC has successfully continued to demonstrate, improve, and refine the applications of these technologies.
NIC has provided various technical documents (Analysis Guide, Phase 1 through 3 reports, Flowtest, etc.) to help owners use and qualify nonintrusive technologies. These reports strongly recommend the use of multiple technologies (in combination) to provide as much information as possible about the check valves operational readiness. When multiple technologies are not possible (or results are not conclusive), then the test should be augmented with other corroborating information. This information may be in the form of indications of proper operation, past disassembly and inspection, etc.
Part of the basis for determining operational readiness is having a baseline test when the valve is known to be operating acceptably. Establishment of a baseline requires supporting information to determine the capability of the valve to perform its intended function(s).
Application of these principles when using nonintrusive testing should help improve the ability of the nuclear industry to demonstrate check valve operational readiness.
Tony Maanavi NIC Chairman Exelon Nuclear Corporation Byron Nuclear Station
CC: NIC Members & Associates Francis Grubelich, US NRC Joseph Colaccino, US NRC
The Nuclear Industry Check Valve Group P.O. Box 4 Crum Lynn, PA 19022
Figure 1 NIC Response to NRC Notice 2000-21
NUREG/CP-0152, Vol. 4 2C-10

NRC/ASME Symposium on Valve and Pump Testing
"o0 UNITED STATES , 01 NUCLEAR REGULATORY COMMISSION
WASHINGTON. D. C. 20555
DEC 1 1989
Mr. Michael T. Robinson NIC Chairperson Calvert Cliffs Nuclear Power Plant Baltimore Gas and Electric Co. Routes 2 and 4 Lusby, Maryland 20657
Dear Mr. Robinson:
SUBJECT: NUCLEAR INDUSTRY CHECK VALVE GROUP
I am writing to you to acknowledge the formation of the Nuclear Industry Check Valve Group (NIC). As I understand, NIC was formed primarily for the exchange of technical information relating to the application, testing, and maintenance of check valves among the utilities and other nuclear industry organizations.
In assuming its role, NIC has initiated several major activities, such as developing application and maintenance guidance, and evaluating nonintrusive test methods. I believe that these activities will assist the industry in improving the performance of check valves and in detecting early signs of check valve degradation. The net result of NIC's efforts should be an increase in the reliability of check valves.
A meeting was held between the NRC staff and representatives of NIC on September 28, 1989. According to my staff, the NIC presentation revealed a sincere effort on the part of the industry to resolve concerns for the performance of check valves in nuclear power plants. I support NIC's efforts and have directed my staff to keep NIC apprised of staff activities so that both the NRC and industry can effectively use its resources to improve check valve performance.
I have designated the Mechanical Engineering Branch in the Division of Engineering Technology as the lead branch for coordinating check valve activities within my office and for monitoring industry activities in this area. If you have any questions or would like to discuss our support of your efforts, please contact L. B. Marsh at (301) 492-0902.
Sincerely,
/mas E. Murley, Directo fice of Nuclear Reactor Regulation
cc: Clive Callaway (NUMARC)
Figure 2 Letter of Acknowledgement from the NRC
NUREG/CP-0152, Vol. 42C-11

Preconditioning of Pumps and Valves
Adele DiBiasio Curtiss-Wright Flow Control Corporation
Contributors: Robert Martel, Jim Lorimer, Sonny Koski, and the ISTA Subgroup
Abstract
The U.S. NRC issued Information Notice 97-16 regarding preconditioning components prior to testing. This notice stressed the importance of obtaining meaningful results during inservice testing in order to determine the degree to which a component has degraded, if any, and to determine the component's ability to perform its intended function when required. This is especially true when applying condition monitoring to inservice testing (IST). To obtain meaningful results, it is important to test the components in the as-found condition and to avoid preconditioning to the extent practicable. The ASME OM Code (the Code) addresses preconditioning and as-found testing only for snubbers and relief valves. An action is in process to address preconditioning and as-found testing for all components addressed by the OM Code. This paper will discuss Information Notice 97-16, the Code action, current methodologies employed by some utilities to address preconditioning, and can serve as a forum for discussion of other utilities' approaches on preconditioning at the Symposium.
Introduction
The U.S. NRC in 1997 issued Information Notice (IN) 97-16, "Preconditioning of Plant Structures, Systems, and Components Before ASMIE Code Inservice Testing or Technical Specification Surveillance Testing." This notice detailed the NRC's longstanding concern with unacceptable preconditioning of components before the IST or Technical Specification (TS) surveillance testing, and the adverse effect the preconditioning might have on the validity of the tests. Since then, the NRC has included preconditioning in their Inspection Guidelines on Surveillance Testing, 71111.22, which requires an inspection of six surveillance activities (including at least one IST) each quarter and specifically identifies preconditioning as a significant surveillance test attribute to be reviewed. Additionally, the NRC devotes an entire section of the NRC Inspection Manual to "Maintenance Preconditioning Of Structures, Systems, And Components Before Determining Operability," Part 9900. NUREG-1482, "Guidelines for Inservice Testing at Nuclear Power Plants," Section 3.5 addresses testing in the as-found condition. While this guidance recognizes that the Code does not specifically require all inservice testing to be performed in the as-found condition, degradation mechanisms
NUREG/CP-0 152, Vol. 42C-13

NRC/ASME Symposium on Valve and Pump Testing
may not be identified if testing is not performed in the as-found condition.
Regulatory Basis
Although the Technical Specifications and the ASME OM Code (or ASME Boiler and
Pressure Vessel Code Section XI) does not address preconditioning or as-found testing for all components, the regulatory basis for requiring that components be tested in an "as-found" condition is identified in the Code of Federal Regulations (CFR) in
various places. 10 CFR 50, Appendix B, Criterion XI, "Test Control," requires that all testing be performed to demonstrate that structures, systems and components will perform satisfactorily in service. 10 CFR 50, Appendix J, "Primary Reactor containment Leakage Testing for Water-Cooled Power Reactors," requires that, prior to containment tests, no repairs or adjustments be made so that the containment can be tested in as close to the "as-is" condition as practical. Appendix J additionally requires that valves be closed by normal operation without any preliminary exercising or adjustments.
Technical Specifications generally do not provide specific guidance regarding the preconditioning of equipment prior to
performance of the surveillance testing. 10 CFR 50.36, "Technical Specifications," specifies that surveillance requirements are identified as requirements relating to test, calibration, or inspection to ensure that the
necessary quality of systems and components is maintained, that facility operation will be within safety limits, and that the limiting conditions of operation will be met. Although "as-found" testing of components is not
specifically identified in the TS, it is required
as a result of the NRC regulations described above.
Discussion
Any preventative maintenance performed on the components could be considered preconditioning, since its function is to
improve the performance of the equipment. Preventative maintenance (PM) programs are normally repetitive tasks that are set up on a regular schedule, which is more frequent than the functional test. As such, at times,
the PM's are performed prior to a component being tested. While this is not expected to be a common occurrence, there is anecdotal evidence that it does occur. Preconditioning is often referred to as activities that occur "just prior to" testing; however, using that terminology creates confusion regarding what "just prior to" means (e.g., during the same shift, within 7 days, etc.). For this reason, it is prudent to evaluate any activities performed between successive testing for unacceptable preconditioning.
The question is which activities are acceptable and which are not, relative to
ensuring the test results are valid. NRC IN 97-16 provided a number of examples of unacceptable preconditioning. The NRC had requested that the Code committees review the preconditioning issue and provide requirements in the Code to cover all components addressed by the OM Code.
NRC IN 97-16 stressed the importance of
obtaining meaningful results during IST in order to determine the degree to which a component has degraded, if at all, and to
determine the component's ability to perform
its intended function when required. This is
especially important with regard to the Code's current initiative of performance based testing.
The Code is moving towards requiring condition monitoring rather than providing
prescriptive requirements independent of the component's performance or safety
NUREG/CP-0 152, Vol. 4 2C-14

NRC/ASME Symposium on Valve and Pump Testing
function. The Code has already added a non-mandatory appendix for check valves that is performance based. Relief valve testing frequency requirements are also performance based, although the test method requirements are still prescriptive. The other sections of the Code are being evaluated for the incorporation of performance based testing. Performance based testing is reliant on evaluations of data trends. Test requirements (including test intervals, test scope, and test methods) are determined based on the results of previous test results. If preconditioning has masked the test results, the whole basis for the testing scheme is unsound, and the component may be in a degraded condition longer than a component that is tested on a regular prescriptive schedule.
To obtain meaningful results, it is important to test the components in the as-found condition and to avoid preconditioning to the extent possible. The Code currently addresses preconditioning and as-found testing, but only for snubbers and relief valves, which have some degree of performance based testing. Subsection ISTD- 1510 of the Code states that snubbers shall not be adjusted, maintained, or repaired before an examination or test specifically to meet the examination or test requirements. ISTD-5221 states that snubbers shall be tested in their as-found condition regarding the parameters to be tested to the fullest extent possible. Appendix I of the Code discusses as-found testing for relief valves. No maintenance, adjustment, disassembly, or other activity that could affect as-found set pressure or seat tightness is permitted by Appendix I prior to relief valve testing.
The Code committees have evaluated adding requirements in Subsection ISTA that would apply to all components tested in accordance with the Code. The current proposal on the
table is to add the following definitions of "preconditioning" and "as-found condition" and add a general requirement in ISTA, as follows:
Add to ISTA-2000, Definitions:
Preconditioning: The modification, maintenance, manipulation, or adjustment of a component performed between inservice tests with the intent of enhancing the results of the inservice tests. This includes activities such as cycling, cleaning, lubricating, agitating, or other specific maintenance or operational activities that may be performed prior to or during inservice testing that could affect the ability to determine component degradation.
As-found condition: The condition of a component between inservice tests without activities that could affect the ability to determine component degradation.
Add ISTA-3200, As-Found Testing and Preconditioning Where practical, components shall be tested in the as-found condition. Preconditioning shall not be performed.
(It should be noted that these proposed words are still under consideration and have not been approved for publication.)
Unfortunately the Code only provides the minimum, mandatory requirements and does not include an implementation guide. The Code Committee could not reach a consensus for adding more specific requirements. The utilities are still responsible for determining, and somehow documenting, why an activity is not considered unacceptable preconditioning. The proposed code change specifically includes a statement that it is unacceptable if the intent of the activity is to enhance the test results. The new Code requirements would
NUREG/CP-0 152, Vol. 42C- 15

NRC/ASME Symposium on Valve and Pump Testing
require the test procedures and the scheduling of the tests and maintenance activities to be reviewed with preconditioning in mind to ensure that the perception is that the activity was not performed to enhance the test results.
The NRC Inspection Manual on Preconditioning, Section D.2, provides a list of questions to be considered when evaluating whether an activity could be considered unacceptable preconditioning:
- Does the activity performed ensure that the component will meet testing acceptance criteria?
- Would the components have failed the test without the activity?
- Does the activity bypass or mask the asfound condition? (Including where trend data could be compromised.)
- Is the activity routinely performed just before the testing?
- Is the activity performed only for scheduling convenience?
Some surveillance testing cannot be performed without disturbing or altering the equipment (e.g., attachment of test leads, pneumatic or hydraulic supply lines, disconnection, realignment, and installation of jumpers). Any such disturbance or alteration is expected to be limited to the minimum necessary to perform the test and prevent damage to the equipment. Additionally, some equipment is cycled as a result of other components' test procedures. For example in the case where multiple valves are controlled by one switch, the test procedure must address rotating which valve is as-found tested, otherwise only one of the multiple components is as-found tested. Alternatively, the test may be performed by not using the single switch, but by jumpering each valve separately.
Inadvertent preconditioning can also be caused by scheduling testing of systems that are related back to back, for example the HPCIIRCIC and RHR, as well as those that are apparently unrelated. The NRC Inspection Manual provides an example where the diesel generator air start system was scheduled after the EDG test, and the air-start system was operated during EDG pre-test preparation.
For valves, NUREG-1482, Section 3.5, notes that the as-found condition is generally considered to be a valve without pre-stroking or maintenance. It is considered preconditioning when air-operated valve stems are lubricated prior to performing stroke time testing. The practice of operating a pump for warm-up and the practice of venting immediately before performing the surveillance tests are examples of unacceptable pump preconditioning provided by the NRC in the Inspection Manual.
The NRC Inspection Manual, Section C. 1.b, provides a discussion of acceptable preconditioning and states:
"The alteration, variation, manipulation, or adjustment of the physical condition of an SSC before Technical Specification surveillance or ASME Code testing for the purpose ofprotecting personnel or equipment or to meet the manufacturer's recommendations. Preconditioning for purposes ofpersonnel protection or equipment preservation should outweigh the benefits gained by testing only in the as-found condition. This preconditioning may be based on the equipment manufacturer ' recommendations or on industry-wide operating experience to enhance equipment and personnel safety."
This broad definition of acceptable preconditioning could be interpreted to include valve cycling, stem lubrication,
NUREG/CP-0152, Vol. 4 2C-16

NRC/ASME Symposium on Valve and Pump Testing
and other activities recommended by most manufacturers. However, the NRC specifically identifies these activities as unacceptable in the Inspection Manual. In any case, the NRC notes that any preconditioning should be evaluated and documented in an engineering evaluation in advance of the surveillance and that the evaluation should be performed using procedures to ensure that design and licensing bases are satisfied. The NRC Inspection Manual could be interpreted as to require an engineering evaluation of all maintenance activities for unacceptable preconditioning.
An informal survey of utilities has identified only one that has developed a formal company policy on component preconditioning, i.e., Seabrook. They have also developed a white paper to provide further guidance to plant personnel. However, most utilities are still struggling with establishing a policy and implementing procedure. Some have included a simple precautionary statement in their IST program procedure. The NRC Inspection Manual requires engineering evaluations of preconditioning; however, very few utilities surveyed had documented any evaluations and they were in response to a corrective action report.
Utilities should all have a proceduralized process for ensuring that scheduled
maintenance is not unacceptable preconditioning, as well as documentation of the reviews of the specific maintenance activities. As discussed above, the test procedures and test scheduling must be reviewed for unacceptable preconditioning.
In addition to scheduled maintenance, there also exists the potential for preconditioning as a result of human error or equipment failure and the resulting corrective maintenance and corresponding post-maintenance testing. Inadvertent activities such as these may result in the surveillance test not reflecting the as-found condition. When these unscheduled activities occur, they should be so noted on the surveillance test record, and considered when assessing the condition of the component being tested.
In conclusion, for practical purposes, "as-found" testing will yield the most information concerning the ability of the component to perform as required. However, maintenance must be performed to ensure the continued operability of the component. Proper review and documentation of the maintenance is required. Without documentation, the intent of the maintenance can be misconstrued and inadvertent preconditioning can occur.
NUREG/CP-0152, Vol. 42C-17

Predictive Maintenance Informed Testing of Pumps
Howard Maxwell Arizona Public Service
Abstract
The current OM-6 or ISTB sections of the ASME Nuclear Code provide only a few measures to determine the 'Operational Readiness' of pumps. These two measures are hydraulic performance measured at one point of the pump curve, and overall vibration amplitude at five locations on the pump bearings. The current state of the art in determining, and forecasting the condition of pumps include many more measures which are routinely used to monitor non-safety related pumps. The current method is easier for a regulator to audit, as it provides a set of discreet numbers, which can be compared to numerical acceptance criteria. Predictive Maintenance information, however, is much more of an 'Art' in that the evaluation of condition must be made by a qualified individual using a 'holistic' approach to the collected data. The results of a Predictive Maintenance evaluation are never a set of discreet numbers, which can be compared to numerical acceptance criteria. This difference in approach to determining pump condition is the major reason that the ASME Code lags the Predictive Maintenance field by several decades. This paper will discuss the differences between the current state of the art of Predictive Maintenance and the ASME Code, and will discuss methods that could allow the Code to use Predictive Maintenance evaluations to determine pump condition. This paper is based on a presentation made
to the ASME O&M Special Committee on Standards Planning, March 10, 1998 (see Reference 1).
Current State of Predictive Maintenance Technology Implementation in the Nuclear Industry
The nuclear industry has, for a long time, embraced the predictive maintenance(PdM) technologies for their non-safety related pumps. To apply these technologies for in-service testing of safety-related equipment will require some adjustment in the PdM programs of each plant. Most best-practice plants could implement PdM informed inservice testing (IST) without major changes in PdM equipment, procedures and personnel qualification for vibration and thermography. Some best-practice plants may require major changes in their oil analysis program. Plants that do not have best-practice PdM programs would require major changes in equipment, procedures and personnel qualification. Almost all plants would have to install Infrared Windows in their safetyrelated breakers and motor control centers, to implement a comprehensive thermography program for their in-service testing.
Effectiveness of OM Code Testing
In order to have some measure of comparison between the Code-required IST program, and
NUREG/CP-0152, Vol. 42C-19

NRC/ASME Symposium on Valve and Pump Testing
a good-practices PdM program, a review of 18 identified pump conditions over a threeyear period was conducted. These conditions were identified by either the PdM program, and/or the Maintenance Rule program. Of the 18 conditions, 9 were considered Maintenance Rule Functional Failures. The remaining 9 were detected only by the predictive maintenance program which detected 13 of the 18 total conditions. Three or four additional conditions could have been detected by the predictive maintenance program, with some changes to the program. Therefore, of the original 18 conditions, 17 were detectable by predictive maintenance techniques, as shown in Figure 1.
None of the conditions was detected by the required OM-6 testing, but all would have been detected if they had been allowed to progress to near failure, or failure. One interpretation of this apparent failure of the IST program to identify conditions found by the PdM Program, is that the PdM program was "predicting" a future failure that would have been detected by the IST program. The one condition in this sample that could not have been detected by PdM techniques was water in an Aux. Feed Pump Turbine steam line.
The fact that 50 percent of the identified (and
corrected) conditions in this sample were not identified as reportable (i.e., not MRFF, or reportable to NPRDS) failures, calls into question the reliability of industry statistics based on official industry reports of failures.
The claim of predictability is open to various opinions. Two of the MRFFs and one of the PdM conditions were water in the oil. For the two MRFFs it was felt that the pump was not likely to be able to fulfill its safety function. Were these really "failures" or just a condition likely to result in a failure? The water was
detected by the Lube Analysis Program, but did it find a failure, or did it predict a failure? I counted these conditions as predictable.
Another consideration in comparing a PdM program to an IST program in this way, is the difference in scope of the equipment in the IST program, the PdM program, and the Maintenance Rule. Fully 50 percent of the conditions discovered were on equipment outside the scope of the IST program, as shown in Figure 2.
Comparison of Information provided by an IST Program, and a PdM Program
The reason for the differences in effectiveness can be easily seen by comparing both the quantity and quality of the data collected. Figure 3 shows that, for a Turbine Driven Auxiliary Feed Pump (TDAFP), only four percent (5 values not including performance data) of the 144 numeric data values available to the PdM program is used in the IST program. See Table 1.
The current IST program collects essentially no diagnostic data. Although many programs trend their data, this is not required, and there are no criteria for evaluating trends. The plant's probabilistic risk assessment (PRA) assumes that the test effectiveness of the IST program is 100%, i.e., the test will detect 100% of the conditions that will prevent the pump from performing its intended function. The time that the pump is required (its "mission time") is not specifically stated, although the phrase "Fail to Run" encompasses this to some degree. The author estimates that the test effectiveness for the PdM portion of the IST program is about 85% for mission times less than 7 days. A comprehensive PdM program, similar to the PVNGS program, for the TDAFP collects
NUREG/CP-0152, Vol. 4 2C-20

NRC/ASME Symposium on Valve and Pump Testing
approximately 250 pieces of diagnostic information, in addition to the numeric data discussed above, for a total of about 400 pieces of data, as shown in Figure 4, and summarized in Table 1.
Evaluations
Another area of difference between the IST program and a PdM program is the kind of evaluations that result from the data. The IST evaluation is based on fixed values of the overall vibration amplitude and limits the evaluations to acceptable, alert, and inoperable. The PdM evaluations are based on an assessment of symptoms, possible causes, and estimated time to failure. Typical PdM evaluations are:
"* acceptable,
"* a condition exists that might lead to failure or reduction of long-term reliability,
"* a condition exists that will probably lead to failure eventually (3 - 12 months), or
"* a condition exists will probably lead to failure sooner than 3 months.
Most PdM programs have severity descriptions similar to these; however, many do not include a forecast of when the condition may result in a failure. Note that the PdM evaluations attempt to predict an uncertain future, and do not address Operational Readiness. Also, note that the PdM evaluations use the words "probably" and "might". These words are not very amenable to "Code Space" or Operational Readiness determinations.
Current State of Integrated Predictive Maintenance Technology
Table 2 shows the author's estimates of the ability of Predictive Maintenance
Technologies to detect and predict equipment conditions. The estimates are based on the author's own experience and awareness of the state of the industry, not on a formal analysis. Others will probably suggest different numbers, and some will suggest that there are no reliable probabilities.
The current ISTB Code is about 15-20 years out of date, with very limited forecasting. The code is weak on criteria allowing only for overall vibration amplitude which, is only weakly related to actual machine condition except for very late (<1% of life) conditions. The code only requires vibration monitoring, even though lube analysis is often an earlier indicator of degradation, especially for babbitted bearings.
Technologies That Could Be Used To Implement a PdM Aware IST Program
There are a number of methods being considered to implement a PdM informed IST Program, all of which have some problems with the implementation. Risk based testing and test effectiveness has been discussed extensively. See References 2, 3, and 4. Reliability Centered Maintenance (RCM) is being used in the nuclear industry for non-safety related equipment. Reliability methods using generic failure rates is another possible approach, and a component reliability performance based method has also been proposed by Hartley and Gregg.
Performance Based Method
Hartley and Gregg (see Reference 5) have described a reliability performance measure as:
"A true indicator would be related to the change in performance of the covered components. As stated earlier, reliability
NUREG/CP-0 152, Vol. 42C-21

NRC/ASME Symposium on Valve and Pump Testing
can be expressed in terms of mission time and MTBF [Mean Time Between Failure] and availability in terms of MTBF and MTTR [Mean Time To Repair]. Changes in MTBF and MTTR for these components are indicative of the success or failure of a performance-based program. A baseline for the covered components can be developed considering unplanned outage times, MTBFs, MTTRs, and maintenance and testing costs. Then, once a performance-based testing program is implemented, feedback from the program can be used for comparison with the baseline information as well as data from non-program-related equipment."
There are several difficulties with this approach. First, the reliability measures suggested are lagging indicators. They show the results long after the changes in the testing are made, and do not provide assurance a priori that the changes are beneficial. Second, and more significant, is because failures of equipment are random (see Reference 6), and the sample size is very small, there is insufficient data to determine MTBF and MTTR which are statistical quantities. The measure of the time between failure of one component for several failures, or even a group of a dozen, provide insufficient information to predict future reliability of these components. Finally, component reliability is not a function of IST effectiveness, only of actual reliability enhancement changes carried out in the field, as discussed in the section on Reliability Engineering Methods.
Given generic industry wide component failure rates, such as the examples in Table 3, the reliability of the piece of equipment (such as a pump, or motor) can be calculated. Changes in testing techniques, such as adding PdM technologies, can then be applied to
the sub-component reliabilities and a new component reliability calculated. These new component reliabilities can then be applied to a plant's risk model to determine the effect of these changes to plant safety. The problem with this approach is that the monitoring must make actual plant changes. For example, just monitoring the condition of a pump will not improve its reliability. Reliability improved by using the data to make changes, such as reducing the dynamic load on the bearings by improving the alignment (Table 3) or by running the pump near its best efficiency point (Figure 5). While this is a desirable outcome, the reliability of the pumps is already considered acceptable; otherwise the plants would be shut down. Using condition monitoring data in a reliability model does not answer the question that IST is trying to answer, i.e., what is the condition of this particular pump right now?
Failure Modes and Causes Analysis
Both Reliability Centered Maintenance and Risk-Based Testing and Test Effectiveness, which are discussed below, make use of the technique called Failure Modes and Causes Analysis (FMCA). The use of this method has produced a wide range of results for a horizontal multi-stage pump. For example in most PRAs there only two failure modes, "Fail to Start" and "Fail to Run." Table 4 shows the number of failure modes and detection methods from several sources. What the author calls detection methods are variously called by others, test parameters, test type, failure influences, or discovery opportunity.
One of the difficulties in using FMCA, and one of the primary reasons that different sources list different failure modes is an inconsistency in the definition of "Failure". For example, both the Westinghouse report and the Electric Power Research Institute
NUREG/CP-0152, Vol. 4 2C-22

NRC/ASME Symposium on Valve and Pump Testing
(EPRI) PM Template list "Vibration" as either a failure or a failure influence, and neither provides a definition of failure, although the Westinghouse Report uses the term "significant degradation." Vibration by itself is never a pump failure. It is an indicator of pump condition, which may be used to predict future failure. At very high levels it can be a contributing cause of a failure, but vibration by itself is not a failure. The ASME Code does provide two possible failure definitions:
"Operational un-readiness, implied from References 11 and 12: "Operational readiness: the ability of a component to perform its specified functions" (i.e., "to perform a specific function in shutting down a reactor to the safe shutdown condition, in maintaining the safe shutdown condition, or in mitigating the consequences of an accident")
" Inoperable: an IST parameter is in the required action range from Reference 13.
Essentially, a pump has failed when it can not produce the required flow and pressure for the required mission time A pump with high vibration may be able to perform its intended function, but the vibration indication may prevent the plant from having the required reasonable assurance. I propose the following definition of pump failure:
"Pump Failure: the pump is unable to deliver the required flow at the required pressure for the required mission time."
Note that there is a probability associated with the Mission Time. For the first few hours, the probability that the pump is needed may be 100%, but after a few days the probability of needing the pump begins to fall, and at some time will reach zero. The current regulatory environment does not consider this. The last few hours in a 6-month required mission time,
after an accident, is considered as important as the first few hours.
The purpose of the inservice test is to provide reasonable assurance that, if required, the pump will not fail according to the author's proposed definition. Using this definition of failure, I think, greatly clarifies the development of both failure modes, and condition monitoring technologies. Table 6 in the Appendix shows a partial list of the expanded failure modes developed based on the failure definition above, many from Koch in Reference 14. The items in bold font will be used in an example later.
The next step is to evaluate these failure modes against the available detection technologies. The RCM and Risk Informed methods perform this step differently. In both the EPRI Templates and Westinghouse Report, the detection techniques are very generic, i.e., Vibration Spectral Analysis, or Lube Oil Analysis, without evaluating the various detailed methods in each technology against the various failure modes. The difficulty in specifying a complete technology this way is that it implies any combination of methods under that technology is equally effective. Table 7 in the Appendix gives a more detailed (however incomplete) list of the technologies, methods, and parameters that can be applied to the determination of a pump's condition. These methods are then compared to each failure mode to determine the effectiveness of the technique to that failure mode.
Reliability Centered Maintenance (RCM)
RCM has been used extensively by the aircraft industry to adjust maintenance activities to ensure high equipment reliability. The approach is to develop a list of failure modes, and then determining effective tests, or
NUREG/CP-0152, Vol. 42C-23

NRC/ASMIE Symposium on Valve and Pump Testing
preventative maintenance tasks that will detect that failure mode. The EPRI method is an excellent example, which is being applied in the nuclear industry now for non-safety related equipment to produce a more cost-effective maintenance plan. A simplified version of this method, described in Reference 15, is used for Check Valves, and there is a draft O&M Code Appendix circulating that would apply this method to pumps.
The RCM method uses generic industry practices or individual plant experience and data to determine the type and interval of monitoring. Using existing plant data, as discussed above, can give a false impression of equipment failure history. In addition, the link between the proposed monitoring task and the failure mode is not specified, and can be very misleading. Monitoring techniques provide indications of equipment condition, not of failure mode. Many failure modes may produce the same condition indications during the progress of the failure. Therefore, given a failure mode, one cannot directly determine the applicable monitoring technique. The current methodology of applying the RCM method uses a very generalized description of the monitoring technologies. This means that the success of the program depends entirely on the quality of the monitoring program, as there are no specifics given.
Risk Based Testing and Test Effectiveness
Because the current risk models assume a test effectiveness of 100% (i.e., test will detect 100% of the failures), an approach using PdM technology specific test effectiveness numbers would appear to be easily implemented. Then, different test "suites" or "strategies" could be compared by changing the pump failure probabilities in the PRA. This method would also allow for evaluating the interval
as well as the applied technologies, and is the approach used in the Westinghouse Report.
One of the difficulties with this method so far, is the applicable monitoring techniques are not clearly related to the failure modes as discussed in the section on RCM. For a method where test effectiveness numbers are to be specifically developed, this unclear relationship is even more of a problem. In order to obtain test effective numbers, one must recognize that the monitoring techniques are effective for specific equipment conditions, not for specific failure modes. The link between the failure modes and the equipment conditions is not as simple as might be expected, as shown in Table 8 in the Appendix, for three example failure modes from Table 6.
Another difficulty of using the risk model with PdM informed test effectiveness values, is that the risk model asks the question "what is the probability that the equipment is failed or near failure when the test is performed," not "what is the probability that the pump will pump X gpm at a pressure of Y psi for Z hours?" The key item in this last question is the required "Mission" time discussed above. This concept is illustrated by the P-F curve from Wolfson, Figure 6, who describes the curve:
"The P-F curve shows how a failure starts, deteriorates to the point at which it can be detected (the potential failure point "P"), if it is not detected and corrected, continues to deteriorate - usually at an accelerating rate - until it reaches the point of functional failure ('F') The P-F interval can be known as the 'Lead Time To Failure.' The "condition" being measured can take a variety of forms. Any condition that shows a change, as the health of the spare deteriorates, can be used. It must however, give enough of a warning
NUREG/CP-0152, Vol. 4 2C-24

NRC/ASME Symposium on Valve and Pump Testing
between "P" and "F" to allow actions to take place otherwise nothing will be gained by having a warning."
A very interesting conversation about this subject was recently held on the Plant Maintenance Resource Center (Reference 16) web site (wwwvplant-maintenance.com). There was considerable misunderstanding about the P-F curve, including its relationship with the "bathtub curve." The author's understanding is that the P-F curve is not related to the equipment reliability, but is related to the failure mechanism once it begins. This means that each failure mode and PdM technology combination would have a separate P-F curve.
Example of Determining Test Effectiveness Values
In order to illustrate how Test Effectiveness values might be determined, including the effect of Mission Time, three failure modes from Table 6 in the Appendix, were analyzed. Table 8 in the Appendix lists the failure modes, showing how, for each failure mode, the failure progresses through a number of machine conditions before failure. Each of these conditions is a stage where monitoring may detect the machine degradation. Also shown is the amount of time the pump may be in the condition listed for that failure mode, and the P-F time. The P-F time for each condition is the time from when the pump enters the condition to the failure. For the three example failure modes, there are a number of conditions that are the same, although their P-F times may be different. These conditions will have the same monitoring symptoms and are listed in Table 9 in the Appendix as column headings, together with the detection methods from in Table 7. Table 9 then shows an incompletely filled out Test Effectiveness matrix, following
the method described in the Westinghouse Report. Using this matrix, the P-F times from Table 8, and the required Mission Time, a "suite" of monitoring tasks and intervals can be developed.
Level of Complexity
As the tables in the Appendix were developed, it became clear that this method is very complex, with many subjective judgements. Since there are only a few types of pumps in the IST program, it is not unreasonable to suggest that this exhaustive method be applied. However, this level of detail may not be required for every program. The most appropriate level of detail depends largely on the competence of the personal in the plant who are making the judgments, and the effectiveness of the program implementation.
The development of failure modes, test effectiveness values, and appropriate condition monitoring techniques require judgements, whether done using very generalized definitions of failure modes and condition monitoring techniques, or the more complex and detailed method discussed above. In addition, as discussed in the section on PdM evaluations above, the evaluations of pump condition also require judgements. In all of these cases, the judgements are mostly "knowledge based," and prone to error, and the process used should incorporate "knowledge based" error prevention tools. This requires that the condition-monitoring program, not only have all the currently available and applicable technologies, and qualified personnel, but also an error prevention strategy.
Conclusion
There are two viable methods for applying PdM information to IST. Both the "Risk Based Testing and Test Effectiveness" method,
NUREG/CP-0152, Vol. 42C-25

NRC/ASME Symposium on Valve and Pump Testing
or the "RCM" method could be used. In either case the underlying FMCA should include a basic and consistent definition of failure, and should incorporate the concept of "Mission Time" and the "P-F curve."
For each method, the level of detail should be at least at the level of the Westinghouse Report, but could range up to the very detailed method discussed above and shown in the Appendix. If this task is done by the plant, then a middle course, such as the EPRI method, using qualified personal would be appropriate. If an industry group, such as the ASME O&M Committee were to develop the method, they should start with the more detailed analysis. In any case, the implementation in the plant should include an error prevention strategy.
References
1. Maxwell, H.; "Predictive Maintenance Informed Pump IST," Presentation to the ASME O&M Special Committee on Standards Planning, March 10, 1998.
2. Hartley, Scott; "A Practical Approach for Implementing Risk-Based In-Service Testing of Pumps at Nuclear Power Plants," Proceedings of the Fourth NRC/ ASME Symposium on Valve and Pump Testing, Nuclear Regulatory Commission, NUREG/CR-0152, July 1996.
3. Perdue, Robert K.; Closky, Nancy B.; and Colvin, Eric R., "Application of Risk-Based Methods to a Pump Testing Demonstration Project: Test Effectiveness and Strategy Evaluation," Proceedings of the Fifth NRC/ASME Symposium on Valve and Pump Testing, Nuclear Regulatory Commission, NUREG/CR-0152 Vol. 2, July 1998.
4. Closky, N.; Balkey, K.; WCAP-14571, "Westinghouse Owners Group Application
of Risk-Based Methods to Pump Testing Demonstration Project-Rev 0" (contract required document); Work Performed by Westinghouse Electric Corporation for Westinghouse Owners Group, January 1996.
5. Hartley, Scott; Gregg, Richard; "Performance-Based Testing of Pumps" Proceedings of the Fifth NRC/ASME Symposium on Valve and Pump Testing, Nuclear Regulatory Commission, NUREG/CR-0152 Vol. 2, July 1998.
6. Wolfson Maintenance, "Maintenance Techniques and Analysis," www.wmeng.co.uk, "in highly complex equipment, such as an aircraft, infant mortality followed by random failure is the dominating failure pattern."
7. Barringer, H. Paul, Reliability Engineering Principles, Barringer & Associates, Inc., PO Box 3985, Humble, TX.
8. Barringer, H. Paul, Life Cycle Cost, Barringer & Associates, Inc., PO Box 3985 Humble, TX.
9. Worledge, David, Hinchcliffe, Glenn; "Preventive Maintenance Basis, Volume 13: Horizontal Pumps," TR-106857-VI 3, W04109, Electrical Power Research Institute (EPRI), 1997.
10. Staunton, Robert; "Presentation on Pump System Characterization and Reliability Enhancement," Proceedings of the Fifth NRC/ASME Symposium on Valve and Pump Testing, Nuclear Regulatory Commission, NUREG/CR-0152 Vol. 2, July 1998.
11. Section ISTA 2000, ASME OM Code-2001, Code for Operation and Maintenance of Nuclear Power Plants.
NUREG/CP-0152, Vol. 4 2C-26

NR C/ASME Symposium on Valve and Pump Testing
12. Section ISTA 1100, ASME OM Code-2001, Code for Operation and Maintenance of Nuclear Power Plants.
13. Section ISTB 6200, ASME OM Code-200 1, Code for Operation and Maintenance of Nuclear Power Plants.
14. Koch, Rick; "Black Oil Solutions: AntiFriction Ball Bearing Condition Analysis and Life Prediction;" Proceedings of the Fifth NRC/ASME Symposium on Valve and Pump Testing, Nuclear Regulatory
Commission, NUREG/CR-0152 Vol. 2, July 1998.
15. "Check Valve Condition Monitoring Program;" Mandatory Appendix 11 of the ASME OM Code-2001, Code for Operation and Maintenance of Nuclear Power Plants.
16. Plant Maintenance Resource Center, "Determining the Frequency of Condition Monitoring tasks," a discussion thread from www.plant-maintenance.comr articles/CM Intervals.shtml.
Figure I Conditions Detectable by PdM Technologies
NUREG/CP-0152, Vol. 4
NotTherm
1% -•• Pre dictab le%
Vibe
Analysis
17%
-- Lube Ik ,-Analysis
Lube and
Vibe
Analysis
28%
2C-27

NRC/ASME Symposium on Valve and Pump Testing
T urbin e s11 ' Lm oto rs" 1 %11%
Switch Gear 6%
I...Outside IST Program Scope___l
Figure 2 Conditions by Component
Figure 3 Comparison of Quantity of Numeric Data
NUREG/CP-0152, Vol. 4
Pumps
50%
OM-6 4%
PdM Lube 43%
PdM Vib
52%
2C-28

NRC/ASME Symposium on Valve and Pump Testing
Figure 4 Total Quantity of Information
Figure 5 Effect of Operation on Pump Reliability from Barringer[8]
NUREG/CP-0152, Vol. 4
Therm Vib 1 % 43%
Lube
19%
Therm Lube
1% 19%
Allta D Diagnostic Data
M • e, ;Bet
Good PrI -_ .A n/. kn
___________________________________ Characteristic Pump Curve Sensitivity For Pump Reliability Life -MTBF
----------------------------------- )I .• •,,•,• -0.92"."'1
S-"Best Practice 0.92 eaO~ Vt =-10% to +5%ofBEP
lenCy Polilt ------------------------------------------------ 0.111, •'P""•:-- /!-•g &-"'%• 0.53"1n7
0% to +10% A5
actice-------------- ------------------------------------ O0. 1~ C.1 \ /
Reliability Curve
*Bfr& ALt 11- IV5 % Flow
2C-29

NRC/ASIE Symposium on Valve and Pump Testing
Table 1 Examples of Numeric and Diagnostic Data Types for TDAFP
OM-6 Numeric Data
* not included in PVNGS Program
NUREG/CP-0152, Vol. 4
5 Vibration overall amplitude readings compared to two alarm values each PdM Program Numeric Data. Includes Driver and Switch Gear
10 vibration overall amplitude readings 10 sets of 5 frequency band vibration energy values 2 bearing noise overall amplitude readings 2 sets of 5 frequency band bearing noise energy values Estimated number of broken rotor bars 3 sets of 3 lubricant properties: (TAN) Total Acid Number, Karl Fischer Water, Kinematic Viscosity 3 sets of 20 small particle wear metal content by Emission Spectroscopy (Standard) Motor termination temperature *
Motor switch gear temperature *
Total of 144 data values, with 83 compared to two alarm values (166 alarm values total). PdM - Diagnostics Data
12 sets of spectral shapes, major component frequencies, and bearing fault frequency content 12 sets of trends of 6 parameters 2 sets of spectral trends 12 sets of waveform shapes, modulations, impacting indications, and bearing fault symptoms Shape of motor current signature Trend of number of broken rotor bars Visual observation of lubricant condition Trend of 3 sets of 3 lubricant properties Trend of 3 sets of 20 small wear particles Shape of 3 sets of lubricant chemistry content by FT-IR (Fourier Transform Infrared Spectroscopy) Trend of motor termination temperature and pattern *
Trend of switch gear temperature and pattern *
Total of 234 pieces of diagnostic information
2C-30

NRC/ASME Symposium on Valve and Pump Testing
Table 2 PdM Condition Detection and Forecasting
Condition Vibration Lubrication Thermography Detection up to 5% of bearing life (about up to 10/a of bearing life imminent about
6 months) with about a 90% (about 12 months) with 25% of the time Normal wear confidence about a 9 0%/ confidence bearing failures Time to Can predict time to failure +1- Improving. ** Poor
Failure * 50%/ with about a 90%/a confidence
Detection imminent (<1% of life - about I inmminent (<1% of life - imminent about month) with about 99%/a about 1 month) with about 25% of the time confidence 90%/a confidence
Bearing failures 3 months with about 85% from any cause confidence
Time to Can predict time to failure +1- Poor, but improving Poor Failure 50% with about a 75%
confidence Detection imminent (about I month) with No No
about 99%/ confidence Non-bearing, 3 months with about 85% mechanically confidence related failure Time to Can predict time to failure +/- No NO
Failure 50/a with about a 75% confidence
Mechanically Detection about 60% confidence. No No related (nonlubricant) root cause problems that will cause reduced reliability
Detection Technology is improving, about 60% of the time. Can No Lubricant related especially with grease detect wrong oil, dirty oil, root cause lubricated. About 300A degraded oil, and water in problems that will oil. Cannot detect damaged cause reduced or plugged lubrication reliability supply system, oil level
problems
Can detect Detection No No about 90% of imindetct the time immiunent Time to No No No electrical failures File
Failure
Can detect Detection No No about 75% of electrical the time conditions that will lead to premature failure
NUREG/CP-0152, Vol. 4
* - Time to Failure Prediction +/- 50%
** - Normal oil lubricated bearing wear is usually first detected by the Lube Analysis technology, which has only a weak ability to forecast The Vibration technology, usually detects the failure at a later stage, but has a better ability to forecast the future course of the failure.
2C-31

NRC/ASME Symposium on Valve and Pump Testing
Table 3 Installation and Operations Effect on Pump Reliability from Barringer in Reference 7
L/D Better Practices Pump Suction Rotational (Middle Grade): Curve % Straight Shaft Piping Rotational Foundtn
Installation & Use Off BEP Runs Alignment Alignment Balance Design Grouting Slightly
Compnt +10% to - ±0.003 Smooth at 3.5 Times Porous Life 20% of LID = in/inch ±0.010 0.0448 Equipment But
Component Multiplier BEP 6 to 8 error inch error inches/sec Mass Adhesive Impeller 0.6583 88% 95% 95% 94% 95% 95% 98% Housing 0.5163 73% 95% 95% 92% 95% 95% 95% Pump Brgs 0.395 79% 90% 88% 88% 90% 90% 90% Seals 0.4314 88% 90% 90% 84% 90% 90% 90% Shafts 0.395 79% 90% 88% 88% 90% 90% 90% Coupling 0.5705 92% 95% 90% 94% 95% 90% 91% Motor Brgs 0.6036 94% 93% 94% 97% 95% 90% 90% Motor Wd'gs 0.9776 100% 100% 100% 100% 100% 99% 99% Motor Rotor 0.6036 94% 93% 94% 97% 95% 90% 90% Motor Starter 1 100% 100% 100% 100% 100% 100% 100% Cost As % Of 181% 120% 120% 120% 138% 200% 200% Lowest Grade
Table 4 Failure Modes from Several Sources
Source Number Number Comments of of
Failure Detection Modes Methods
PRA 2 7* *Based on the Westinghouse report for Test C WOG 21 16 - 20* *Combination of Test parameters and test type. The (Ref. 4) distinction between condition monitoring parameters or
tests and failure modes is not clear in the report EPRI 67* 10 Based on the PVNGS Aux Feed Pump. (Ref. 9) *Combination of Failure Modes and Failure Influences.
The distinction between the two is not always clear in the template.
Staunton 5 - 14 Ref. 10) author 47 About Not a thorough list based on the PVNGS Aux Feed Pump.
150* *There are at least 6 different methods of implementing each detection method
NUREG/CP-0 152, Vol. 4 2C-32

NRC/ASME Symposium on Valve and Pump Testing
Predictive Maintenance Informed Testing of Pumps - Appendix
Table 5 Expanded Failure Modes - Partial List
1. Motor not turning - See Motor 2. Coupling broken ... 3. Pump shaft sheared ... 4. No water to pump ... 5. No water out of pump (insufficient flow and/or pressure)
5.1. Impeller not turning 5.1.1 .Impeller broken 5.1.2.lmpeller turning on shaft... 5.1.3.Shaft not turning
5.1.3.1. Bearings seized 5.1.3.1.1. Excessive Axial Static Load
5.1.3.1.1.1. Improper axial clearance to allow for thermal expansion 5.1.3.1.1.2. Improper radial clearance bearing to housing (too tight)
5.1,3.1.2. Lubrication Failure 5.1.3.1.2.1 Insufficient quantity ... 5.1.3.1.2.2. Oil condition degraded 5.1.3.1.2.3. Oil Contaminated
5.1.3.1.2.3.1. Water in Oil 5.1.3.1.2.3.2. Wemrgdebrs in oil 5.1.3.1.2.3.3. Other contaminant ...
51 3 1 3. Excessive Static Radial Load 5 1-.1.3.1. Coupling misalignment
5 1314 Excessive Dynamic Radial Load 5 13,1.4.11. Unbalance
5.1.3.1.4.1.1. Installation original unbalance 5.1,3.1.4.1.2. Impeller piece missing
5.1.3.1.4.1.2.1. Erosion 5.1 3.1.4.1.2.2. mfg. Defect
5 131.4.1.3. ShaftBow 5 13. 14.1.4. Foreign object lodged in impeller
5 3 i14.2. Rotor rub ... 5 e T14.3. Vane Passing Vibratron ...
1 3 14 4. Resonance
5 P c n 5 Bearing installation resulting in less load capability ... 5......Normal End of Life Fatigue 1 - 2 Shatt sheared ...
5 1 33 Imrpellers wear rings seized or rubbing ... 5.2. im,,#e .vr - -:1 -erforming to spec (i.e. incorrect size) ... 5.3 Purno cr,,N0 analseals leal~ng excessively ...
5.4. Discrtarne , .;ged 5.5. Vaive ccsed 5.6. Pumo ca-. rg leaking excessive water..
NUREG/CP-0152, Vol. 42C-33

NRC/ASME Symposium on Valve and Pump Testing
Table 6 Detection Methods 1. Vibration
1.1. Overall Unfiltered - IPS (5 locations) 1.1.1. Amplitude
1.2. Spectral Bands (5 locations) 1.2.1. Multiples of 1X (1X, 2X, 3X, 4-10X) in IPS 1.2.2. High Frequency Band (1-20kHz) - acceleration 1.2.3. Vane Passing Frequency
1.3. Identified Bearing Frequencies (5 locations) 1.3.1. 1 - 4th harmonics - Velocity 1.3.2. High Frequency Sum and Difference - Acceleration
1.4. Specialized Spectral Parameters (5 locations) 1.4.1. Broad band energy 1.4.2. Harmonic - non-harmonic energy 1.4.3. Harmonic families
1.5. Time Waveform Parameters- acceleration (5 locations) 1.5.1. Crest Factor 1.5.2. non-symmetry - Kurtosis
1.6. Specialized Bearing Monitoring (2 locations) 1.6.1. Peak-View 1.6.2. G's Spike Energy 1.6.3. Ultrasonics 1.6.4. Shock Pulse
1.7. Narowband spectral monitoring (enveloping) (5 locations) 1.8. Proximity (4 locations)
1.8.1. Orbit Shape 1.8.2. Shaft Position
2. Lube 2.1. Physical/Chemical
2.1.1. Appearance 2.1.2. Viscosity, (40°C) 2.1.3. Acid number 2.1.4. Water 2.1.5. Oxidation inhibitor 2.1.6. IR analysis
2.2. Particle Measurement 2.2.1. Particle counts 2.2.2. Wear particle concentration 2.2.3. Wear debris analysis 2.2.4. Elemental analysis 2.2.5. Large Particle Elemental analysis 2.2.6. Analytical ferrography 2.2.7. Direct reading ferrography (DRF) 2.2.8. Spectrographic analysis 2.2.9. Spectrometals analysis
3. Observation 3.1. Leakage 3.2. noise/vibration 3.3. Bearing Temperature 3.4. Motor Current 3.5. Oil level
4. Process data 4.1. mini-flow dP 4.2. mini-flow Flow 4.3. Full-flow dP 4.4. Full-flow Flow 4.5. Pump curve
NUREG/CP-0152, Vol. 4 2C-34

NRC/ASME Symposium on Valve and Pump Testing
Table 7 Example of Three Failure Sequences showing the pump conditions.
Incre- P-F Time mental Time
5.1.3.1.1.1 Improper axial clearance to allow for thermal expansion Resulting in overloading the bearings axially 1-4 h 2.5 h Resulting in excessive temperatures 1 h 1.5 h Resulting in lubrication failure .5 h 1 h Resulting in adhesive wear and melting .5 h .5 h Resulting in seizing the bearings, .5 h 0 h Resulting in the shaft not turning 0 0 h Resulting in the impeller not turning 0 0 h Resulting in no water coming out of the pump 0 0 h
5.1.3.1.2.3.1 Water in Oil small to moderate amount Resulting in oil contamination Variable Resulting in lubrication failure 2-4 m 9.25 m Resulting in adhesive wear 3 m 6.25 m Resulting in denting from the wear particles 3 m 3.25 m Resulting in rapid fatigue 1 m 2.25 m Resulting in rapid build up of spaulling 1 m 1.25 mr Resulting in rapid development of large particles 1 m .25 m Resulting in rapid adhesive wear and melting 1 w 1 w Resulting in seizing the bearings, 1 h 1 h Resulting in the shaft not turning 0 0 Resulting in the impeller not turning 0 0 Resulting in no water coming out of the pump 0 0
5.1.3.1.5.1 Normal End of Life Fatigue Resulting in increase in wear particles 8-10 y 2 y Resulting in denting from the wear particles 2 y 5 y Resulting in increased fatigue 1 y 3 y Resulting in build up of spaulling .5 y 2 y Resulting in development of large particles .25 y 1.5 y Resulting in adhesive wear and heating 2m 15 M Resulting in lubrication failure 2-4 m 13 m Resulting in rapid adhesive wear 3 m 9 m Resulting in denting from the wear particles 3 m 6 m Resulting in rapid fatigue 1 m 3 m Resulting in rapid build up of spaulling 1 m 2 rn Resulting in development of large particles I m 1 m Resulting in adhesive wear and melting 1 w 1 w Resulting in seizing the beanngs, 1 h 1 h Resulting in the shaft not turning 0 0 Resulting in the impeller not turning 0 0 Resulting in no water coming out of the pump 0 0
NUREG/CP-0152, Vol. 42C-35

NRC/ASME Symposium on Valve and Pump Testing
0�
-e
0
Overloading the bearings axially
Oil contamination - Water
Fatigue
cInurease in wear particles
Denting from the wear particles
Increased fatigue
Build up of spauling
Sevelopment of large particles
Adhesive wear
S4m: Adhesive wear and heating
Lubrication failure
Excessive temperatures
Seizing the bearings
The shaft not turning
The impeller not turning
o water coming out of the pump
C:,
(D
CD 0
0 ý2 Pý
NUREG/CP-0152, Vol. 4
IN)
0.
CDC
0
CD -h
ý2CD
0 U)
'CD
CD
0
:7
I-..
o.DCD
0 0:
05
CD
NRC/ASME Symposium
on Valve and Pump
Testing
CD
CD
U,
CL
Co
U,
U)
0
2C-36

NRC/ASME Symposium on Valve and Pump Testing
91
0
RMo
t-
0
0
P07
*D00
0 o )
LA
U , I
0
Iq
(D
0
4-t
o
0
0J
2:r !0
CIA
CD
0
CD
(D
0
z
0_
Overloading the bearings axially
Oil contamination - Water
Fatigue
Increase in wear particles
Denting from the wear particles
SIncreasedfatigue
0 -- Buildup of spauling
Development oflarge particles
A dhesive wear
Adhesive wear and heating
Lubrication failure
Excessive temperatures
Seizing the bearings
Fie shaft not turning
- -The impeller not turning
No water coming out of the pump
NUREG/CP-0152, Vol. 4
ci,
0~r
,0'
-0
00
0D
U,
2C-37

NR C/ASME Symposium on Valve and Pump Testing
Oerloading the bearings axially
Olcontamination -Water
Fatfige
Increase in wear particles
Denting from the wear particles
Increased fatigue
Build up of spauling
Development of large particles
Adhesive wear
Adhesive wear and heating
Lubrication failure
Excessive temperatures
Seizing the bearings
The shaft not turning
The impeller not turning
No water coming out of the pump
NUREG/CP-0152, Vol. 4
H 0
c0
ta
0< 0
0•
!Q
0'
CD
'1
CD
0CD 0
0
CD
!Q !01
0A ~CD
0 M_ 8
CP0
Ca
0
00
0 I-t 0� '-I.
C.,'
CD
90
0
0 Ca
0f
00 0 0
0 ZQ
(D
tJ
00
U,,
t<T
CL !,
0
0•
2C-38

NRC/ASME Symposium on Valve and Pump Testing
0~
0
ý2
Oerloading the bearings axially
Olcontamination - Water
atigu~e
Increase in wear particles
Denting from the wear particles
Increased fatigue
Build up of spauling
Development of large particles
dhesive wear
Adhesive wear and heating
m • Lubrication failure
Excessive temperatures
Seizing the bearings
The shaft not turning
:2 • The impeller not turning
o water coming out of the pump
NUREG/CP-0152, Vol. 4
c:0 CD =r C
0o
**1-40
CD0o
4ýk 4ý>
0
0
00
0•(V
clQ CD
0 0 '-1
-9-
0
U,
0
ý3
(V
CD
CD
CD
Co
Co Cj
!D
CD
2C-39

ASME Committee on Operation and Maintenance of Nuclear Power Plants: Activities,
Interactions, and Initiatives
Shannon Burke ASME International
Abstract
The ASME Committee on Operation and Maintenance of Nuclear Power Plants (O&M Committee) is responsible for the development and maintenance of two ASME documents, the OM Code and OM Standards and Guides. OM Code requirements for in service testing of pumps and valves are directly referenced in the Code of Federal Regulations. The OM Standards and Guides provides guidance on the testing of specific components of nuclear power plants. The purpose of this paper is to describe the Committee and its structure, to introduce means by which the public can interact with the O&M Committee to improve ASME documents and to present significant initiatives of the Committee.
Introduction
The charter of the O&M Committee is to develop, revise and maintain Codes, Standards and Guides applicable to the safe and reliable operation and maintenance of nuclear power plants. The codes, standards and guides developed by the O&M Committee are intended to serve the operating plants in the best interest of the public and to be submitted to the American National Standards Institute (ANSI) to become American National Standards.
Over 200 committee members work to fulfill this Charter. The members' backgrounds and experiences stem from different areas of the nuclear industry such as utilities, National Laboratories, original equipment manufacturers, designers and other related fields. Products of the O&M Committee are the OM Code and OM Standards & Guides. Interpretations and Code Cases are included in the OM Code, but are not approved by ANSI.
Committee Organization
The O&M Committee functions as an organization of Subgroups, Subcommittees and Standards Committee. There is a Sub Group specific to each section of the OM Code and Part of the Standards and Guides. For example, Sub Group ISTD focuses on Section ISTD (snubbers) and Sub Group Diesel Drives focuses on Part 16, Inservice Testing and Maintenance of Diesel Drives in Nuclear Power Plants. The Sub Groups report to either the Subcommittee on Codes or the Subcommittee on Standards and Guides. These Subcommittees provide guidance over their designated documents and function as a means of keeping the documents current by encouraging the subgroups to initiate improvements in line with changing industry and technology. A Special Committee on Standards Planning provides management for
NUREG/CP-0152, Vol. 42C-41

NRC/ASME Symposium on Valve and Pump Testing
development of new Parts and Sections. See Figure 1 for complete layout of Subcommittees and Subgroups.
Consensus Process
One might ask, since some interest categories have more voting members on the O&M Committee than others, what is to prevent these groups from unduly influencing Committee actions? The answer is the consensus process. The O&M Committee operates under ASME procedures accredited by ANSI as meeting the criteria of consensus for American National Standards. One of the requirements of a consensus committee is maintaining a balance of interest, with no more than one third of the voting membership coming from one interest category, such as owner or laboratory. To achieve consensus on an item, the Committee must consider all views and objections and try to form a resolution. Unanimity is not required to approve Standards Actions.
The O&M Standards Committee (i.e., Consensus Committee) gives final technical approval before actions are sent to the ASME Board on Nuclear Codes and Standards (BNCS), the supervisory board for all ASME activities related to codes and standards applicable to nuclear facilities and technology, for procedural review. The Standards Committee is also responsible for personnel and administrative items within the O&M Committee.
Interacting with the O&M Committee
Currently the O&M Committee meets two times per year. Guests are welcome at all subcommittee and subgroup meetings as well as the Standards Committee meeting. Attending a meeting is a good way for those
who are not members of the O&M Committee to become better acquainted with issues currently facing the subgroups and Committee as a whole.
A common way for users of the OM Code and Standards and Guides to interact with the O&M Committee is with the use of Inquiries. When questions arise as to the intended meaning of the wording of the Code or Standards and Guides, or if one feels the product can be bettered by their input, an Inquiry can be submitted to the O&M Secretary. Inquiry is a general term used to describe requests for revisions or additions to requirements in Committee documents, requests for Code Cases, and requests for Code interpretations. The Secretary begins the process of addressing the Inquiry as thoroughly and quickly as possible. When received, they will be forwarded to the appropriate subgroup for discussion. When a decision has been made, the Inquiry is then given to the responsible subcommittee for voting. If approved, the response will be returned to the submitter and published in the following edition of the OM Code.
Strict guidelines exist for the submittal of the Inquiries, and Inquiries will only be answered if these guidelines are followed. These guidelines are included in the front pages of the OM Code and OM Standards and Guides for easy access to the user. Submitted inquiries are to be written as a precise question, composed in such a way that they can be answered with a "yes" or "no" answer. An Inquiry is to be submitted with a proposed reply. Background information should also be given to assist the Committee in understanding the request. Requests for Code Revisions and Additions shall be accompanied by a need statement and background information. Requests for Code Cases, similar to Code Revisions and Additions shall be accompanied
NUREG/CP-0152, Vol. 4 2C-42

NRC/ASME Symposium on Valve and Pump Testing
by a need statement and background information. An example of an Intent Inquiry (Request for Interpretation) is shown in Figure 2.
Although the Committee interprets its documents, it does not act as a consultant on specific engineering problems or on application of requirements outlined in the Committee',s documents. All responses formulated by the Committee are not to be considered as approving, recommending, certifying or endorsing any proprietary or specific design or as limiting in any way the freedom of manufacturers or constructors to choose any method of design or any form of construction that conforms to the Code requirements. All technical inquiries will then be published in the next addenda or edition of the OM Code.
Committee Activities and Initiatives
The Committee has many new and continuing activities. Metrication of the OM Code is complete. It is anticipated that Metrication of the OM Standards and Guides will be complete by the next edition of the document in 2003.
The Committee intends to add more international members to gain broader input and participation in more technical conferences and symposiums related to the work of the Committee. This activity is in conjunction with an initiative to make the OM Code and Standards and Guides globally applicable by including metric units, allowing for Appendices to be added as per international requirements and providing courses on Committee efforts in other countries, such as China. Continuous maintenance of the Committee documents is vital. This is accomplished by merging goals and initiatives set by the Committee with
questions or initiatives introduced by outside parties. Currently, the Subgroup on Motor Operated Valves and Subgroup ISTC (Valves) are working on incorporating Code Case OMN-1, Alternative Rules for Preservice and Inservice Testing of Certain Electric MotorOperated Valve Assemblies in Light Water Reactor Power Plants, into ISTC.
An OM initiative guided by the Board on Nuclear Codes and Standards (BNCS) for the past five years is Risk Informed In-Service Testing Requirements. This BNCS action has emerged as a result of industry and regulatory initiatives to apply probabilistic risk assessment insights to its testing requirements. The Committee is converting OM Risk Informed Code Cases to a new Code Subsection ISTE. The Subgroup is very dedicated to addressing this important addition to the OM Code.
Performance-Based IST are testing requirements that reflect performance as supported by nuclear industry operational readiness experience data on various component types. There are three initiatives under the title of Performance-Based IST: time based activities, pumps (ISTB) and Appendix III.
New parts are under consideration and in various stages of development for the OM Standards and Guides. These parts are Part 23, Inservice Monitoring of Reactor Internals Vibration in Pressurized Water Reactor Power Plants; Part 24, Reactor Coolant and Recirculation Pump Vibration Monitoring; and Part 26, Reactor Coolant RTD's: Thermal Calibration.
Conclusion
The success of the O&M Committee is dependant on its volunteers and input of outside parties. The documents created by
NUREG/CP-0152, Vol. 42C-43

NRC/ASME Symposium on Valve and Pump Testing
the Committee are beneficial to their users because they are kept current and relevant to stakeholders. The O&M Committee responds to the public and needs of industry to the best of its ability. Input from all stakeholders in the form of technical expertise is always welcomed and encouraged.
If you would like to become involved in the committee or are just interested in gaining more information, the Committee webpage is located on the ASME website (www.asme.org) under Codes and Standards, C&S Committees.
NUREG/CP-0152, Vol. 4 2C-44

NRC/ASME Symposium on Valve and Pump Testing
NUREG/CP-0152, Vol. 42C-45

NRC/ASME Symposium on Valve and Pump Testing
April 14, 2001
Secretary Committee on Operation and Maintenance of Nuclear Power Plants The American Society of Mechanical Engineers Three Park Avenue New York, NY 100 16-5990
Dear Secretary:
Purpose: Code Interpretation
Background:
Inquiry:
Reply:
Provide the information needed for the Committee's understanding of the inquiry, being sure to include reference to the applicable Code subsection, appendix, edition, addenda, paragraphs, figures, and tables. Preferably, provide a copy of the specific referenced portion of the
Code.
Provide a condensed and precise question, omitting superfluous background information, and, when possible, composed in such a way that a "yes" or a "no" Reply, possibly with privos, is acceptable. The questions should be technically and editorially correct.
Provide a proposed Reply that will clearly and concisely answer the Inquiry question. Preferably, the reply should be "yes" or "no"l
possibly with brief privos.
Sincerely,
The Inquirer.
Figure 2. Example of Intent Inquiry to O&M Committee (to be submitted on Company letterhead)
NUREG/CP-0 152, Vol. 4 2C-46

Implementation of ASME OM Code Cases
Wallace Norris Office of Nuclear Regulatory Research U.S. Nuclear Regulatory Commission
Abstract
Provisions of the ASME Boiler and Pressure Vessel Code (BPV Code) have been utilized since 1971 as one part of the regulatory framework to establish the necessary design, fabrication, construction, testing, and performance requirements for nuclear power plant structures, systems, and components important to safety. In 1990, the ASME published the initial edition of the Code for Operation and Maintenance of Nuclear Power Plants (OM Code), which gives rules for inservice testing of pumps and valves. The ASME publishes a new edition of the BPV and OM Codes every three years, and a new addenda every year. The ASME also publishes Code Cases on a quarterly basis
(Sections III and XI of ASME BPV Code) or annually (OM Code) to provide alternatives to existing Code requirements developed and approved by ASME.
The U.S. Nuclear Regulatory Commission (NRC) has developed three regulatory guides to identify the Code Cases that have been determined to be acceptable alternatives to applicable parts of Sections III and XI of ASME BPV Code, and OM Code. A fourth regulatory guide lists the ASME Code Cases not approved for use. This paper discusses the NRC process for participating in the ASME development of Code- Cases, reviewing them to establish an agency position, and incorporating them into the regulatory framework.
NUREG/CP-0152, Vol. 4
This presentation was prepared by staff of the U.S. Nuclear Regulatory Commission. It may present information that does not currently represent an agreed-upon NRC position. NRC has neither approved nor disapproved the technical content.
2C-47

Inservice Testing and the New Reactor Oversight Process
Andrew Dunlop U. S. Nuclear Regulatory Commission
Region III
Douglas Dempsey U. S. Nuclear Regulatory Commission
Region I
Abstract
In the 1990s, periodic inspections of pump and valve inservice testing (IST) programs in United States commercial nuclear power plants were performed by U.S. Nuclear Regulatory Commission (NRC) Regional Inspectors to verify licensee regulatory compliance and licensee commitments. These in-depth inspections were conducted using NRC Inspection Procedure 73756, "Inservice Testing of Pumps and Valves," or Temporary Instruction 2515/114, "Inspection Requirements for Generic Letter 89-04, Acceptable Inservice Testing Programs." Since the inception of the Reactor Oversight Process (ROP) in April 2000, inspections of licensee IST programs were being conducted using a revised approach from the previous in-depth programmatic reviews. The newly developed ROP baseline inspection procedures were developed using a risk-informed approach as to the inspection frequencies, systems to be considered, and which aspects of the IST program need to be reviewed. This paper is intended to summarize how these new procedures are accomplishing the task to
ensure licensee's IST programs are adequately testing the safety-related function of components in accordance with the American Society of Mechanical Engineer (ASME) Codes for testing pumps and valves.
Introduction
Up until the late 1990s, periodic inspections of pump and valve inservice testing (IST) programs in United States (U.S.) commercial nuclear power plants were performed by U.S. Nuclear Regulatory Commission (NRC) Regional Inspectors to verify licensee regulatory compliance and licensee commitments. As of April 2000, the inspections are being conducted using the risk-informed Reactor Oversight Process (ROP). Although the method of how NRC is reviewing licensee IST programs has changed, the requirement to comply with IST provisions has not changed. The testing requirements for pump and valve 1ST programs are referenced through Title 10 of the Code of Federal Regulations, Section 50.55a, "Codes and Standards." These requirements are specified in the American Society of Mechanical
NUREG/CP-0152, Vol. 4
This paper was prepared by staff of the U.S. Nuclear Regulatory Commission. It may present information that does not currently represent an agreed-upon NRC position. NRC has neither approved nor disapproved the technical content.
2C-49

NRC/ASME Symposium on Valve and Pump Testing
Engineers (ASME) Boiler and Pressure Vessel Code, Section XI, Subsections IWP (for pumps) and IWV (for valves). ASME/ ANSI (American National Standards Institute) Operations and Maintenance (OM) Standards Part 6, "Inservice Testing of Pumps in LightWater Reactor Power Plants," (OM-6) and Part 10, "Inservice Testing of Valves in Light-Water Reactor Power Plants," (OM- 10) were incorporated into the 1989 Edition of Section XI by reference and subsequently included in the regulations through rulemaking effective September 8, 1992. OM-10 and later editions of IWV reference OM-1, "Requirements for Inservice Performance Testing of Nuclear Power Plant Pressure Relief Devices," to establish requirements for safety and relief valves. Subsequently, the ASME Code for Operation and Maintenance of Nuclear Power Plants (OM Code), which includes the 1995 Edition and the 1996 Addenda, was included in the regulations through rulemaking. The Code of record for a
specific plant is dependent on which edition of
the Code was referenced in the regulations at either the commencement of commercial plant
operation or the date 12 months prior to the start of the next IST program 10-year interval. Any references in the paper to "the Code" are generic in nature and not to a specific edition.
This paper is intended to provide a brief historical look of the previous NRC inspection
process and how the new procedures of the Reactor Oversight Process (ROP) are accomplishing the task to ensure licensee IST programs are adequately testing the safetyrelated function of components in accordance with the ASME Codes for testing pumps and valves. Discussions on the new ROP inspection procedures include the inspection basis and inspection requirements. Within the requirements portion, the paper further develops some of the requirements as to how
they are used to review portions of the IST
NUREG/CP-0152, Vol. 4
program implementation. These portions are included in italics to distinguish them from the requirements in the inspection procedures.
IST inspections in the late 1980s and 1990s
During the 1980s, the primary inspection guidance available to the NRC for review licensee's IST program was NRC Inspection Procedure 73756, "Inservice Testing of Pumps and Valves." By the late 1980s, numerous concerns were being identified by NRC inspectors with licensee IST programs, such that the NRC determined that additional guidance on inservice testing was necessary
and suspended conducting IST inspections until that guidance was issued. In April 1989, NRC Generic Letter (GL) 89-04, "Guidance on Developing Acceptable Inservice Testing Programs," was issued. This guidance included ten positions on how to develop and implement an acceptable IST program. These positions addressed a range of topics including the following: testing of check valves, pressure isolation valves, containment isolation valves, and scram discharge control valves; establishing stroke time limits for
power-operated valves; pump testing using minimum flow lines; and IST program scope. After allowing an approximate 2-year waiting period for licensees to revise their
IST programs to incorporate the guidance of the generic letter, the NRC issued Temporary Instruction 2515/110, "Performance of Safety-Related Check Valves," in November 1991; and Temporary Instruction 2515/ 114, "Inspection Requirements for Generic Letter 89-04, Acceptable Inservice Testing Programs," in January 1992. These documents provided guidance for the NRC inspectors to conduct IST inspections. These
inspections per the temporary instructions have been conducted at a majority of the nuclear power plants in the United States.
C-50
NRC/ASMF.
Symposium on Valve
and Pump Testing

NRC/ASME Symposium on Valve and Pump Testing
The inspections per these temporary instructions, which were usually performed together, provided an in-depth review of licensees' IST programs. The inspections were conducted by NRC regional IST specialists and, in some cases, with IST staff support from the Mechanical and Civil Engineering Branch of the NRC Office of Nuclear Reactor Regulation (NRR). The NRC inspectors would focus on two or three systems to conduct their review. The inspection of each system would include the following: verifying the program scope to ensure all components that performed a function that met the scoping requirement of the Code were included in the program; verifying that components included in the program were adequately tested in accordance with the Code requirements; verifying instrumentation used met the Code requirements; verifying that cold shutdown and refueling outage justifications were acceptable; verifying that relief requests were approved (as required) by the NRC and were properly implemented taking into account any limitations discussed in the NRC's approval of the relief request; witnessing the performance of inservice tests to ensure they were conducted properly; and verifying that testing results were properly dispositioned as required by the Code (e.g., pumps in required action range were declared inoperable until corrective action were implemented). As part of the 1996 NRC/ASME Symposium on Valve and Pump Testing, the NRC presented a paper summarizing the significant and reoccurring findings from a number of these inspections.
Subsequent to the completion of the in-depth reviews conducted in accordance with the temporary instructions, NRC Inspection Procedure 73756 was revised to incorporate the guidance from the instructions to provide the NRC with a process to conduct additional follow-up reviews of licensee
IST programs. A series of workshops were held with the industry in 1997 to discuss the revised inspection procedure and provide an opportunity for licensees to discuss IST issues with the NRC staff. These workshop discussions were documented in "Summary of Public Workshops held in NRC Regions on Inspection Procedure 73756, 'Inservice Testing of Pumps and Valves,' and Answers to Panel Questions on Inservice Testing Issues."
After completion of this round of inspections, the NRC did not establish a routine schedule to conduct follow-up IST inspections. Instead, inspections using Inspection Procedure 73756 were only conducted when there was an issue or concern identified with a licensee's IST program. These issues were usually identified by the NRC resident inspectors though their normal inspections of surveillances and other licensee activities. The Region would review the issue to determine if it warranted a follow-up inspection by a regional IST inspector. If the answer was yes, the Region would follow-up on the issue by conducting a regional initiative inspection using Inspection Procedure 73756 as guidance.
IST Inspections Under the Reactor Oversight Process
The new reactor oversight process (ROP) went into effect for most plants in April of 2000. As a result, the inspections of licensee IST programs were being conducted in a different manner to meet the NRC objectives. The ROP was developed to be more risk-informed, objective, predictable, understandable, and focused on areas of greatest safety significance. Key features of the new program are a risk-informed regulatory framework, risk-informed inspections, a significance determination process to evaluate inspection findings, performance indicators, a streamlined assessment process, and more
NUREG/CP-0152, Vol. 42C-51

NRC/ASMEF Symposium on Valve and Pump Testing
clearly defined actions the NRC will take for plants based on their performance. In order to continue to meet the NRC objective of protecting the health and safety of the public as a result of civilian nuclear reactor operation, the NRC developed three Strategic Performance Areas as follows: Reactor Safety, Radiation Safety, and Safeguards. These areas are then divided into seven cornerstones which support the safety of plant operations in the
three broad strategic areas. Since in this paper
we are only concerned with inservice testing, we will focus on the Reactor Safety area, which has the following four cornerstones: Emergency Preparedness; Initiating Events; Mitigating Systems; and Barrier Integrity. Inservice testing falls under the last two cornerstones, on which we will focus in this paper.
The inspection portion of the ROP is divided into three basic areas: baseline inspections; supplemental inspections; and special inspections. For the majority of U.S. plants, the only inspection conducted will be the
baseline inspections, which would review certain aspects of the IST program. If
significant degradation is identified in the Mitigating Systems and Barrier Integrity cornerstones (these are the cornerstones primarily affected by IST), the NRC would determine the cause of the degradation and, if it was determined that inservice testing was
a problem area, a supplemental inspection would be conducted that would provide a
more in-depth review of the IST program. If a plant event occurred that could be attributed
to the IST program, a special inspection could be conducted that would provide an in-depth review of the IST program or at least the
portion attributed to the event.
Reviews of licensees' IST programs remain an important part of the NRC's inspection
process for several reasons. The programs are required to be updated every 10 years to the edition of the Code referenced in 10 CFR
55.55a, such that program changes continue to occur. These changes may include both the
scope of the program and the test requirements and methodologies. Scoping changes can
include modifications to systems that install new components or, if a licensee decides to
implement a risk-informed IST program, additional high-risk non-Code components may be included. Test requirement changes could include verifying position indication for passive valves or testing check valves in both directions even though it was previously determined that the check valve only has a safety function in one direction. Testing methodology changes could involve the implementation of the comprehensive pump test or condition monitoring for check valves. Because of potential program changes, it remains important for the NRC to ensure Code
compliance such that component testing will continue to verify that they will function as required.
There are several newly developed baseline inspection procedures within the ROP being conducted that will review portions of
licensee IST programs. These procedures are performed at various frequencies and review different portions of the IST program depending on the overall topic under inspection. Four of the baseline inspection procedures contain some inspection activities associated with the IST program. In addition, there is one supplemental procedure (NRC Inspection Procedure 73756), which could be used if it is determined that poor plant performance is associated with the
IST program. These baseline inspection procedures include the following:
0 71111.17 Permanent Plant Modifications
NUREG/CP-0 152, Vol. 4
NRC/ASM• Symposium on Valve
and Pump Testing
2C-52

NRC/ASME Symposium on Valve and Pump Testing
* 71111.19 Post-Maintenance Testing
* 71111.21 Safety System Design and Performance Capability
* 71111.22 Surveillance Testing
The following section of the paper will discuss the inspection basis, inspection requirements, and how they relate to the inservice testing for each of these baseline inspection procedures.
71111.22 Surveillance Testing
Inspection Basis: Inspection of this area ensures that safety systems are capable of performing their safety function and would support the Mitigating Systems and Barrier Integrity Cornerstones. The failure to identify and resolve performance degradation of structures, systems and components could result in long periods of unknown equipment unavailability.
Inspection Requirements: The procedure requires the NRC resident inspector every quarter to select one inservice testing (IST) activity for a risk-significant pump or valve as one of the surveillance activity they are to review. Although the procedure only requires a review of one IST activity a quarter, the procedure does require the inspector to review 18 to 26 surveillance activities a year, such that there is a good chance that four more IST activities will be reviewed in the course of a year. The pump or valve selected would be in a mitigating system to support the Mitigating Systems Cornerstone. To support the Barrier Integrity Cornerstone, one or two of the valves selected would be a containment isolation valve. This review would usually consist of reviewing the test procedure, witnessing the test performance, reviewing the test results, and verifying any testing deficiencies are properly entered into the corrective action program, as required.
The procedural guidance identifies a number of significant surveillance test attributes that the inspector should consider. Although some of these attributes are not specifically for inservice testing, a number of the attributes provide the inspectors a good look at how the licensee's IST program is being implemented at the plant. These significant surveillance test attributes include the following:
1. Preconditioning: ensure valves are not being exercised or lubricating the stems prior to stroke timing the valves without adequate evaluation.
2. Effect of testing on the plant has been adequately addressed by control room and/ or engineering personnel.
3. Acceptance criteria are clear and demonstrate operational readiness, and are consistent with the supporting design calculations and other licensing documents: acceptance criteria for pumps and valves meet the Code alert and required action ranges.
4. Test equipment range and accuracy are consistent with the application, and calibration is current. Verify the plant equipment calibration is correct, accurate, properly documented and the calibration frequency is in accordance with plant technical specifications, updated final safety analysis report, licensee procedures and commitments: instrumentation meets the Code requirements for range and accuracy.
5. Testing is performed in sequence and in accordance with written procedures.
6. Jumpers installed or leads lifted during testing are properly controlled.
7. Test data are complete, verified and meet procedure requirements.
NUREG/CP-0 152, Vol. 42C-53

NRC/ASME Symposium on Valve and Pump Testing
8. Test frequency was adequate to demonstrate operability (meets Technical Specification requirements),and reliability: pump and valve testing performed on quarterly basis unless an adequate cold
shutdown, refueling outage justification, or relief request is in place.
9. Test equipment is removed after testing.
10. After completion of testing, equipment is returned to the position/status required for the SSCs to perform their safety function.
11. For IST activities, testing methods, acceptance criteria, and required corrective actions are in accordance with the applicable version of the ASME Code. Review reference values or changes to reference values for consistency with the design bases.
12. Unavailability of the tested equipment is appropriately considered in the licensee's performance indicator data.
13. For test results that do not meet the acceptance criteria, results of engineering evaluations, root cause analyses, and
bases for returning to operable status are acceptable: test results compared to applicable alert and required action
range to determine if component requires additional testing (relief check, and power-operated valves), more frequent testing (pumps), declared inoperable.
Based on the above attributes, the inspection
procedure primarily addresses the test
performance attribute of inservice testing
by reviewing the test procedure, witnessing testing in progress, and verifying results
are adequately addressed within the Code requirements.
71111.17 Permanent Plant Modifications
Inspection Basis: Modifications to
risk-significant structures, systems, and
components (SSCs) can adversely affect their
availability, reliability, or functional capability.
Inspection Requirements: The procedure requires two independent inspections. The
first is usually conducted by a small team
of regional NRC inspectors to review 5 to
10 permanent plant modifications every 2 years. The second part is for the NRC
resident inspector to review 1 to 2 additional
modifications each year that are installed
on-line. These inspections are divided into
four portions: design review; implementation review; testing review; and updating review. However, only the last two reviews will be
addressed here as they apply to the inservice testing. Modifications may install new components, revise component functions,
or replace an existing component with
one that performs a similar function. For ASME components, these changes need
to be assessed for their applicability for
inclusion in the IST program scope and,
if new, establishment of the associated inservice test for the functions that met the
scoping criteria. A portion of this review
for ASME components focuses on a review
of post-modification testing, which would include baseline or to re-validate baseline IST reference values.
The inspectors will verify that
post-modification testing will establish operability by:
1. Verifying that unintended system interactions will not occur.
2. Verifying SSC performance characteristics, which could have been affected by the
modification, meet the design bases: The
NUREG/CP-0152, Vol. 4
NRC/ASME Symposium
on Valve and Pump Testing
2C-54

NRC/ASMAE Symposium on Valve and Pump Testing
testing needs to establish baseline or to revalidate baseline 1ST reference values.
3. Validating the appropriateness of modification design assumptions.
4. Demonstrating that the modification test acceptance criteria have been met: test results are compared to applicable alert and required action range to determine if the component can be declared operable.
The inspectors will verify that the updating review is performed by:
1. Verifying that design and licensing documents have either been updated or are in the process of being updated to reflect the modifications: 1ST program procedures are updated to include new components, revised testing requirements, frequency, justifications, etc.
2. Verifying that significant plant procedures, such as normal, abnormal, and emergency operating procedures, testing and surveillance procedures, and licensed operator training manuals, are updated to reflect the effects of the modification prior to being used: inservice testing procedures should be updated or establishedfor new or modified components including establishing acceptance criteria in accordance with Code requirements. Scheduling of the inservice testing should also be reviewed to ensure testing will be conducted at the appropriate Code frequency.
3. If the plant modification added or deleted functions that could affect the plant specific SDP worksheets, inform the Regional SRA.
Based on the above attributes, the inspection procedure primarily addresses whether new components are assessed for inclusion in
the IST program, testing is performed in accordance with Code requirements, and the testing conducted after the modification adequately establishes or re-validates reference values, and verifying test results are adequately addressed within the Code requirements.
71111.19 Post-Maintenance Testing
Inspection Basis: Inadequate maintenance activities that are not detected prior to returning the equipment to service can result in a significant increase in unidentified risk for the subject system.
Inspection Requirements: The procedure requires the NRC resident inspector to review 20 to 28 post-maintenance testing activities in a year. As with the post-modification testing inspection procedure, the inspectors need to verify that IST reference values are rebaselined or re-validated, and any test result anomalies are adequately resolved. This inspection is accomplished as follows.
For each testing activity selected, the inspectors need to identify the affected component, and:
1. Review applicable licensing basis and/ or design-basis documents to identify the safety function(s) of the affected component.
2. Review the associated maintenance activity, to identify the safety function(s) that may have been affected by that activity.
3. Review the licensee's test procedure to verify that the procedure adequately tests the safety function(s) that may have been affected by the maintenance activity, that the acceptance criteria in the procedure are consistent with information in the applicable licensing basis and/or
NUREG/CP-0152, Vol. 42C-55

NRC/ASME Symposium on Valve and Pump Testing
design-basis documents, and that the procedure has been properly reviewed and approved: The testing needs to establish baseline or to re-validate baseline 1ST reference values.
Either witness the test and/or review the test data, to verify that:
1. The performance of the affected system(§) and/or component(s) satisfies the procedure's acceptance criteria: Appropriate testing is performed to satisfy Code requirements based on the maintenance activity performed (e.g. maintenance on a valve may require stroke-time testing, position indication testing, and leak rate testing).
2. The effects of testing on the plant have been adequately addressed.
3. The test equipment is calibrated, and is within its current calibration cycle.
4. The test equipment used is within its required range and accuracy: instrumentation meets the Code requirements for range and accuracy.
5. The applicable prerequisites described in the test procedure are satisfied.
6. The affected systems or components are removed from service in accordance with approved procedures.
7. The test is performed in accordance with the test procedure and other applicable procedures: testing meets Code requirements (e.g., for the disassembly/ inspection of a check valve to meet Code requirements, the first step would be the manual stoke of the disk).
8. Jumpers installed and/or leads lifted during testing are controlled and restored.
9. The test data/results are accurate, omplete, and valid: test results compared to applicable alert and required action range to determine if component requires additional testing (relief check, and power-operated valves), more frequent testing (pumps), declared inoperable.
10. The test equipment is removed after testing.
11. After completion of testing, equipment is returned to the position/status required to maintain the system operable, in accordance with approved procedures.
12. Any problems noted during testing are appropriately documented: Test deficiencies are entered into the corrective action program.
Based on the above attributes, the inspection procedure primarily addresses whether the testing conducted after the maintenance activity adequately establishes or re-validates reference values, testing is performed in accordance with Code requirements, and verifying test results are adequately addressed within the Code requirements.
71111.21 Safety System Design and Performance Capability
Inspection Basis: Inspection of safety system design and performance verifies the initial design and subsequent modifications and provides monitoring of the capability
of the selected system to perform its design basis functions. As plants age, their design bases may be lost and an important design feature may be altered or disabled during
a modification. The plant risk assessment model assumes capability of safety systems to perform its intended safety function successfully.
NUREG/CP-0152, Vol. 4 2C-56

NRC/ASME Symposium on Valve and Pump Testing
Inspection Requirements: The procedure requires the NRC regional inspectors to review one or two risk-significant systems used for mitigating an accident or maintaining barrier integrity. This inspection reviews the design and licensing basis for each system selected. This inspection is divided into the following three areas of review:
1. System, needs review could include the following attributes: process medium, energy source, controls, operator action and heat removal.
2. System condition and capability review could include the following attributes: installed configuration, operation, design, and testing.
3. Components selected review could include the following attributes: component degradation, equipment/ environmental qualification, equipment protection, component input/outputs, and operating experience.
It can be seen that inservice testing could address testing under system condition and capability and component degradation under the components selected. As part of this review, the inspectors are to verify that acceptance criteria for tested parameters are supported by calculations or other engineering documents to ensure that design and licensing bases are met. In addition, verify that individual tests and/or analyses validate integrated system operation under accident/ event conditions. These reviews will usually include pumps and valves that have safetyrelated functions to ensure that these functions are adequately tested to verify system design.
The review of the system could be conducted similar to that performed by NRC Inspection Procedure 73756. For the systems selected this would include the following:
1. Verify the program scope to ensure all components that perform a function that met the scoping requirement of the Code was included in the program;
2. Verify that components included in the program were adequately tested in accordance with the Code (including any design limitations);
3. Verify that cold shutdown and refueling outage justifications were adequate;
4. Verify that relief requests were approved (as required) by the NRC and were properly implemented taking into account any limitations discussed in the NRC's approval of the relief request; and
5. Verify that test results were properly dispositioned as required by the Code (e.g., pumps in required action range were declared inoperable until corrective action were implemented).
Based on the above attributes, the inspection procedure primarily focuses on verifying that systems/components are meeting their design requirements through testing. This procedure also has been used as discussed above to conduct an in-depth review of the licensee's IST program for the systems selected.
Conclusions
Since the implementation of the Reactor Oversight Process, the IST reviews conducted by NRC inspectors are being conducted in various manners and more frequently than the in-depth programmatic reviews of the past. These inspections are being conducted using risk-informed processes that ensure that the systems and components reviewed are safety significant. The ASME Code requirements for pump and valve testing continues to be revised and improved. The NRC has also allowed other testing alternatives such as risk-informed
NUREG/CP-0152, Vol. 42C-57

NRC/ASME Symposium on Valve and Pump Testing
IST programs and the use of ASME Code Case OMN-1 for performance-based testing of motor-operated valves. Since the 10-year update requirement for IST programs remains in place, licensee IST programs will continue to change and oversight of the programs by NRC inspectors will remain warranted.
References
NRC Generic Letter 89-04, "Acceptable Inservice Testing Programs" and associated "Minutes of the Public Meeting on Generic Letter 89-04," issued April 3, 1989.
Summary of Public Workshops held in NRC Regions on Inspection Procedure 73756, "Inservice Testing of Pumps and Valves," and Answers to Panel Questions on Inservice Testing Issues, July 1997.
NRC Inspection Procedure 73756, "Inservice Testing of Pumps and Valves," revised July 27, 1995.
NRC Inspection Procedure 71111.17, "Permanent Plant Modifications," revised January 17, 2002.
NRC Inspection Procedure 71111.19, "Post-Maintenance Testing," revised January 17, 2002.
NRC Inspection Procedure 71111.21, "Safety System Design and Performance Capability," revised April 3, 2000.
NRC Inspection Procedure 71111.22, "Surveillance Testing," revised January 17, 2002.
NRC Temporary Instruction 2515/114, "Inspection Requirements for Generic Letter 89-04, Acceptable Inservice Testing Programs," issued January 15, 1992.
NRC Temporary Instruction 2515/110, "Performance of Safety-Related Check Valves," issued November 19, 1991.
NUREG-1482, "Guidelines for Inservice Testing at Nuclear Power Plants," issued April 1995.
NUREG/CP-1052, "Proceedings of the Fourth NRC/ASME Symposium on Valve and Pump Testing, issued July 1996.
American Society of Mechanical Engineers (ASME) Boiler and Pressure Vessel Code, Section XI, Subsections IWP (for pumps) and IWV (for valves), 1986 Editions.
ASME/ANSI Operations and Maintenance Standard Part 1 (OM-1), "Requirements for Inservice Performance Testing of Nuclear Power Plant Pressure Relief Devices," 1981 Edition.
ASME/ANSI Operations and Maintenance Standard Part 6 (OM-6), "Inservice Testing of Pumps in Light-Water Reactor Power Plants," 1988 Edition.
ASME/ANSI Operations and Maintenance Standard Part 10 (OM-10), "Inservice Testing of Valves in Light-Water Reactor Power Plants," 1988 Edition.
ASME OMa Code for Operation and Maintenance of Nuclear Power Plants, ISTB, "Inservice Testing of Pumps in Light-Water Reactor Power Plants," 1996 Edition.
ASME OMa Code for Operations and Maintenance, ISTC, "Inservice Testing of Valves in Light-Water Reactor Power Plants," 1996 Edition.
ASME OMa Code for Operations and Maintenance, Mandatory Appendix I, "Inservice Testing of Pressure Relief Devices
NUREG/CP-0152, Vol. 4 2C-58

NRC/ASME Symposium on Valve and Pump Testing
in Light-Water Reactor Power Plants," 1996 Edition.
ASME OMa Code for Operations and Maintenance, Mandatory Appendix II, "Check Valve Monitoring Program," 1996 Edition.
Title 10 of the Code of Federal Regulations, Section 50.55a, "Codes and Standards," 1995 revision.
NUREG/CP-0152, Vol. 42C-59

Session 3(a)
Pumps II
Session Chair
John J. Zudans Public Service Electric and Gas

Evaluation of Performance For A Rotary Vane Compressor
Yuan Mao Huang and Sheng An Yang Department of Mechanical Engineering
National Taiwan University Taipei, Taiwan, Republic of China
Abstract
This study presented the experimental evaluation of the performance for a sliding vane rotary compressor. Pressure transducers were buried inside the covered plate of the compressor to measure air pressures of vane segments when the suction and compression of the compressor were completed. An encoder was installed on the output shaft of a motor to indicate angular locations of complete suction and compression of the compressor. Thermocouples were buried near the inlet and outlet ports of the compressor to measure air temperatures just before and after the complete suction and compression, respectively. The air flow rate of the compressor measured by an orifice flow meter was comparable with existing data. The compression power was calculated from these measured air pressures, temperatures and flow rate. The input shaft power was calculated based on the torque measured by a torque transducer. The calculated maximum efficiency of the compressor was 51.6% when the rotor rotational speed was 1300 rpm. The size or the shape of the inlet port should be modified and the materials of vanes with lower friction coefficients should be used to improve the efficiency of the next prototype compressor.
Keywords: measurement, performance, sliding vane, rotary compressor
Nomenclature
C L P
Q T V W n
r
t
v
T1
W0
constant power (W) air pressure (Pa) air flow rate (m3 Is) air temperature (K) volume (M 3) work (J) polytropic exponent compression ratio time (s) voltage (V) efficiency rotor rotational speed (rpm)
Subscripts
c : compression completed comp : compression s : suction completed shaft :input shaft
Introduction
The first single stage sliding vane rotary compressor was introduced in the early 1950s. Basic components of a compressor consist
NUREG/CP-0152, Vol. 43A-1

NRC/ASME Symposium on Valve and Pump Testing
of a rotor, a stator and sliding vanes. Rotors and stators are concentric or eccentric. The operation principles of these compressors are similar. The vanes slide outward and inward in the slots of the rotor. The vanes move outward due to the centrifugal force coming from the rotation of the rotor. Thus, the outer surface of the rotor, the vanes, and the inner contour of the stator form a volume segment. When the rotor rotates, the volume segment changes and the air is compressed. Because of
the lightweight, small size, simple mechanism and easy maintenance, the compressors are
commonly used in household refrigerators and automotive air conditioning systems.
A considerable amount of research has been conducted to improve sliding vane rotary compressors. Tothero and Keeney [1], Jordan [2] and Hickman and Neal [3] introduced eccentric sliding vane rotary compressors that mainly contained an oil separator. The oil was used to lubricate the compressor, seal clearances and absorb heat generated by compression. Edwards [4] introduced an eccentric sliding vane rotary compressor with controlling the motion of vanes. Roller bearings at both ends of vanes followed the paths of cams on two side plates of the compressor. The tips of vanes did not contact
with the inner contour of the stator to reduce mechanical friction loss. Taguchi et al. [5]
developed an eccentric sliding vane rotary compressor that mainly equipped with a
mechanism to control the capacity of the compressor by changing the starting time of
the gas suction. Isobe et al. [6] introduced a sliding vane rotary compressor with the concentric rotor and stator that were made of Al-Si alloy to reduce the weight of the compressor. A smooth inner contour of the stator was designed to reduce fluctuation of
the torque. The vanes were thin and treated with boron to reduce abrasion against the rotor
and the power consumption. Nakajima and
Hill [7] introduced a concentric sliding vane rotary compressor that mainly contained a
mechanism called the "radial piston structure" to control the capacity of the compressor by changing the starting time of the gas suction.
Smith et al. [8] introduced an eccentric sliding vane rotary compressor and simulated the
motion of vanes with the motion of a four bar
linkage to eliminate chattering and to improve
the life and performance of the compressor. Zheng et al. [9] introduced an eccentric sliding vane rotary compressor that mainly contained a mechanism called the "load-relief device" to reduce the friction between the vane tip and the stator inner contour. Gui et al. [10] introduced an eccentric sliding vane rotary compressor and modified the curvature of the
stator inner contour to maximize the flow rate and the compression ratio and to minimize the
exhaust resistance, internal leakage and heat
generated by friction. Edwards [11] introduced an eccentric sliding vane rotary compressor with a mechanism called the "orbital vane mechanism" to reduce mechanical friction loss
by controlling the motion of vanes.
Fukuta et al. [12] and Tramschek and Mkumbwa [13] generated experimental systems that could measure air pressures at the inlet and the outlet ports of the eccentric
sliding vane rotary compressors. Pressure transducers were buried in the stator or the
rotor to measure the air pressures in the vane segments of the compressor with respect to
time [14-19]. From the rotational speed and
the operating time, the angular displacement of the rotor could be determined; therefore, the air pressure with respect to the location of
the vane segment could be determined for a
specified constant rotational speed of the rotor
A sliding vane rotary compressor without the
oil lubrication system was built as shown in Fig. 1 [20]. The purpose of this experimental study was to build an experimental system
NUREG/CP-0152, Vol. 4 3A-2

NRC/ASME Symposium on Valve and Pump Testing
to evaluate the performance of a sliding vane rotary compressor, provide information to compare with the calculated results obtained from Huang [20] and improve the performance of the compressor. Air pressures in vane segments where the suction and compression processes of the compressor were completed and air temperatures at the inlet and outlet ports near the complete suction and- compression vane segments were measured. These measured data could be used to calculate the polytropic exponent of the assumed polytropic compression process. The air flow rate and the input shaft power of the compressor were also measured. Thereafter, the compression power and the efficiency of the compressor could be calculated.
Method of Approach
The cross sections of the stator inner contour and the rotor are elliptical and circular shapes, respectively. A rotor with ten slots for ten sliding vanes is inside the stator. When the rotor rotates and the vanes slide inward, the volume segments are changed and the air is compressed.
The experimental equipment includes the compressor, motor, frequency converter, fan, encoder, data recorder, pressure transducers, thermocouples, torque transducer and orifice flow meter. The motor drives the rotor of the compressor. The frequency converter controls the rotational speed of the rotor. The fan cools the compressor. Pressure transducers of the strain gage type are used to measure air pressures when the suction and compression of the compressor are completed. The frequency response of the pressure transducer is 50 kHz. The encoder is used to measure angular location of the rotor. The data recorder receives and records the signals from pressure transducers and the encoder. The K-type thermocouples are used to measure
air temperatures near the inlet and the outlet ports of the compressor just before and after the complete suction and compression, respectively. The torque transducer is used to measure the input shaft power of the compressor. The orifice flow meter is used to measure the air flow rate of the compressor.
Figures 2, 3 and 4 are the right view, front view and schematic drawing of the experimental equipment setup, respectively.
Pressure transducers, as shown in Fig. 5, were buried inside the covered plate of the compressor to measure the air pressure of vane segments when the suction and the compression of the compressor were completed. The locations of the measurement were related to the specific angular locations of the rotor according to signals from an encoder that was installed on the output shaft of the motor and released a voltage signal in each degree of the rotor and a reference voltage signal in every revolution of the rotor. During the experiment, a recorder received and recorded signals from the pressure transducers and the encoder and results of data are shown in Fig. 6. The reference angular location was identified before the experiment. Therefore, the angular locations of the rotor could be identified according to this reference angular signal. Comparing the pressure signals with the angular signals where the suction and the compression of the compressor were completed, the air pressures when the suction and compression processes were completed could be obtained.
Thermocouples were buried near the inlet and outlet ports of the compressor to measure air temperatures. The angular locations of the vanes when the suction of the compressor is completed and the locations of the pressure transducer and thermocouples are shown in Fig. 7. The angular locations of the vanes
NUREG/CP-0152, Vol. 43A-3

NRC/ASMIE Symposium on Valve and Pump Testing
when the compression of the compressor is completed and the locations of the pressure transducer and thermocouples are shown in Fig. 8. It is assumed that the temperatures measured near the inlet and outlet ports of the compressor are the same as the temperatures where the suction and compression of the compressor are completed. The equation of
the assumed polytropic compression process is
I-n 1-n TPn =T n
(1)
The polytropic exponent n can be calculated from the air pressures and temperatures when the suction and compression of the compressor are completed.
The torque transducer that could measure the input shaft power of the compressor, L 'Aa, was
installed on the shaft between the motor and the compressor. The orifice flow meter which could measure the air flow rate was installed outside the outlet port of the compressor.
The equation of the assumed polytropic compression process can also be written as
PV' =C (2)
The equation of the thermodynamic work is
PdV f V--dV w = j_• Rs J1
1 ~PA2
The compression power can be calculated from
L'1,mp = -PIQ[1-(-I) anc th c
and the efficiency of the compressor is
Lcomp = Lshf
(5)
The experimental processes are as follows:
(1) Turn on the power of the frequency converter, the fan and measurement instruments.
(2) Set the specific rotational speed of the rotor on the frequency converter and press the start button to drive the compressor.
(3) Press the start button of the data recorder to record the angular signals of the motor shaft and air pressures. Record air temperatures during the operation.
(4) After air temperatures reach the steady state, press the stop button of the data recorder and download the file. Check the air pressure from the file and record them.
(5) Record the air flow rate and the input shaft power. Reset another rotational speed of the rotor and repeat steps (3) to (5).
(6) After finishing the experimental measurement, turn off the frequency converter, the fan and measurement instruments.
Results
The vanes of the compressor used in this experimental study were made of aluminum alloy with a friction coefficient of 0.15. The rotor and the stator were made of
(3) medium carbon steel. The data and operating conditions of the compressor are shown in Table 1, where the angular location of the vane is measured from the horizontal axis to
the center of the vane.
(4) The air temperatures in the suction segment and the compression segment when the suction and compression are completed versus
NUREG/CP-0152, Vol. 4 3A-4

NRC/ASME Symposium on Valve and Pump Testing
Table 1 Data and operating conditions
item value
number of vane 10 pieces
vane length 35 mm
vane width 151.8 mm
vane thickness 4.95 mm
stator major axis length 152.5 mm
stator minor axis length 116.9 mm
stator thickness 152.02 mm
rotor diameter 116.8mm
rotor thickness 151.8 mm
angular location of trailing vane when suction is completed 72
angular location of trailing vane when compression is completed 115
flow velocity of cooling air 10 m/s
flow area of cooling air 0.43 m2
ambient air pressure 100.3 kPa
ambient air temperature 289 K
relative humidity 56%
time from 0 to 36600 seconds for the rotor rotational speed increased from 0 to 1400 rpm are shown in Fig. 9. Similarly, the transient air pressures versus the rotor rotational speed in the suction segment and compression segment are shown in Figs. 10 and 11, respectively. The increment of the rotor rotational speed during the measurement of the air pressure is 50 rpm. The data points as shown in Figs. 10 and 11 at a specific rotor rotational speed represent the transient data when the rotor rotational speed is increased from previous speed to the specific speed. After the air temperatures reach the steady state at a specific rotor rotational speed, the air pressures in the suction and compression segment are shown in Figs. 12 and 13, respectively. The compression ratios obtained from the ratios of the data in Fig. 11 to Fig. 10 and Fig. 13 to Fig. 12 are shown in Figs. 14 and 15, respectively. The measured and calculated air flow rates versus the rotor rotational speed are shown in Fig. 16. The calculated polytropic exponent versus the
rotor rotational speed is shown in Fig. 17. The measured input shaft power and the calculated compression power versus the rotor rotational speed are shown in Fig. 18. The calculated efficiency versus the rotor rotational speed of the compressor is shown in Fig. 19.
Discussion
When the frequency converter controls the rotational speed of the rotor, it emits electrical magnetic pulses that interfere with the signals of sensors. Therefore, the data in the data recorder will include noise. In order to prevent these pulses from occurring, all of the sensors are covered with aluminum foil and connected to the ground. Hence, the data recorder can receive clean signals.
Due to the effects of the compression and mechanical friction, the compressor acts like a heat source during operation. The temperature of the air around the compressor is raised by this source. Therefore, the air temperature
NUREG/CP-0 152, Vol. 43A-5

NRC/ASME Symposium on Valve and Pump Testing
flowing into the vane segment is higher than the ambient air temperature as shown in Fig. 9. In addition, the compression and
mechanical friction power of the compressor
are increased when the rotor rotational speed
is increased. Therefore, the air temperatures in
the suction segment and compression segment
as shown in Fig. 9 are increased from 0 to
36600 seconds when the rotor rotational speed
is increasedfrom 0 to 1400 rpm.
Similarly, the air pressure flowing into the
vane segment is higher than the ambient air
pressure, as shown in Figs. 10 and 12. And
when the air temperatures reach steady state,
the air pressures in the compression segment
are increased when the rotor rotational speed
is increased as shown in Figs. 11 and 13.
In Figs. 10 and 12, the air pressure in the
suction segment is increased when the rotor
rotational speed is increased from 500 to
950 rpm, and decreased when the rotor
rotational speed is increased from 950 to
1400 rpm. When the rotor rotational speed
is lower than 950 rpm, the effect of heat
increases the air pressure while increasing
the rotor rotational speed. When the rotor
rotational speed is higher than 950 rpm, the
amount of air flowing into the suction segment
maybe significantly decreased. In addition, the
effect of heat and pressure difference between
the ambient air and the air inside the vane
segment are not large enough. Consequently, the air pressure in the suction segment decreases when the rotational speed of the rotor is increased.
Since the air pressure in the compression segment is increased and the air pressure in
the suction segment is decreased when the
rotational speed of the rotor is increased, the pressure ratio of the air, the compression
ratio, in the compression segment to air in
the suction segment is increased when the
rotational speed of the rotor is increased as shown in Figs. 14 and 15.
Figure 16 shows that the air flow rate is
increased when the rotor rotational speed is increased. The measured results are
comparable with the existing data [20]. The
maximum deviation between the calculated results and the measured data is 9.4x 10⁴ m3Is.
The polytropic exponent n of the assumed
polytropic compression process is
T P TC PS (6)
The value of the polytroic exponent is mainly
affected by the natural logarithm ratios of
the air temperatures and pressures in the
suction and the compression vane segment, as shown in Figs. 20 and 21. Therefore, the
polytropic exponent fluctuates with the rotor
rotational speed as shown in Fig. 17. Based on the extrapolation of the data, the polytropic
exponent at the rotor rotational speed of
2000 rpm is 1.46 that is higher than 1.35 used
in the previous analysis [20]. The reason is
that the vanes of the compressor were made
of less expensive aluminum alloy. The friction
coefficient of aluminum alloy is 0.15 that is
higher than Vespel of 0.11 used in the previous analysis [20]. Therefore, the vanes made of
aluminum alloy generate more friction power than the vanes made of Vespel.
When the rotor rotational speed is increased,
the air flow rate and mechanical friction
are increased. Therefore, the calculated
compression power, Lcomp, and the measured
input shaft power, LShaft, are increased when
the rotor rotational speed is increased as shown in Fig. 18.
Figure 19 shows the efficiency of the
compressor is increased when the rotational
NUREG/CP-0152, Vol. 4 3A-6

NRC/ASME Symposium on Valve and Pump Testing
speed is increased up to 1300 rpm. The maximum efficiency is about 51.6% when the rotor rotational speed is 1300 rpm. Since the maximum efficiency is obtained, the experiment is terminated at the rotor rotational speed of 1400 rpm. The accuracy of the pressure transducers, the thermocouples, the air flow meter and the torque transducer are 0.25%, 1.5%, 1.5% and 0.5%, respectively. The maximum uncertainties of the air pressure, the air temperature, the air flow rate and the input shaft power obtained from the experiment are -0.38 kPa, ±1.5°C, -5 x 10⁴ m3/s and ± 15W, respectively.
Conclusion
The performance of the sliding vane rotary compressor was evaluated with the aid of the polytropic exponent that was calculated from the air pressures in vane segments where the suction and the compression of the compressor were completed and the air temperatures at the inlet and outlet ports near the complete suction and compression vane segments. These air pressures and temperatures were measured by the method of using the encoder utilized with pressure transducers of the strain gage type and the K-type thermocouples.
The air pressure in the suction segment is decreased when the rotor rotational speed is increased over 950 rpm. The size or the shape of the inlet port should be modified. If the air pressure in the suction segment is not decreased, the air pressure in the compression segment will be increased. The performance of the compressor will also be increased.
Air temperatures in both suction segment and compression segment, the compression ratio, the air flow rate, the compression power and the input shaft power are increased when the rotor rotational speed is increased. The maximum efficiency of the compressor is
51.6% when the rotor rotational speed is 1300 rpm.
Since the polytropic exponent constant obtained in this study is higher than 1.35 that was used in the previous analysis, the material with the lower friction coefficient should be used in the next prototype of the compressor to allow increasing of the rotor rotational speed safely and provide the necessary data for improvement of the previous calculated results with the rotor rotational speed of 2000 rpm.
Acknowledgement
The authors would like to express their sincere thanks to the National Science Council of the Republic of China for the grant NSC 89-2212E-002-127 for funding this investigation and to professor Grant D. Huang for comments and revisions made on this manuscript.
References
[1] Tothero, D. L., and Keeney, D. F., 1978, "A Rotary Vane Compressor for Automotive Air Conditioning Applications," Proceedings of the 1978 International Compressor Engineering Conference, pp. 226-232.
[2] Jordan, E. R. W., 1979, "Development and Principles of the Rotary Sliding Vane Compressor," Hydraulic Pneumatic Mechanical Power, 26, No. 296, pp. 341343.
[3] Hickman, C., and Neal, W. E. J., 1984, "Implications of Cooling Rotary Sliding Vane Heat-Pump Compressors," International Journal of Ambient Energy, 5, No. 4, pp. 207-212.
[4] Edwards, T. C., 1988, "The Controlled Rotary Vane Gas-Handling Machine," Proceedings of the 1988 International
NUREG/CP-0152, Vol. 43A-7

NRC/ASME Symposium on Valve and Pump Testing
Compressor Engineering Conference, pp. 407-415.
[5] Taguchi, T., Abe, Y., Maruyama, T., Aburaya, K., and Kagoroku, N., 1988, "New Capacity Control in Vane Rotary Type Compressor for Automotive Air Conditioners," Proceedings of the 1988 International Compressor Engineering Conference, pp. 424-431.
[6] Isobe, A., Kondo, M., Suzuki, S., and Suzuki, S., 1990, "Development of SV-06 A/C Compressor for Mini-Car Applications," Society of Automotive Engineers Transactions, 99, No. 6, pp. 345-351.
[7] Nakajima, N., and Hill, W. R., 1990, "New Rotary-Type Continuous Variable Capacity Compressor for Automotive Air Conditioners," Society of Automotive Engineers Transactions, 99, No. 6, pp. 1509-1517.
[8] Smith, I. K., Harrison, H. R., and Cox, M., 1992, "A Preliminary Evaluation of the Groll Rotary Vane Compressor," International Journal of Refrigeration, 15, No. 2, pp. 69-73.
[9] Zheng, Y., Li, D., Yang, Y., Deng, D., Xing, Z., and Shu, P., 1992, "Development of a New Generation of Sliding Vane Compressor," Proceedings of the 1992 International Compressor Engineering Conference, pp. 413-419.
[10] Gui, F., Rahman, M. M., and Scaringe, R. P., 1993, "Development of Compact, Lightweight, High-Performance SlidingVane Rotary Compressors for Heat Pump Applications," Proceedings of the 1993 Intersociety Energy Conversion Engineering Conference, 1, pp. 885-890.
[11] Edwards, T. C., 1994, "Initial Development of the Orbital Vanelm
Compressor," Proceedings of the 1994 International Compressor Engineering Conference, pp. 311-316.
[12] Fukuta, M., Yanagisawa, T., Shimizu, T., and Suzuki, Y., 1995, "Mathematical Model of Vane Compressors for Computer Simulation of Automotive Air Conditioning Cycle," JSME International Journal, Series B, 38, No. 2, pp. 199-205.
[13] Tramschek, A. B., and Mkumbwa, M. H., 1996, "Experimental Studies of Non-Radial Vane Rotary Sliding Vane Air Compressors During Steady Operation," Proceedings of the 1996 International Compressor Engineering Conference, pp. 485-492.
[14] Lindemann, H., Kaiser, H., Kuever, M., and Kruse, H., 1982, "Optimization of a Special Shaped Rotary Vane Compressor-Comparison of Theoretical and Experimental Results," Proceedings of the 1982 International Compressor Engineering Conference, pp. 193-200.
[15] Maruyama, T., Yamauchi, S., and Kagoroku, N., 1982, "Capacity Control of Rotary Type Compressors for Automotive Air-Conditioners," Proceedings of the 1982 International Compressor Engineering Conference, pp. 284-291.
[16] Kruse, H., 1982, "Experimental Investigation on Rotary Vane Compressors," Proceedings of the 1982 International Compressor Engineering Conference, pp. 382-388.
[17] Tromblee, J. D., 1984, "Performance Analysis of a Sliding-Vane Rotary Compressor for a Household Refrigerator/Freezer," Proceedings of the 1984 International Compressor Engineering Conference, pp. 40-45.
NUREG/CP-0152, Vol. 4 3A-8

NRC/ASME Symposium on Valve and Pump Testing
[18] Kaiser, H., and Kruse, H., 1984, "An Investigation on Reciprocating and Rotary Refrigeration Compressors," Proceedings of the 1984 International Compressor Engineering Conference, pp. 611-617.
[19] Maruyama, T., Yamauchi, S., Kagoroku, N., and Abe, Y., 1986, "Capacity SelfControllable Rotary Type Compressors
for Automotive Air-Conditioners (2nd Report, Design Theory of Multi-Vane Type)," Bulletin of JSME, 29, No. 258, Paper No. 258-34, pp. 4209-4217.
[20] Yuan Mao Huang, 1999, "The Performance and Fluid Properties of a Rotary Compressor, "ASME PVPVol. 396, pp. 99-104.
NUREG/CP-0152, Vol. 43A-9

NRC/ASME Symposium on Valve and Pump Testing
Figure I Schematic drawing of rotary vane compressor
thermoroupeI pressure transducer thermocouple
compressor data recorder
Figure 2 Right view of experimental equipment setup
encoder motor torque transducer fan
frequency converter orifice flow meter compressor
Figure 3 Front view of experimental equipment setup
NUREG/CP-0152, Vol. 4
NRC/ASME Symposium
on Valve and Pump Testing
3A-10

NRC/ASME Symposium on Valve and Pump Testing
quency convener pressure transducer
Figure 4 Schematic drawing of experimental equipment setup
outlet cover plate pressure transducer
inlet tflermocouple outlet
Figure 5 Locations of pressure transducers
reference angular signal
0 600 1200 1800 time t (s) x 10-1 pressure signal of suction zone
Figure 6 Signals of angular location and air pressure
NUREG/CP-0152, Vol. 43A-11

NRC/ASME Symposium on Valve and Pump Testing
thermocouple pre
Figure 7 Angular loca
thermocouple pressure
F/
tions of vanes after completing suction
Figure 8 Angular locations of vanes after completing compression
-#---suction segment n compression segment
0 10000 20000 30000 40000
time t (s)
Figure 9 Air temperature in suction segment and compression segment versus time
NUREG/CP-0152, Vol. 4
I
E .)
370 350
330
310
290
3A- 12

NRC/ASME Symposium on Valve and Pump Testing
-, 104 S103 I E .
a. 102 St 101 I!
"• 100 I. •" 99
500 800 1100 1400
rotor rotational speed w (rpm)
Figure 10 Transient air pressure in suction segment versus rotor rotational speed
(155
a- 140 3N
CD 125
" 110,
500 800 1100 1400
rotor rotational speed w (rpm)
Figure 11 Transient air pressure in compression segment versus rotor rotational speed
104
~103L n102 I -•101,
j 100 L I. •"99•
500 800 1100 1400
"rotor rotational speed w (rpm)
Figure 12 Air pressure in suction segment during steady air temperatures versus rotor rotational speed
NUREG/CP-0 152, Vol. 43A-13

NRC/ASME Symposium on Valve and Pump Testing
155
_140
S125 1 -A
C- 110
500 800 1100 1400
rotor rotational speed w (rpm)
Figure 13 Air pressure in compression segment during steady air temperatures versus rotor rotational speed
o1.6 .
c-1.4 Iu l .2a
a)1.2
E 1_ _ _ _ _ ' o 1
500 800 1100 1400
rotor rotational speed w (rpm)
Figure 14 Transient compression ratio versus rotor rotational speed
o1.6 c 1.4i mEmi
1.2 1.2 a 0 a3 3 * 0 a*
E 8 1
500 800 1100 1400
rotor rotational speed w (rpm)
Figure 15 Compression ratio during steady air temperature versus rotor rotational speed
NUREG/CP-0152, Vol. 4
NR C/ASME Symposium on Valve and Pump Testing
3A- 14

NRC/ASME Symposium on Valve and Pump Testing
- measured - Huang [20]
0.03
0.02
0.01
0800 1100
rotor rotational speed w (rpm)
1400500
Figure 16 Air flow rate versus rotor rotational speed
2.2
c 2.1 0
CL S2
. 1.9
2 1.8 o 1.7 CL
500 800 1100
rotor rotational speed w (rpm)
1400
Figure 17 Polytropic exponent versus rotor rotational speed
"---compression power inputshaft power
1800
1200
600
0 500 800 1100 1400
rotor rotational speed w (rpm)
Figure 18 Calculated compression and measured input shaft powers versus rotor rotational speed
NUREG/CP-0152, Vol. 4
E
CD
0
-J
0 0.
3A-15

NRC/ASME Symposium on Valve and Pump Testing
800 1100
rotor rotational speed w (rpm)
Figure 19 Efficiency versus rotor rotational speed
aIn(TsFTc) w ln(Pc/Ps)
0.6
0.4
.S 0.2
0
-0.2
800 1100
rotor rotational speed w (rpm)
Figure 20 Natural logarithm versus rotor rotational speed
800 1100
rotor rotational speed w (rpm)
Figure 21 Natural logarithm ratio versus rotor rotational speed
NUREG/CP-0152, Vol. 4
55
40
.- 25
10
500 1400
500 1400
-0.4
0-0.45 C:
t- -0.5
C-
-0.55 500 1400
Valve and Pump TestingNRC/ASME Symposium on
3A-16

Effects of Impeller Underfiling and "B" Gap Enlargement on a Horizontal Centrifugal Pump
Thomas C. Setzer PSEG Nuclear LLC.
Abstract
Rotating equipment maintenance is a top priority in keeping a plant running safely, reliably and cost effectively. The difference between top performance and sub-par performance can come down to rotating equipment issues that could have been easily avoided. It is important not only to maintain equipment performance, but also to investigate maintenance techniques and modifications to regain lost performance. Detecting degraded performance can be accomplished through vibration monitoring. Vibration monitoring and taking the appropriate actions to limit the levels of vibration are both top priorities in effectively maintaining rotating equipment. High vibration levels can lead to unplanned corrective maintenance, forced outages and inevitable loss of revenue due to down time. Specifically for centrifugal volute pumps, vibrations in the order of vane-pass frequency are inherent and sometimes excessive to the point of required action. This vanepass component is not expected to cause catastrophic failure, but can contribute to the long-term degradation of vital pump components, such as bearings and wear rings. In addition to vane-pass vibration, normal degradation of the impeller and its vanes can also lead to inefficiency and decreased performance. It is therefore to the owner's advantage to perform the appropriate
maintenance and modifications on the equipment to optimize life and efficiency of the machine and its components.
One preventive maintenance method, which may regain lost impeller performance in centrifugal pumps, is underfiling. This technique is a grinding of the impeller vane suction face both at the leading and trailing edge in order to change the trailing edge angle and vane spacing. The increased vane spacing and increased trailing edge angle may help regain lost head and flow. Another preventive maintenance method, which may reduce vane-pass frequency vibration, is through volute trimming. Enlarging the "B" Gap of the volute tongue can decrease the pulsations and forcing function causing the vane-pass vibration. Either of the two methods or both together may revitalize a degrading pump.
PSEG Salem and Hope Creek Nuclear Facility was chosen as the subject company for the underfiling experiment. A spare rotating element for the #12 Component Cooling Pump system was used as the model to perform the underfiling and the "B" Gap enlargement was performed on the casing for the Component Cooling pump. This paper explains in detail the evolution of underfiling and "B" Gap enlargement and also reports data and conclusions from the pump retest after the
NUREG/CP-0152, Vol. 43A-17

NRC/ASME Symposium on Valve and Pump Testing
newly filed rotating element was installed and placed in service.
Introduction to Impeller Underfiling
Impeller underfiling is the act of removing impeller material from the underside of each vane (See Figure 1). This is accomplished with a handheld rotary grinder with various bits to grind the material away slowly and evenly to produce a more desirable smooth contour. Due to the precision required for satisfactory results, the job can be rather time consuming. However, the time to perform the filing correctly can be nominal when compared to the possible benefits gained from a properly profiled impeller.
A cast made impeller bought from a pump vendor may be delivered with little to no finishing work done to it (See Figure 2). The impeller should show signs of balancing, but the trailing edges and leading edges of the vanes may not be uniform. Contributing factors to this absence of uniformity can be poor casting, poor machining and mishandling. These factors, along with many others can contribute to a multitude of problems that lead to poor impeller performance. It is of great probability that a poorly profiled impeller will cause problems such as inadequate head, decreased efficiency and elevated vibrations. For pumps required to deliver a specific head, flow and limited vibration level, a properly profiled impeller can add to the likelihood of satisfying that requirement. The problems associated with an improperly profiled impeller are discussed in more detail in the following sections.
Analysis of Impeller Before Underfiling-Flow Velocity Triangle Formulation
To accurately analyze the flow characteristics within a pump impeller before and after
underfiling, velocity triangles are sketched at both scenarios and compared. From velocity triangles, many pump characteristics can be calculated such as pressure rise across the rotor, pump head, slip coefficient and many others. For the following discussion, the definitions below are offered, for brevity:
V2
VU2 Vm2
W 2
WU2
P32
U2
H.
g d A2
Q lip TDH
absolute velocity leaving the vane of the impeller component of V2 along "U"
meridian velocity component of V2
relative velocity leaving the vane of an impeller component of W2 along "U"
meridian velocity component of W2
vane angle at trailing edge of vane
impeller speed at vane tip
ideal head gravitational acceleration vane spacing flow area at impeller exit flow pump efficiency
Total Developed Head
All the above definitions with the added subscript "F" denote "after filing"
Figure I shows the material to be removed during the underfiling of an impeller with backward curved vanes. When analyzing the impeller at the same flow (Q = constant) before and after underfiling, it can be seen in Figure I that the material removed at the trailing edge has changed the original angle
02 to a new, increased angle 0 2F. Analyzing conditions at the same flow is indicative of systems, such as High Pressure Coolant Injection at Hope Creek Generating Station, where a set flow of 5600 gpm is required regardless of impeller profiling. As can be
NUREG/CP-0 152, Vol. 4
NRC/ASME Symposium
on Valve and Pump Testing
3A-18

NRC/ASME Symposium on Valve and Pump Testing
seen in Figure 3, Figure 4, and Figure 5, the increased vane angle has increased Vu to V .a
Now, considering the increase in V,, to V2F
and given equation 1:
H= U2g (1)
it can be easily seen that due to underfiling, increasing VU2 increases the pump's Ideal Head while flow has been held constant.
Through trigonometric analysis of the velocity triangle in Figure 3, an alternate form of VU2
in equation 1 can be found and the pump's Ideal Head can be rewritten as equation 2 below. Equation 2 relates P2 and Ideal Head along with flow and flow area at impeller exit.
Ug-Iacotfl2 H I =U, g 4 (2)
Once again, increasing P2 increases the pump's Ideal Head.
Recall that for this situation we held flow and, consequently, speed constant in the analysis. Now the impeller is producing more head at the same speed after the underfiling. We know this because of Similitude, or Laws of Affinity given by equation 3:
N1 N. (3)
Due to the increased head while holding speed constant, we can now decrease the speed of the machine to produce the original head. For turbine driven pumps in systems such as High Pressure Coolant Injection (HPCI) at Hope Creek Generating Station, underfiling can allow for a decrease in turbine speed.
Reiterating, with all other factors held constant, an increase in head for this system can be predicted due to underfiling the impeller. Referring once again to Figure 1, underfiling will also increase the vane spacing and consequently the discharge area. This increase in discharge area decreases the meridian velocity component from V m2 to V iF at any given capacity "Q". Once again, head is predicted to increase. It is also likely, but not definite that maximum efficiency of the pump is improved and may be moved to a higher capacity.
For systems in which flow is not required to be held constant such as Component Cooling or Containment Spray at Salem Generating Station, the result is different, but still desirable. As can be seen in Figure 6, Figure 7, and Figure 8, the underfiling is the same as in the previous scenario but this time we analyze the characteristics at the same head (H = constant). Here we can see that the result is an increase in the meridian velocity component from V m2 to V m2. In this situation, flow is varying due to the increase in Vm,2.
Volute Tongue Trimming
For volute pumps, it is suggested that in conjunction with underfiling, the volute tongues in the casing be inspected and, if necessary, filed and trimmed. As the impeller vane passes the volute tongue, a compression and pulsation in the flow occurs. This forcing function is due to the gap, commonly referred to as the "B" Gap dimension, being too small. This gap is measured from the impeller vane tip to the volute tongue and expressed as a percentage of impeller diameter. This pulsation is measured in vibration analysis and is called vane-pass frequency. If an impeller has 5 vanes, its vane-pass frequency will occur at 5X running speed. While this type of vibration is inherent and sometimes excessive
NUREG/CP-0152, Vol. 43A-19

NRC/ASME Symposium on Valve and Pump Testing
in volute pumps, it is possible to minimize by opening the "B" Gap dimension to allow for a larger area between the impeller and the tongue. Figure 9 and Figure 10 show pictures of volute tongues in a single stage, double suction centrifugal pump. Trimming the volute tongue to increase the Gap B dimension in excess of 8% would be desired. Before performing any volute trimming, the existing Gap B dimension needs to be verified before any modification is made.
Underfiling Results-Progress In Underfiling
As discussed earlier, the art of underfiling is grinding material away from the underside of each vane to achieve a smooth contour. The entire evolution is certainly time consuming but essential for success. Depending on the initial roughness of the casting, initial grinding to remove bulk material will need to be done and may take considerable time. Using a double cut rotary file, a majority of the unwanted material can be removed rather quickly. As shown in Figure 11, the beginnings of a smooth contour can be seen. The vane walls are beginning to become more perpendicular to the trailing edge and the vane tips are becoming more square and uniform as well.
In addition to underfiling material from the trailing edges, the leading edges need to be underfiled as well. This also depends on the initial roughness of the casting. Initial grinding to remove bulk material may be needed. Again by using a double cut rotary file, a majority of the unwanted material can be removed. As shown in Figure 12, the leading edges have been filed and then ground smooth with a single cut rotary file.
Final grinding and polishing can be done with a single cut rotary file. The vane passages
must be smooth to the touch and the eye. Vane walls need to be parallel and uniform with respect to each other. All discontinuities and imperfections should be removed then polished smooth. The final product is shown in Figure 13. The impeller has been completely underfiled on both its trailing and leading edges. The rotating assembly was then balanced, both as individual parts and as a whole. If the impeller being modified is being worked in an offsite location, proper storage and handling must be observed. Figure 14 shows the proper preparations taken for storage and shipment. The impeller should be installed with the seal sleeves on the shaft. Protect the shaft from scoring as shown in Figure 14.
Power Considerations
Underfiling, and any other modification to a pump's performance, can have effects that go beyond the pump's realm. By gaining more head and flow from underfiling, one must consider the repercussions on the driver and its power supply. If the driver speed is not changed, the power required to drive the pump is increased. This increase must be accounted for and analyzed for its proximity to maximum loading. In the case of the Component Cooling pumps at Salem, the motor power supply is backed by an emergency diesel generator in the event of a loss of offsite power. The generator driven by the diesel has its limit on power production and, if margin is low, the increased performance could lead to devastating consequences, such as loss of backup diesel power. It is therefore mandatory that the motor's power demand and delivery to the pump be analyzed for the increases that result from an underfiling project.
Calculating the new hydraulic horsepower requirements is done by the following:
NUREG/CP-0152, Vol. 4 3A-20

NRC/ASME Symposium on Valve and Pump Testing
(TDH) (Q) (sp.gr) HPhd= 3965 (4)
where the sp.gr. is 1 in 12 Component Cooling pump. Next, calculating the brake horsepower is done by the following
BHP= HP ,a VP (5)
Figure 15 shows the increases in both performance and horsepower requirements for the underfiled impeller.
Vibration Effects of "B" Gap Enlargement and Underfiling
The foregoing sections discussed pump performance changes as a result of underfiling. Another factor affected by underfiling is within the vibration analysis of the machine. Underfiling and properly contouring vane passages may reduce vibration levels. Flow disruptions occur when the vane passage is rough and not uniform with respect to the other vanes. When trailing edges of impeller vanes are not square to the passage or rough, pulsations and increased turbulence can result. These pulsations can drive the overall vibration level to an increased value and pose risk to acceptability should a specified vibration level be required.
Upon installation of 12 Component Cooling Pump, a change to the bearing "clamp" was performed on both the inboard and the outboard bearing caps. The clearance between the bearing cap and the bearing housing was removed and instead a 0.001" clamp was applied to each bearing housing. This change in clearance and the significant effects on the vibration levels is shown in later sections.
Upon completion of the underfiling and volute tongue trimming of 12 Component Cooling Pump, an in-service test was performed in accordance with In Service
Testing (IST) programmatic procedures. In summary, flow is set to achieve a flowrate of 4895 gpm +/- 80 gpm, and the data is then recorded. The flowrate is a combination of flow through the 12 residual heat removal (RHR) heat exchanger and 13 chemical and volume control (CVC) positive displacement pump flow. Both flow and vibration data are collected in the In Service Test and are used as criteria to declare the pump operable or inoperable.
12 Component Cooling Pump was tested on 9/29/00 immediately following the volute tongue trimming. Its most previous data collection prior to 9/29/00 was on 8/31/00. For the test on 9/29/00, both flow and vibration data were collected as required; and, in summary, the following was reported (each will be discussed in detail in the following pages).
Vibration Analysis
Each point on the motor fell within the required limits for acceptance. Increases were found on four out of six points (1A, IV, 2A, 2V) but were only on the order of +0.01 in/see. These increases are determined to be insignificant, and no significant motor degradation is assumed. The data on the motor is indicative of normal motor operation and, thus, no emergent work is necessary.
A total of eight overall vibration points experienced some increase in level while four experienced a slight decrease in level when compared to the most recent test prior to these maintenance actions. These points are analyzed separately in the following sections.
*NOTE: For each vibration spectrum plot,
data taken on 9/29/00 is the data represented in blue and the data taken on 8/31/00 is immediately in front of the 9/29/00 data
NUREG/CP-0 152, Vol. 43A-21

NRC/ASMEf Symposium on Valve and Pump Testing
Pump Inboard 3A- Low Range PLANT: Sele Urd I MACHINE: 1CCE04 #12 COMPONENT COOLING PUMP 405P 1782.1 CPM, 1.0OX.0.195 inft., 092920008 :40 Axial
0.05 0.045
0,04 0.035
S0.03 S0.025 - 0.02
0.015 001
0.005. --• 0. 1 moL
0 Lin,
AREA. SI Aux B OAR [e 3 084 LOCATION: PUMP INBOAR D 131 MID: T77
1 2 3 4 5 6 7 8 9 10 Low Range Orders
Pump Inboard 3A - High Range
PLANT: Saiem Unit I MACHINE: 1 CCE04 912 COMPONENT COOLING PUMP 405P
8887.5 CPM, 4.99X, 0.04324 infs, 0912912000 09:40 Axial
AREA: S1 Aux Bldg Bey 084 LOCATION: PUMP INBOARD [31LOCATION PUMP Il'�OARD [31
hID 677
0 5 10 15 20 25 30 35 40 45 50 Lin High Range Orders
As can be seen in the Low Range Plot, an increase in the 5X component was recorded. In addition, peaks in the order of 18X-25X can also be seen in the High Range plot which contributed to the overall level most significantly. This "camel back" response is attributed to a resonance at the bearing that has been excited after the clamp was applied. In addition, this high order vibration is attributed to non-mechanical phenomena, i.e., flow related or system related vibration. These high orders do not suggest a mechanical problem within the pump. The vibration in
the 5X component is a vane-pass frequency. The evolution of increasing the "B" Gap was intended to decrease this component, but instead it was increased. The increase is attributed to the following:
Bearing cap "clamp" of 0.001" has produced a stiffer system and thus the vibration transmission to the accelerometer is more sensitive. An increase in 5X was also recorded on 11 Component Cooling Pump when the bearing cap clearance
NUREG/CP-0152, Vol. 4
W'•: 6771
I
3A-22

NRC/ASI-E Symposium on Valve and Pump Testing
was also changed to a "clamp" of 0.001". Additionally, the bearing cap may be in resonance while the pump is in operation during the IST.
""B" Gap and/or impeller geometry
trimmed incorrectly and a flow disruption causing axial forces has resulted.
Notice the decrease in the IX component in the Low Range plot. This is attributed to the balancing performed on the rotating assembly after the impeller was underfiled.
Independent of either of the above explanations, the vibration level, though elevated and unwanted, is not due to faults within rotating parts of the pump.
Pump Inboard 3H - Low Range
PLANT: Sake Unt 1 AREA: Sl Aux Bkg Ei5e 084 MACHINE: 1 CCEO4 #12 COMPONENT COOLING PUMP 405P LOCATION: PUMP INBOARD [3) MIO 677 1782.2 CPM. 1.00X, 0.01486 inis, 0912912000 09:40 Horizontal
0.07o
0.06
0.05
10.04
.G 0.03
0.02
0.01
0 1 2 3 4 5 6 7 8 9 10 Lin Low Range Orders
Pump Inboard 3H - High Range PLANT: Saer Lrd I AREA: SI Aux Bldg Ev 084 MACHINE ICCOEO4 r1:, Za *ENT COOLING PUMP 405P LOCATION: PUMP INBOARD 13] MID: 677 8887-5 CPM. 4 . 3 -.: 3% 3 er. Nr29r2000 09:40 Horizontal
0.04 0.03 0.02 0.01
0.
T 0
W
0 t o3 15 20 25 30 35 40 45 50 Lin High Range Orders
An overall vibration level decrease of 0.01 in/sec was recorded in this position. As can be seen in the plots, little change is seen in
the spectrum traces. There is a small decrease in the 5X component, which has contributed to the overall vibration level decrease.
NUREG/CP-0152, Vol. 4
0.1
3A-23

NRC/ASMýE Symposium on Valve and Pump Testing
Pump Inboard 3V - Low Range PLANT: Salem Unr 1 MACHNE: 1 CCE04 #12 COMPONENT COOLING PUMP 405P 1782.1 CPM, 1 .O0X, 0.00517 in/s. 09K2912000 09:40 Vertical
0.05 0.045
0.04 0.035 0.01 0.025
-= 0.02
0.015 0.01
0.005 0
Lin
5,
2. 5.
AREA: Si Aux Bldg Bey 084 LOCATION: PUMP INBOARD [3]
0 1 2 3 4 5 6 7 8 9 10 Low Range Orders
Pump Inboard 3V - High Range PLANT: Salem Unit I SMACHINE: 1 CCE04 a1 2 COMPONENT COOLING PUMP 405P
18887.5 CPM. 4.99X. 0.03765 inis, 09f292'000 09:40 Vertical
AREA: S1 Aux Bldg Bev 084 LOCATION: PUMP INB=OARD 13]LOCATION PUMP INBOARD 131
!rUl: 677
(0
0 5 10 15 20 25 30 35 40 45 50 High Range Orders
This point experienced a small increase of 0.08 in/sec. This is attributed mostly to the low order vibration increase in the 4X and 5X component. The 4X component is not considered to be stemming from a pump problem. The best explanation of the 4X component is that this order most closely corresponds to 120 Hz, or 2X line frequency of the motor. It appears from the broad based raised noise floor area on the trace that this is of a resonance response. This is probably due to the clamping action in the bearing causing
more excitation in the bearing cap. This response can be seen in the motor plots as well. For the 5X component, the explanation of this is the same as for the position 3A above, but in this case a force in the horizontal direction has developed as well. The disappearance of the "haystack" at 18X-25X seen in data in the high range cannot be fully described. This "haystack" is determined to be insignificant and not indicative of a problem.
NUREG/CP-0152, Vol. 4
I'D: 6771
CD
0
Lin
3A-24
I
M K): 377 1
0

NRC/ASME Symposium on Valve and Pump Testing
Pump Outboard 4A - Low Range PLANT: Salem Urd I MACHINE: 1 CCE04 912 CONMPONET COOLING PUMP 40"5P 1783.0 CPM, I. DX, 0.01274 ins, 091"291200 09:41 Axial
3 4 5 LOuu Range
Pump Outboard 4A - High Range PLANT: Salem Urit I MACHINE: 1CCE04 d'12 COMPONENT COOLING PUMP 405P 8905.1 CPM, 5.00X, 0.13225 inis, 09/29t2000 09:41 Axial
A"RA: S1 AUX Bkig E04 LOCATION: PUMP OUTWARI [4]
6 7 8
AREA- S1 Aux BSkg Eley 084 LOCATION: PUMP OUTBOARD [4]
Lin0 10 15 20 25
High Range
This point experienced an overall increase of 1.77 in/s. A significant increase in the 4X and 5X component can be easily seen in the Low Range plot. As mentioned earlier, the 4X component is not considered to be
30 35 40 45 50 Orders
stemming from a pump problem. Again, it appears from the broad based raised noise floor area on the trace that this is a resonance response. The 5X component is an elevated vane-pass similar to what is seen in 3A.
NUREG/CP-0152, Vol. 4
_.•o.15
0.1
0.05
0.
Lin
MID: 6771
10 Orders
0.20.18 0.16 0.121
KID: &77
x>
3A-25
--.....,.. ...... ý SM.'I . ., Sy po iu on a v .n .um .......
0
MID: 5771

NRC/ASME Symposium on Valve and Pump Testing
Pump Outboard 4H - Low Range PLANT: Salem Unit 1 AREA: Si Aux E1d9g Bev, 084 MACHINE: 1 CCE04 #12 COMIPONENT COOLING PUMP 405P LOCATION: PUMP OUTBOARD [4] IAN): 677
1783.0 CPM, 1.0OX, 0.0135 ins, 09i292000 09:41 Horizontra
I
0.07
0.06.
0.05
~0.0i S0.03
0.02
0.01
0. 0 1 2 3 4 5 6 7 8 9 10
Lin Low Range Orders
Pump Outboard 4H - High Range PLANT: S~aem Uni I AREA: S1 Aux Eldg Bev 084
MACHINE: 1 CCE04 #12 COMONENT COOLING PUMP 40:5P LOCATION: PUMP OUTBOARD [4] MI). 677
8904.1 CPM, S.O0X, 0.02488 inft, 09f29i2000 09:41 Horizontal
0.1 0.09 0 08
N
0
0 10 15 20 25 30 35 40 45 50 Un High Range Orders
An overall vibration level decrease of 0.08 in/sec was recorded in this position. As can be seen in the plots, no significant changes are seen in the traces. There is a
small decrease in the 5X component, which has contributed to the overall vibration level decrease. This data is very similar to the data in 3H.
NUREG/CP-0152, Vol. 4 3A-26

NRC/ASME Symposium on Valve and Pump Testing
Pump Outboard 4V - Low Range IPLANT- Sabe Uri 1 AREA. S1 Aux Sldg Bey 084 MALCHINE: ICCE-04 Sh2 COMPONENT COOLING PUMP 405P LOCATION: PUMP OUTBOARD 14) MPD: 677 117823 CPM,1 .Ot'X, 0.01757 ins.•,09'29/'00009r.41 Vertical
0.06
0.05
0.04.
S0.03 0.02
0.01
0.
0 1 2 3 4 $ 6 7 8 9 10 Lin Loav Range Orders
Pump Outboard 4V - High Range PLANT: Salem Urn 1 AREA: S1 Aux Bldg Bey 084 MACHINE: 1 CCE04 912 COMPONENT COOLING PUMP 40'5P LOCATION: PUMP OUTBOARD 14] MV: 677I 8901.2 CPM. S.OCX, 0.06118 inis, 09092000 09:41 Vertical
0.10 15 20 25 30 35 40 45 50
High Range OrdersLin
This point experienced an overall increase of 0.05 in/sec. This is attributed mostly to the low order vibration increase in the 4X and 5X component (similar to the 3V data). The Low Range plot shows that a significant contribution comes from the increase in the 5X component. In this case a force in the horizontal direction has developed as well.
Conclusions
0 The performance curve after underfiling exceeds the vendor's performance
curve. This is expected as a result from underfiling and holding the driver's speed constant.
" By the shape of the data taken after underfiling, it is reasonable to say that the pump is performing according to design and exhibits a normal performance curve.
"* The location of the vibration data collection is subject to debate. The locations for data collection for 4A, 4H and 4V (pump outboard) are on the
NUREG/CP-0152, Vol. 43A-27

NRC/ASME Symposium on Valve and Pump Testing
bearing cap above the housing. This location may not be reading the vibration data directly and may experience noise and disruption. These vibration disruptions may not be indicative of a pump problem but nonetheless contribute to an elevated reading.
" While the overall levels measured after underfiling appears to be elevated, the cause appears to be more related to the change in the bearing clamp than due to underfiling, volute trimming or equipment condition.
" An IST rebaseline of the pump was performed, as there were two points that were in the required action range after the evolution. The new levels of the IST data collection do not pose any threat to the mechanical integrity of the machine.
" After studying the data and observing that the 5X component plays some role in the overall vibration value, it is important to remember that all volute pumps have vane-passing frequency vibration and this component is not indicative of an emergent mechanical issue. In this case, the resonance in the bearing cap plays a more significant role in the elevated vibration levels. While these levels are not expected to cause catastrophic failures, they still contribute to accelerated wear and reduced lifetime of bearing life. There should be efforts to reduce this component so that overall readings stay at a minimum.
"* While it was intended to reduce the vane-pass frequency vibration, it can be seen that manipulating the system, such as by changing bearing cap clearances, can yield elevated vibrations regardless of the accuracy of the underfiling or volute trimming. It is possible that the bearing "clamp" of 0.001" is the cause of the elevated overall vibration level and now produces a more accurate vibration level reading.
" The IX component of the pump, due to an almost perfect balancing, has been decreased significantly. It is possible that the elevated IX in previous tests was masking other elevated vibration components and, now that it is reduced, other components are revealed.
" It is of the utmost importance to realize the following-the impeller before underfiling was in an undesirable condition. Castings that exhibit an appearance such as the 12 Component Cooling pump impeller should be rejected before installation. After performing an underfiling and grinding of the vane passages, an improved product is obtained and is acceptable for installation once balanced. Improving rotating elements through underfiling, especially in safety related systems where cost of new parts is extremely high, can yield enormous benefits and rewards in dollars saved from unavailability time and unnecessary corrective maintenance.
NUREG/CP-0 152, Vol. 4 3A-28

NRC/ASME Symposium on Valve and Pump Testing
"L +
NUREG/CP-0152, Vol. 4
! ! !
3A-29

NRC/ASME Symposium on Valve and Pump Testing
Figure 2
NUREG/CP-0 152, Vol. 4 3A-30

NRC/ASME Symposium on Valve and Pump Testing
U 2 U 2
Figure 3 Velocity Triangle Before Underfiling Figure 4 Velocity Triangle After Underfiling
Note: For Figure 3 and Figure 4, V.2 = W 2 and V., = W2,,. respectively
vu2 -U 2 VU2F
Figure 5 Superimposed Velocity Triangles
NUREG/CP-0152, Vol. 43A-31

NRC/ASAIE Symposium on Valve and Pump Testing
U 2 U 2
Figure 6 Velocity Triangle Before Underfiling Figure 7 Velocity Triangle After Underfiling
Vu2= VU2F U2
Figure 8 Superimposed Velocity Triangles
NUREG/CP-0152, Vol. 4
NRC/ASME Symposium on Valve
and Pump Testing
3A-32

NRC/ASME Symposium on Valve and Pump Testing
0% Gb
2r;'•Si -
NUREG/CP-0152, Vol. 43A-33

NRC/ASME Symposium on Valve and Pump Testing
I-
NUREG/CP-0 152, Vol. 4 3A-34

NUREG/CP-0 152, Vol. 4
NRC/ASME Symposium on Valve and Pump Testing
Figure 11
3A-35

NRC/ASME Symposium on Valve and Pump Testing
14iJ
NUREG/CP-0152, Vol. 4 3A-36

NRC/ASME Symposium on Valve and Pump Testing
Figure 13
NUREG/CP-0152, Vol. 43A-37

NRC/ASME Symposium on Valve and Pump Testing
NUREG/CP-0152, Vol. 4 3A-38

Vendor and Test Data on 12 Component Cooling Pump
290 280------------ I I z II I-270 - -- - - - -- - --- L 1 1. 260 --- ---- ,---------.... AFTER UNDERFILING
250 ----- ----. -- - -
240 -- - ------------- - -- --, -"
230------------- - -
220--------210/-- 200 " 190 - - - -" 180 VENDOR DATA -
1700--1600 150 -- - - --140--- 130 ---120110 100
9080 - r:u
70 ------- a - -- :. 'P
60 fu4 60------- - - - - - - 50- ------ c .
40 --- - - - -
30----- -- - - - - - - - - -
20---- - - - -- - - - - - - - -- - - - - -
10 0
0 1000 2000 3000 4000 5000 6000
FLOW (gpm)
Figure 15
z
,,I-
:z
FJt
0<
0
0
7000

Expedited Agile System Design Approach for Industrial Pumps
Dr. David Japikse Concepts NREC
Abstract
A new method for the design of industrial pumps has been created which brings a well integrated system of advanced technology to the fingertips of all designers throughout the pump industry, regardless of their technical background. The new system, the Expedited Agile System (EASy!rr') integrates the initial meanline design considerations, the details of sophisticated three-dimensional blading design, and the essential characteristics of modem computational fluid dynamics (CFD) analysis and design procedures. Furthermore, extensive use is made of historical design data to guide designers in the direction of proven design techniques, and to automatically validate and calibrate the design tools for specific applications.
Pumps are extremely important to energy systems worldwide. More than 1% of all the fuel burned in cars and trucks could be completely saved if advanced designs were introduced simply for the water cooling pump on these vehicles. Additionally, over 5% of all electric power is consumed in pumps which, on average, probably can be improved by approximately 10%. These savings are enormous, but the world is routinely producing pumps today which use technology which essentially was developed in the first half of the previous century. The new EASy! suite is a major step in fast-forwarding the design process and providing an opportunity for energy efficient, high performance pump design throughout industry.
NUREG/CP-0152, Vol. 43A-41

Comprehensive Pump Testing Based on ASME OM Code Requirements and its
Alternatives and Related Relief Requests
Gurjendra S. Bedi and Joseph Colaccino U.S. NRC
Abstract
The most recent update to Title 10 of the Code of Federal Regulations (10 CFR) Part 50.55a was published in the Federal Register on September 22, 1999. This rulemaking incorporated, by reference, the 1995 Edition through the 1996 Addenda of the ASME OM Code for Inservice Testing (IST) of Pumps and Valves. The 1995 ASME OM Code includes, in part, a new set of pump testing requirements which are collectively known as the "comprehensive pump test" (CPT). The CPT allows less rigorous pump testing to be performed for certain pumps on a quarterly frequency while requiring a pump test to be performed with more accurate flow instrumentation every 2 years at ± 20 percent of pump design flow. Licensees have started to update their IST programs, as required by 10 CFR 50.55a, to the 1995 Edition through the 1996 Addenda of the ASME OM Code. Relief requests have been submitted to the NRC staff to propose alternative testing to the CPT pump design flow requirements because the requirements for certain pumps have been determined by the licensee to be either a hardship, burdensome, or impractical. This paper discusses the issues surrounding these relief requests and the NRC staff's evaluation
of the requests. The intent of this paper is to summarize current NRC staff evaluations and present licensees with issues to consider if they are contemplating similar licensing actions.
Introduction
During the past several years, activities of the Nuclear Regulatory Commission (NRC) staff (the staff) have resulted in changes to inservice testing (IST) requirements on September 22, 1999. The 1995 Edition of the American Society of Mechanical Engineers (ASME) Code for Operation and Maintenance of Nuclear Power Plants (OM Code) up to and including the 1996 Addenda, was incorporated by reference into the Code of Federal Regulations (10 CFR 50.55a). With this rulemaking came revised IST requirements. The 1995 ASME OM Code, subsection ISTB, incorporates a new set of pump testing requirements which are collectively known as the "comprehensive pump test" (CPT).
The CPT provides a new, improved philosophy for testing safety-related pumps in nuclear power plants. The CPT establishes a more involved biennial test for all pumps and
NUREG/CP-0152, Vol. 4
This paper was prepared by staff of the U.S. Nuclear Regulatory Commission. It may present information that does not currently represent an
agreed-upon NRC staff position. NRC has neither approved nor disapproved the technical content.
3A-43

NRC/ASME Symposium on Valve and Pump Testing
significantly reduces the rigor of the quarterly test for standby pumps. The increased rigor and cost of the biennial CPT are offset by the reduced cost of testing and potential damage to the standby pumps, which comprise a large portion of the safety-related pumps at most plants. The CPT allows less rigorous pump testing to be performed for certain pumps on a quarterly frequency while testing of all safetyrelated pumps will be performed with more accurate flow instrumentation every 2 years at ± 20 percent of pump design flow. The flow test every two years at ± 20 percent of pump design flow will ensure that the pump is tested in an area of the pump head-flow curve where pump performance can be accurately measured, and pump degradation can be evaluated.
Licensees, whose 120-month interval has recently expired, have updated their IST programs, as required by 10 CFR 50.55a, to the 1995 Edition through the 1996 Addenda of the ASME OM Code. For some updated IST programs, relief requests have been submitted to the NRC staff proposing an alternative test to the CPT pump design flow requirements because the requirements for certain pumps have been determined by the licensee to be either a hardship, burdensome, or impractical. On the date this paper went to publication, the NRC staff has evaluated three CPT relief requests submitted by licensees. The proposed alternatives have been either authorized for the entire 120-month interval or authorized on an interim basis until additional information is provided for NRC staff evaluation.
This paper discusses the issues surrounding these relief requests and the NRC staff's published safety evaluation and lessons learned from the relief requests. The intent of this paper is to summarize the current evaluations and provide licensees with
issues to consider prior to submitting similar licensing actions.
Pump Grouping Criteria and Comprehensive Pump Test Requirement
The 1995 Edition of the ASME OM Code up to and including the 1996 Addenda, was incorporated by reference into 10 CFR 50.55a on September 22, 1999 (64 FR 51370). With this rulemaking came revised requirements for IST. The 1995 ASME OM Code includes, in part, a new set of pump testing requirements which are collectively known as the "comprehensive pump test." In addition a new method for grouping pumps was introduced. The pump grouping criteria of the OM Code 1995, Subsection ISTB, is based on the system operating requirements. The pumps are divided in two groups, Group A and Group B pumps. The Group A pumps are defined as pumps that operate continuously or routinely during normal operation. The Group B pumps are defined as pumps in standby systems that are not operated routinely except for testing. The Code identifies four type of tests: preservice test, Group A test, Group B test, and Comprehensive test. All pumps would receive a preservice test followed by the test associated with the pump category (Group A test for Group A pump, or Group B test for Group B pump). The Group A test or Group B test is performed quarterly. All pumps would receive a CPT every 2 years. A CPT may be substituted for a Group A test or Group B test.
The CPT requires a pump test to be performed with more accurate flow instrumentation every 2 years at ± 20% of pump design flow. The Code does not define pump design flow, so the actual intent of the reference testing point is unclear. However, there is anecdotal evidence that licensees are interpreting this requirement
NUREG/CP-0152, Vol. 4 3A-44

NRC/ASME Symposium on Valve and Pump Testing
as the best efficiency point (BEP) of the pump. The BEP is defined as the capacity and head at which the pump efficiency is at its maximum. It should be noted that this point is independent of the system design requirement.
The CPT was developed with the knowledge that there are some pumps, such as containment spray pumps, that cannot be tested at the required high flow rates because of practical considerations and limitations in system design. The CPT was not necessarily intended to require installation of full flow test loops in existing plants. If the licensee cannot perform the CPT test at ±20 percent of pump design flow, then relief from the Code must be requested and an alternative test strategy must be proposed. The relief request must contain the full detailed description of impracticality or hardship to meet the CPT requirements. The impracticality and hardship, are defined in 10 CFR 50.55a(3)(ii) and 10 CFR 50.55a(g)(6)(i), respectively.
Relief Requests from CPT Requirements
The following are two examples of relief requests where licensees have demonstrated that the Code comprehensive pump test requirements are either impractical or represent a hardship.
Seabrook Nuclear Power Station
The licensee for the Seabrook Nuclear Power Station requested relief from CPT requirements for its two containment spray (CS) pumps. Specifically, the licensee requested relief from the provisions of ISTB 4.3.e. 1 which requires reference values be established within ± 20% of design flow rate for the comprehensive test. As an alternative to the CPT, the licensee proposed to use the current bypass loop at a flow rate
of approximately 1900 gallons per minute (gpm) which is approximately 63% of the best efficiency point of each pump.
The containment spray pumps are horizontal centrifugal pumps. They are designed to take suction from the containment sump at the most limiting net positive suction head (NPSH) condition and pump the fluid into the containment through the spray nozzles. The updated final safety analysis report (UFSAR) also states that the system design flow is 3010 gpm and the minimum calculated containment spray flow rate is 2808 gpm. The containment spray pumps have a minimum NPSH requirement of 21 feet.
The inservice test parameters which are required to be measured during the comprehensive test for the Seabrook containment spray pumps, as specified in Table ISTB 4.1-1, are differential pressure, flow rate, and overall vibration. Reference values for the comprehensive test, as specified in ISTB 4.3(e)(1), are required to be established in regions of relatively stable pump flow and within ± 20% of the pump design flow rate. Table ISTB 5.1-1 specifies that the comprehensive test be conducted biennially for each pump in the IST program.
The licensee considered the containment spray system to be a fixed resistance system because that the flow cannot be varied by use of any of the installed valves. The licensee stated that the required (system) design flow is 2808 gpm and the pump BEP is 3000 gpm. The current bypass loop capacity for both pumps is approximately 1900 gpm to 1950 gpm based on test data provided by the licensee. Therefore, the test flow rate is approximately 68% of the minimum system design flow and approximately 63% of pump flow at the BEP. In order to meet the Code requirements, the test would have to be conducted at 2400 gpm,
NUREG/CP-0152, Vol. 43A-45

NR C/ASME Symposium on Valve and Pump Testing
which is 80% of the flow at the BEP of the containment spray pumps.
The licensee stated in its relief request that in order to test the containment spray pumps to obtain the pump flow required by the Code, a dyke of approximately three feet in height would have to be temporarily erected around the top of the sump in order maintain sufficient pump head to provide adequate NPSH to the pump. In addition, more than 60 feet of temporary pipe of 8 inches diameter would have to be installed from containment to emergency core cooling system (ECCS) sumps. This was last done using a temporary pipe line during pre-operation testing.
The licensee proposed to perform the CPT at the current test conditions. The licensee stated that Group B testing (for pumps in standby systems that are not routinely operated) would be performed for the containment spray pumps in accordance with the Code. The requirements for Group B tests are contained in ISTB 5.2.2. At Seabrook, this test is also performed at the same point as the CPT because it is a fixed resistance system. As specified in Table ISTB 4.1-1, no vibration testing is required. The required hydraulic acceptance criteria, as specified in Table ISTB 5.2.2-1, for the containment spray pumps include either flow or pressure measurement. This testing is less stringent than the current Code requirements. The licensee did not propose any additional compensatory actions to offset the limited testing of the containment spray pumps during the comprehensive test.
The CPT was developed to ensure a better evaluation of pump performance characteristics at a reduced frequency. This test is intended to be conducted at or near the pump's design flow rate because this area of the pump curve is considered to be the most representative of the pump's
design performance characteristics. The quarterly Group B test for standby pumps is intended as a largely qualitative test to allow for detection of gross mechanical or hydraulic failures, and not for determining hydraulic performance capabilities or for detecting minor imbalances through vibration measurements. The resultant implementation of the comprehensive test for the containment spray pumps at Seabrook would be a reduction in testing requirements during the quarterly test without a more intensive assessment of the pump during the biennial test. Therefore, the proposed testing appeared to be contrary to the intent of the Code.
The intent of the comprehensive pump test is to test a pump at substantial flow rates such that significant changes in pump developed head or flow will be detected more readily than they would be if they were tested at low flow rates. The licensee provided factory and pre-operational test data on these pumps as well as IST data taken since the start of plant operation. This information is presented below.
Figure 1, reproduced from curves provided by the licensee in its submittal dated August 18, 2000, compares performance data for containment spray pump A taken both at the factory and during pre-operational testing with a recent inservice test hydraulic data point. Figure 2, plotted from data provided in the licensee's submittal dated September 8, 2000, consists of performance data taken from all inservice tests performed on containment spray pump A. Different reference flow rates are plotted on the same graph according to the date the test was performed. At higher flow rates, a lower pump head is expected. The licensee provided similar data for containment spray pump B.
NUREG/CP-0152, Vol. 4
NRC/ASMF,
Symposium
on Valve and Pump Testing
3A-46

NRC/ASM•E Symposium on Valve and Pump Testing
In order for the licensee's proposed alternative to provide an acceptable level of quality and safety, the pump test performed at 63% of the pump BEP must be able to demonstrate that degradation will be readily detected. The optimum performance point to detect pump degradation is near the pump's design flow rate because, as previously stated, this area of the pump curve is considered to be the most representative of the pump's design performance characteristics. Changes in hydraulic performance near the design point would not be as readily masked as they would be at conditions near the shutoff head of a centrifugal pump.
Based on the factory curves, the shutoff head of both containment spray pumps is 700 feet (Figure 1). It is also noted that the pre-operational performance curves are offset from the factory curve, possibly due to higher system resistance and methods of collecting and reducing the performance data. The representative IST points plotted on these two curves either coincide or are above the pre-operational performance curves. Another observation regarding the performance curves is that the slope of the pump/head curve measured at the factory and the preoperational test curves are relatively flat at flow rates up to 2000 gpm. At 2400 gpm, the curve plotted using data from pre-operational test PT-II shows that the total developed head is approximately 620 feet or 12% below the shutoff head of the pump. At 3000 gpm, the total developed head drops to approximately 560 feet or 20% below the shutoff head.
Because the system was considered by the licensee to be a fixed resistance system, there was no fixed reference value. To evaluate the performance of each containment spray pump against the Code acceptance criteria, each pump was started, the system flow was allowed to stabilize, and pressure and flow
measurements were recorded and compared with their respective acceptance criteria. Using the IST data provided by the licensee, it was noted that the measured flow rate for both pumps has a total variation of approximately 1.3% while the total developed head variation was approximately 4.6% for pump A and 2.4% for pump B. These values appeared to be well within the acceptable Code required action limits. In addition, the repeatability of the test flow rate appeared to be consistent with the guidance in NUREG-1482, Section 5.3, which referred to pump testing in earlier editions of the ASME OM Code.
As stated above, the IST data for both pumps was graphed such that, for a particular flow rate, the corresponding total developed head was plotted on the date of the test (Figure 2). The intent of the plot is to provide trend data of total developed head at each measured flow rate for both containment spray pumps. The expected result was that, at higher flow rates, there would be a lower pump total developed head. This would provide an indication that the pumps were being tested in an area of the curve such that the intent of the comprehensive test would be satisfied. In examining the IST data graphs for both pumps, the only trend that can be inferred is that the variation in pump total developed head decreased significantly in tests after 1995. The plot of pump A yielded no similarity in pump head at constant flow rates. Another possible explanation is the region in which the pump was being tested was insensitive to small variations in pump flow because the pump was operating near its shutoff head.
Based on its analysis of the IST data, the staff found that containment spray pump testing using the bypass line did not provide any additional information when compared to pump testing at much lower flow rates. In
NUREG/CP-0152, Vol. 43A-47

NRC/ASME Symposium on Valve and Pump Testing
addition, the licensee did not propose any compensatory actions to supplement the testing strategy for the containment spray pumps. Therefore, the staff did not find an adequate basis existed to authorize the alternative as proposed by the licensee for the full 10-year interval. However, considering that an evaluation of the containment spray pump testing showed repeatable results using the current Code test strategy using a flow test loop which allows pump testing at significant flow rates (albeit at a performance point that is approximately within 1% of pump shutoff head), the staff found that the licensee's alternative provided reasonable assurance of operational readiness of the pumps to authorize the alternative for an interim period to allow time for the licensee to reevaluate its proposed alternative testing. The proposed alternative provided reasonable assurance of operational readiness during the interim period because flow testing of the containment spray pumps will be performed quarterly at significant flow rates and that the licensee has not identified any recent maintenance or testing issues with these pumps.
During the interim period, the licensee will reevaluate the current testing to assess the ability to detect degradation as was intended by the OM Code-1995 pump test strategy. This may entail more detailed analysis of the IST data, consultation with the manufacturer, or running additional tests as appropriate. If the licensee cannot further demonstrate that the proposed testing is an acceptable alternative, then appropriate compensatory actions should be proposed to supplement the alternative testing. Possible strategies or combinations of strategies include: 1) testing at the BEP on a much longer interval; 2) commitment to perform additional performance monitoring on the containment spray pumps; 3) adjustment of acceptance criteria; and/or 4) continuation of the current
Code testing, including taking overall vibration data quarterly.
The NRC staff concluded that the proposed alternative to the Code reference value requirements of ISTB 4.3.e(l) for the containment spray pumps may be authorized pursuant to 10 CFR 50.55a(a)(3)(i) based on the alternative providing an acceptable level of quality and safety for an interim period of 2 years. During the interim period, the licensee will reevaluate the current testing to assess the ability to detect degradation as was intended by the OM Code- 1995 pump test strategy. If the licensee cannot further demonstrate that the proposed testing is an acceptable alternative, then it will propose appropriate compensatory actions to supplement the alternative testing.
North Anna Power Station
The licensee for the North Anna Nuclear Power Station requested relief from CPT requirements for its two outside recirculation pumps for both units. The licensee requested relief from the Code requirements of paragraph ISTB 4.3(e). ISTB 4.3(e)(1) requires that reference values shall be established within 20% of the pump design flow rate for comprehensive tests.
The outside recirculation spray (ORS) pumps supply borated water spray to cool and depressurize the containment atmosphere following a containment depressurization actuation signal and maintain containment sub-atmospheric pressure following an accident. There are two outside recirculating pumps per unit. The test loop for the outside recirculation pumps consists of a 10-inch discharge line feeding into a 4-inch recirculation line, which feeds back to the pump sump. Pump design flow cannot be established using this test loop because of
NUREG/CP-0152, Vol. 4 3A-48

NRC/ASME Symposium on Valve and Pump Testing
the 4-inch line size. Also, the discharge piping was not designed to be temporarily reconfigured so that pump design flow can be achieved.
The licensee stated that the spray headers are inaccessible without a significant amount of scaffolding. Even if the nozzles were accessible, plugging 300 spray nozzles (150 nozzles per spray header), running the full-flow test, and returning the system to its original operable configuration would cause a hardship to the licensee without a compensating increase in quality and safety.
The Code requires in ISTB 4.2 that a comprehensive test be conducted in accordance with ISTB 5.2.3. The inservice test parameters that must be measured during the comprehensive test for the outside recirculation spray pumps, as specified in Table ISTB 4.1-1, are differential pressure, flow rate, and overall vibration. The OM Code, paragraph ISTB 4.3(e)(1), specifies that the reference values for the comprehensive test shall be established within ±20% of the pump design flow rate. Table 5.1-1 specifies that the comprehensive test be conducted biennially for each pump in the IST program.
The outside recirculation spray pump design flow rate is 3640 gpm and safety analysis flow is 3450 gpm. The reference flows are established in the range of 1450 to 1500 gpm, which is not within 20% of design flow. As an alternative to testing within 20% of the design flow, the licensee proposed to establish the reference values at approximately 40% of the design flow. Testing at design flow is important for pumps with head-flow curves that are "flat" or gently sloping in the low region (pump whose developed head changes little with increasing flow). Pumps with the flat curves at low flows should be tested at near design conditions to determine if
increasing internal recirculation flows have degraded pump performance to the point where pump degradation can be more readily assessed. This situation did not apply to the North Anna ORS pumps, as these are tested at 40% of design flow which is 1450 to 1500 gpm. As shown in Figure 4, the head curve for these pumps is not flat but well sloped. For these pumps the total developed head (TDH) changes significantly with increase in flow (10 feet per 250 gpm).
In the case of North Anna Power Station, the shutoff head of pumps is 435 feet as shown in the nominal vendor curves. As discussed above, the pump can only be tested on a recirculation flow path which is sized for approximately 40% (1500 gpm) of the design flow of 3640 gpm. In the case of Seabrook Station, the shutoff head is 700 ft. The pump can be tested on recirculation flow path which is sized for approximately 68% (1900 gpm) of the required design flow of 2808 gpm. The flow and TDH values from the head-flow curves for North Anna Station and Seabrook Station are shown in the following table and presented in Figure 5 for comparisons:
North Anna Seabrook Station Station Pump Pump
Flow 0 1500 3600 0 1900 2808 (gpm)
Total 435 375 290 700 685 560 Developed Head (feet)
Based on the above head-flow curves data, the staff found that, for North Anna Station, the pump head-flow curves were well sloped, whereas the Seabrook Station pump head-flow curves were "flat" or gently sloping in the low region. Therefore, testing at reference flows for North Anna Station will detect pump degradation because the pump curve is well sloped at the point of testing.
NUREG/CP-0152, Vol. 43A-49

NRC/A SME Symposium on Valve and Pump Testing
The licensee provided curves showing flow rate versus the corresponding total developed head (Figure 4). The intent of the curve was to provide trend data on the total developed head at each measured flow rate for the outside recirculation pumps. The expected result was that, at higher flow rates, there is a lower pump total developed head. This provided an indication that the pumps were tested in an area of the curve where the intent of the comprehensive test would be satisfied.
The licensee stated that the outside recirculating pumps were also included in the North Anna Predictive Maintenance Program. This program employs predictive monitoring techniques that go beyond the vibration monitoring and analysis required by ISTB, and oil sampling and analysis. If the measured parameters were outside the normal operating range or were determined by analysis to be trending toward an unacceptable degraded state, the licensee will take appropriate actions including monitoring additional parameters, review of component specific information to identify cause, and removal of the pump from service to perform maintenance.
The licensee stated in its relief request that, to perform the ORS pump full-flow test in Unit 2 during the construction phase, a test loop was established by replacing the spray nozzles of each of the two spray header (150 nozzles per header) with plugs, discharging pump flow to the spray headers, and directing the flow back to the containment sump. A dike was also constructed around the containment sump to simulate water levels in containment that are expected during accident. The ORS pumps took suction from the sump, thus completing the loop. Reestablishing this full-flow test loop for the purpose of periodic testing would be a hardship on the licensee.
Based on a review of the provided curves and information regarding the North Anna Predictive Maintenance Program, the NRC staff found that the licensee's alternative provided reasonable assurance of the operational readiness and compliance with the specified requirement would result in a hardship without a compensating increase in the level of quality and safety. Therefore, the licensee's proposed alternative to reference value requirements of the paragraph ISTB 4.3(e) for the recirculation spray pumps for both units was authorized pursuant to 10 CFR 50.55a(a)(3)(ii).
Guidelines for Developing A Proposed Alternative to the Code CPT Requirements
The following should be considered when drafting an alternative to the Code CPT requirements:
"The licensee should determine the maximum flow rate that the pump can be tested and compare this with the design flow rate of the pump. In addition, the licensee should determine if pump degradation can be adequately assessed at this flow.
" The licensee should evaluate and assess the existing system design in which the pump is installed to determine if Code testing is either impractical or a hardship.
" The licensee should consider compensatory actions that it will commit to perform on these pumps in lieu of the Code requirements. These may include, but not limited to, strategies such as a CPT on an increased interval, condition monitoring activities not required by the Code, or supplemental maintenance or inspections to verify the pump has not degraded.
NUREG/CP-0 152, Vol. 4
NRC/ASM• Symposium on Valve
and Pump Testing
3A-50

NRC/ASMAE Symposium on Valve and Pump Testing
The following items should be included when submitting a proposed alternative to the Code CPT requirements to the NRC staff:
" A description of the achievable test point during the CPT in relation to the pump design point (a graphical representation of the test point as compared to the pump head-flow curve is expected).
"• A description of the system in which the pumps are contained.
"* IST data for these pumps (include system drawing or P&ID)
" A detailed description of why testing is either a hardship or impractical. Also describe in detail what actions would be required to meet the Code CPT requirements.
" Describe the proposed compensatory actions that will be performed (i.e, committed to) in lieu of the Code CPT requirements.
" Describe in detail why the proposed alternative testing, including the proposed compensatory actions, provides an acceptable level of quality and safety.
Use of Later Edition of the Code to Use CPT
Many licensees are not scheduled to update to the later editions of the Code for several years and their current Code of record does not require a CPT. However, updating the IST program to adopt portion of the 1995 Edition of the Code related to the CPT would allow licensees to use the CPT and to reduce the burden of testing quarterly while providing more useful information on pump degradation. As an example, the Calvert Cliffs Nuclear Power Plant submitted a request to use the CPT portion of the 1995 OM Code
including 1996 Addenda pursuant to 10 CFR 50.55a(f)(4)(iv).
The licensee requested to perform the IST of its emergency core cooling system (ECCS) and auxiliary feedwater system (AFW) pumps in accordance with the 1995 Edition through the 1996 Addenda of the OM Code, Subsection ISTB, "Inservice Testing of Pumps in Light-Water Reactor Power Plants," as an alternative to the requirements of the OM-6 Code, 1987 Edition through the 1988 Addenda. The major difference between these two Codes is the addition of the "comprehensive pump test (CPT)" which shall be conducted with the pump operating at a specified reference point.
Because the NRC incorporated by reference in 10 CFR 50.55a(b) the 1995 Edition through 1996 Addenda of the OM Code, the licensee need only to request NRC approval of the use of a portion of the OM Code related to the CPT. The licensee must ensure that all related requirements are met. Demonstration of the alternative providing an acceptable level of safety or the current requirements are a hardship is unnecessary when requesting to use later Code or portions thereof that have been incorporated by reference in 10 CFR 50.55a(b). Therefore, the NRC staff approved the use of the OM Code, Subsection ISTB, 1995 Edition with 1996 Addenda, related to the CPT for the Calvert Cliffs Nuclear Power Plant pursuant to 10 CFR 50.55a(f)(4)(iv).
Conclusion
This paper provides some considerations when preparing relief requests, where the licensee may not perform CPT to meet all the Code requirements. The highlights are given below:
* The CPT must be performed at ±20% of the design flow for all IST pumps. The
NUREG/CP-0152, Vol. 43A-51

NRC/ASME Symposium on Valve and Pump Testing
licensee should make every efforts to test IST pumps at full flow conditions. The licensee is required to submit a relief request if CPT is not performed at ±20% of the design flow.
" The relief request should contain all the system details in which the pump is installed and address hardship or impract'icability when not performing CPT at ±20% of the design flow.
" The relief request should contain any historical data and performance curves available for the pumps. This information is important because, the pump curve may be flat (no significant change of head due to flow) or well sloped (flow changes with head). The licensee can provide any additional information or data to facilitate the design review. The licensee should consider compensatory actions that it will commit to perform on these pumps in lieu of the Code requirements.
"* The licensee may request NRC approval to use later Code that include the CPT.
" The CPT may be substituted for Group A or Group B pump tests. The Group A and Group B pumps tests are performed quarterly, whereas CPT must be performed only once every 2 years. CPT ensures a more accurate and reliable evaluation of the pump's performance characteristics at a reduced frequency.
" The licensee may review the details of previously NRC-reviewed relief requests related to CPT.
References
10 CFR 50.55a, "Codes and standards."
ASME/American National Standards Institute (ASME/ANSI), Operations and Maintenance
Standards, Part 6 (OM-6), "Inservice Testing of Pumps in Light-Water Reactor Power Plants," New York, 1987.
ASME/ANSI, Code for Operation and Maintenance of Nuclear Power Plants, 1995
Edition and 1996 Addenda, Subsection ISTB, "Inservice Testing of Pumps in Light-Water Reactor Power Plants."
Draft Regulatory Guide DG-1089, Operation and Maintenance Code Case Acceptability, ASME OM Code.
Generic Letter 89-04, "Guidance on Developing Acceptable Inservice Testing Programs," dated April 3, 1989.
NRC Letter dated November 1, 2000, from James W. Clifford to Ted C. Feigenbaum of North Atlantic Energy Service Corporation, "Safety Evaluation of Relief Requests for the Second 10-year Interval Inservice Test Program Plan, Seabrook Station, Unit No. 1 (Accession Number ML003760787)."
NRC Letter dated January 7, 2002, from Richard P. Correia to North Anna, "Safety Evaluation of Relief Requests Associated with the Third 10-year Interval Inservice Testing Program for Pumps and Valves for North
Anna Power Station, Units 1 and 2 (Accession Number ML020070461)."
NUREG/CP-0137, "Proceedings of the Third NRC/ASME Symposium on Valve and Pump Testing," NRC staff paper titled "Development of Comprehensive Pump Test Change to ASME OM Code, Subsection* ISTB," dated July 18-21, 1994.
NUREG-1482, "Guidelines for Inservice Testing at Nuclear Power Plants," dated April 1995.
NUREG/CP-0152, Vol. 4 3A-52

NRC/ASME Symposium on Valve and Pump Testing
Figure 1. Seabrook Station CS Pump Flow Diagram
Seabrook CBS-P-9A IST Data Total Developed Head at Reference Flow
685
4 680
S67 5
"v 670
2665
00660 --
M655 .. I-
650 Jun-90 Feb-92 Jun-93 Jan-95 Jun-96 Nov-97 May-99 Date of Inservice Test
. 1925 gpm - 1930 gpm ---- 1935 gpm 1940 gpm
1942 gpm -. 1945 gpm - 1950 gpm
Figure 2. Seabrook Station CS Pump Flow Diagram (at various dates)
NUREG/CP-0152, Vol. 4
A "A- ... a
JuO00
3A-53

NRC/ASME Symposium on Valve and Pump Testing
Figure 3. North Anna Power Sation ORS Pump Flow Diagram
NUREG/CP-0152, Vol. 4 3A-54

NRC/ASME Symposium on Valve and Pump Testing
450
400_
350
3 NOMINAL VENDOR CURVE
TEST POINT A
A DESIGN POINT
200.
50u 0 Uu 1is . •UUU 2JU2
FLOW (GPM)0Ou 40V0 4500
Figure 4. North Anna Station ORS Pump Curve
NUREG/CP-0152, Vol. 4
T D H (F
0 3
3A-55

NRC/ASME Symposium on Valve and Pump Testing
0 500 1000 1500 2000 2500 3000 3500 4000
Flow (gpm)
Figure 5. Flow and TDH Pump Curve
NUREG/CP-0152, Vol. 4
• 500
S400 o 0
o 300
0 2200
3A-56

Session 3(b)
Air-Operated Valves
Session Chair
L. J. Victory, Jr. Duke Power Company

Benefits and Advancements of Direct Stem Force Measurement in
Air-Operated Valve Diagnostic Testing
G. Russell Gasser Crane Nuclear, Inc.
Abstract
Over the past several years, the use of direct stem force measurement in air-operated valve (AOV) diagnostic testing has become much more common. In fact, many utilities have been thinking outside the box regarding how this parameter is used and evaluated. For example, direct stem force is now often used to measure packing friction and seating force, improving test certainty and margin, while adding a dimension to the diagnostician's insight into valve function.
This new information is integrated with the simultaneously acquired pneumatic, position, control, and process data. As the use of direct thrust develops, diagnostic techniques, software, and hardware have also been developed and refined to complement this enhanced methodology.
This paper discusses the benefits associated with the use of direct Stem Force, and the advancements in software and hardware that are improving the usefulness of this parameter.
NUREG/CP-0152, Vol. 43B-1

Damaging Affects of Poor Air Quality in Relation to Air Operated Valves
Jim Tucker Crane Nuclear, Inc.
Abstract
The benefits of having and maintaining Quality Air are substantial. Poor Air Quality can prove to be very costly requiring extensive repairs and/or component replacement. Poor Air Quality can be directly associated to Air Operated Valve (AOV) and accessory damage or total failure. Benefits of Quality Air include but are not limited to significant reductions in maintenance costs, improved plant availability, performance and efficiency. Poor Air Quality also affects the safety of the plant, its workers and ALARA.
Introduction
The purpose of this paper is to identify how Poor Air Quality affects the AOV and its accessories. The mindset is that Poor Air Quality always begins with such things as Compressors, Dryers and Filters. In a perfect world, this would be true, but experience shows this is not always the case.
Although the previously mentioned components tend to be the main culprit, Poor Air Quality oftentimes is the result of poor maintenance.
Regardless of the origin, damage from Poor Air Quality is the same!
Discussion will include the following components:
"* Regulator "* Instrument "* Actuator "• Valve "• Accessories
Air Supply regulators play an essential roll when considering Foreign Material Exclusion (FME). Foreign materials will damage the associated components and significantly reduce the life span. The following figures will depict damages and/or concerns with regard to Poor Air Quality.
Reading Parts and Components
Proper training will allow technicians to identify concerns by reading the parts! components. The greater benefit of possessing the ability to identify problems and their source is seen in monetary return. Figure 1 is a perfect example for reading the parts! components.
Rust inside the regulator (refer to Figure 1) identifies moisture in the system. Considering the housing of the regulator is Aluminum, the rust entered from the upstream side. This alone should be cause for investigation into the origin of moisture and rust.
NUREG/CP-0152, Vol. 43B-3

NRC/ASME Symposium on Valve and Pump Testing
The corrosion/oxidation (refer to Figure 1) is also a result of moisture, its origin should be identified and corrected.
The leakpath (refer to Figure 1) can be the result of the filter relaxing or loosening of the fastener. Filters with fasteners should be checked during maintenance to assure proper engagement.
The evidence in Figure 2 speaks for itself. This example depicts what happens to the fastener after being attacked by moisture.
Note how the fastener snapped off during removal.
The sealing surface (refer to Figure 2) is virtually invalid considering the obvious pass-through of debris. Note the build-up of material on the surface.
Considering the abuse this regulator still managed to collect the larger particulate. Refer to Figure 3.
The debris (refer to Figure 3) was captured in the bowl of the regulator. The darker debris to the bottom right is part of the gasket material. Much of the debris is sand-like grit. Considering compressors and piping are not lined with sand, it is advantageous to find the source and correct it. Any particulate in the system will have a "blasting" affect causing premature wear and/or failure.
There is a presence of green paint chips (identified in picture). This warrants finding the source as this is consideredforeign material.
The circled portion of Figure 3 shows evidence of the petcock beginning to rust from
moisture. Rust on the petcock is a potential source for a leak.
The evidence presented, emphasizes the impact Poor Air Quality can have on an Air
Supply Regulator. Here are some things to consider when choosing the regulator:
" Minimum of 40 micron filter
* Filter material
"* Soft-goods material should meet or exceed environmental concerns
" Soft goods should meet or exceed the environment
* Nitrile (NBR): -40 to 82 degrees C [-40 to 180 degrees F]
* Fluoroelastomer (FKM): -18 to 149 degrees C [0 to 300 degrees F]
* Silicon (VMQ)(3): -51 to 82 degrees C
[-60 to 180 degrees F]
" Vibrations
• Filters held in place by fasteners may
vibrate loose
Review
Several things are to be considered after reading these components.
"• Where did the moisture originate
"* Where did the grit originate
"* Where did the paint originate
"* Where did the rust in the upper portion of the regulator originate
* Was it caused by equipment failure or maintenance induced
Once the source and cause are identified, a solution can be initiated.
NUREG/CP-0152, Vol. 4 3B-4

NRC/ASME Symposium on Valve and Pump Testing
Suggestions/Observations
To better maintain equipment associated with Air Quality, the technicians and Engineers should have the proper tools.
The most important tool anyone can have is training. Train all personnel involved to be able to identify the results of Poor Air Quality.
Train technicians to troubleshoot the cause (i.e. equipment failure or maintenance induced).
Make certain the problems are corrected.
If moisture is inherent, regulators are available that are impervious to moisture and more durable when presented with foreign material. Often an in-line moisture loop/trap before the regulator will help.
If temperature is of concern in regard to the soft goods, follow manufacturers' suggestions.
Summary
In regard to reading the parts, note how the corrosion is all to one side (refer to Figures 2 and 3). This would indicate the regulator is mounted on its side, which is not the preferred method. The preferred mounting is so when the petcock is opened, moisture can be drained. Many different mounting brackets are available to correct this.
Instrumentation
Instruments are extremely sensitive to particulate and foreign material in the air system. Associated with the "Final Controlling Element," it is critical to have clean dry air.
Controller
Pneumatic controllers are precision instruments with many intricate moveable parts and orifices. Poor Air Quality can have devastating effects on a controller to the point of total failure. A few of the common results are:
"* Small orifices wash out "* Nozzles wear prematurely "* Parts corrode or rust "* Partial to complete blockage "* Poor controllability "* Total failure
Figures 4, 5 & 6 are examples of the affects of Poor Air Quality. Theflexure strip and screws are heavily rusted (refer to Figure 4). The aluminum portions are heavily affected by corrosion.
In Figure 4, the arrows represent rusted parts; the blocked area is theflexure strip that seals against the nozzle. The flexure is completely rusted and has no chance of sealing.
In Figure 5, a portion (circled) of the controller was removed to identify corrosion inside the air passage.
Certainly, the possibility of total failure exists with particulate in this area. Once corrosion occurs, it is nearly impossible to recover the parts. They must be replaced.
Figure 6 depicts the internals of a controller with many intricate parts. Again, all of the aluminum parts are corroded and the steel parts are rusted.
In Figure 6, the arrows point to some of the areas affected by either rust or corrosion.
NUREG/CP-0152, Vol. 43B-5

NRC/ASME Symposium on Valve and Pump Testing
Positioner
Positioners are also susceptible to Poor Air Quality. Depending on style, a positioner can have very small orifices that clog easily. The same common results apply to positioners:
"* Small orifices wash out "* Nozzles wear prematurely "* Parts corrode or rust "* Partial to complete blockage "* Poor controllability "* Total failure
Positioner Case
Figure 7 depicts how Poor Air Quality affects the positioner housing. Note the corrosion throughout the case.
In Figure 7, it's obvious by the amount of corrosion how moisture affected this instrument. The circled area represents the end of the travel arm. It is corroded so severely that it will not move! Therefore, control is impossible.
The arrow points to one of the ports through which air travels. These ports can corrode to the point that no air will transfer.
The blocked area is the nozzle exhaust; it is also corroded.
Pilot
The pilot or shuttle valve is a common prey of Poor Air Quality. When damaged, the pilot can cause the instrument to control poorly or fail. Figure 8 is an example of the affects of Poor Air Quality.
The build-up and oxidation seen in Figure 8 are a product of contaminants in the system.
Note: Figure 8 assembly is not indicative of normal assembly, but intended for visual aid purposes only.
Build-up and Oxidation are both the result of Poor Air Quality and could be addressed by eliminating the moisture in the system.
Shuttle Valve
Figure 9 is another style of pilot. The pilot shuttle should not be able to sit in one position as illustrated; it should freely drop through.
The shuttle in Figure 9 should move freely through the hole in the pilot block. The shuttle does not move freely, but hangs up because of abnormal wear to the shuttle (spool-piece) and block.
The sharp edges of the disk-like (circled area) of the shuttle were no longer sharp ninetydegree angles, but rough. The rough edges created by the contaminants caused the shuttle
to drag. In turn, the drag caused oscillation and poor process flow conditions.
Upon identifying this condition, the pilot assembly should be replaced as soon as
possible as the potential for total failure exists.
Flapper Assembly
Figure 10 shows how contaminants can collect on aflapper and prevent the nozzle from performing properly.
Summary
Moisture is like an air leak, it does not get
better until action is taken to correct it and will eventually cause damage if ignored.
Actuator and Components
Actuators tend to be left out of the loop when considering Poor Air Quality. After
NUREG/CP-0152, Vol. 4
NRC/ASME Symposium
on Valve and Pump Testing
3B-6

NRC/ASMIE Symposium on Valve and Pump Testing
all, actuators are not intricate instruments and they do move massive quantities of air through significant openings. True they are not intricate in their workings, but it is a costly mistake to leave them out of the loop.
Contaminants in the air system are equally affective in damaging the actuator. Internal lubricants will collect debris and damage soft goods as well as actuator stems and cylinder walls. Figure 11 is an example of how Poor Air Quality can affect an actuator stem.
The lubricant identified on the stem was not put there as a part of maintenance. It was blown out from the bushing that houses the o-rings.
To mention a few, many things can cause o-rings to leak: "• Contaminants "• Unusual temperature changes "• Poor Maintenance "* Side loading "• Improper or no lubricant
After time the o-rings will become hard and brittle if left unattended and will leak. This leak would not be considered "Maintenance Induced," but a result of lack of maintenance.
Nonetheless, when lubricant is spotted on a stem that was not part of maintenance, it warrants attention.
If time and assembly practices are not a factor, then the leak could be the result of Poor Air Quality. The stem wear and lubricant blow-by seen in Figure 11 resulted from Poor Air Quality. The lubricant collected particulate and wore the stem, which in turn created a leak path.
Bushing
Figure 12 is the bushing taken from the same actuator as the diaphragm assembly (refer to Figure 11).
None of the remaining lubricant in this bushing was pliable. It was either completely dried out or blown out due to poor maintenance and particulate in the system.
The vent was compacted; therefore, it could not vent. The bushing o-rings were like glass. Upon removal, one of the o-rings shattered.
The vent is there to allow air to flow while stroking the valve.
Summary
Through proper training, personnel will learn how Poor Air Quality affects actuators and how to prevent it.
Valve Components
Even further removed from the Poor Air Quality train of thought is the valve itself. After all no air goes to the valve, only process. Nonetheless, valve damage can be a result of Poor Air Quality. Figure 13 is a plug removed from a rotary valve. Both the regulator and positioner were severely damaged by moisture. Consequently, the positioner could not supply enough air to the actuator to accomplish full seat load. It's been said, "A picture is worth a thousand words." Figure 13 speaks for itselfl
Obviously, this is a severe case, but it's not the only case where Poor Air Quality caused damage to the valve. Point being; Air Quality is very serious and should not be taken lightly.
NUREG/CP-0152, Vol. 43B-7

NRC/ASMEf Symposium on Valve and Pump Testing
Compressed Air Quality
"What is the compressed air quality?" Air
quality is measured by the amount of moisture
and contaminants in the compressed air. We
must be aware of the moisture levels in the
compressed air system, which will indicate the performance of the air dryer and other
moisture removal equipment (aftercoolers, drain traps).
Moisture level defined
Atmospheric Dew Point is the lowest temperature at which air will hold moisture at
atmospheric pressure without condensation.
Pressure Dew Point is the lowest temperature at which air will hold moisture at compressed pressures, without condensation. A pressure dew point will always provide a lower atmospheric dew point, i.e., a +35...F pressure dew point @ 100 PSI will yield an
atmospheric dew point of -10...F. Therefore, all moisture levels should be calculated as
pressure dew point, not atmospheric.
With today's affordable pressure dew point
monitors, all plants should have portable or stationary dew point monitors.
Quality Standard for Instrument Air
The Instrument Society of America defines Dew Point as follows:
Dew Point at line pressure (Outdoor installations)
" Where any part of the instrument air system is exposed to the outdoor atmosphere.
" The dew point at line pressure shall be at least 10...C (18...F) below the minimum local recorded ambient temperature at the plant site.
Dew Point at line pressure (Indoor installations).
The dew point at line pressure shall be at least 10...C (18...F) below the minimum temperature to which any part of the instrument air system is exposed at any season of the year. In no case should dew point at line pressure exceed 2.. .C (approximately 35...F).
How to eliminate the moisture
1. Compressor Intercoolers
In a multistage compressor, it is advantageous to lower the air temperature between stages with an intercooler. The intercooler is normally a shell and tube heat exchanger using water as the cooling media. This could also be an air-cooled unit depending on ambient conditions.
2. Aftercoolers
After the last stage of compression, the air should be cooled before entering the
compressed system. This is typically done
prior to the air dryer. The aftercooler is a
shell and tube heat exchanger using water as the cooling media. The air will normally
be in the tubes with the cooling water in
the shell. This can also be done with an air
cooled aftercooler. With the compressed air
temperature reduced, the water vapor in the air will condense and can be removed.
3. Separators
To insure removal of water and any particulate
contaminants, a separator is used downstream
of the aftercooler. This is a mechanical separator designed to separate water from air.
A trap is installed on the separator to remove the water from the system.
NUREG/CP-0152, Vol. 4 3B-8

NRC/ASME Symposium on Valve and Pump Testing
4. Air Dryers
These units should be selected for the pressure dew point required by the plant.
"• Refrigerant air dryer is +38 0 F dew point.
"* Desiccant air dryer is -40'F dew point (Normal).
Conclusion
Properly maintaining all components producing or transferring supply/instrument air will extend the life of all associated components. Upon creating a maintenance program to identify concerns, trending should be done to predict future maintenance. Benefits are seen in maintenance cost, as low as reasonably achievable (ALARA) radiation exposure, and component replacement.
Figure 1: Air Supply Regulator Internals
There is an overwhelming consensus to blame the component for failure; in reality the majority of the time, failure is Maintenance induced.
References
Regulator Specifications provided by: Emerson Process Management http://www.emersonprocess.com/fisher/ support/
How to eliminate the moisture provided by: Plant Support and Evaluations, Inc. http://www.plantsupport.corr/
Quality Standard for Instrument Air provided by: The Instrument Society of America (ISA) http://www.isa.org/
Figure 2: Broken Fastener
NUREG/CP-0152, Vol. 4
7
3B-9

NRC/ASME Symposium on Valve and Pump Testing
Figure 3: Debris
Figure 5: Air Passage Way
NUREG/CP-0 152, Vol. 4
Figure 4: Controller
Figure 6: Controller Internals
3B-10

NRC/ASME Symposium on Valve and Pump Testing
Figure 7: Positioner Corrosion
Figure 8: Partial Pilot assembly Figure 9: Pilot/Shuttle
NUREG/CP-0152, Vol. 43B-11

NRC/ASME Symposium on Valve and Pump Testing
Particulate and Residue
Figure 10: Flapper Assembly Figure 11: Stem/Diaphragm Assembly
Figure 12: Actuator Bushing Figure 13: Rotary Plug
NUREG/CP-0152, Vol. 4 33B-12

NRC/ASME Symposium on Valve and Pump Testing
Figure 14: Another view of the plug.
NUREG/CP-0152, Vol. 4313-13

Non-Metallic Bearing Friction Test Program for Quarter-Turn Valves
R. J. Sicking and P D. Alvarez, Kalsi Engineering, Inc. John Hosler, Electric Power Research Institute
Abstract Knowledge of torque requirements for quarterturn valves has become increasingly important in U.S. nuclear plants in recent years. Valve and actuator efficiency has become paramount to ensure that safety related valves will perform reliably under design basis flow and differential pressure conditions. To address this issue, EPRI developed the MOV Performance Prediction Methodology (Reference 1) model to evaluate butterfly valve torque requirements. This model is currently applicable only to valves with metallic bearing materials. For those valves with non-metallic bearings, only unvalidated bearing friction values are available.
To address this industry need, EPRI contracted with Kalsi Engineering to design a test fixture to measure friction coefficients of non-metallic bearings under various plant conditions. The fixture captures the peak and running torque required to rotate a 17-4 PH stainless steel shaft within several non-metallic bearing sets. The test scope includes variations in bearing load, fluid media, temperature and dwell time under load.
The test program is conducted under the Kalsi Engineering Quality Assurance Program that meets 1OCFR50 Appendix B requirements. The test data will be analyzed and compiled into a report that ultimately defines validated friction coefficients for non-metallic bearings
of different materials. This information will benefit utilities by having accurate friction coefficients used in torque calculations that will ensure reliable valve operation while avoiding valve/actuator modifications and unnecessary technical effort. In addition, data will be used to extend the applicability of the PPM butterfly valve model to valves with non-metallic bearing materials.
Background
The ability of a quarter-turn valve to open and close can be essential to the safe operation of a nuclear power plant. The existing EPRI MOV PPM model is not applicable for use in defining torque requirements for butterfly valves with non-metallic bearing materials. To address this shortcoming, a test program has been initiated to provide data required to define design coefficient values for non-metallic bearing materials typically found in nuclear service. To date, only 1 of the 5 non-metallic bearing materials has been tested. This paper describes the test system, test scope and procedures and provides preliminary results and conclusions.
Test Scope
A survey (Reference 2) conducted in 1999 by EPRI identified that the most commonly used non-metallic bearings in the nuclear industry are Teflon, nylon, and PEEK. The materials
NUREG/CP-0152, Vol. 43B-15

NRC/ASME Symposium on Valve and Pump Testing
chosen for this test include the materials identified by EPRI plus Nomex and Duralon. Each bearing type will be evaluated under the same test conditions. Table 1 describes the test matrix for one bearing specimen. Initial testing under zero contact stress is performed to determine the parasitic torque in the fixture and to certify that the test equipment, instrumentation, and data acquisition are performing as intended. Each reciprocal stroke is comprised of rotating the shaft 90 degrees in each direction.
Test Fixture
The test fixture used to perform the tests is shown in Figure 1 and Figure 2. The body of the test fixture was designed with the capability of applying an adjustable lateral (upward) load while a shaft rotates within the non-metallic bearings such as in typical butterfly, ball, and eccentric plug valves. The lateral load is applied to the center portion of the shaft. The length and diameter of the shaft are designed to create the shaft bending and associated bearing edge loading typical of quarter turn valves. The lateral load to the shaft is applied through a roller bearing assembly, which has significantly lower friction (- 10-2) than the test bearings in order to minimize measurement errors associated with parasitic torque.
The test fixture can accommodate testing with air and clean cold or hot water as the fluid medium. When testing with water, two lowfriction Nitroxile U-seals installed between the bearing housing and shaft prevent water migration into the bearing assembly.
The water is heated using immersion heaters located below the shaft. To prevent fluid contamination due to metal oxidation, all the wetted surfaces were nickel plated or made from stainless steel.
The shaft is turned using an electric actuator, which provides constant and smooth 90-degree rotation at a speed of 0.5 revolutions per minute.
Fixture and Specimen Cleanliness
Prior to assembly the fixture and specimen are cleaned to remove any fluid that might affect the results of the test. Metallic parts are washed with a trisodium phosphate solution in distilled water, rinsed with distilled water, dried, wiped with acetone, and then wiped with alcohol. Non-metallic parts are washed in distilled water, rinsed, and dried.
Instrumentation and Data Acquisition
The lateral load is measured using a high accuracy compression load cell mounted directly above the shaft. A rotary torque cell mounted between the actuator and the shaft measures the torque applied to the shaft by the actuator. A J-type thermocouple is mounted in the fixture to measure and control the temperature. Table 2 gives the overall measurement accuracy requirements imposed on the acquired data.
Data are collected using ScadaPro software and DataScan and Computerboard data acquisition boards. Data are collected at three different sample rates.
1. One sample every 10 seconds: This sampling rate is applied throughout the entire duration of each test sequence in order to capture the entire history of the test. These data are only used to provide an overall view of the test sequence and not for data reduction.
2. 10 samples per second: This sample rate is used any time the shaft was rotated. These data are used to calculate the
NUREG/CP-0152, Vol. 4
NRC/ASME Symposium
on Valve and Pump
Testing
313-16

NRC/ASME Symposium on Valve and Pump Testing
average coefficient of friction during the running portion of the stroke.
3. 1,000 samples per second. This sample rate is used to capture peak torque values to determine the breakaway coefficient of friction values. These data are captured during the initial rotation (- 5 seconds) of the shaft at the beginning of each test sequence and during some of the torque reversals within a test sequence. This sample rate is also used during the initial rotation after the dwell period.
The equation used to determine the coefficient of friction is of the form
2T LD
where p is the friction coefficient, T is the applied torque, L is the applied lateral load, and D is the stem diameter of the test bearing.
Discussion of Results and Conclusions
Figure 3 shows a typical breakout friction trace plotted with the corresponding torque. Figure 4 depicts a typical 90-degree shaft rotation. Note that the torque and friction pass through zero as the torque from the preceding rotation is relaxed and then builds in the direction of rotation. Figure 5 shows an example of a typical test sequence including 10 reciprocal strokes.
The results of the first series of tests show that the bearing friction coefficient is dependent on rotation direction, fluid type, contact stress level, dwell time, and temperature. The following describes the observed dependencies.
Rotation direction: The bearings exhibited a distinct and repeatable difference in coefficient of friction when the shaft was
rotated clockwise versus counterclockwise as shown in Figures 5 and 6. This is attributed to surface finish directionality caused by the shaft manufacturing process.
Fluid type: The tests performed using air and distilled water shows that the breakout and running coefficients of friction are generally higher in air than in water as shown in Figure 6.
Breakout friction: Data acquired at high sample rates shows that the breakout coefficient of friction is generally higher than the average running coefficient of friction. See Figure 6. In addition, it was noted that the highest valve of breakout friction occurred in air during the first stroke of the test program (with no significant dwell time at load prior to the test).
Contact stress level: Two lateral (upward) loads were applied to the bearings to yield approximately 1,000 psi and 2,000 psi. The coefficient of friction under the lower contact stress was somewhat greater than under the higher contact stress level as seen in Figure 7. This difference was observed to be largest when the bearings were tested in ambient air and hot water.
Dwell time: Tests were performed using four different dwell times at room temperature and one dwell time under elevated temperatures. As shown in Figure 8, the breakout coefficient of friction at room temperature increased slightly from the 0-hour dwell time test to 4-hour dwell test and then remained relatively constant thereafter. At the elevated temperature, the breakout torque increased -100% after the 16-hour dwell time. This test is intended to investigate the extent to which the coefficient of friction can increase when a valve remains closed under differential pressure.
NUREG/CP-0152, Vol. 43B-17

NRC/ASME Symposium on Valve and Pump Testing
Quality Assurance
All testing activities were performed under the Kalsi Engineering Quality Assurance Program, which satisfies 1 OCFR50 Appendix B requirements.
References
1. 1006206: EPRIMOVPerformance Prediction Program: Performance
Prediction Methodology (PPM) Version 3.0 User Manual and Implementation Guide, Electric Power Research Institute, Palo Alto, CA, December 2001.
2. TR- 113561: EPRI Performance Prediction Program: Friction Coefficients for Non-Metallic Butterfly Valve Bearing Materials, Electric Power Research Institute, Palo Alto, CA, December 1999.
Figure 1. Bearing Test Fixture
NUREG/CP-0152, Vol. 4 313-18

NRC/ASME, Symposium on Valve and Pump Testing
Figure 2. Photo of Bearing Test Fixture
NUREG/CP-0152, Vol. 4
0
Figure 3. Breakout torque is significantly larger than running torque.
3B-19

NRC/ASME Symposium on Valve and Pump Testing
Figure 4. Rotation reversal reflects zero torque just prior to motion.
Figure 5. Test data for 10 cycles shows that friction is somewhat higher in one direction than the other under the same load.
NUREG/CP-0152, Vol. 4 3B-20

NRC/ASME Symposium on Valve and Pump Testing
IT-2 1T-3 1T-4 IT-S 1T-6 IT-7 2T-2 2T-3 3T-2 T"-3 3T-4
Figure 6. Friction coefficients are generally higher in air than in water and vary depending on the stroke direction, temperature, and dwell time.
0 Low Load Friction Coefficient O High Load Fnction Coefficient
Ambient Air Ambient Wate Hot Water
Figure 7. Breakout friction coefficients are higher with a low contact stress (1000 psi) than with a high contact stress (2000 psi).
NUREG/CP-0152, Vol. 43B-21

NRC/ASME Symposium on Valve and Pump Testing
Ambient Hot Air Water
No dwell 2 hrs. dwell 4 hrs. dwell 16 hrs. dwell 72 hrs. dwell No dwell 16 hrs. dwell
Figure 8. Dwell times have little affect on breakout friction coefficients in ambient air, but have a large effect in hot water.
NUREG/CP-0152, Vol. 4 3B-22

NRC/ASME Symposium on Valve and Pump Testing
Table 1. Test Matrix for Each Bearing Material
Test Test Fluid Contact Fluid No of Dwell Time
Number Stress Temp Reciprocal Under Load psi OF Strokes and No Rotation
IT-I Air 0 Ambient 10 0 hrs
1T-2 Air 1,000 Ambient 10 0 hrs
1T-3 Air 2,000 Ambient 10 0 hrs
1T-4 Air 2,000 Ambient 1 2 hrs
.IT-5 Air 2,000 Ambient 1 4 hrs
IT-6 Air 2,000 Ambient 1 16 hrs
IT-7 Air 2,000 Ambient 1 72 hrs
2T- 1 Distilled Water 0 Ambient 10 0 hrs
2T-2 Distilled Water 1,000 Ambient 10 0 hrs
2T-3 Distilled Water 2,000 Ambient 10 0 hrs
3T- 1 Distilled Water 0 200 10 0 hrs
3T-2 Distilled Water 1,000 200 10 0 hrs
3T-3 Distilled Water 2,000 200 10 0 hrs
3T-4 Distilled Water 2,000 200 1 16 hrs
Table 2. Overall Measurement Accuracy Requirements
Parameter Range Accuracy Requirement
Temperature 32'F to 3007F Within +/- 57F
Load 0 to 20,000 lbs Within +/- 0.5% FS
Torque 0 to 250 ft-lb Within +/- 1% FS
NUREG/CP-0 152, Vol. 43B-23

Butterfly Valve Model Improvements Based on Compressible Flow Testing
Benefit Industry AOV Programs
M S. Kalsi, B. E. Eldiwany and V Sharma Kalsi Engineering, Inc.
Abstract
U. S. Nuclear Regulatory Commission (NRC) issued Regulatory Issue Summary 2000-03 recommending that all U. S. nuclear power plants take necessary steps to ensure that all safety related power-operated valves will perform their safety related functions under design basis conditions [1]*. Power operated valves included a large population of quarter-turn air operated valves (AOVs) and hydraulically operated valves (HOVs) for which industry had no validated models. An earlier paper [2] describes a comprehensive development program undertaken by Kalsi Engineering, Inc., to provide validated quarterturn valve models needed by the industry. Phase I of this program included a large matrix of incompressible flow tests performed on various types of butterfly, ball and plug valves used in AOVs [2]. The present paper describes Phase 2: The compressible flow test program that is presently being conducted to validate the new quarter turn valve models. The benefits of the new validated models to actual containment purge and vent valves are also included in the paper.
The new models have significantly advanced the state-of-the-art in accurately predicting
* The numbers in brackets denote references listed at the end
of this paper.
torque requirements typically for quarterturn valve design variations and operating conditions encountered in nuclear power plants.
Background and Introduction
As shown in Figure 1, there is a fundamental difference in the actuator output between the typical electric motor operated valves (MOVs) and air-operated valves (AOVs) that directly affects the margin between the actuator output torque capability and valve torque requirements. Since the output from a typical AC powered MOV actuator is constant throughout the stroke, only the peak required torque magnitude, regardless of the stroke position where it occurs, is important to determine margin throughout the stroke. However, the output of a typical quarter-turn AOV actuator varies with stroke; therefore, the models to predict torque requirements for the valve need to have a position dependent accuracy to determine margin at each point of the stroke.
There were two significant programs in the industry that included testing and validated models of butterfly valves for safety-related nuclear power plant MOV applications:
0 The NRC/INEL Containment Purge and Vent Valve Test Program [3, 4], and
NUREG/CP-0152, Vol. 43B-25

NRC/ASME Symposium on Valve and Pump Testing
EPRI's Butterfly Valve Guide [5] and MOV Performance Prediction Methodology (EPRI MOV PPM) Development Program [6].
Under the NRC/INEL program, three butterfly valves were tested with gaseous nitrogen under blowdown conditions. This testing was limited to single offset disc design, because the NRC survey results showed that this design has the dominant population in the U. S. nuclear power plants. Symmetric disc, double and triple offset disc designs were not included in this test program. Furthermore, the NRC/INEL program did not include testing of two valves in series.
The EPRI MOV PPM included the development of models for symmetric, single and double offset disc designs. The scope of EPRI test programs, however, was limited to incompressible flow testing of symmetric and single-offset disc designs. Furthermore, the EPRI MOV PPM did not have a specific criteria for position dependent accuracy, as long as the peak dynamic torque requirements were bounding, because the objective of the EPRI program was to address motor-operated valves. The EPRI MOV PPM model was validated against the NRC/INEL test data and found to provide bounding predictions of torque requirements [6]. However, as shown in Figure 2, the torque signature predicted by the model was found to be unconservative over certain portions of the stroke. Therefore, EPRI cautions the users not to use the torque signature for determining torque requirements especially for compressible flow applications [6, 8].
In addition to these two major industry programs, there has been some limited amount of compressible flow testing done by other investigators [9, 10, 11 ]. Although those investigators presented some informative
insights, they did not provide models or validated test data for butterfly valves used in nuclear power plant applications.
To overcome the above-described limitations of the NRC/INEL program, the EPRI MOV PPM and other industry programs, Kalsi Engineering, Inc., initiated a new quarterturn valve model development and testing program. Under Phase 1 of the program (which has been completed) incompressible flow tests were performed on a large number of quarter-turn butterfly, ball and plug valves. Phase 2 of this program covers compressible flow tests being performed on various types of butterfly valves, as described below.
Phase 2: Compressible Flow Test
Program
Objectives
The objectives of the Phase 2 Test Program are to test quarter-turn valves under compressible flow to quantify the effect of:
1. Geometry of disc shapes commonly used in nuclear power plant applications on aerodynamic torque;
2. The ratio of the differential pressure and upstream pressure on torque predictions; and
3. Upstream elbows on the torque requirements for valves of different geometries.
Test Matrix
The following parameters were varied in the test matrix:
"* Disc geometry: symmetric, single offset, double offset
"* Disc orientation for non-symmetric disc valves: shaft upstream, shaft downstream
NUREG/CP-0152, Vol. 4
NRC/ASME
Symposium
on Valve and Pump Testing
3B-26

NRC/ASME Symposium on Valve and Pump Testing
"* Upstream sources pressures (psig): 75, 60, 45, 30, 15, 10, 5
" Pressure ratios (P /Pdow): Varied from 1.33 to 6 by throttfing the downstream throttle valve (DTV)
"* Location of upstream elbow: OD-8D
"* Orientation of upstream elbow
All tests were performed on 6-inch scaled models that represent various disc shapes and aspect ratios of actual valves (Figure 6). The approach of using precisely scaled models to predict performance of large valves has been validated as shown in Figures 4 and 5 [5].
Facility Description
The compressible flow blowdown test facility (shown in Figure 3) consists of three 3600 ft3, 425 psig tanks supplied by a 383 cfmi Ingersoll Rand reciprocating-pump air compressor, a 60 feet long 6-inch straight pipe test section with an open field at the discharge. A quickopening 6-inch 300-lb air-operated ball valve, used to initiate or block the flow, is located at the head of the test section. The flow metering section, located immediately downstream of this block vale, and consists of 20 feet (40D) of straight pipe followed by a Dieterich mass flowmeter. The test valve is located 30 feet (60D) downstream of the flowmeter. The downstream throttle valve (DTV), a 6-inch motor-operated butterfly valve, is located 8 feet (I 6D) downstream of the test valve. The DTV is followed by 2-feet of open-ended discharge pipe.
Figure 7 shows actual air blowdown testing in progress with a fully open butterfly valve downstream of the test valve.
Instrumentation
Table 1 provides the range and uncertainty of the following parameters that were measured:
" Flow: The flowmeter is a Dieterich Standard Mass ProBar with a 4-20 mAmp output calibrated to measure a mass flow rate of 120,000 PPH. This flow meter is an annubar with a Rosemount differential pressure (DP) transmitter that measures DP and fluid temperature to instantaneously compute mass flow. The ProBar is also equipped with an electronic module that provides the absolute pressure, DP and temperature at the annubar.
" Pressures: Pressures are measured on the supply header (P3), and upstream (P1) and downstream (P2) of the test valve, using 100 psig 4-20 mAmp pressure transmitters. Pressure taps for P 1 and P2 are located at 2D upstream and 6D downstream of the test valve per ANSI ISA-S75.02-1996 Standard [12].
" Differential Pressure: Two different approaches are used to obtain DP measurements with a high degree of accuracy. Low DP's (under 36 psi) across the test valve are measured using a Rosemount DP transmitter to minimize measurement uncertainty. DP above 36 psi is calculated by subtracting measured values of P2 from P 1.
" Temperatures: Thermocouples located at 2D upstream and 6D downstream of the test valve measure the fluid temperatures, TI (upstream) and T2 (downstream), respectively.
" Angle: Disc angle is measured using a 5-inch 4-20 mAmp linear position indicator with a cable attached to it that wraps around a grooved drum installed
NUREG/CP-0152, Vol. 43B-27

NRC/ASME Symposium on Valve and Pump Testing
the valve stem. Valve position is measured continuously from 0-degrees (full closed) to 90-degrees (full open).
* Torque: Stem torque is measured using a 1500 in-lb calibrated torque cell comprising a full Wheatstone bridge that is directly coupled to the valve stem.
Test Procedure
The standard test sequence consists of 24 open and close strokes consisting of 3 static tests, 7 partial stroke dynamic tests, and 14 full stroke dynamic tests, as shown in Table 1. Two opening and closing static tests are run at the start of the test sequence one with the test specimen un-pressurized and the other with the test specimen pressurized to the maximum test pressure. Only the un-pressurized pair of static tests is repeated at the end of the test
sequence. In each of these three static tests the differential pressure across the test valve is zero.
Partial stroke tests are performed at each level of upstream test pressure to be tested (7 in the complete test matrix). Each partial stroke test comprises stroking the valve closed from a 10 degrees open position and then reopening it to a 10 degrees open position. This enables an accurate evaluation of bearing torque and
bearing coefficient of friction for the pair of full dynamic strokes that follow the partial stroke.
All dynamic strokes are performed using the discrete resistance test method, i.e., the upstream and downstream piping resistance is held constant and the test valve opening angle is varied over its entire range from 0' to 900. Both the baseline and elbow test matrices are conducted using this typical test sequence.
Additional tests were performed to further evaluate the effect of certain specific parameters on-aerodynamic torques and torque coefficients over a wider range of choked and unchoked flow conditions. A series of such tests are discrete disc angle tests. During each of these tests, the test specimen's opening angle is held constant, and the flow
is varied by throttling the downstream valve. Other examples of additional tests that were performed are: (1) where the downstream throttle valve is removed and the test
specimen discharges directly to atmosphere, and (2) when the downstream pressure tap is moved further downstream.
Data Processing
" Raw data acquired from the static, dynamic and bearing torque tests are first averaged per degree of disc opening.
" Packing friction is calculated from static tests performed with and without the system pressure.
"* The bearing torque is calculated and used to determine a bearing torque coefficient, which in turn is applied to calculate bearing torque at various valve differential pressures. These bearing torques are used with dynamic torque data at each corresponding disc position to determine the opening and closing aerodynamic torque and torque coefficients.
" Non-dimensional aerodynamic torque coefficients, Ct and CtC are calculated by dividing the aerodynamic torque by the cube of the stem diameter and valve differential pressure or absolute pressure upstream of the test valve, respectively.
Quality Assurance
All testing and model development program activities were conducted under a quality
NUREG/CP-0152, Vol. 4
NRC/ASME Symposium
on Valve and Pump
Testing
3B-28

NRC/ASME Symposium on Valve and Pump Testing
assurance program that meets the 1OCFR50 Appendix B requirements.
Results and Discussion
The key results from compressible flow tests performed on a non-symmetric disc of a double-offset design are presented in this section. Results are presented in Figures 8 through 12.' The results presented are for shaft downstream orientation (flat face forward) only, since this orientation exhibits certain interesting characteristics (e.g., change in the direction of the hydrodynamic torque) that are not present in the shaft upstream tests. During all blowdown tests, the facility was able to provide a relatively constant pressure upstream of the test valve for various test pressure levels covered by the matrix (Figure 8).
The aerodynamic torque results for different upstream pressures from the highest to the lowest range in the matrix are shown in Figure 9. As expected, the hydrodynamic torque decreases as the upstream pressure is decreased. However, this change is not linear at all disc positions, as shown in the non-dimensional torque coefficients derived from these tests. The torque coefficients vary significantly for different pressures, and at different disc positions. This dependence is different for each disc angle and is governed by the disc shape and the ratio of upstream to downstream pressures. In fact, the torque changes direction from self-opening to selfclosing as one transitions from highly choked conditions to low upstream pressure unchoked conditions.
A significant objective of the compressible flow test program was to determine the influence of flow resistance downstream of the test valve on the torque requirements. Since containment purge valves are used
in pairs, this is especially important for inboard valve torque requirements because they are influenced by the presence of the outboard valve. Figure 11 shows that the magnitude of the downstream resistance from low to medium to high dramatically affects the hydrodynamic torque requirements for an offset disc with a shaft downstream orientation. This can provide a significant relief on torque requirements for the inboard valve.
To provide more detailed insight into the dependence of aerodynamic torque on pressure ratios from highly choked conditions to unchoked low AP conditions discrete angle tests were performed. The results from discrete angle tests for two different disc positions (350 and 600) are shown in Figure 12. The aerodynamic torque decreases non-linearly as a function of AP/P1 p ratio, and for high disc opening angles; it changes direction from self-opening to self-closing. The phenomenon responsible for such behavior depends upon pressure distributions on the upstream and downstream side of the faces that are affected by the movement of the shock fronts that emanate at the disc edges and move onto the downstream side of the disc.
In summary, the compressible flow tests are providing validated data for non-dimensional aerodynamic torque coefficients and their dependence on various disc shapes, disc orientation, disc angle, downstream resistance, upstream pressure, and AP/Pup ratio.
Benefits In Actual Containment Purge & Vent Valve Applications
Figure 13 shows an actual 18" double-offset disc containment purge valve application in which the use of new validated compressible flow butterfly valve models was able to provide a positive margin (where negative
NUREG/CP-0 152, Vol. 43B-29

NRC/ASME Symposium on Valve and Pump Testing
margins were previously calculated using earlier methodologies). This eliminated the need for equipment modifications.
Figures 14 and 15 show 6" precisely scaled models of a 48" single-offset design and 18" double-offset design containment purge valves that were manufactured to address plant-specific margin issues. The prediction of validated torque requirements based on precisely scaled models eliminates the conservative factors included in our new generic butterfly valve models to cover variations in the hydrodynamic torque due to minor variations in disc shapes of basic generic category, (e.g., symmetric, singleoffset, double-offset).
Conclusion
The Phase 2 Compressible Flow Test Program provides significant improvement in predicting midstroke torque requirements for quarter-turn valves used in critical, safetyrelated applications in nuclear power plants. The improvements in AOV margins provided by the new models have eliminated the need for equipment modifications in several applications.
Acknowledgements
The authors are deeply grateful to the many utility engineers who supported the technical development of this work. Kalsi Engineering also acknowledges EPRI and the U. S. NRC
for providing the foundation for this research.
References
1. NRC Regulatory Issue Summary (RIS) 2000-03; Resolutions of Generic Safety Issue 158: Performance of Safety-Related Power-Operated Valves under Design Basis Conditions.
2. "Dynamic Torque Models for QuarterTurn Air-Operated Valves," M. S. Kalsi, B. Eldiwany, V. Sharma, D. Somogyi, NUREG/CR-0152, Vol. 3, Presented at The 6t" NRC/ASME Symposium on Valve & Pump Testing, Washington, DC, July 17-20, 2000.
3. R. Steele and J. C. Watkins. Containment Purge and Vent Valve Test Program Final Report, U. S. Nuclear Regulatory Commission, NUREG/CR-4141, October 1985.
4. J. C. Watkins, R. Steele, R. C. Hill, and K. Dewall. A Study of Typical Nuclear Containment Purge Valves in Accident Environment, U. S. Nuclear Regulatory Commission, NUREG/CR-4648, August 1986.
5. "Application Guide for Motor-Operated Valves in Nuclear Power Plants, Volume 2: Butterfly Valves" Prepared by Kalsi Engineering, Inc., TR-106563-V2, EPRI, Palo Alto, CA, October 1998.
6. "EPRI MOV Performance Prediction Program: Butterfly Valve Model Description Report," Prepared by Kalsi Engineering, Inc., EPRI TR-103224, Electric Power Research Institute, Palo Alto, CA, September 1994.
7. "Air-Operated Valve Evaluation Guide," TR-107322, Electric Power Research Institute, Palo Alto, CA, May 1999.
8. "PPM Software Information Notice 2002-1 (Prediction of Butterfly Valve Design Basis Required Torque as a Function of Disk Position)," EPRI, Palo Alto, CA, May 2002.
9. R. S. Silvester. Torque Induced by a Butterfly Valve Canrying a Compressible Flow, Proceedings of the Institution of
NUREG/CP-0152, Vol. 4 3B-30

NRC/ASME Symposium on Valve and Pump Testing
Mechanical Engineers, Vol. 196, pp. 229237, London, 1982.
10. Test Report on an Allis-Chalmers 6-Inch Streamseal Butterfly Valve in Air Concerning Nuclear Containment Isolation Valves, tests performed by NASA/Langley Research Center, Allis-Chalmers Report VER-0209, December 17, 1979.
11. M. J. Morris and J. C. Dutton. An Experimental Investigation of Butterfly Valve Performance Downstream of an Elbow, Journal of Fluids Engineering, Transactions of the ASME, Vol. 113, March 191, pp 81- 8 5 .
12. Control Valve Capacity Test Procedure, ISA-S75.02 Standards, Instrument Society of America, 1996.
NUREG/CP-0152, Vol. 43B-31

NRC/ASME Symposium on Valve and Pump Testing
Table 1 Standard Test Sequence for a Selected Preset Angle of the Downstream Throttle Valve.
The Complete Sequence of Tests is Repeated with Different Preset Angles to
Simulate Different Downstream Resistances.
Stroke Stroke Description Downstream Throttle Target Upstream Stroke
No. Valve Angle Pressure, psig Direction
1 Static Stroke 0 0 0 + C 0
2 Static Stroke 0 Max Pressure 0-+ C -0
3 Partial Stroke (100) Preset Angle 75 C -*0 -0 C
4 Dynamic Stroke Preset Angle 75 0 - C
5 Dynamic Stroke Preset Angle 75 C -0
6 Partial Stroke (100) Preset Angle 60 C -+ 0 -+ C
7 Dynamic Stroke Preset Angle 60 0 - C
8 Dynamic Stroke Preset Angle 60 C - 0
9 Partial Stroke (100) Preset Angle 45 C -- 0 -+ C
10 Dynamic Stroke Preset Angle 45 0 -* C
11 Dynamic Stroke Preset Angle 45 C . O
12 Partial Stroke (100) Preset Angle 30 C --* 0 - C
13 Dynamic Stroke Preset Angle 30 0 -+ C
14 Dynamic Stroke Preset Angle 30 C -0
15 Partial Stroke (10°) Preset Angle 15 C --+ 0 --+ C
16 Dynamic Stroke Preset Angle 15 0 -+ C
17 Dynamic Stroke Preset Angle 15 C -0*
18 Partial Stroke (10°) Preset Angle 10 C - 0 - C
19 Dynamic Stroke Preset Angle 10 0 - C
20 Dynamic Stroke Preset Angle 10 C -0 0
21 Partial Stroke (100) Preset Angle 5 C -* 0 -* C
22 Dynamic Stroke Preset Angle 5 0 - C
23 Dynamic Stroke Preset Angle 5 C 0 0
24 Static Stroke 0 0 0 -* C-- 0
NUREG/CP-0152, Vol. 4 3B-32

NRC/ASME Symposium on Valve and Pump Testing
Table 2 Instrumentation Range and Accuracy
Parameter Max. Permissible Range Measurement Uncertainty
Pressures ± 1% of full scale 0-100 psi
Differential Pressure ± 1% of full scale 0-1000 in of water
Stem Torque + 1% of full scale 0-1500 in-lb
Valve Travel ± 1% of full scale 0-90 degrees
Fluid Temperature ± 2-degrees -20'F to 200'F
Flow ± 1% of full scale 0-120,000 lbs/hr
NUREG/CP-0 152, Vol. 43B-33

NRC/ASME Symposium on Valve and Pump Testing
Uj :D
0
0 100TRAVEL (%)
Figure 1 Accurate Position-dependent Torque Predictions are Required for AOVs Because the Actuator Output Varies With Travel.
EPRI MOV PPM Required Torque
1,500
1,000
500
0
-500
-1,000
0 10 20 30 40 50 60 70 80 90
Disc Opening Angle
Figure 2 EPRI MOV Required Torque Prediction Bounds Test Data for Compressible Flow. Torque Signature Does Not Bound Test Results And Is Not Intended for Design Basis Calculations IRef. 5, 6, 81
NUREG/CP-0 152, Vol. 4
3
.0
3B-34

NRC/ASME Symposium on Valve and Pump Testing
Figure 3 Compressible Flow Test Facility Showing Test Setup With Two Butterfly Valves in Series
NUREG/CP-0152, Vol. 4313-35

NRC/ASME Symposium on Valve and Pump Testing
42" Valve 6" Model
Figure 4 A Precisely Scaled 6" Model of a 42" Valve Used to Validate Scaling Methodology
NUREG/CP-0152, Vol. 4
NRC/ASM• Symposium on Valve
and Pump Testing
3B-36

NRC/ASME Symposium on Valve and Pump Testing
GA735.3
0.3
#.
C4
I--"
C
0.2
0.1
10 20 30 40 50 60 70 8
Disk Angle, Degrees Figure 5 Test Results Validate the Use of Scaled Models to Predict
Torque Requirements for Large Valves
0
Figure 6 Symmetric, Single-Offset and Double-Offset Disc Geometries Included in the Test Matrix
NUREG/CP-0152, Vol. 4
;i0 _1p
3B-37

NRC/ASME Symposium on Valve and Pump Testing
Figure 7 Air Blowdown Testing in Progress
NUREG/CP-0152, Vol. 4 3B-38

NRC/ASME Symposium on Valve and Pump Testing
0 10 20 30 40 50 60 70 80 90
Disc Opening Angle, degrees
Figure 8 Upstream Test Pressures Were Maintained Relatively Constant for Each Stroke During a Series of Blowdown Tests
NUREG/CP-0152, Vol. 4
SD CL
E Ca $D.
CL M~
3B-39

NRC/ASME Symposium on Valve and Pump Testing
Cr
0
- VE (Self Opening)
Highest Upstream Pressure
0 10 20 30 40 50 60 70 80
Disc Opening Angle, degrees
Figure 9 Test Results Showing the Effect of Upstream Pressures and Choking Levels on Dynamic Torque for Shaft Downstream Orientation
90
NUREG/CP-0152, Vol. 4
NRC/ASME Symposium
on Valve and Pump Testing
3B-40

NRC/ASME Symposium on Valve and Pump Testing
+ VE. (Self Closing)Upstream Pressure
0 a. 5
0 ZE
0
z
- VE (Self Opening) Highest Upstream Pressure
0 10 20 30 40 50 60 70 80 90
Disc Opening Angle, degrees
Figure 10 Non-dimensional Aerodynamic Torque Coefficients for Shaft Downstream Exhibit Strong Dependence on Pressure Drop Ratio
NUREG/CP-0152, Vol. 43B-41

NRC/ASMIE Symposium on Valve and Pump Testing
+ VE
0
L
i 0
-VE
0 10 20 30 40 50 60 70 80
Disc Opening Angle, degrees
Figure 11 Test Results Showing the Effect of Downstream Resistance on Aerodynamic Torque
NUREG/CP-0 152, Vol. 4
90
NRC/ASME Symposium on Valve and Pump
Testing
313-42

NRC/ASME Symposium on Valve and Pump Testing
Self Opening Regime
+ VE 0
C)
0
E 0 0
-VE
V4 :
Disc Positioned at 35 degrees
.1 0.2 0.3 0.4 0.5 0.6 0.7
Ratio of Valve Dp / Upstream Pressure (Absolute)
Figure 12 Effect of Valve AP / P Ratio on Aerodynamic Torque for Offset Disc. For High Disc Openings, Torque Changes from Self-Opening to Self-Closing as AP/ P is Lowered.
NUREG/CP-0152, Vol. 4
Disc Positioned at 60 degrees
0 0
313-43

NRC/ASAE Symposium on Valve and Pump Testing
2,000
. i EPRI MOV PPM Required Torque
1,500
-• Actuator Output Cr 1,°°°00 0~
500
KEI Model Required Torque
0 10 20 30 40 50 60 70 80 90
Disc Opening Angle, degree
Figure 13 An Actual Containment Purge Valve Application Shows Margin Improvement Achieved by the Use of New Validated Compressible Flow Butterfly Models.
NUREG/CP-0 152, Vol. 4 3B-44

NRC/ASAE Symposium on Valve and Pump Testing
Figure 14 6" Precisely Scaled Model of a 48" Single-Offset Design Containment Purge Valve
NUREG/CP-0152, Vol. 43B-45

NRC/ASME Symposium on Valve and Pump Testing
Figure 15 6" Precisely Scaled Model of an 18" Double-Offset Design Containment Purge Valve
NUREG/CP-0152, Vol. 4 3B-46

Session 3(c)
General Issues on Valves II
Session Chair
Chris Hansen Vermont Yankee Nuclear Power Station

Weak Link Analysis of Motor Operated Valves for Korean NPPs *
Yoon-Ho Bae, Min-Ki Hong and Kwang-Nam Lee Korea Power Engineering Company
Abstract
Weak Link Analysis (WLA) has been performed to assess the structural integrity of the motor operated valves (MOVs) according to GL 89-10 for Korean nuclear power plants (NPPs). More than six hundred groups of the MOVs have been analyzed, and most of the MOVs were evaluated by the conventional WLA method [1].
From the experiences of the previously performed WLA, it was found that most of the weak links are disc-stem T-head connections in opening mode and yokes in closing mode. In addition, the bearing stress on the disc is a dominant stress in opening mode.
In these cases, finite element analyses (FEA) were performed to investigate the real stress state of the parts. In the FEA, fatigue analysis of the parts is considered by limiting the maximum von Mises stress and the maximum strain.
This paper discusses the FEA including elastic-plastic deformation of these parts. The results of FEA are compared with those of the conventional WLA. It was found that the bearing stress on the disk calculated by the conventional WLA is about 1.5 times higher than that of the FEA. By performing the elastic-plastic FEA, the higher allowable weak link thrusts were obtained.
1. Introduction
Safety assessments of MOVs in Korean NPPs have been performed to verify the performance of the MOVs according to the GL 89-10 program. This program was started in 1997 in Korea and is expected to be complete in 2005. The safety assessments of the MOVs include system design analysis, stem required thrust/torque calculation, voltage drop calculation, actuator capability analysis, margin analysis, and weak link analysis (WLA) as well as static and dynamic tests.
The WLA has been performed to evaluate the structural integrity of the MOV parts in the load path by using conventional mechanics. The stem and stem nut, actuator mounting flange and bolts, yoke legs, yoke flange and bolts, yoke clamp, bonnet neck, bonnet bolts, and disc-stem connection are in the load path. The actuator thrust/torque and the seismic load are considered in the WLA. Analysis techniques are based on classical static force balancing equations and on classical axial, shear, and bending stress equations. The maximum thrust is calculated by equating the stresses caused by the thrust or torque with the appropriate allowable stress value and then solving for the unknown thrust value. Recognizing that a certain amount of material yielding can occur in ductile materials without
NUREG/CP-0 152, Vol. 43C-1

NRC/ASME Symposium on Valve and Pump Testing
structural failure, simplified plastic methods of analysis are employed for bending and torsional stresses.
More than six hundred groups of the MOVs have been analyzed by using the conventional WLA at the end of 2001. As a result of the conventional WLA, more than 50% of the weak links in closing mode were found to be yoke flanges. The other weak links are stems, actuator flanges, yoke legs and actuator bolts. Most of the weak links in opening mode were found to be the disc-stem connections, especially when caused by the bearing stress due to the contact between disc and stem. Moreover, the allowable weak link thrust of some valve parts such as disc-stem connection and yoke were found to be less than the maximum available thrust of the valve actuator. It is very difficult to change the valve or valve parts, or to improve the valve structure. In these cases, finite element analyses (FEA) were performed to investigate the real stress state of the parts.
This paper discusses the FEA including elastic-plastic deformation of a disc-stem T-head connection and yokes including flange of the MOV assembly. In the FEA, the fatigue analysis of the valve components is considered by limiting the maximum Von Mises stress and the maximum strain. The results of the FEA are compared with those of the conventional WLA.
2. Conventional WLA
2.1 Disc-Stem T-head Connection
A general disk-stem T-head connection is shown in Figure 1. During opening of a valve disk, an upward force applied to the stem, which loads the top of the disk in its T-slotted
area. The stem material is typically a high strength stainless steel, whereas the disk is a lower strength stainless steel. Upward force on
the contacting surface at the top inside of the disk T-slot produces shear, bending, and direct bearing stress in the net section. The lower strength of the disk material, and the resulting
stress state suggests the disk is the weak link in this load condition. A typical stem has truncated circular contact area cross-section. The intersecting contact area of this design is relatively small compared to the width of the disk.
An axial force is applied to the stem. Three sections of the disk are considered as shown in Figure 1. The section A-B of the disc is under tensile and bending stresses, the section A-C is under shear and bending, and the section A-D is under bearing stress. The bearing stress occurs due to the contact between disk and stem T-head due to valve thrust. The bearing stress produced in section A-D is as follows [1]:
D TD 2tws (1)
Where,
TD = allowable weak link thrust for section A-D
t = thickness of section A-D.
ws = average stem T-head width of section A-D.
aD = bearing stress in section A-D.
The allowable weak link thrust of this disk section is obtained by equating the bearing stress with the disk material yield strength. The allowable thrust is as follows [1]:
TD = 2 twsSyD
SD = yield strength of the disc material.
(2)
NUREG/CP-0152, Vol. 4 3C-2

2.2 Yoke
2.2.1 Yoke legs
A typical configuration for the yoke legs is shown in Figure 2. The sections of yoke legs are semicircular and tee types.
(1) Closing Mode
During the closing mode, the yoke legs are subjected to tension, bending, and shear due to thrust and seismic loading. The maximum allowable thrust for the yoke legs is determined by combining the calculated normal and shear stresses on the yoke legs due to the seismic effects of the actuator with the resulting principal stress due to thrust. This combined principal stress is equated with the minimum yield strength of the yoke material. Due to rigidity of the actuator and yoke flanges, it is assumed that the yoke legs are rigidly fixed at both ends. The stresses occurring in the yoke legs are as follows [1]:
(3)Tz FT zlWW1 G YL,r )- + F
N11.4 2.VNLII
TJa, +1/,,Iw, Wa•, G 's = Z .I + NnA
TYL =- ,FT + Wa, NYL-- 1 + YL
Where,
A = cross-sectional area of one leg of yoke.
a, = maximum of the two horizontal accelerations in g's.
NRC/ASME Symposium on Valve and Pump Testing
av = vertical acceleration in g's,
F = stem factor
I = moment of inertia (about cantilever axis of each leg)
I = vertical distance from bottom of yoke to the actuator center of gravity
IC
1.
= (yoke leg centroid distance)/2
= larger value of 1h. or 1h2
'hi = horizontal distance from stem center to actuator center of gravity parallel to pipe
wh2 = horizontal distance from stem center to actuator center of gravity perpendicular to pipe
lW = yoke window height
NYL
TYL
= number of yoke legs
= allowable thrust of the yoke legs.
W = weight of valve actuator
,wtw = yoke leg width or cord length
a'YL, T = tensile stress due to actuator thrust.
(4) Y,,s = tensile stress due to seismic loading.
1YL = shear stress due to actuator thrust and seismic loading.
(5) (2) Opening Mode
During the opening mode, the yoke legs are under a compressive thrust loading. Therefore, the critical thrust loading may be limited by buckling rather than stress. The methods for buckling presented in the ASME Code Section III Division I Subsection NF Supports [2] have been used. The critical compressive load is determined in accordance with the ASME Code. The 2/3 factor is used
NUREG/CP-0152, Vol. 43C-3

NRC/ASME Symposium on Valve and Pump Testing
to limit the compressive loading to 2/3 of the buckling load when using Service Level B, C or D Allowable Stress.
The most important factors governing buckling are the slenderness ratio, which is dependent upon the unbraced length, and the K factor, which is dependent upon end conditions. Recommended K values are
provided in the ASME Code. These K values will change depending upon the actual yoke configuration.
The following assumptions are applied for the yoke legs under compression.
The yoke will fail under compression as a result of buckling of one of the individual legs (i.e., overall buckling of the yoke will not occur).
The K factor for each leg will conservatively be based on Case (a) (K = .65).
Finally, the maximum allowable compressive stress due to buckling is limited by the combined stress equation (6) [1]:
.o ±+GBO <1 (6) PC, z / A S y, L
Where,
TY0 + Wa, SAo -- NY A
FTYIWC W[lak +Iaa]7 2 NyLlcJ Nyj
(7)
(8)
S y, YL = yield strength of yoke legs
TYo = maximum allowable yoke thrust due to buckling
(TAO = total axial compressive stress due to thrust and seismic loading
G BO = total bending stress due to thrust and seismic loading.
2.2.2 Yoke flange
A typical circular flange configuration is shown in Figure 3. The maximum allowed thrust for the non-pressure retaining yoke flange is calculated. Since the yoke flange is in
tension during the closing mode (and bearing and compression during opening mode), only the closing mode is critical. The stresses occurring in the yoke flange are as follows [1]:
PYF I YF ZYr (9)
It YF - YF
X( tYF
-Wa,, + Ia, )4y + TyF WheNre N
Where,
(11)
A YB = tensile stress area of one yoke flange bolt
d c = yoke flange bolt circle diameter
NYB = total number of yoke flange bolts
IYF
PC, YL = critical compressive load of yoke legs due to buckling
= moment arm
TYF = maximum allowable yoke flange thrust
NUREG/CP-0 152, Vol. 4
(10)
3C-4

NRC/ASME Symposium on Valve and Pump Testing
tYF = thickness of a yoke flange
X = distance between if yoke legs and bolt circle.
ZYB = section modulus of yoke flange bolts
ZYF = effective section modulus
C YF = normal stress of a yoke flange
"rYF = shear stress of a yoke flange
3. Finite Element Analysis
Generally, the materials of disks and yokes are ductile. As the higher actuator thrust is applied, the conventional WLA will show that the design stress code allowables are exceeded. The code allowable stresses are intended for use with the basic methods of analysis included in the code. It is recognized that the basic methods cannot provide a full detailed stress analysis in cases where loading and design do not satisfy all the assumptions incorporated in the basic methodology. In addition, it was found from the conventional WLA of the valves in Korean NPP that the disk-stem T-head connections and the yokes have problems for torque switch setting of MOVs.
Therefore, the disk-stem T-head connections and the yokes were analyzed by the FEA including elastic-plastic behavior of the material. Finite element models are constructed using the IDEAS software, and the modeling data are transferred to the ABAQUS/Standard finite element analysis software.
3.1 Disk-stem T-head connection
In the conventional WLA, the disk-stem contact problem does not fit the standard beam theory. For instance, these areas treated
as beams are very short relative to depth and have highly non-uniform loading. Some discussion on the analysis of short deep beams can be found in the literature [3], but only for selected loads and boundary conditions.
The bearing stress calculated by the conventional WLA due to the disk-stem T-head contact pressure is dominant for the allowable thrust of the disk-stem T-head connection as mentioned above. Since the allowable thrust calculated by the conventional WLA is lower than the required thrust, FEA of the parts was performed. The design data and material properties are given in Table 1 and the dimensional data are given Table 2. In order to determine the actual state of stress in the parts, a finite element model was built as shown in Figure 4. This model is made up entirely ofABAQUS C3D1OM element.
For the disk-stem T-head connection, the FEA was performed by modeling only a disk instead of the full modeling of the disk and stem T-head connection. It is assumed that uniform contact pressure is applied on the disk T-slot with the contacting area with the stem. The bottom nodes on the rounded disk surface are fully constrained. For conservatism, the finite element model does not include any comer fillets.
Since the loading considered here is pure axial loading, a quarter symmetry model with appropriate symmetry conditions on cut surfaces simplifies the modeling and analysis without any loss in accuracy.
(1) Elastic FEA
Elastic FEA is performed with a stem axial thrust of 10000 lbf. The resulting stress intensity and principal stress contours in the disk are as shown in Figure 5. The following observations pertain to the elastic FEA results
NUREG/CP-0 152, Vol. 43C-5

NRC/ASME Symposium on Valve and Pump Testing
on the disk comparing the conventional WLA and FEA.
From the results of the FEA, it can be shown
that the stress calculated in the section A-D by
equation (1) is about 1.5 times larger than the
maximum principal stress of FEA. Therefore, the weak link allowable thrust, calculated by
the equation (2), can be increased 1.5 times if
the FEA results are used. However, the stress
is highly concentrated at point D of the disk
affected directly by the thrust. As a result, the weak link allowable thrust is determined at this point and the bearing stress is not
dominant in the elastic FEA. In section A-B, the combined bending and direct tension stress
from the conventional WLA using the full disk
section width is in fairly close agreement with
the FEA results. This is to be expected, as the
farther away from the load application the more of the section is loaded. The principal stress calculated by the conventional WLA is also in fairly close agreement with the
principal stress contours on the lower edge
of section A-C. For both sections, the 3D views of stress contours show how localized is the stresses in the disk directly affected by
the stem loading. Therefore, general design analysis by conventional WLA may be
satisfactory, but the exact state of stress is not accurately predicted.
(2) Elastic-plastic FEA
All the previous FEA has been strictly linear
elastic. For this valve, the required weak link
stem axial thrust is about 18000 lbf. Both
the conventional WLA and FEA results for
this thrust show that the design code stress allowables are exceeded.
Therefore, the same finite element model
as used in the elastic FEA will be used for an elastic-plastic analysis to determine
the effects on the resulting stress state of redistribution from plasticity. The method to
define the stress-strain curve of materials is the multi-linear kinematic hardening (MKIN)
method. For simplicity, the yield strength and
tensile strength of the material are used as the
input curve in this FEA. The elastic-plastic FEA was performed with the stem axial thrust of 18000 lbf.
The resulting stress intensity, principal stress,
and von Mises equivalent stress contours on the disk are shown in Figure 6. As
expected, the plasticity analysis demonstrates that stress redistribution does occur. The von Mises equivalent stress is the most applicable yield and strength criterion for
this type of ductile material. The von Mises stress contour plot shows that much of the section on the centerline of symmetry does yield; however, the equivalent strain plot shows that the maximum value is still only
about 10 %. Data on this material says that the elongation to failure is at least 30%.
Generally, the operating cycles of the MOVs are about 2000. The fatigue analysis is simply
considered by comparing the allowable alternating stress corresponding to 2000 cycles on the design fatigue curve with the
maximum resulting von Mises stress. The allowable alternating stress corresponding to 2000 cycles is about 669Mpa(97 ksi)[3],
and the maximum resulting von Mises stress
is about 397MPa(52.7 ksi). Therefore, it is
reasonable to conclude that 18000 lbf weak link allowable thrust is acceptable.
3.2 Yoke
The allowable thrusts of some valve yokes
calculated by the conventional WLA method
are lower than the maximum available actuator thrust.
NUREG/CP-0152, Vol. 4 3C-6

NRC/ASME Symposium on Valve and Pump Testing
3.2.1 Yoke legs
In order to determine the actual state of stress in the yoke legs, a finite element model of the yoke with flange was built by using the same procedure as for the disk. The design data and material properties are given in Table 3. Since the loading considered here is thrust, torque, and seismic loading, a full model as shown in Figure 7 was used to perform the FEA. The finite element model of the yoke body and flange is made up with ABAQUS C3D 1 OM elements. The inside fillet radius is not considered. An apex node is generated to model the rigid offset at the top to the actuator center of gravity on stem axis. Rigid beam elements are generated between the apex node and each actuator bolt holes. Loads were applied to the apex node representing the 195 kg (430 lbs) actuator. These loads are based on 2.Og seismic acceleration in the vertical direction and 3.Og in the horizontal directions and 37.8 kN (8500 lbf) vertical thrust load. Since the actual center of gravity of the actuator is off the stem axis, the forces produce moments due to the offset, also applied to the node. The top nodes on each yoke bolt hole are constrained in three translational degree of freedoms (DOFs) and the bottom nodes are constrained in the planar DOF only. This is obviously not entirely representative of the real world but is sufficiently reasonable.
The elastic-plastic FEA resulting von Mises stress and strain contours on the yoke are shown in Figure 8. Comparison of stresses between FEA and conventional analysis is the most appropriate with the von Mises equivalent stress. The maximum von Mises stress is 35.5 ksi and the maximum strain is still only about 1%. The limitation is based on the fatigue strength, and the allowable alternating stress of yoke material corresponding to 2000 cycles is about
669 Mpa (97 ksi). Since the fatigue strength is much larger, the design can be considered acceptable for these loads.
The FEA have demonstrated that the FEA process can be used to predict the state of stress that exists in a critical area such as a highly loaded bolted flange beyond the accuracy possible by conventional design calculations.
3.2.2 Yoke flange
In order to determine the actual state of stress in the yoke flange, another finite element model of the yoke with flange was built by using the same procedure and material as yoke legs. FEA was performed in two ways; one considering the influence of the mating yoke flange contact and the other not. Loads were applied to the apex node representing the 429 kg (945 lbs) actuator. These loads are based on 4.Og seismic acceleration in all directions and 267 kN (60 000 lbf) vertical thrust load.
The von Mises stress contours and strain contours on the yoke resulting from the elastic-plastic FEA are shown in Figure 10. From the results of these FEAs, the von Mises stress not considering the flange contact is larger than that considering the flange contact. Therefore, the FEA result not considering the flange contact is used for the weak link allowable thrust. The conventional weak link thrust of this yoke is (47,337 lbf). The maximum von Mises thrust is (38.0 ksi) and the maximum total strain is 1.81%. As a result, the weak link thrust of 60,000 lbf is acceptable.
4. Conclusion
As reported, the FEA for the disc-stem connection and the yoke of the MOVs in Korean NPPs were performed to investigate
NUREG/CP-0152, Vol. 43C-7

NRC/ASME Symposium on Valve and Pump Testing
the real stress state of the MOVs for which the allowable thrust from the conventional WLA did not meet GL 89-10. The FEA of the parts were compared with conventional analysis. The results in the present study are as follows:
a. On the disk contact area, the stress calculated by the conventional WLA is about 1.5 times higher than the maximum principal stress of FEA. It can be shown that the stress is highly concentrated in the area of the disk affected directly by the thrust.
b. The allowable thrusts of disk-stem T-head connection and the yoke by the FEA are much larger than those calculated by the conventional WLA.
c. The fatigue analysis can be simply considered by comparing the allowable alternating stress corresponding to 2000 cycles on the design fatigue curve with the maximum von Mises stress.
References
1. Weak link Analysis consulting documents, EAS Energy Services, 2000.
2. ASME Boiler and Pressure Vessel Code, Section III, Subsection NF.
3. Roark & Young, Formulas for Stress and Strain, 6th ed., McGraw-Hill Book Co., 1989.
4. Weak link Analysis consulting with FEA, Wyle Laboratories, Inc., 2001.
5. ABAQUS, Ver. 5.8, ABAQUS, Inc.
6. EPRI Report No. NP-6660-D, 1990, Application Guide for Motor-Operated Valve in Nuclear Power Plants.
7. Vendor drawings for MOVs.
NUREG/CP-0152, Vol. 4 3C-8

NRC/ASM•E Symposium on Valve and Pump Testing
Table 1. Design data and material properties of the disk-stem connection
Operating temperature 93 -C (200 'F) Design seismic acceleration 4g in each direction
Actuator stem factor 5.974 mn (0.2352 in) Disk material ASME SA 182, F316 Yield strength at the operating temperature 178 MPa (25.8 ksi)
Tensile strength at the operating temperature 515 MPa (75 ksi)
Yield strength of the stem at the operating temperature 724 MPa (105 ksi)
Table 2. Dimensional data for the disk-stem connection
Average stem width of the contact area (w,) 32.7 mm (1.287 in) Thickness of the stem contact area (t) 5.70 mm (0.224 in)
Actual thickness of the contact area (t) 4.37 mm (0.172 in)
Actual contact area 285 mm 2 (0.443 in2)
Average disk width on the section (w,,) 89.4 mm (3.52 in)
Table 3. Design data and material properties of the yoke
Operating temperature 93 -C (200 -F) Design seismic acceleration 4g in each direction
Actuator stem factor 5.974 mm (0.2352 in)
Yoke material ASME SA 182, F316 Yield strength at the operating temperature 178 MPa (25.8 ksi).
C
B
(a) Front view (b) side view
Figure 1. Schematic diagram of stem-disc connection
NUREG/CP-0152, Vol. 43C-9

NRC/ASME Symposium on Valve and Pump Testing
IC
71
(a) Semicircular type (b) Tee type
Figure 2. Schematic diagram of yokes
(b)
(a) Yoke legs are inside bolt circle (b) Yoke legs are outside bolt circle
Figure 3. Schematic diagram of circular yoke flange
NUREG/CP-0152, Vol. 4
NRC/ASME Symposium on Valve
and Pump Testing
3C-10

NRC/ASME Symposium on Valve and Pump Testing
Figure 4. Finite element model of the disc-stem connection
(a) Maximum principal stress contours (b) Maximum shear stress contours
(c) Von Mises stress contours (d) Total strain contours
Figure 5. Elastic FEA of the disk-stem connection
NUREG/CP-0152, Vol. 4
I
'I
3C-11

NRC/ASME Symposium on Valve and Pump Testing
-. 4
I 4.
Ii(a) Principal stress contours
...1
(b) Maximum shear stress contours
-I(c) Von Mises stress contours (d) Total strain contours
Figure 6. Elastic-plastic FEA of the disk-stem connection (continued)
Figure 7. Finite element model of the yoke in opening
NUREG/CP-0 152, Vol. 4
VAN-1
3C-12

NRC/ASME Symposium on Valve and Pump Testing
*�jj
-I
(a) Von Mises Stress (b) Total strain
Figure 8. Elastic-plastic FEA of the yoke
Figure 9. Finite element model of the yoke flange in closing mode
NUREG/CP-0152, Vol. 4
ýJ
3C-13

NRC/ASME Symposium on Valve and Pump Testing
(a) Total strain contours (b) Maximum von Mises stress contours
Figure 10. FEA results with contact of the yoke flange in closing mode
(a) Total strain contours (b) Maximum von Mises stress contours
Figure 11. FEA results without contact of the yoke flange in closing mode
NUREG/CP-0 152, Vol. 4 3C-14

Performance Testing of an 8" x 6" x 8" Motor-Operated Velan Gate Valve At Wyle Laboratories Huntsville Facility
for Oconee Nuclear Power Station William F Sadowski, Wyle Laboratories
Chad Smith, Duke Energy
Data presented with permission from Velan Valve, Inc.
1.0 Purpose
This paper discusses how Oconee Nuclear Station procured and qualified several new motor-operated valves (MOVs) for their main steam system. Active, safety-related MOVs have special design and performance requirements commiserate with their design basis function. These design and performance requirements are the focal point of the procurement process and mesh with key elements of Oconee's MOV Program. These elements include:
a.) Incorporating MOV design features that produce consistent predictable performance
b.) Verify acceptable performance through full-flow validation testing and comparison with industry models
c.) Performance of pressure locking and thermal binding testing
d.) Performance of a static deflection test
e.) Documenting test results and observations
2.0 MOV Design and Performance Requirements
Duke Energy has developed a purchase specification for active, safety-related,
motor-operated gate valves. This specification incorporates the "lessons learned" from the industry, Duke Energy, and the Electric Power Research Institute (EPRI) MOV Performance Prediction Program (PPP). In addition to imposing design requirements, the specification also requires validation testing (i.e., full-flow testing). Validation testing assures that the MOV's performance characteristics are consistent with Duke's MOV Program.
Specific requirements for Oconee's main steam valves included:
Valve: Carbon steel body, bolted bonnet, and live load packing. Stem: 1) Inconel 718 stem with full ACME
threads, 2) Adequate room for stem instrumentation throughout the entire stroke.
Disk: 1) Flex wedge or parallel design (flex wedge was chosen), 2) EPRI guidance and Duke experience was used to establish disk-guide and T-head clearance. 3) Disk guides shall be designed such that the disk does not tilt as a result of flow impingement.
NUREG/CP-0152, Vol. 43C-15

NRC/ASMEf Symposium on Valve and Pump Testing
Hard Facing:
It was required that all seat rings and guides be hard faced with Stellite 6 and a radius applied to the leading edges per EPRI recommendations. Iron dilution was required to be <5%.
Structural limits:
The valve's structural limit was required to be greater than 2.5 times the actuator's nominal structural limit.
Performance Validation Testing:
A full-flow test was required at 1050 psid saturated steam at a flow rate of 240,000 lbs. per hour. Under these conditions, the valve had to exhibit consistent and predictable performance, and require less operating thrust than predicted by the EPRI PPP. In addition, rate of loading (ROL) was required to be less than 30% and the stem coefficient of friction (COF) had to remain below 0.20. A Pressure Locking and Thermal Binding test was required to quantify any increased unwedging loads associated with these events. Lastly, a hot static seismic test was required to assure that the valve assembly would not bind (due to deflection) during a seismic event.
3.0 Performance Validation
The purchase specification required the successful completion of a performance validation-testing program. This testing was performed at Wyle Laboratories. The test results were used in conjunction with the EPRI PPM to establish the design basis
qualification of the valve design. The validation test program consisted of:
1. Pre-test inspection, 2. Baseline static strokes,
3. Disk/seat preconditioning,
4. Full differential pressure steam flow tests, 5. Pressure locking test,
6. Close-hot-open-cold thermal binding test,
7. Close-cold-open-hot thermal binding test,
8. Hot static seismic test, and
9. Post-test inspection
3.1 Pre-test inspection
A pre-test inspection was performed on the test valve to document the condition of the valve's internal sliding surfaces prior to the start of testing. The valve seats and guides were found to be in good condition with only very minor scratches on the disk and body seats. See Photos 1 and 2.
Following the pre-test inspection, the valve was assembled based on the vendor supplied assembly procedure which included torque values for all major bolted connections. The test valve was then placed in the test stand in the horizontal position (worst case orientation), the packing was consolidated, and the switches were set. See Photo 3.
3.2 Baseline Static Strokes
A series of 12 static baseline tests were performed. The test results are shown Table 1.
The test results show slightly decreasing packing load, but stable torque switch trip and stem COF values.
3.3 Disk/Seat Preconditioning Strokes
Following the baseline static strokes, the valve was heated by bleeding steam around
the test valve for approximately 30 minutes, and a total of 11 preconditioning strokes were performed. The valve factor leveled-off after about 9 strokes (see Chart 1). This behavior is consistent with EPRI PPM and industry
NUREG/CP-0 152, Vol. 4
NRC/ASME Symposium on Valve
and Pump Testing
3C-16

NRC/ASME Symposium on Valve and Pump Testing
experience (i.e., rapid plateau in valve factor for steam service). The valve factor decreased slightly as the number of strokes increased. This was most likely due to a combination of the valve heating-up and the differential pressure increasing with each stroke. That is, Stellite is known to exhibit lower friction coefficients under high bearing stress and high temperature.
3.4 Full differential pressure tests
After the preconditioning strokes, a total of 3 closing and 3 opening full differential pressure strokes were performed with saturated steam at a nominal 1050 psig and flow rate of 240,000 Ibm/hr. The valve factors from these tests were consistent and similar to those from the preconditioning tests as shown in Chart 2. Also, see an overlay of the closing signature curves in Figure 2.
Minimal rate-of-loading was observed during the full differential pressure tests. In fact, the actuator delivered on average 8% more torque under dynamic conditions than under static conditions. However, the thrust changed less than 3% because the stem COF partially offset a more significant change in torque. See Chart 3. The stem lubricant was Mobile 28. The stem material was Inconel 718. The stem thread was full ACME.
3.5 Bonnet pressure entrapment test
The bonnet was pressurized with the up and down stream test sections depressurized via a ¼" NPT port on the valve bonnet. The test fluid was saturated steam, and the test valve was still hot from the preceding full differential pressure tests. The unwedging ratio increased from about 0.43 during the static test (i.e., no pressure or flow) to 0.70 with the bonnet pressurized to approximately
1050 psig. The disk is a flexible wedge design.
3.6 Close-hot-open-cold thermal binding test
This test was performed by heating the valve to -5500 F using saturated steam, depressurizing the test section, closing the valve, allowing the valve to cool for -24 hrs, then opening the valve cold. The test results are summarized in Table 2.
The unwedging ratio was 0.51 compared to an average of 0.43 for the preceding static cycle tests. Accordingly, there was little influence from the long duration (24 hr cool down) close hot open cold thermal binding test.
3.7 Close-cold-open-hot thermal binding test
This test was performed by closing the test valve while it is cold, heating the test valve to -550OF using saturated steam over a period of -2 hrs, depressurizing the test valve and test section, then opening the test valve hot. The test results are summarized in Table 3.
The test results indicate a significant thermal binding effect (the unwedging ratio is approximately twice the preceding static cycles).
3.8 Hot static deflection test
Lastly, the test valve was stroked close-openclose while a static load of 10,000 lbs was applied vertically up on the actuator motor flange. This load induces deflections similar to those expected during a seismic event. This test assures that these defections do not affect the valve's operation. See Table 4 below.
The valve factors were consistent with the full differential pressure tests. The unwedging
NUREG/CP-0 152, Vol. 43C-17

NRC/ASME Symposium on Valve and Pump Testing
ratio was slightly lower than observed during the full differential pressure tests, but inline with those observed during static tests with line pressure.
3.9 Post-test inspection
Finally, the test valve was disassembled and
inspected for excessive wear or damage that could result from the flow testing. Only minor scratches were observed on the upstream disk guides and downstream disk seat. See Photos 4 and 5.
4.0 Summary and Conclusions
A comparison of the test results with industry models shows the required thrust is bounded by the required thrust predicted by the EPRI PPP. See Figure 3. The unwedging load observed when the valve was closed statically with no pressure and opened with differential
pressure was also bounded by Rev. 2 of the EPRI PPM implementation guide. See Figure 4. Note that the upstream seat sealed until after unwedging. Thus, there was no stem rejection load present during unwedging to assist the valve open. See Figure 5. The
rate-of-loading was much less than maximum acceptable value of 30% and the stem COF was well below 0.20.
The intention of Duke Energy's design and performance requirements is to ensure the valves procured will comply with key elements of Oconee's MOV Program. The valves were manufactured to meet the rigorous material, design, and clearance requirements of Duke Energy's specification. The valve testing verified the valves met the performance criteria of the specification. Thus, the valves were easily integrated into Oconee's MOV program.
NUREG/CP-0152, Vol. 4
NRC/ASME Symposium on Valve
and Pump Testing
3C-18

NRC/ASME Symposium on Valve and Pump Testing
Photo 1: Pre-test inspection of downstream disk seat
Pnoto 2: Pre-test inspection of the upstream disk guide "d"
NUREG/CP-0152, Vol. 43C-19

NRC/ASME Symposium on Valve and Pump Testing
Photo 3: Test valve in test stand
Stroke Thrust Torque COF ICOF In. o Number Unwedgel Open Run Close Run Switch Trip I Final Switch Trip Switch Trip Unwedge Ratio
1 11818 1389 -1300 -22016 -26974 320 0.111 0.127 0.46
2 11289 1396 -1302 -21829 -26054 318 0.111 0.126 0.42
3 12051 1359 -1272 -21512 -26321 313 0.111 0.128 0.46
4 10881 1324 -1250 -21638 -26423 314 0.110 0.127 0.41
5 11209 1357 -1250 -21418 -26566 311 0.110 0.128 0.42
6 11378 1302 -1226 -21822 -26379 316 0.110 0.128 0.43
7 11708 1268 -1215 -21633 -25889 314 0.110. 0.128 0.44
8 11996 1222 -1185 -21368 -25806 311 0.111 0.129 0.46
9 12146 1224 -1181 -21590 -26007 313 0.110 0.128 0.47
10 11851 1211 -1165 -21794 -26062 316 0.110 0.129 0.46
11 11755 1194 -1148 -21722 -26019 314 0.110 0.128 0.45
12 11768 1166 -1143 -21672 -26134 313 0.109 0.129 0.45
Average 11654 1284 -1220 -21668 -26220 314 0.110 0.128 0.44
Minimum 10881 1166 -1302 -22016 -26974 311 0.109 0.126 0.41
Maximum 12146 1396 -1143 -21368 -25806 320 0.111 0.129 0.47
Max. Dev. 11% 18% 13% 3% 4% 3% 2% 2% 14%
NUREG/CP-0 152, Vol. 4 3C-20
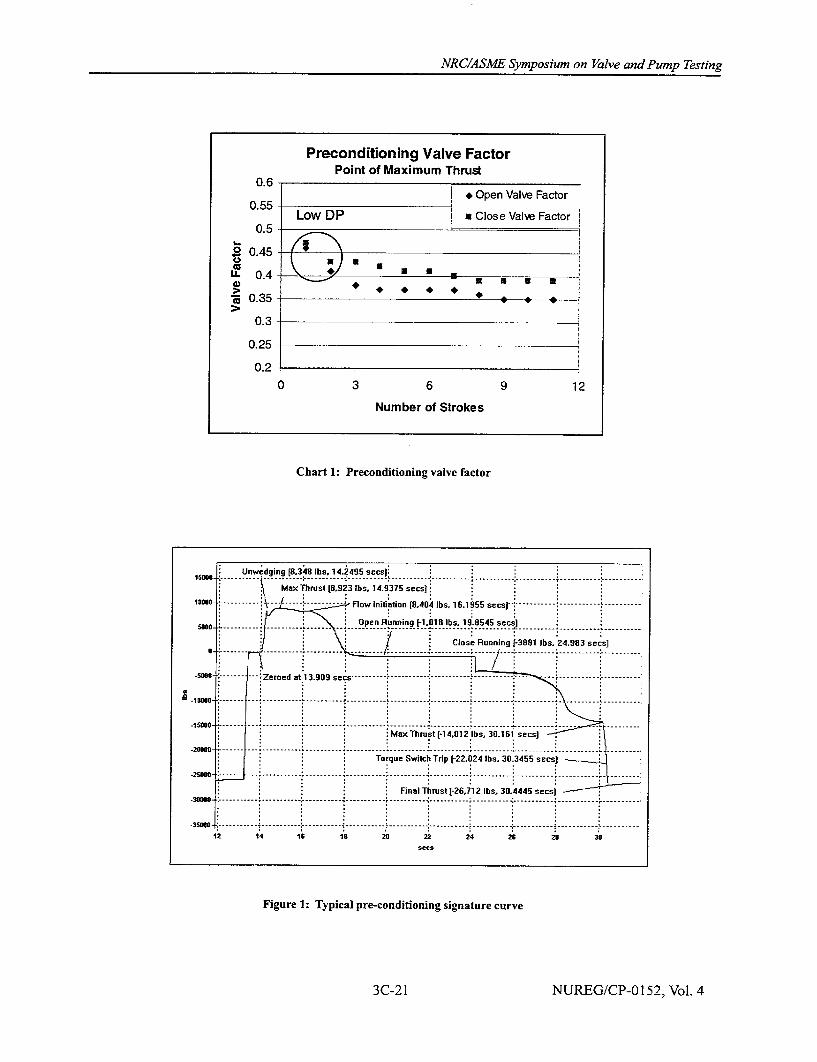
NRC/ASME Symposium on Valve and Pump Testing
Chart 1: Preconditioning valve factor
Figure 1: Typical pre-conditioning signature curve
NUREG/CP-0 152, Vol. 4
Preconditioning Valve Factor Point of Maximum Thrust
0.6 05+ Open Valve Factor 0.55 - L w D
Low DP a Close Valve Factor 0.5
20.45o * U
ti. 0.4 - A U *
"* 0.35
0.3
0.25
0.2 0 3 6 9 12
Number of Strokes
Unwedging [8,348 Ilbs, 14.2495 sees):
Max Thrust [8,923 lbs, 14.9375 secs]
,8068 .......... Flow Initiation [8.404 lbs. 16.1955 ser-r n. n
Oen Running [1.01 8 lbs. 19.8545 secsl
= -e# .... :--~eoe at1390 s--.......--.......-' .. ......... 9 ------------------ ---------/ Close Running [-3881 lbs. 24.983 sets]
-.--------- Zeroed at 13.909 sets
f ......... :Max Thrust([14,012 lbs, 30.151 setsj
Torque Switch Trip [22 024 lbs, 30.3455 sees) -- --.. ... ... ... ... ... .... .]. ............ ...........................! ..... Final Thrust[J26,112 lbs, 30.4445 sets)
-30 2 -------------------------- - ----------- -14-------- 1--18-2--2-
24-------3
1 2 1'4 1 6 I s 2 0) 2 2 i 4 2 S ; 2 8 3 0
SeCs
3C-21

NRC/ASME Symposium on Valve and Pump Testing
Chart 2: Valve factors from full differential pressure tests
Figure 2: Closing thrust from full differential pressure tests
NUREG/CP-0152, Vol. 4
Full Differential Pressure Flow Tests Point of Maximum Thrust
0.6 0. Open Valve Factor
0.55 - a Close Valve Factor
0.5
0 0.45
u. 0.4 0 3
S0.35
0.3
0.25
0.2
0 1 2 3 4
Number of Strokes
-20000
-30000
2 2ý1 22 22 24 20 2s 27 20 29 sees
3C-22

NRC/ASME Symposium on Valve and Pump Testing
Chart 3: Rate-of-loading during full differential pressure tests
Stroke I Thrust ITorque I CO, I COF Unwedge -INumbeI Unwed• e I Open Run I Close Run I Switch Trip I Final I Switch Trip I Switch Trip I Unwedge I Ratio I
11 13796 19281 -13451 -217791-270051 3151 0.110 0.126 0.51
Table 3: Summary of the close cold open hot thermal binding test Stroke Thrust Torque COF COF Unwedge
Number I Unwedge I Open Run I Close Run I Switch Trip I Final I Switch Trip I Switch Trip I Unwedge I Ratio I 11 274001 16621 -29228 -229461-280651 324 0.105 0.117 0.98
NUREG/CP-0152, Vol. 4
Full Differential Pressure Flow Tests a Thrust
Point of Torque Switch Trip * Torque 22200 345
22100 340
22000 335
.o 21900 330 #
0 0 # 21800 325 CI- 0
I.
21700 320
Static 21600 315
21500 310
3C-23

NRC/ASME Symposium on Valve and Pump Testing
Table 4: Summary of results for hot static seismic test
Time DP PUP Torque Thrust Apparent Point ID (sec) (psi) (psi) (ft-lbs) (Ibs) Valve Stem COF
Factor
Max Close Before Unwedging ii 35.7315 --- 388 -26456 --- 0.112
Unwedging Peak j 75.4650 1067 1067 -134 8968 --- 0.116
At Flow Initiation k na na na na na na na
Max After Unwedging I 75.9460 1067 1067 -132 8553 0.37 0.123
Running m 82.9575 0 1036 --- -1132 ---....
Running a 24.3995 0 984 --- -3668 --- . ..
Max Thrust Before Wedging b 35.4500 943 959 196 -12939 0.39 0.119
At Flow Isolation c na na na na na na na
Onset of hard-wedging d 35.4500 943 959 196 -12939 0.39 0.119
(Enter Two Points If needed) e na na na na na na na
Torque Switch Trip (dynamic) f 35.6280 . .--- 331 -22033 --- 0.117
Final Thrust g 35.7315 . . 388 -26456 --- 0.112
Torque Switch Trip (static) h 143.2060, 315 -22413 --- 0.104
Rate of Loading -2% = % (f-h)/h {Note h from prior static stroke)
Inertia 20% = % (g-f)/f
Unwedging Ratio 0.34 = j/ii [Note ii is final thrust from prior stroke)
NUREG/CP-0152, Vol. 4
Hot Static Seismic Test
3C-24

NRC/ASME Symposium on Valve and Pump Testing
Photo 4: Post-test inspection of the upstream disk guide "d"
Photo 5: Post-test downstream disk seat
NUREG/CP-0152, Vol. 43C-25

NRC/ASME Symposium on Valve and Pump Testing
Figure 3: Comparison of closing thrust data with industry models
Figure 4: Comparison of unwedging data with industry models
NUREG/CP-0152, Vol. 4
o- 1000 x (Stem Dia.) + Stem Area x [Jpstream Press.) + Seat Area x [Differential Press.) x [Valve Factor)
-Sooo-L Standard Equation (0.3 Valve Factor)
-Iow
Max. value from EPPJ PPPP -25000
-Sa 20 21 22 23 24 26 26 2? 28 2
S......... •............ 4............... •.............- ............. 4 ............. .............. A............ ' .............. •.....ee........ s....
---- ---- --- ---- ---- --- -------- --- ---- --
e Unwedginp based on EPRI PPM
-2 0------• ............ - .......... .......... --
-300 O . ... ... ... ... ... ... ... ... ... ... ... ."... ... ... ... ... ... ... ... ....................................
0 5 10 Is 20 25 30 35
sees
3C-26

NRC/ASME Symposium on Valve and Pump Testing
Figure 5: Upstream seat remained sealed until after unwedging
NUREG/CP-0152, Vol. 4
26-------------------- ---- -----------------a --- 4 ---- - L - L
9
SS
No bonnet pressure until after unwedgang
.. . . ..... . . . . . . ............ --------.. . . . .. . . .. . . .. . . . .. . . .. . . .
6 is 15 20 25 30 35 sees
3C-27