nunes, adonay s.; mamashli, fahimeh; kozhemiako, nataliia
TRANSCRIPT

This is an electronic reprint of the original article.This reprint may differ from the original in pagination and typographic detail.
Powered by TCPDF (www.tcpdf.org)
This material is protected by copyright and other intellectual property rights, and duplication or sale of all or part of any of the repository collections is not permitted, except that material may be duplicated by you for your research use or educational purposes in electronic or print form. You must obtain permission for any other use. Electronic or print copies may not be offered, whether for sale or otherwise to anyone who is not an authorised user.
Nunes, Adonay S.; Mamashli, Fahimeh; Kozhemiako, Nataliia; Khan, Sheraz; McGuiggan,Nicole M.; Losh, Ainsley; Joseph, Robert M.; Ahveninen, Jyrki; Doesburg, Sam M.;Hämäläinen, Matti S.; Kenet, TalClassification of evoked responses to inverted faces reveals both spatial and temporal corticalresponse abnormalities in Autism spectrum disorder
Published in:NeuroImage: Clinical
DOI:10.1016/j.nicl.2020.102501
Published: 01/01/2021
Document VersionPublisher's PDF, also known as Version of record
Published under the following license:CC BY-NC-ND
Please cite the original version:Nunes, A. S., Mamashli, F., Kozhemiako, N., Khan, S., McGuiggan, N. M., Losh, A., Joseph, R. M., Ahveninen,J., Doesburg, S. M., Hämäläinen, M. S., & Kenet, T. (2021). Classification of evoked responses to inverted facesreveals both spatial and temporal cortical response abnormalities in Autism spectrum disorder. NeuroImage:Clinical, 29, [102501]. https://doi.org/10.1016/j.nicl.2020.102501

NeuroImage: Clinical 29 (2021) 102501
Available online 30 November 20202213-1582/© 2020 Published by Elsevier Inc. This is an open access article under the CC BY-NC-ND license (http://creativecommons.org/licenses/by-nc-nd/4.0/).
Classification of evoked responses to inverted faces reveals both spatial and temporal cortical response abnormalities in Autism spectrum disorder
Adonay S. Nunes a,b,1, Fahimeh Mamashli c,d,1, Nataliia Kozhemiako a,b, Sheraz Khan c,d, Nicole M. McGuiggan a,d, Ainsley Losh a, Robert M. Joseph f, Jyrki Ahveninen c,d, Sam M. Doesburg b,e, Matti S. Hamalainen c,d,g, Tal Kenet a,d,*
a Department of Neurology, MGH, Harvard Medical School, Boston, MA, USA b Department of Biomedical Physiology and Kinesiology, Simon Fraser University, Vancouver, British Columbia, Canada c Department of Radiology, MGH, Harvard Medical School, Boston, MA, USA d Athinoula A. Martinos Center for Biomedical Imaging, MGH/HST, Charlestown, MA, USA e Behavioural and Cognitive Neuroscience Institute, Simon Fraser University, Vancouver, British Columbia, Canada f Boston University School of Medicine, Boston, MA, USA g Department of Neuroscience and Biomedical Engineering, Aalto University School of Science, Espoo, Finland
A R T I C L E I N F O
Keywords: Autism Machine learning Faces Inverted faces Magenetoencephalography
A B S T R A C T
The neurophysiology of face processing has been studied extensively in the context of social impairments associated with autism spectrum disorder (ASD), but the existing studies have concentrated mainly on univariate analyses of responses to upright faces, and, less frequently, inverted faces. The small number of existing studies on neurophysiological responses to inverted face in ASD have used univariate approaches, with divergent results. Here, we used a data-driven, classification-based, multivariate machine learning decoding approach to investi-gate the temporal and spatial properties of the neurophysiological evoked response for upright and inverted faces, relative to the neurophysiological evoked response for houses, a neutral stimulus. 21 (2 females) ASD and 29 (4 females) TD participants ages 7 to 19 took part in this study. Group level classification accuracies were obtained for each condition, using first the temporal domain of the evoked responses, and then the spatial distribution of the evoked responses on the cortical surface, each separately. We found that classification of responses to inverted neutral faces vs. houses was less accurate in ASD compared to TD, in both the temporal and spatial domains. In contrast, there were no group differences in the classification of evoked responses to upright neutral faces relative to houses. Using the classification in the temporal domain, lower decoding accuracies in ASD were found around 120 ms and 170 ms, corresponding the known components of the evoked responses to faces. Using the classification in the spatial domain, lower decoding accuracies in ASD were found in the right superior marginal gyrus (SMG), intra-parietal sulcus (IPS) and posterior superior temporal sulcus (pSTS), but not in core face processing areas. Importantly, individual classification accuracies from both the temporal and spatial classifiers correlated with ASD severity, confirming the relevance of the results to the ASD phenotype.
1. Introduction
Autism Spectrum Disorder (ASD) is a neurodevelopmental disorder characterized by, among other traits, impaired social communication and interaction (American Psychiatric Association, 2013). Face perception plays a critical role in social interactions, and involves a large network of brain areas (Haxby et al., 2000; Li et al., 2009; Magnuson et al., 2019; Turk-Browne et al., 2010) that includes the highly
specialized fusiform face area (FFA) (Humphreys et al., 2008; Kanwisher et al., 1997). Face processing is also associated with specific neuro-physiological time signatures (Barbeau et al., 2008; Eimer, 2000; Itier et al., 2006; Linkenkaer-Hansen et al., 1998; Puce et al., 2013). In in-vestigations of face processing in ASD, many studies have documented behavioral impairments in processing faces in ASD (Gauthier et al., 2009; Jiang et al., 2013; Tang et al., 2015), alongside neurophysiolog-ical abnormalities (Khan et al., 2013; Mamashli et al., 2018; Naumann
* Corresponding author at: 149 13th Street, Charlestown, MA 02129, USA. E-mail address: [email protected] (T. Kenet).
1 Equal contribution
Contents lists available at ScienceDirect
NeuroImage: Clinical
journal homepage: www.elsevier.com/locate/ynicl
https://doi.org/10.1016/j.nicl.2020.102501 Received 5 August 2020; Received in revised form 3 November 2020; Accepted 7 November 2020

NeuroImage: Clinical 29 (2021) 102501
2
et al., 2018; O’Connor et al., 2007). One line of research on abnormalities associated with face processing
in ASD revolves around comparing the processing of upright faces in ASD to the processing of inverted faces. For upright faces, the non-verbal information extracted from the combination of mutable face elements requires a holistic perception that decodes face expression by taking into account several elements in conjunction (McKone et al., 2007; Piepers and Robbins, 2012). In contrast, inverted faces are believed to disrupt this holistic processing, and result in greater impairment in face recog-nition than the impairments in recognition produced by inverting other, non-face, images (Bruyer, 2011; Yin, 1969). The resulting effect, commonly referred to as the Face Inversion effect (FIE), has been investigated in ASD, again with mixed results. The FIE is typically assessed by measuring the reaction time to identify upright faces, versus the reaction time to identify inverted faces. While some earlier studies found a reduced FIE in ASD (Gauthier et al., 2009; Teunisse and De Gelder, 2003), other studies found no such indications (Tang et al., 2015; Tavares et al., 2016; Weigelt et al., 2012). These inconsistencies could be due to differences in study design such as stimulus parameters, specific methodological details, age groups, or cohort characteristics more generally, and thus the question of neurophysiological differences associated with cortical responses to upright faces relative to the cortical responses to inverted faces in ASD remains unresolved.
Here, we chose to combine the inverted versus upright processing line of research with a machine learning multivarate approach. Previous studies used machine learning decoding in visual perception (King et al., 2016), object recognition (Cichy et al., 2016), face processing (Van de Nieuwenhuijzen et al., 2013) and timing of face perception (Dobs et al., 2019), and to detect participants with mild cognitive impairment (Hughes et al., 2019), neurological or brain injuries (Aoe et al., 2019; Claassen et al., 2019), and schizophrenia (Shim et al., 2016), to mention a few. In this study we use machine learning-based brain signal decoding to investigate the spatial and temporal characterisitics of the evoked response to neutral upright faces and inverted faces, in ASD versus typically developing (TD) participants, using whole head magnetoen-cephalography (MEG). More specifically, we tested whether evoked responses to upright faces and evoked responses to house could be classified with better than chance probability in both ASD and TD groups, and whether evoked responses to inverted faces and evoked responses to house could be classified with better than chance proba-bility in both ASD and TD. We tested this using both temporal and spatial dimensions of the evoked response. While this approach does not address the FIE directly, due to the lack of behavioral reaction time data demonstrating this effect in our cohort, it nonetheless addresses cortical processing of upright versus inverted neutral faces in a novel way. We were interested in this question because previously, when studying the processing of neutral upright faces, we found no group differences in cortical evoked responses between individuals with ASD and IQ and age matched TD individuals (Khan et al., 2013; Mamashli et al., 2018). However, we had used a univariate approach to studying the evoked responses. We were further interested in studying the responses to inverted faces in parallel, in order to follow the line of research on dissociating holistic and non holistic processing of faces in ASD, given their different contribution to communication.
The multivariate data-driven approach pursued here is more sensi-tive to multidimensional parameters captured by the MEG data, and so presents a novel approach with which to revisit this question. While classical statistical modelling approaches rely on theoretical models with assumptions and probabilities to infer univariate relations between conditions, machine learning decoding is a multi-variate data-driven approach that makes predictions based on combinations of patterns in the data. We had previously found neurophysiological group differences in ASD in the cortical processing of faces (Khan et al., 2013; Mamashli et al., 2018), but none of these differences were at the level of evoked resonses. Therefore, we hypothesized that our prior, univariate, ap-proaches might not have been sufficiently sensitive to group differences,
and that a multivariate approach will detect group differences between the ASD and TD group when processing upright faces that were not previously detectable. In addition, given that inverted faces hinder ho-listic processing in comparison to upright faces, and generally elicit a stronger response, we expected to find significantly greater group dif-ferences when classifying evoked responses to inverted faces relative to evoked responses to houses. Lastly, we expected that classification by spatial characteristics would yield significant group differences, but that this would not be the case for classification by temporal charateristics because the temporal parameters are simpler to capture also with pre-viously studied univariate approaches. We tested these hypotheses using data from 21 individuals with ASD, ages 8–16, and 29 age and IQ matched controls (Table 1). For the temporal domain, we used data from the MEG sensors, since temporal characteristics do not change from sensor space to source space. For the spatial classification, we used source space data, i.e. MEG signals projected from the MEG sensors onto the cortical surface.
2. Methods
2.1. Participants
Fifty right-handed participants from the age of 7 to 19 years un-derwent an MEG recording and a structural T1 MRI scan. 21 participants had a diagnosis of ASD and the ASD group had a mean age of 12.1 ± 2.5, and 29 TD comparison participants had a mean age of 11.9 ± 3.5. Verbal IQ (VIQ) and nonverbal IQ (NVIQ) were assessed using the Kaufman Brief Intelligence Test – II (Kaufman, 2004) or the Differential Ability Scales – II (Elliot, 2007). There were no signficant group differences in age, NVIQ, or VIQ. The Autism Diagnostic Observation Schedule, Second Edition (ADOS-2) (Lord et al., 2012) was administered by a trained researcher. Of the 21 participants diagnosed with ASD, 14 participants were administered Module 3 and 7 participants were administered Module 4 of the ADOS assessment. For those that were administered Module 4, a revised algorithm to increase comparability across modules was used (Hus and Lord, 2014). The ADOS raw overall total and raw domain totals were calculated. For the correlations with ADOS, we used the Social Affect domain total of the ADOS algorithm (ADOSSA), which consists of communication and reciprocal social interaction scores, and is comparable across modules 3 and 4. Exlusion criteria included major comorbidities such as epilepsy, major psychiatric episodes, Fragile-X syndrome or substance use over the 6 months prior to enrollment. This study was approved by MGH institutional review board and informed written consent was obtained for every participant and their parents or guardians.
2.2. Experimental paradigm
During the MEG recording, houses, upright neutral faces, inverted neutral faces, and emotional faces (the latter condition is not discussed here), were presented on the screen for 1 s in random order, followed by an intertrial period of 1 s with a fixation cross. To assess attention, participants were asked to press a button when the same face appeared successively (1-back); this occurred on 15% of the trials and repeat presentations were excluded from the analyses, and from the count of trials per condition. The experiment was broken down into three
Table 1 Demographic information and phenotypic data.
ASD TD
Sample size (females) 21 (2) 29 (4) Age, years 12.3 ± 2.4 11.7 ± 3.3 NVIQ 109.0 ± 19. 106.9 ± 10.0 VIQ 108.2 ± 15.9 111.3 ± 14.0 ADOSSA 9.7 ± 4.7
A.S. Nunes et al.

NeuroImage: Clinical 29 (2021) 102501
3
recordings with short breaks for rests. In total, each stimulus condition was presented for at least 150 trials, in random order (exclusive of 1- back trials). The face stimuli were collected from three databases: Kar-olinska Directed Emotional Faces (KDEF) (Lundqvist et al., 1998), NimStim Face Stimulus Set (Tottenham et al., 2009), and Gur (Gur et al., 2002). The houses stimuli were obtained from the Kanwisher Laboratory database at the Massachusetts Institute of Technology. All stimuli were homogenized for brightness and contrast, and by using an oval black mask. The sequence of stimuli was generated and presented using the psychophysics toolbox (Brainard, 1997; Pelli, 1997), and presented with a projector through an opening in the wall onto a back-projection screen placed 100 cm in front of the participant inside a magnetically shielded room. Fig. 1A illustrates the timeline and stimuli used in this paradigm.
2.3. MEG and aMRI data acquisition
The MEG data were acquired at the Athinoula A. Martinos Center for Biomedical Imaging, Massachusetts General Hospital, with a 306-chan-nel Neuromag Vectorview whole-head system (Elekta Neuromag, Finland) inside a magnetically shielded room. The HPI locations and the participant’s head shape were digitized using a Fastrak digitizer (Pol-hemus Inc., Colchester, VT) integrated with the VectorView system, and later used for MEG and MRI corregistration. The vertical and horizontal electrooculogram (EOG) and electrocardiogram (ECG) signals were also acquired. The data were bandpass filtered between 0.5 and 200 Hz prior
to sampling at 600 Hz. Additionally, five min of empty room data were collected immediately before or immediately after each experimental session, for noise estimation purposes. Structural T1-weighted MPRAGE images were acquired on a 3T scanner (Siemens Medical Systems, Erlangen, Germany) using a 32-channel phase array head coil. Seg-mentation of the cortical surface was estimated using FreeSurfer (Dale et al., 1999; Fischl et al., 1999), subjects cortical surfaces were morphed into a common space with ~ 10.000 vertices per hemisphere.
2.4. MEG preprocessing
A signal space separation spatial filter was applied to the data to correct for head motion and suppress external source noise (Taulu et al., 2004; Taulu and Simola, 2006), using the default MNE-python v.19 SSS parameters. To remove eye and cardiac artifacts, signal space projection was employed (Gramfort et al., 2014). Then, the data were bandpass filtered between 0.1 and 40 Hz and a 60 Hz notch filter was applied to suppress line-frequency noise. The MEG recordings were divided into epochs of 1 s, from − 500 ms before the stimuli presentation and 500 ms after the onset. For the analyses, gradiometers sensors were selected and epochs with peak-to-peak amplitude above 1000 fT/cm in any of the gradiometers were excluded from further analysis. There were no group differences in head motion, or in the number of “bad trials” dropped due to excessive artefacts, as illustrated in supplementary Fig. S1. A mini-mum of 47 trials per participants per condition were used. The number
Fig. 1. Study design. A: Stimuli and experimental design. B: Pipeline workflow of the data-driven machine learning decoding.
A.S. Nunes et al.

NeuroImage: Clinical 29 (2021) 102501
4
of trials per participant per condition ranged from 47 to 156, with no significant differences in the total number of trials per subject between groups (t-test: p = 0.18). In Suppl. Fig. S2, a swarm plot illustrates the number of trials per conditions by group, and in Suppl. Fig. S3, a scat-terplot shows the relationship between mean decoding accuracy and number of trials, demonstrating that these two values are not correlated.
2.5. MEG source reconstruction
Source reconstruction was estimated on the cortical surface for each participant using Freesurfer cortical segmentation. A watershed algo-rithm was used to generate the inner skull surface triangulations. The MEG forward solution was calculated using a single compartment boundary-element model (Hamalainen and Sarvas, 1989). Minimum- norm estimate (MNE) software was used to estimate the cortical cur-rent distribution and the orientation of the sources were fixed perpen-dicular to the cortical mesh. Empty-room recordings were used as a noise–covariance matrix to calculate the inverse operator. To reduce the bias toward superficial currents, a depth weighting was used to adjust the source covariance matrix to favor deep source locations (Lin et al., 2006).
2.6. Temporal classification
To compute classification accuracies using the temporal patterns of the evoked responses to the different stimuli (“temporal classification”, irrespective of the spatial distribution, a linear kernel support vector classifier (SVC, Cortes and Vapnik, 1995), implemented in the sci-kit learn Python library (Pedregosa et al., 2011), was used for each participant to estimate the stimuli type at each time point of the trial using the 204 sensor gradiometer signals. An SVC finds a hyperplane that separates the condition classes as best as possible. SVCs learn a linear binary decision rule, h(x) = sign{wTx+ b}, where the weight vector w and threshold b together define a hyperplane L : wTx + b = 0. The function h(x) thus indicates the location of a given point x with respect to L and divides the data into two classes. The classification accuracy metric used was the Area Under the Curve (AUC), as it is a metric that balances specificity and sensitivity. A 5-fold cross-validation (CV) was used to test the generalizability, and the accuracies were averaged across CVs. The stimuli of interest for classification were (1) upright neutral faces versus houses, and (2) inverted neutral faces versus houses. A statistical learning model was used to test if the subject’s temporal accuracies are sufficient for classifying ASD and TD partici-pants using SVC.
2.7. Spatial classification
To compute classification accuracies using the spatial patterns of the evoked responses to the different stimuli (“spatial classification”), irre-spective of the temporal parameters, we first projected sensor data onto the cortical surface. At each vertex, the time series dimensionality were reduced using Principal Component Analysis (PCA, probabilistic implementation, Tipping and Bishop, 1999) and extracting the first 50 PCA components in order to reduce the temporal dimensionality of the time series. These components were used as features for SVC classifi-cation. Again, as for the temporal domain analysis, the stimuli of interest for classification were (1) upright neutral faces versus houses, and (2) inverted neutral faces versus houses. The spatial accuracies for all vertices were used to classify ASD and TD groups. Fig. 1B illustrates the workflow for the temporal and spatial classification analyses.
2.8. Statistical analysis
To test for group differences and for correlations with the ADOS Social Affect domain totals (ADOSSA), Partial Least Squares (PLS)
multivariate statistical analysis was used (Krishnan et al., 2011; McIn-tosh and Lobaugh, 2004). Mean-centred PLS was used for assessing group differences in accuracy and behavioral PLS for testing associations between accuracy and ADOSSA scores. The inputs for mean-centred PLS were two data matrices with dimensions subjects × features (where features are timepoints in case of temporal classification and vertices in case of spatial classification) for ASD and TD groups containing SVC accuracies. The input for behavioral PLS was a data matrix with SVC accuracies in ASD group and a matrix containing ADOSSA scores for each participant with ASD. PLS decomposes the data matrix M with m fea-tures and n groups through singular value decomposition (SVD), giving M = UΣVT, where U is the eigenvectors of the row space, V the the ei-genvectors of the column space, and the singular values Σ as a diagonal matrix. U reprents the feature subspace, V represents the group subspace and Σ captures their magnitude or variance of the eigenvectors. A per-mutation test is applied to assess if Σ from the original subspace is significantly higher than the null distribution where group labels are randomized. The permutation test results in a single p-value indicating statistical significance, which intrinsically addresses the multiple com-parision concern, by having only one test. Then, boostraping is applied by removing members of the group one by one to estimate the standard error (SE) of each feature and U is divided by the SE to provide a measure of feature reliability generating a z-score bootstrap ratio for each feature. In this study, 5000 permutation and bootstrapping itera-tions were performed and the threshold for z-scores was set to 3, which represents a reliability index above the 99th percentile of a normal distribution.
3. Results
3.1. Temporal classification between conditions, within and between groups
We first computed classification accuracies using the temporal pat-terns of the evoked responses, irrespective of the spatial distribution. The accuracies of classifying (1) evoked responses patterns in response to neutral upright faces stimuli relative to evoked responses to houses stimuli, and (2) evoked responses patterns in response to neutral inverted faces stimuli relative to evoked responses to houses stimuli, were both computed at each time point, for both the TD and ASD groups. The accurracy before stimulus onset and immediately following stimulus onset was at chance level in all cases, as expected. For both the upright faces condition (Fig. 2A) and the inverted faces condition (Fig. 2B), the accuracy of classification relative to the houses condition began to exceed chance level at around 90 ms post stimulus onset, for both the TD and ASD groups, and then increased sharply until peaking, before the 200 ms mark.
Differences between groups were assessed statistically using PLS. For the upright faces condition, there were no significant group difference in decoding accuracies (Fig. 2A). In contrast, for the inverted faces con-dition, classification accuracies differed between groups, reaching sig-nificance around 120 and 170 ms (Fig. 2B). At both time windows, classification accuracy was lower in the ASD group.
Given the significant group differences in the inverted faces relative to houses condition, we tested whether an SVM classifier could classify TD and ASD participants based on the temporal pattern of the decoding (inverted faces relative to houses) accuracies for each participant. The resulting classification accuracy was 78%, well above the chance level of 50%.
3.2. Correlation between temporal classification accuracy and ASD sympton severity
Next, we tested whether the temporal classification accuracy for individual ASD participants was correlated with ASD symtomatology as measured using the ADOS Social Affect domain total (ADOSSA). We
A.S. Nunes et al.

NeuroImage: Clinical 29 (2021) 102501
5
focuses on the ADOSSA because face processing is generally associated with deficits in the social-affective domain, rather than with deficits in the RRB domain. We found that ASD severity was significantly nega-tively correlated with inverted faces versus houses classification accu-racy (p < 0.01). In other words, more severe ASD symptomatology was associated with lower classification accuracies. The time windows where classification was most predictive of ASD severity (with z-scores > 3) were between 90 ms and 200 ms, in accordance with the results for general group difference above, with a second significant time window emerging at around 400 ms (Fig. 3A). The association between ADOSSA scores for the ASD participants and mean accuracies of time windows with z-scores > 3 was found to be r = 0.46, and p = 0.039, and is shown in Fig. 3B. To ensure the results were not due to outliers, we further checked it using robust correlation (Wada et al., 2016), and the corre-lation remained significant.
3.3. Spatial classification between conditions, within and between groups
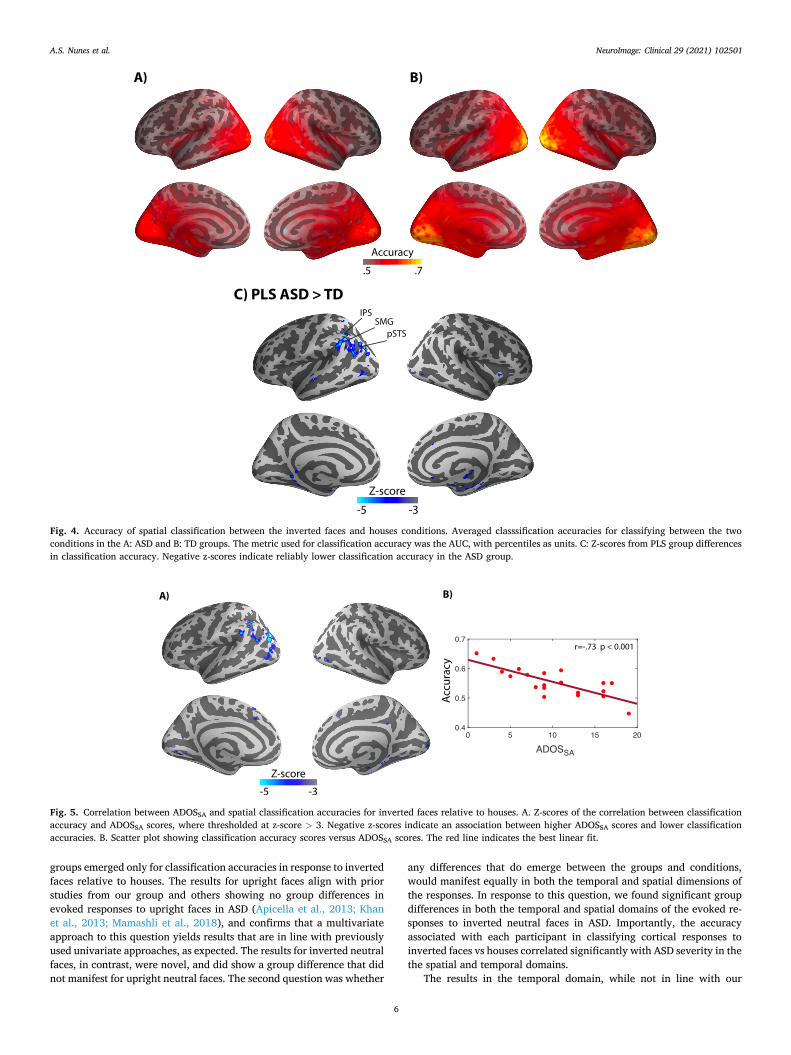
We then computed the classification accuracies using the spatial patterns of the evoked responses, irrespective of temporal patterns. Specifically, we tested how predictive the time series of each vertex in space is in discriminating upright or inverted neutral faces relative to houses. To that end, we projected the data from the MEG sensors onto the cortical surface. Using the first 50 PCA components of the vertex time series across trials, an SVC was trained in classifying the stimuli conditions. Condition classification never exceed chance level for up-right faces relative to houses, for either group. In contrast, for inverted faces relative to houses, classification accuracies exceeding chance level were found in multiple loci in both groups, and were located mostly in the occipital region, as well as in temporoccipital regions such as intraparietal sulcus, and temporal areas including the mid-temporal sulcus and the inferior temporal gyrus. The results were similar for both the TD (Fig. 4A) and ASD (Fig. 4B) groups.
Group differences in spatial classification accuracies were assessed statistically using PLS, as was done for temporal classification. When the
same thresholds of p < 0.01 and z scores > 3 were applied, group dif-ferences in spatial classification accuracy emerged in three cortical re-gions: the left supramarginal gyrus, posterior temporal sulcus (pTPS) and intrapaieral sulcus (IPS), as shown in Fig. 4C. The negative values indicate that the ASD group had lower condition classification accu-racies. Overall, group classification using the vertex accuracies from classification of inverted faces relative to houses was 72%, i.e. above chance level.
3.4. Correlation between spatial classification accuracy and ASD symptom severity
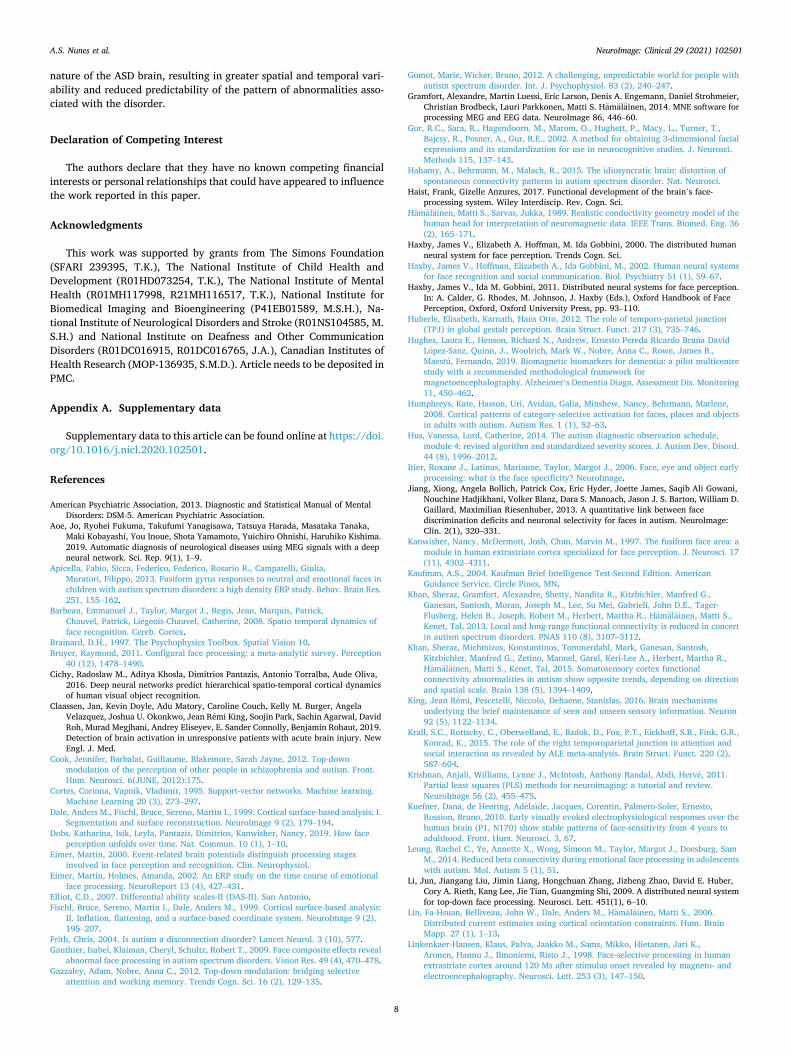
As with temporal classification, for spatial classification we again tested the association between ASD symptom severity assesed using the ADOSSA domain totals, and vertex accuracies from classifying inverted faces and houses. Higher ADOSSA values (i.e. increased ASD severity) were, again, associated with lower accuracies. The areas with the most significant z-scores were similar to those illustated in Fig. 4C, with some additional contributions from occipital regions, as shown in Fig. 5A. The scatterplot of ADOSSA versus mean accuracies of time windows with z- scores > 3 is shown in Fig. 5B, and had a correlation coefficient of r =-0.73 and a p-value < 0.001. To ensure the results were not due to outliers, we further checked them using robust correlation (Wada et al., 2016), and the correlation remained significant.
4. Discussion
We used a multivariate machine-learning decoding approach to identify altered cortical response patterns to inverted and upright neutral faces in ASD. We were interested in a dual set of questions. The first question was whether responses to upright faces and responses to inverted faces would be equally accurately classifiable relative to re-sponses to houses, for both the ASD and TD groups. We found that while it was possible to accurately classify evoked responses to upright faces relative to houses for both groups, differences between the TD and ASD
Fig. 2. Temporal classification accuracies. A: Clas-sification accuracy plots for decoding upright faces vs. houses. The metric used to assess accuracy was the area under the curve (AUC), with percentiles as units. B: Classification accuracy plots for decoding inverted faces vs. houses, in ASD (red) and TD (blue). Line shadows are ± 1 STD. Time points where group differences were significant, thresholded at z-scores > 3, are represented with gray horizontal shaded areas. Chance level is marked by a horizontal dashed black line.
Fig. 3. Correlation between ADOSSA and temporal classification accuracies for inverted faces relative to houses. A: Time points where correlation with the ADOSSA score were significant. Z-scores >3 z-scores are plotted as gray vertical shaded areas. The metric used to assess accuracy was the AUC, with percen-tiles as units. B: Scatterplot of ADOSSA scores relative to mean accuracy scores with Z-scores >3. The red line indicates the best linear fit. Chance level is marked by a horizontal dashed black line.
A.S. Nunes et al.
NeuroImage: Clinical 29 (2021) 102501
6
groups emerged only for classification accuracies in response to inverted faces relative to houses. The results for upright faces align with prior studies from our group and others showing no group differences in evoked responses to upright faces in ASD (Apicella et al., 2013; Khan et al., 2013; Mamashli et al., 2018), and confirms that a multivariate approach to this question yields results that are in line with previously used univariate approaches, as expected. The results for inverted neutral faces, in contrast, were novel, and did show a group difference that did not manifest for upright neutral faces. The second question was whether
any differences that do emerge between the groups and conditions, would manifest equally in both the temporal and spatial dimensions of the responses. In response to this question, we found significant group differences in both the temporal and spatial domains of the evoked re-sponses to inverted neutral faces in ASD. Importantly, the accuracy associated with each participant in classifying cortical responses to inverted faces vs houses correlated significantly with ASD severity in the the spatial and temporal domains.
The results in the temporal domain, while not in line with our
Fig. 4. Accuracy of spatial classification between the inverted faces and houses conditions. Averaged classsification accuracies for classifying between the two conditions in the A: ASD and B: TD groups. The metric used for classification accuracy was the AUC, with percentiles as units. C: Z-scores from PLS group differences in classification accuracy. Negative z-scores indicate reliably lower classification accuracy in the ASD group.
Fig. 5. Correlation between ADOSSA and spatial classification accuracies for inverted faces relative to houses. A. Z-scores of the correlation between classification accuracy and ADOSSA scores, where thresholded at z-score > 3. Negative z-scores indicate an association between higher ADOSSA scores and lower classification accuracies. B. Scatter plot showing classification accuracy scores versus ADOSSA scores. The red line indicates the best linear fit.
A.S. Nunes et al.

NeuroImage: Clinical 29 (2021) 102501
7
original hypothesis, are consistent with observations that responses to faces are known to peak between 100 ms and 200 ms. Classification accuracies for inverted faces versus houses differed significantly be-tween the groups around the two known components of the response to faces – the M120 and the M170. The M120, which has been measures using both EEG and MEG, and occurs between 100 and 130 ms typically, in response to upright or inverted faces (also referred to as P1 / P120 / P100 when measured using EEG) is believed to correlate with face categorization or selectivity, but not face recognition (Eimer and Holmes, 2002; Linkenkaer-Hansen et al., 1998; Liu et al., 2002). The response component at 170 ms is of course the the best known compo-nent of the evoked response to faces, and has been documented using both EEG and MEG (Eimer, 2000; Itier et al., 2006; Liu et al., 2013). It is particularly interesting to note that in spite of the fact that decoding accurracies remained high throughout the trial, even at 500 ms after stimulus onset, the group differences were only significant at time windows that overlapped with known components of the evoked response to faces. This is likely because it is as those time windows that the response is most face specific, and therefore is more likely to be impacted in ASD. Furthermore, fact that our methodology detected differences in the temporal domain that overlap with known peaks of the response to faces, substantially increases confidence in the validity of the results. The fact that these differences were not observed previously, speaks to the strength of this multivariate data-driven approach. Importantly, lower classification accuracy was correlated with increased ASD severity as measured using the ADOS, confirming the relevance of the results to the ASD phenotype.
In our spatially-based analyses, the classification accuracy was significantly lower in the ASD vs. TD participants in the SMG, IPS and pSTS areas. It was unexpected that all the differences in evoked re-sponses to inverted faces emerged from non-specialized face processing areas. Previous studies suggest that the face-processing “core” system involves the FFA, occipital face area (OFA) and posterior superior temporal sulcus (pSTS) (Haxby and Gobbini, 2011; Nunes et al., 2019). We did not find any group differences in either the FFA or the OFA. It is possible that with univariate approaches, the lack of group differences in these more dominant face processing areas overshadows differences in less prominent face processing areas. The multivariate approach taken here, in contrast, picked up non-specialized areas associated with the face processing network. The pSTS is a higher order associative area with top-down regulation (Turk-Browne et al., 2010), while the IPS is part of the dorsal attention system that is involved in reorienting attention to unexpected stimuli, and is also involved in Theory of Mind tasks (Krall et al., 2015). The SMG has been shown to also be critical for holistic processing (Huberle and Karnath, 2012; Rennig et al., 2013). Thus, while none of these areas are specialized for faces, they are all part of the face processing cortical network. Importantly, again affirming the relevance of the results to ASD, group differences in classification ac-curacies of classifying inverted faces relative to houses in all of these areas were correlated with ASD severity. More specifically, lower clas-sification accuracy was correlated with increased ASD severity, and has more generally previously been associated with discriminative deficits in processing inverted faces (Jiang et al., 2013; Zürcher et al., 2013).
Overall, these findings are consistent with mounting evidence that the ASD brain is more idiosyncratic both at rest and during processing of stimuli (Hahamy et al., 2015; Magnuson et al., 2020; Nunes et al., 2018). Such variability in brain function might explain reduced ability of the classifier to distinguish brain activity patterns elicited by different stimuli. Alternatively, our results are also consistent with the hypothesis that face processing difficulties arise due to reduced interest in facial stimuli starting early in life, which in turn would result in an underde-veloped face-processing network (Pierce et al., 2011; Rice et al., 2012). This could result in less differentiation in responses to upright versus inverted faces, and classification accuracies for inverted faces that are more similar to those found for upright faces in the ASD group. One limitation of the study stems from the relatively small sample size, as
well as from the smaller number of trials in a few of the participants; while we did not observe a correlation between accuracy and number of trials, the relatively low variability in number of trials per participant means this result is not conclusive. Another potential limitation is the relatively large age range, although that is likely mitigated at least somewhat by the groups being matched on age. Furthermore, the maturation of the M170 attenuates substantially (i.e. is close to mature) by around age 8 or 9, and there is evidence this is the case also for earlier components of the response (Haist and Anzures, 2017; Kuefner et al., 2010), meaning the age range is not likely to be a significant concern for this study. In the spatial domain, there is indeed evidence of refinement of the spatial distribution of the response with age (Zhu et al., 2016). So, while this remains a limitation and, the fact that the groups were age matched, along with the correlations with ASD severity and the fact that the identified areas are indeed part of the face processing network, all increase the confidence in the findings. One caveat of data-driven decoding approaches concerns the relevance of the features used for classification, which are derived from the data blindly, and therefore the neurophysiological interpretation of these features is not necessarily obvious or intuitive. That said, the correlations with the behaviorally derived ASD measures reinforce our hypotheses that these features are in fact relevant to the ASD phenotype.
More generally, the differences observed here between the process-ing of upright faces in ASD, which appears intact relative to the TD group, and the processing of inverted faces in ASD, which is abnormal relative to the TD group, merits further discussion. It is possible that the abnormalities observed in the context of inverted face but not upright faces stem for the greater reliance of processing of inverted faces on top- down regulation (Papathomas and Bono, 2004; Gazzaley and Nobre, 2012; Mayer et al., 2007). Reduced top-down modulations is consistent with multiple reports of abnormalities in top-down processing in ASD (Cook et al., 2012; Frith, 2004; Gomot and Wicker, 2012; Khan et al., 2015; Mamashli et al., 2017; Neumann et al., 2006; Seymour et al., 2019; Sinha et al., 2014), including during face processing (Leung et al., 2014; Loth et al., 2010). Thus, while this study does not examine directly what specific changes yield the differences in the processing of inverted, but not upright, faces in the ASD group, abnormal top-down modula-tions provide one plausible explanation for this difference.
In sum, we found that evoked responses to upright neutral faces and evoked responses to houses were equally accurately classified in both the ASD and TD groups, using both the spatial and temporal domains of the evoked responses. In contrast, evoked responses to inverted neutral faces and evoked responses to houses were classified with significantly reduced accuracy in the ASD group, using both the spatial and temporal domains of the event related responses. The time window when accu-racy of classification was most different between the two groups was consistent with the temporal pattern of responses to faces, around 120 ms and 170 ms post stimulus onset. So, while we did not initially hy-pothesize that we will find a significant difference here, the difference that did emerge is highly consistent with studies of face processing. Interestingly, the spatial pattern that was most predictive of group dif-ferences did not include specialized face processing areas, and instead spanned activated components of visual object processing that are not specialized for faces (Haxby et al., 2002). For both the spatial and temporal domains, individual classification accuracies were negatively correlated with ASD severity, specifically in the social-affective domain, as measured using the ADOSSA. These negative correlations support the literature suggesting that the brain in ASD is more idiosyncratic (Hah-amy et al., 2015; Magnuson et al., 2020; Nunes et al., 2018), and thus this approach offers a new direction through which to address this question in future studies. The multivariate data-driven approach taken here revealed patterns of abnormalities in the evoked responses to inverted faces in ASD in the spatial domain that were hitherto undoc-umented, underscoring the importance of using such approaches in ASD. The multivariate approach applied here is likely to be particularly useful for understanding the neural bases of ASD, given the idiosyncratic
A.S. Nunes et al.
NeuroImage: Clinical 29 (2021) 102501
8
nature of the ASD brain, resulting in greater spatial and temporal vari-ability and reduced predictability of the pattern of abnormalities asso-ciated with the disorder.
Declaration of Competing Interest
The authors declare that they have no known competing financial interests or personal relationships that could have appeared to influence the work reported in this paper.
Acknowledgments
This work was supported by grants from The Simons Foundation (SFARI 239395, T.K.), The National Institute of Child Health and Development (R01HD073254, T.K.), The National Institute of Mental Health (R01MH117998, R21MH116517, T.K.), National Institute for Biomedical Imaging and Bioengineering (P41EB01589, M.S.H.), Na-tional Institute of Neurological Disorders and Stroke (R01NS104585, M. S.H.) and National Institute on Deafness and Other Communication Disorders (R01DC016915, R01DC016765, J.A.), Canadian Institutes of Health Research (MOP-136935, S.M.D.). Article needs to be deposited in PMC.
Appendix A. Supplementary data
Supplementary data to this article can be found online at https://doi. org/10.1016/j.nicl.2020.102501.
References
American Psychiatric Association, 2013. Diagnostic and Statistical Manual of Mental Disorders: DSM-5. American Psychiatric Association.
Aoe, Jo, Ryohei Fukuma, Takufumi Yanagisawa, Tatsuya Harada, Masataka Tanaka, Maki Kobayashi, You Inoue, Shota Yamamoto, Yuichiro Ohnishi, Haruhiko Kishima. 2019. Automatic diagnosis of neurological diseases using MEG signals with a deep neural network. Sci. Rep. 9(1), 1–9.
Apicella, Fabio, Sicca, Federico, Federico, Rosario R., Campatelli, Giulia, Muratori, Filippo, 2013. Fusiform gyrus responses to neutral and emotional faces in children with autism spectrum disorders: a high density ERP study. Behav. Brain Res. 251, 155–162.
Barbeau, Emmanuel J., Taylor, Margot J., Regis, Jean, Marquis, Patrick, Chauvel, Patrick, Liegeois-Chauvel, Catherine, 2008. Spatio temporal dynamics of face recognition. Cereb. Cortex.
Brainard, D.H., 1997. The Psychophysics Toolbox. Spatial Vision 10. Bruyer, Raymond, 2011. Configural face processing: a meta-analytic survey. Perception
40 (12), 1478–1490. Cichy, Radoslaw M., Aditya Khosla, Dimitrios Pantazis, Antonio Torralba, Aude Oliva,
2016. Deep neural networks predict hierarchical spatio-temporal cortical dynamics of human visual object recognition.
Claassen, Jan, Kevin Doyle, Adu Matory, Caroline Couch, Kelly M. Burger, Angela Velazquez, Joshua U. Okonkwo, Jean Remi King, Soojin Park, Sachin Agarwal, David Roh, Murad Megjhani, Andrey Eliseyev, E. Sander Connolly, Benjamin Rohaut, 2019. Detection of brain activation in unresponsive patients with acute brain injury. New Engl. J. Med.
Cook, Jennifer, Barbalat, Guillaume, Blakemore, Sarah Jayne, 2012. Top-down modulation of the perception of other people in schizophrenia and autism. Front. Hum. Neurosci. 6(JUNE, 2012):175.
Cortes, Corinna, Vapnik, Vladimir, 1995. Support-vector networks. Machine learning. Machine Learning 20 (3), 273–297.
Dale, Anders M., Fischl, Bruce, Sereno, Martin I., 1999. Cortical surface-based analysis: I. Segmentation and surface reconstruction. NeuroImage 9 (2), 179–194.
Dobs, Katharina, Isik, Leyla, Pantazis, Dimitrios, Kanwisher, Nancy, 2019. How face perception unfolds over time. Nat. Commun. 10 (1), 1–10.
Eimer, Martin, 2000. Event-related brain potentials distinguish processing stages involved in face perception and recognition. Clin. Neurophysiol.
Eimer, Martin, Holmes, Amanda, 2002. An ERP study on the time course of emotional face processing. NeuroReport 13 (4), 427–431.
Elliot, C.D., 2007. Differential ability scales-II (DAS-II). San Antonio. Fischl, Bruce, Sereno, Martin I., Dale, Anders M., 1999. Cortical surface-based analysis:
II. Inflation, flattening, and a surface-based coordinate system. NeuroImage 9 (2), 195–207.
Frith, Chris, 2004. Is autism a disconnection disorder? Lancet Neurol. 3 (10), 577. Gauthier, Isabel, Klaiman, Cheryl, Schultz, Robert T., 2009. Face composite effects reveal
abnormal face processing in autism spectrum disorders. Vision Res. 49 (4), 470–478. Gazzaley, Adam, Nobre, Anna C., 2012. Top-down modulation: bridging selective
attention and working memory. Trends Cogn. Sci. 16 (2), 129–135.
Gomot, Marie, Wicker, Bruno, 2012. A challenging, unpredictable world for people with autism spectrum disorder. Int. J. Psychophysiol. 83 (2), 240–247.
Gramfort, Alexandre, Martin Luessi, Eric Larson, Denis A. Engemann, Daniel Strohmeier, Christian Brodbeck, Lauri Parkkonen, Matti S. Hamalainen, 2014. MNE software for processing MEG and EEG data. NeuroImage 86, 446–60.
Gur, R.C., Sara, R., Hagendoorn, M., Marom, O., Hughett, P., Macy, L., Turner, T., Bajcsy, R., Posner, A., Gur, R.E., 2002. A method for obtaining 3-dimensional facial expressions and its standardization for use in neurocognitive studies. J. Neurosci. Methods 115, 137–143.
Hahamy, A., Behrmann, M., Malach, R., 2015. The idiosyncratic brain: distortion of spontaneous connectivity patterns in autism spectrum disorder. Nat. Neurosci.
Haist, Frank, Gizelle Anzures, 2017. Functional development of the brain’s face- processing system. Wiley Interdiscip. Rev. Cogn. Sci.
Hamalainen, Matti S., Sarvas, Jukka, 1989. Realistic conductivity geometry model of the human head for interpretation of neuromagnetic data. IEEE Trans. Biomed. Eng. 36 (2), 165–171.
Haxby, James V., Elizabeth A. Hoffman, M. Ida Gobbini, 2000. The distributed human neural system for face perception. Trends Cogn. Sci.
Haxby, James V., Hoffman, Elizabeth A., Ida Gobbini, M., 2002. Human neural systems for face recognition and social communication. Biol. Psychiatry 51 (1), 59–67.
Haxby, James V., Ida M. Gobbini, 2011. Distributed neural systems for face perception. In: A. Calder, G. Rhodes, M. Johnson, J. Haxby (Eds.), Oxford Handbook of Face Perception, Oxford, Oxford University Press, pp. 93–110.
Huberle, Elisabeth, Karnath, Hans Otto, 2012. The role of temporo-parietal junction (TPJ) in global gestalt perception. Brain Struct. Funct. 217 (3), 735–746.
Hughes, Laura E., Henson, Richard N., Andrew, Ernesto Pereda Ricardo Bruna David Lopez-Sanz, Quinn, J., Woolrich, Mark W., Nobre, Anna C., Rowe, James B., Maestú, Fernando, 2019. Biomagnetic biomarkers for dementia: a pilot multicentre study with a recommended methodological framework for magnetoencephalography. Alzheimer’s Dementia Diagn. Assessment Dis. Monitoring 11, 450–462.
Humphreys, Kate, Hasson, Uri, Avidan, Galia, Minshew, Nancy, Behrmann, Marlene, 2008. Cortical patterns of category-selective activation for faces, places and objects in adults with autism. Autism Res. 1 (1), 52–63.
Hus, Vanessa, Lord, Catherine, 2014. The autism diagnostic observation schedule, module 4: revised algorithm and standardized severity scores. J. Autism Dev. Disord. 44 (8), 1996–2012.
Itier, Roxane J., Latinus, Marianne, Taylor, Margot J., 2006. Face, eye and object early processing: what is the face specificity? NeuroImage.
Jiang, Xiong, Angela Bollich, Patrick Cox, Eric Hyder, Joette James, Saqib Ali Gowani, Nouchine Hadjikhani, Volker Blanz, Dara S. Manoach, Jason J. S. Barton, William D. Gaillard, Maximilian Riesenhuber, 2013. A quantitative link between face discrimination deficits and neuronal selectivity for faces in autism. NeuroImage: Clin. 2(1), 320–331.
Kanwisher, Nancy, McDermott, Josh, Chun, Marvin M., 1997. The fusiform face area: a module in human extrastriate cortex specialized for face perception. J. Neurosci. 17 (11), 4302–4311.
Kaufman, A.S., 2004. Kaufman Brief Intelligence Test-Second Edition. American Guidance Service, Circle Pines, MN.
Khan, Sheraz, Gramfort, Alexandre, Shetty, Nandita R., Kitzbichler, Manfred G., Ganesan, Santosh, Moran, Joseph M., Lee, Su Mei, Gabrieli, John D.E., Tager- Flusberg, Helen B., Joseph, Robert M., Herbert, Martha R., Hamalainen, Matti S., Kenet, Tal, 2013. Local and long-range functional connectivity is reduced in concert in autism spectrum disorders. PNAS 110 (8), 3107–3112.
Khan, Sheraz, Michmizos, Konstantinos, Tommerdahl, Mark, Ganesan, Santosh, Kitzbichler, Manfred G., Zetino, Manuel, Garel, Keri-Lee A., Herbert, Martha R., Hamalainen, Matti S., Kenet, Tal, 2015. Somatosensory cortex functional connectivity abnormalities in autism show opposite trends, depending on direction and spatial scale. Brain 138 (5), 1394–1409.
King, Jean Remi, Pescetelli, Niccolo, Dehaene, Stanislas, 2016. Brain mechanisms underlying the brief maintenance of seen and unseen sensory information. Neuron 92 (5), 1122–1134.
Krall, S.C., Rottschy, C., Oberwelland, E., Bzdok, D., Fox, P.T., Eickhoff, S.B., Fink, G.R., Konrad, K., 2015. The role of the right temporoparietal junction in attention and social interaction as revealed by ALE meta-analysis. Brain Struct. Funct. 220 (2), 587–604.
Krishnan, Anjali, Williams, Lynne J., McIntosh, Anthony Randal, Abdi, Herve, 2011. Partial least squares (PLS) methods for neuroimaging: a tutorial and review. NeuroImage 56 (2), 455–475.
Kuefner, Dana, de Heering, Adelaïde, Jacques, Corentin, Palmero-Soler, Ernesto, Rossion, Bruno, 2010. Early visually evoked electrophysiological responses over the human brain (P1, N170) show stable patterns of face-sensitivity from 4 years to adulthood. Front. Hum. Neurosci. 3, 67.
Leung, Rachel C., Ye, Annette X., Wong, Simeon M., Taylor, Margot J., Doesburg, Sam M., 2014. Reduced beta connectivity during emotional face processing in adolescents with autism. Mol. Autism 5 (1), 51.
Li, Jun, Jiangang Liu, Jimin Liang, Hongchuan Zhang, Jizheng Zhao, David E. Huber, Cory A. Rieth, Kang Lee, Jie Tian, Guangming Shi, 2009. A distributed neural system for top-down face processing. Neurosci. Lett. 451(1), 6–10.
Lin, Fa-Hsuan, Belliveau, John W., Dale, Anders M., Hamalainen, Matti S., 2006. Distributed current estimates using cortical orientation constraints. Hum. Brain Mapp. 27 (1), 1–13.
Linkenkaer-Hansen, Klaus, Palva, Jaakko M., Sams, Mikko, Hietanen, Jari K., Aronen, Hannu J., Ilmoniemi, Risto J., 1998. Face-selective processing in human extrastriate cortex around 120 Ms after stimulus onset revealed by magneto- and electroencephalography. Neurosci. Lett. 253 (3), 147–150.
A.S. Nunes et al.

NeuroImage: Clinical 29 (2021) 102501
9
Liu, Jia, Harris, Alison, Kanwisher, Nancy, 2002. Stages of processing in face perception: an MEG study. Nat. Neurosci. 5 (9), 910–916.
Liu, Jia, Alison Harris, and Nancy Kanwisher, 2013. Stages of processing in face perception: an MEG study. Social Neurosci. Key Read.
Lord, C., Rutter, M., DiLavore, P., Risi, S., Gotham, K., Bishop, S., 2012. Autism Diagnostic Observation Schedule, Second Edition. Western Psychological Services, Torrance, CA.
Loth, Eva, Gomez, Juan Carlos, Happe, Francesca, 2010. When seeing depends on knowing: adults with autism spectrum conditions show diminished top-down processes in the visual perception of degraded faces but not degraded objects. Neuropsychologia 48 (5), 1227–1236.
Lundqvist, D., Flykt, A., Ohman, A., 1998. The Karolinska directed emotional faces (KDEF), CD ROM from Department of Clinical Neuroscience, Psychology section. Karolinska Institutet 91 (630), 2–2.
Magnuson, Justine R., Iarocci, Grace, Doesburg, Sam M., Moreno, Sylvain, 2020. Increased intra-subject variability of reaction times and single-trial event-related potential components in children with autism spectrum disorder. Autism Res. 13 (2), 221–229.
Magnuson, Justine R., Peatfield, Nicholas A., Fickling, Shaun D., Nunes, Adonay S., Christie, Greg, Vakorin, Vasily, D’Arcy, Ryan C.N., Ribary, Urs, Iarocci, Grace, Moreno, Sylvain, Doesburg, Sam M., 2019. Electrophysiology of inhibitory control in the context of emotion processing in children with autism spectrum disorder. Front. Hum. Neurosci. 13, 78.
Mamashli, Fahimeh, Khan, Sheraz, Bharadwaj, Hari, Losh, Ainsley, Pawlyszyn, Stephanie M., Hamalainen, Matti S., Kenet, Tal, 2018. Maturational trajectories of local and long-range functional connectivity in autism during face processing. Hum. Brain Mapp. 39 (10), 4094–4104.
Mamashli, Fahimeh, Khan, Sheraz, Bharadwaj, Hari, Michmizos, Konstantinos, Ganesan, Santosh, Garel, Keri-Lee A., Hashmi, Javeria Ali, Herbert, Martha R., Hamalainen, Matti, Kenet, Tal, 2017. Auditory processing in noise is associated with complex patterns of disrupted functional connectivity in autism spectrum disorder. Autism Res. 10 (4), 631–647.
Mayer, Jutta S., Robert A. Bittner, Danko Nikolic, Christoph Bledowski, Rainer Goebel, David E.J. Linden, 2007. Common neural substrates for visual working memory and attention. NeuroImage 36(2):441–453.
McIntosh, Anthony Randal, Nancy J. Lobaugh, 2004. Partial least squares analysis of neuroimaging data: applications and advances. NeuroImage.
McKone, Elinor, Kanwisher, Nancy, Duchaine, Bradley C., 2007. Can generic expertise explain special processing for faces? Trends Cogn. Sci. 11 (1), 8–15.
Naumann, Sandra, Senftleben, Ulrike, Santhosh, Megha, McPartland, James, Webb, Sara Jane, 2018. Neurophysiological correlates of holistic face processing in adolescents with and without autism spectrum disorder. J. Neurodev. Disorders 10 (1), 1–13.
Neumann, Dirk, Spezio, Michael L., Piven, Joseph, Adolphs, Ralph, 2006. Looking you in the mouth: abnormal gaze in autism resulting from impaired top-down modulation of visual attention. Social Cogn. Affect. Neurosci. 1, 194–202.
Van de Nieuwenhuijzen, M.E., Backus, A.R., Bahramisharif, A., Doeller, C.F., Jensen, O., van Gerven, M.A.J., 2013. MEG-based decoding of the spatiotemporal dynamics of visual category perception. NeuroImage 83, 1063–1073.
Nunes, Adonay S., Nataliia Kozhemiako, Alexander Moiseev, Robert A. Seymour, Teresa P.L. Cheung, Urs Ribary, Sam M. Doesburg, 2019. Neuromagnetic activation and oscillatory dynamics of stimulus-locked processing during naturalistic viewing. NeuroImage 116414.
Nunes, Adonay S., Peatfield, Nicholas, Vakorin, Vasily, Doesburg, Sam M., 2018. Idiosyncratic organization of cortical networks in autism spectrum disorder. NeuroImage.
O’Connor, Kate, Hamm, Jeff P., Kirk, Ian J., 2007. Neurophysiological responses to face, facial regions and objects in adults with asperger’s syndrome: an ERP investigation. Int. J. Psychophysiol. 63 (3), 283–293.
Papathomas, Thomas V., Bono, Lisa M., 2004. Experiments with a Hollow mask and a reverspective: top-down influences in the inversion effect for 3-D stimuli. Perception 33 (9), 1129–1138.
Pedregosa, Fabian, Gael Varoquaux, Alexandre Gramfort, Vincent Michel, Bertrand Thirion, Olivier Grisel, Mathieu Blondel, Peter Prettenhofer, Ron Weiss, Vincent Dubourg, Jake Vanderplas, Alexandre Passos, David Cournapeau, Matthieu Brucher,
Matthieu Perrot, Edouard Duchesnay, 2011. Scikit-learn: machine learning in python. J. Machine Learning Res. 12(Oct):2825–2830.
Pelli, D.G., 1997. The VideoToolbox software for visual psychophysics: Transforming numbers into movies. Spatial Vision 10.
Piepers, Daniel W., Robbins, Rachel A., 2012. A review and clarification of the terms ‘Holistic’, ‘Configural’, and ‘Relational’ in the face perception literature. Front. Psychol. 3 (DEC), 559.
Pierce, Karen, Conant, David, Hazin, Roxana, Stoner, Richard, Desmond, Jamie, 2011. Preference for geometric patterns early in life as a risk factor for autism. Arch. Gen. Psychiatry 68 (1), 101–109.
Puce, Aina, Marie E. McNeely, Michael E. Berrebi, James C. Thompson, Jillian Hardee, Julie Brefczynski-Lewis, 2013. Multiple faces elicit augmented neural activity. Front. Hum. Neurosci. 7, 282.
Rennig, Johannes, Bilalic, Merim, Huberle, Elisabeth, Karnath, Hans-Otto, Himmelbach, Marc, 2013. The temporo-parietal junction contributes to global gestalt perception—evidence from studies in chess experts. Front. Hum. Neurosci. 7 (AUG), 513.
Rice, Katherine, Moriuchi, Jennifer M., Jones, Warren, Klin, Ami, 2012. Parsing heterogeneity in autism spectrum disorders: visual scanning of dynamic social scenes in school-aged children. J. Am. Acad. Child Adolesc. Psychiatry 51 (3), 238–248.
Seymour, Robert A., Rippon, Gina, Gooding-Williams, Gerard, Schoffelen, Jan M., Kessler, Klaus, 2019. Dysregulated oscillatory connectivity in the visual system in autism spectrum disorder. Brain 142, 3294–3305.
Shim, Miseon, Han Jeong Hwang, Do Won Kim, Seung Hwan Lee, Chang Hwan Im, 2016. Machine-learning-based diagnosis of schizophrenia using combined sensor-level and source-level EEG features. Schizophrenia Res.
Sinha, Pawan, Kjelgaard, Margaret M., Gandhi, Tapan K., Tsourides, Kleovoulos, Cardinaux, Annie L., Pantazis, Dimitrios, Diamond, Sidney P., Held, Richard M., 2014. Autism as a disorder of prediction. Proc. Natl. Acad. Sci. USA 15220–15225.
Tang, Julia, Falkmer, Marita, Horlin, Chiara, Tan, Tele, Vaz, Sharmila, Falkmer, Torbjorn, 2015. Face recognition and visual search strategies in autism spectrum disorders: amending and extending a recent review by Weigelt et al. edited by M. A Pavlova. PLOS ONE 10 (8).
Taulu, S., Simola, J., 2006. Spatiotemporal signal space separation method for rejecting nearby interference in MEG measurements. Phys. Med. Biol. 51 (7), 1759–1768.
Taulu, Samu, Kajola, Matti, Simola, Juha, 2004. Suppression of interference and artifacts by the signal space separation method. Brain Topogr. 16 (4), 269–275.
Tavares, Paula P., Mouga, Susana S., Oliveira, Guiomar G., Castelo-Branco, Miguel, 2016. Preserved face inversion effects in adults with autism spectrum disorder. NeuroReport 27 (8), 587–592.
Teunisse, Jan Pieter, De Gelder, Beatrice, 2003. Face processing in adolescents with autistic disorder: the inversion and composite effects. Brain Cogn. 52 (3), 285–294.
Tipping, Michael E., Christopher M. Bishop, 1999. Probabilistic principal component analysis. J. Royal Statist. Soc. Ser. B: Statist. Method. 61(3):611–622.
Tottenham, N., Tanaka, J.W., Leon, A.C., McCarry, T., Nurse, M., Hare, T.A., Marcus, D. J., Westerlund, A., Casey, B.J., Nelson, C., 2009. The NimStim set of facial expressions: Judgments from untrained research participants. Psychiatry Res. 168 (3), 242–249.
Turk-Browne, Nicholas B., Norman-Haignere, Samuel V., McCarthy, Gregory, 2010. Face-specific resting functional connectivity between the fusiform gyrus and posterior superior temporal sulcus. Front. Hum. Neurosci.
Wada, Atsushi, Sakano, Yuichi, Ando, Hiroshi, 2016. Differential responses to a visual self-motion signal in human medial cortical regions revealed by wide-view stimulation. Front. Psychol. 7, 309.
Weigelt, Sarah, Koldewyn, Kami, Kanwisher, Nancy, 2012. Face identity recognition in autism spectrum disorders: a review of behavioral studies. Neurosci. Biobehav. Rev. 36 (3), 1060–1084.
Yin, Robert K., 1969. Looking at upide-down faces. J. Experiment. Psychol. 81 (1), 141–145.
Zhu, Xun, Bhatt, Ramesh S., Joseph, Jane E., 2016. Pruning or tuning? Maturational profiles of face specialization during typical development. Brain Behav. 6 (6).
Zürcher, Nicole R., Donnelly, Nick, Rogier, Ophelie, Russo, Britt, Hippolyte, Loyse, Hadwin, Julie, Lemonnier, Eric, Hadjikhani, Nouchine, 2013. It’s all in the eyes: subcortical and cortical activation during grotesqueness perception in autism. PLoS ONE 8 (1).
A.S. Nunes et al.