numerical simulation of sea surface directional wave ... · numerical simulation of sea surface...
TRANSCRIPT
1680 VOLUME 33J O U R N A L O F P H Y S I C A L O C E A N O G R A P H Y
q 2003 American Meteorological Society
Numerical Simulation of Sea Surface Directional Wave Spectra under HurricaneWind Forcing
IL-JU MOON, ISAAC GINIS, AND TETSU HARA
Graduate School of Oceanography, University of Rhode Island, Narragansett, Rhode Island
HENDRIK L. TOLMAN
SAIC-GSO at NOAA/NCEP Environmental Modeling Center, Camp Springs, Maryland
C. W. WRIGHT AND EDWARD J. WALSH*
NASA Goddard Space Flight Center Wallops Flight Facility, Wallops Island, Virginia
(Manuscript received 15 August 2002, in final form 30 January 2003)
ABSTRACT
Numerical simulation of sea surface directional wave spectra under hurricane wind forcing was carried outusing a high-resolution wave model. The simulation was run for four days as Hurricane Bonnie (1998) approachedthe U.S. East Coast. The results are compared with buoy observations and NASA Scanning Radar Altimeter(SRA) data, which were obtained on 24 August 1998 in the open ocean and on 26 August when the storm wasapproaching the shore. The simulated significant wave height in the open ocean reached 14 m, agreeing wellwith the SRA and buoy observations. It gradually decreased as the hurricane approached the shore. In the openocean, the dominant wavelength and wave direction in all four quadrants relative to the storm center weresimulated very accurately. For the landfall case, however, the simulated dominant wavelength displays noticeableoverestimation because the wave model cannot properly simulate shoaling processes. Direct comparison of themodel and SRA directional spectra in all four quadrants of the hurricane shows excellent agreement in general.In some cases, the model produces smoother spectra with narrower directional spreading than do the observations.The spatial characteristics of the spectra depend on the relative position from the hurricane center, the hurricanetranslation speed, and bathymetry. Attempts are made to provide simple explanations for the misalignmentbetween local wind and wave directions and for the effect of hurricane translation speed on wave spectra.
1. Introduction
Hurricane-generated wave fields are of interest bothscientifically for understanding wind–wave interactionphysics and operationally for predicting potentiallyhazardous conditions for ship navigation and coastalregions. A hurricane with intense and fast-varyingwinds produces a severe and complex ocean wave fieldthat can propagate for thousands of kilometers awayfrom the storm center, resulting in dramatic variationof the wave field in space and time (Barber and Ursell1948).
In recent years there have been considerable effortsmade to measure the directional spectra of hurricane-
* Current affiliation: NOAA/Environmental Technology Labora-tory, Boulder, Colorado.
Corresponding author address: Il-Ju Moon, Graduate School ofOceanography, University of Rhode Island, Narragansett, RI 02882.E-mail: [email protected]
generated surface waves and to investigate its spectralcharacteristics. Wyatt (1995) described measurementsof the directional spectra of storm waves using high-frequency radar to explain the effect of fetch on thedirectional spectrum of Celtic Sea storm waves. Holtet al. (1998) examined the capability of synthetic ap-erture radar imagery from ERS-1 satellite to track thewave fields emanating from an intense storm over aseveral day period. Wright et al. (2001) and Walsh etal. (2002) studied the spatial variation of hurricanedirectional wave spectra for both open ocean and land-fall cases using the National Aeronautics and SpaceAdministration (NASA) Scanning Radar Altimeter(SRA) for the first time. These measurements have pro-vided detailed wave characteristics only at a specificspace and time.
Ocean wave modeling is a very useful and conve-nient way to obtain the spatial and temporal distribu-tion of directional spectra without the limitations as-sociated with measurements, although the model out-put may differ from observations because of uncer-
AUGUST 2003 1681M O O N E T A L .
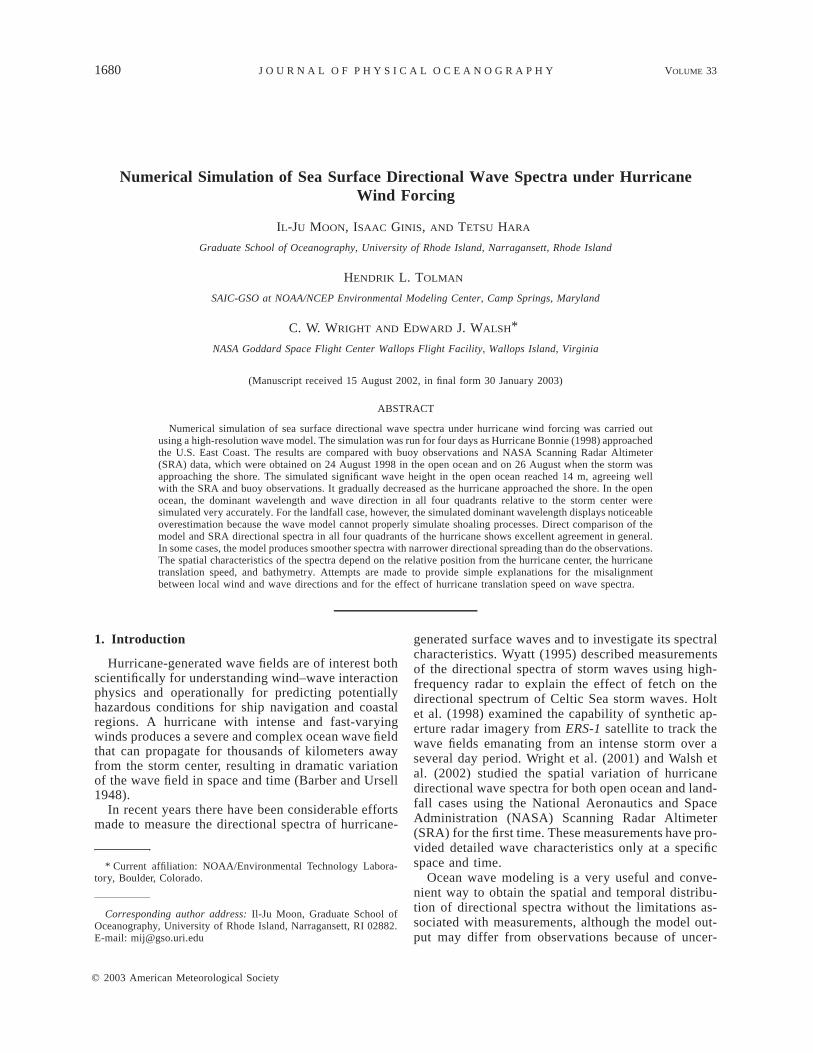
FIG. 1. Hurricane Bonnie from satellite image at 1846 UTC 25 Aug 1998.
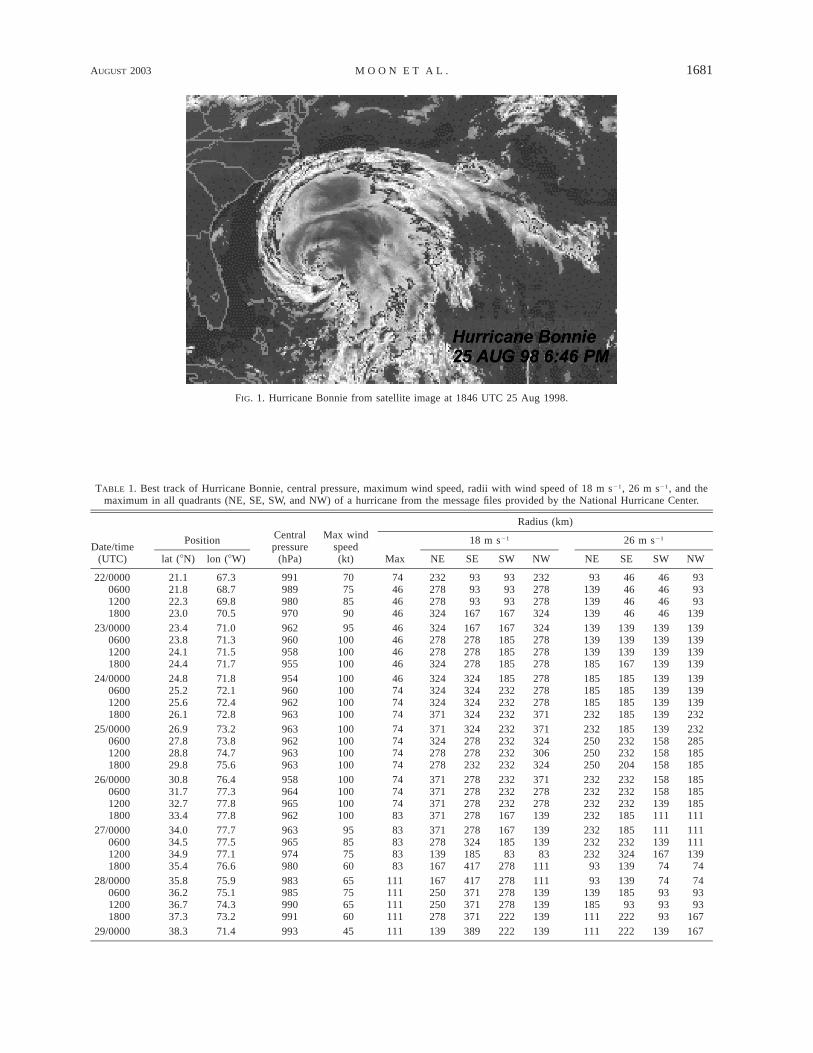
TABLE 1. Best track of Hurricane Bonnie, central pressure, maximum wind speed, radii with wind speed of 18 m s21, 26 m s21, and themaximum in all quadrants (NE, SE, SW, and NW) of a hurricane from the message files provided by the National Hurricane Center.
Date/time(UTC)
Position
lat (8N) lon (8W)
Centralpressure
(hPa)
Max windspeed(kt)
Radius (km)
Max
18 m s21
NE SE SW NW
26 m s21
NE SE SW NW
22/0000060012001800
21.121.822.323.0
67.368.769.870.5
991989980970
70758590
74464646
232278278324
939393
167
939393
167
232278278324
93139139139
46464646
46464646
939393
13923/0000
060012001800
23.423.824.124.4
71.071.371.571.7
962960958955
95100100100
46464646
324278278324
167278278278
167185185185
324278278278
139139139185
139139139167
139139139139
139139139139
24/0000060012001800
24.825.225.626.1
71.872.172.472.8
954960962963
100100100100
46747474
324324324371
324324324324
185232232232
278278278371
185185185232
185185185185
139139139139
139139139232
25/0000060012001800
26.927.828.829.8
73.273.874.775.6
963962963963
100100100100
74747474
371324278278
324278278232
232232232232
371324306324
232250250250
185232232204
139158158158
232285185185
26/0000060012001800
30.831.732.733.4
76.477.377.877.8
958964965962
100100100100
74747483
371371371371
278278278278
232232232167
371278278139
232232232232
232232232185
158158139111
185185185111
27/0000060012001800
34.034.534.935.4
77.777.577.176.6
963965974980
95857560
83838383
371278139167
278324185417
167185
83278
139139
83111
232232232
93
185232324139
111139167
74
111111139
7428/0000
060012001800
35.836.236.737.3
75.975.174.373.2
983985990991
65756560
111111111111
167250250278
417371371371
278278278222
111139139139
93139185111
139185
93222
74939393
749393
16729/0000 38.3 71.4 993 45 111 139 389 222 139 111 222 139 167
1682 VOLUME 33J O U R N A L O F P H Y S I C A L O C E A N O G R A P H Y
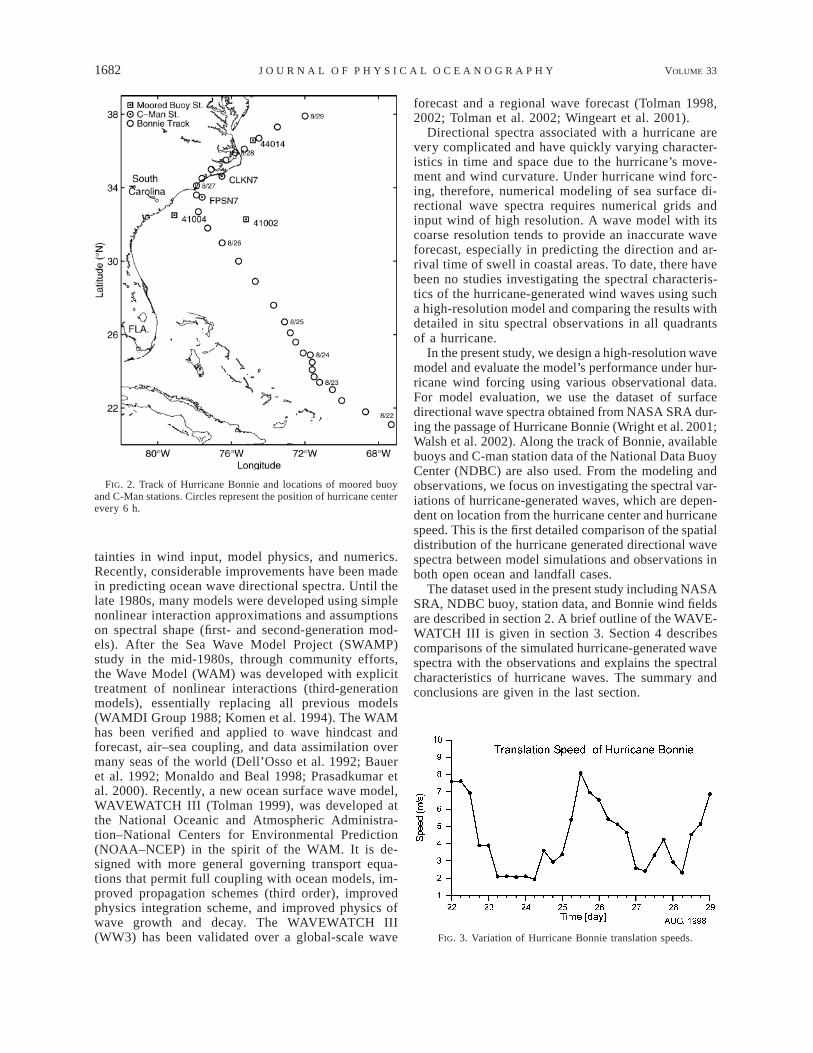
FIG. 2. Track of Hurricane Bonnie and locations of moored buoyand C-Man stations. Circles represent the position of hurricane centerevery 6 h.
FIG. 3. Variation of Hurricane Bonnie translation speeds.
tainties in wind input, model physics, and numerics.Recently, considerable improvements have been madein predicting ocean wave directional spectra. Until thelate 1980s, many models were developed using simplenonlinear interaction approximations and assumptionson spectral shape (first- and second-generation mod-els). After the Sea Wave Model Project (SWAMP)study in the mid-1980s, through community efforts,the Wave Model (WAM) was developed with explicittreatment of nonlinear interactions (third-generationmodels), essentially replacing all previous models(WAMDI Group 1988; Komen et al. 1994). The WAMhas been verified and applied to wave hindcast andforecast, air–sea coupling, and data assimilation overmany seas of the world (Dell’Osso et al. 1992; Baueret al. 1992; Monaldo and Beal 1998; Prasadkumar etal. 2000). Recently, a new ocean surface wave model,WAVEWATCH III (Tolman 1999), was developed atthe National Oceanic and Atmospheric Administra-tion–National Centers for Environmental Prediction(NOAA–NCEP) in the spirit of the WAM. It is de-signed with more general governing transport equa-tions that permit full coupling with ocean models, im-proved propagation schemes (third order), improvedphysics integration scheme, and improved physics ofwave growth and decay. The WAVEWATCH III(WW3) has been validated over a global-scale wave
forecast and a regional wave forecast (Tolman 1998,2002; Tolman et al. 2002; Wingeart et al. 2001).
Directional spectra associated with a hurricane arevery complicated and have quickly varying character-istics in time and space due to the hurricane’s move-ment and wind curvature. Under hurricane wind forc-ing, therefore, numerical modeling of sea surface di-rectional wave spectra requires numerical grids andinput wind of high resolution. A wave model with itscoarse resolution tends to provide an inaccurate waveforecast, especially in predicting the direction and ar-rival time of swell in coastal areas. To date, there havebeen no studies investigating the spectral characteris-tics of the hurricane-generated wind waves using sucha high-resolution model and comparing the results withdetailed in situ spectral observations in all quadrantsof a hurricane.
In the present study, we design a high-resolution wavemodel and evaluate the model’s performance under hur-ricane wind forcing using various observational data.For model evaluation, we use the dataset of surfacedirectional wave spectra obtained from NASA SRA dur-ing the passage of Hurricane Bonnie (Wright et al. 2001;Walsh et al. 2002). Along the track of Bonnie, availablebuoys and C-man station data of the National Data BuoyCenter (NDBC) are also used. From the modeling andobservations, we focus on investigating the spectral var-iations of hurricane-generated waves, which are depen-dent on location from the hurricane center and hurricanespeed. This is the first detailed comparison of the spatialdistribution of the hurricane generated directional wavespectra between model simulations and observations inboth open ocean and landfall cases.
The dataset used in the present study including NASASRA, NDBC buoy, station data, and Bonnie wind fieldsare described in section 2. A brief outline of the WAVE-WATCH III is given in section 3. Section 4 describescomparisons of the simulated hurricane-generated wavespectra with the observations and explains the spectralcharacteristics of hurricane waves. The summary andconclusions are given in the last section.
AUGUST 2003 1683M O O N E T A L .
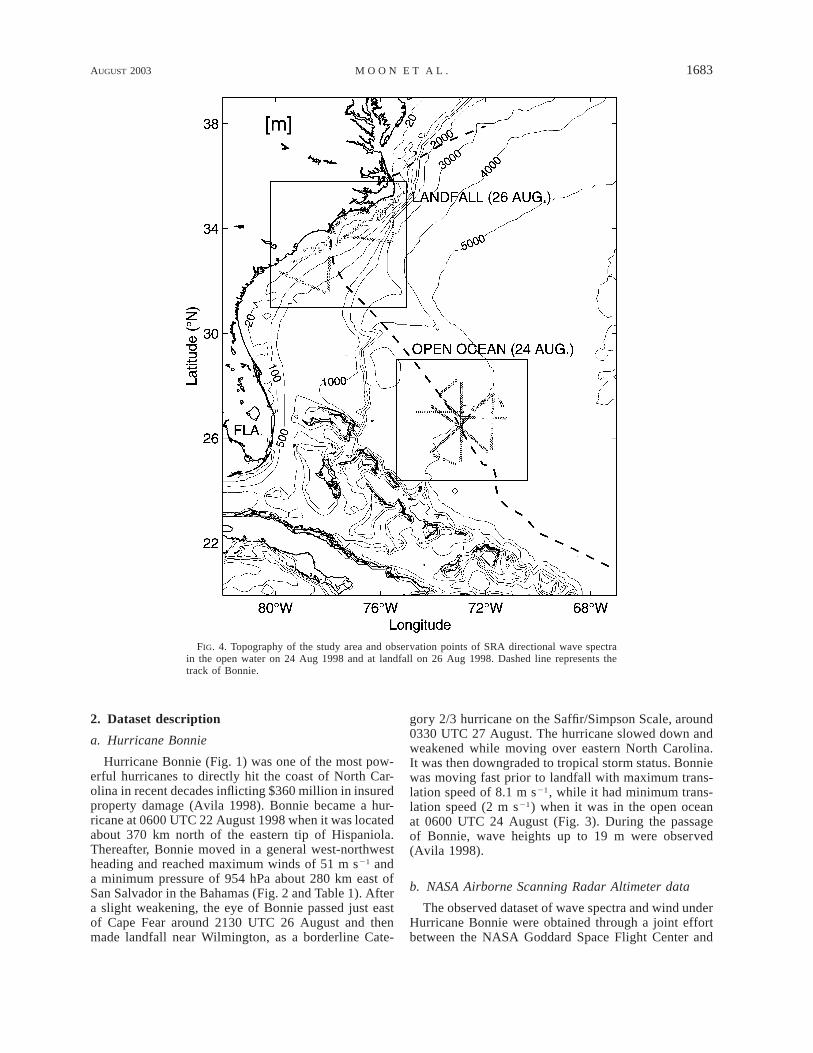
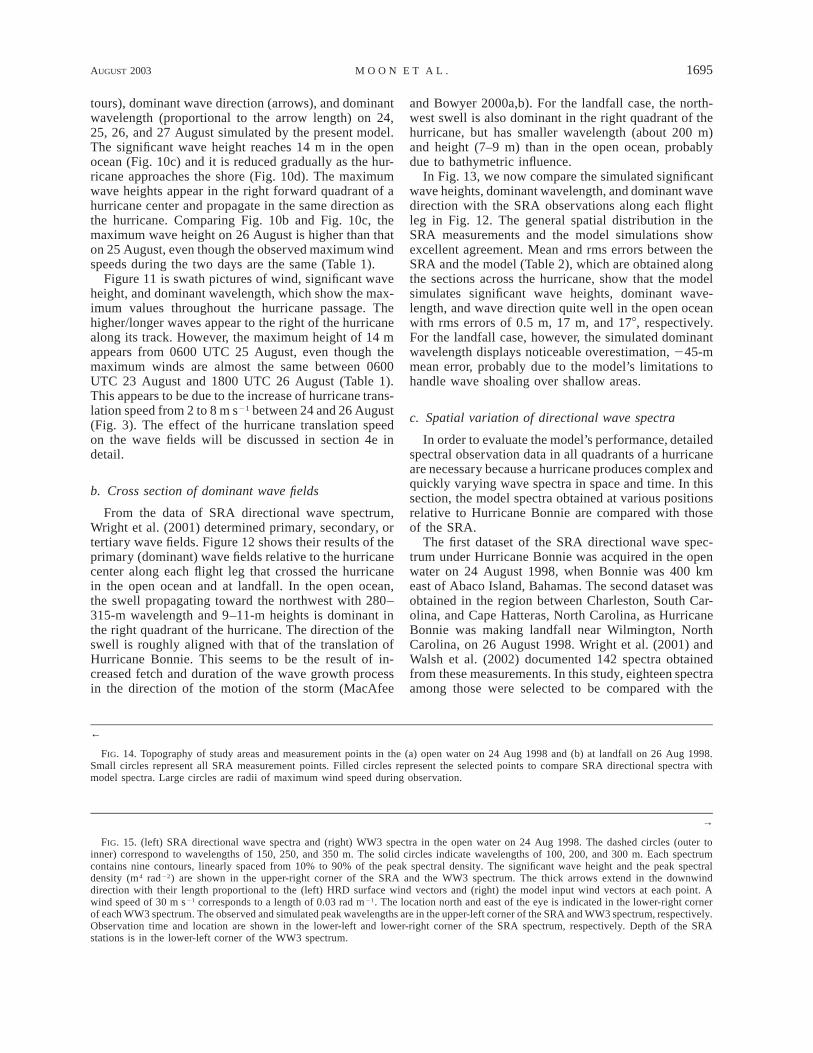
FIG. 4. Topography of the study area and observation points of SRA directional wave spectrain the open water on 24 Aug 1998 and at landfall on 26 Aug 1998. Dashed line represents thetrack of Bonnie.
2. Dataset description
a. Hurricane Bonnie
Hurricane Bonnie (Fig. 1) was one of the most pow-erful hurricanes to directly hit the coast of North Car-olina in recent decades inflicting $360 million in insuredproperty damage (Avila 1998). Bonnie became a hur-ricane at 0600 UTC 22 August 1998 when it was locatedabout 370 km north of the eastern tip of Hispaniola.Thereafter, Bonnie moved in a general west-northwestheading and reached maximum winds of 51 m s21 anda minimum pressure of 954 hPa about 280 km east ofSan Salvador in the Bahamas (Fig. 2 and Table 1). Aftera slight weakening, the eye of Bonnie passed just eastof Cape Fear around 2130 UTC 26 August and thenmade landfall near Wilmington, as a borderline Cate-
gory 2/3 hurricane on the Saffir/Simpson Scale, around0330 UTC 27 August. The hurricane slowed down andweakened while moving over eastern North Carolina.It was then downgraded to tropical storm status. Bonniewas moving fast prior to landfall with maximum trans-lation speed of 8.1 m s21, while it had minimum trans-lation speed (2 m s21) when it was in the open oceanat 0600 UTC 24 August (Fig. 3). During the passageof Bonnie, wave heights up to 19 m were observed(Avila 1998).
b. NASA Airborne Scanning Radar Altimeter data
The observed dataset of wave spectra and wind underHurricane Bonnie were obtained through a joint effortbetween the NASA Goddard Space Flight Center and
1684 VOLUME 33J O U R N A L O F P H Y S I C A L O C E A N O G R A P H Y
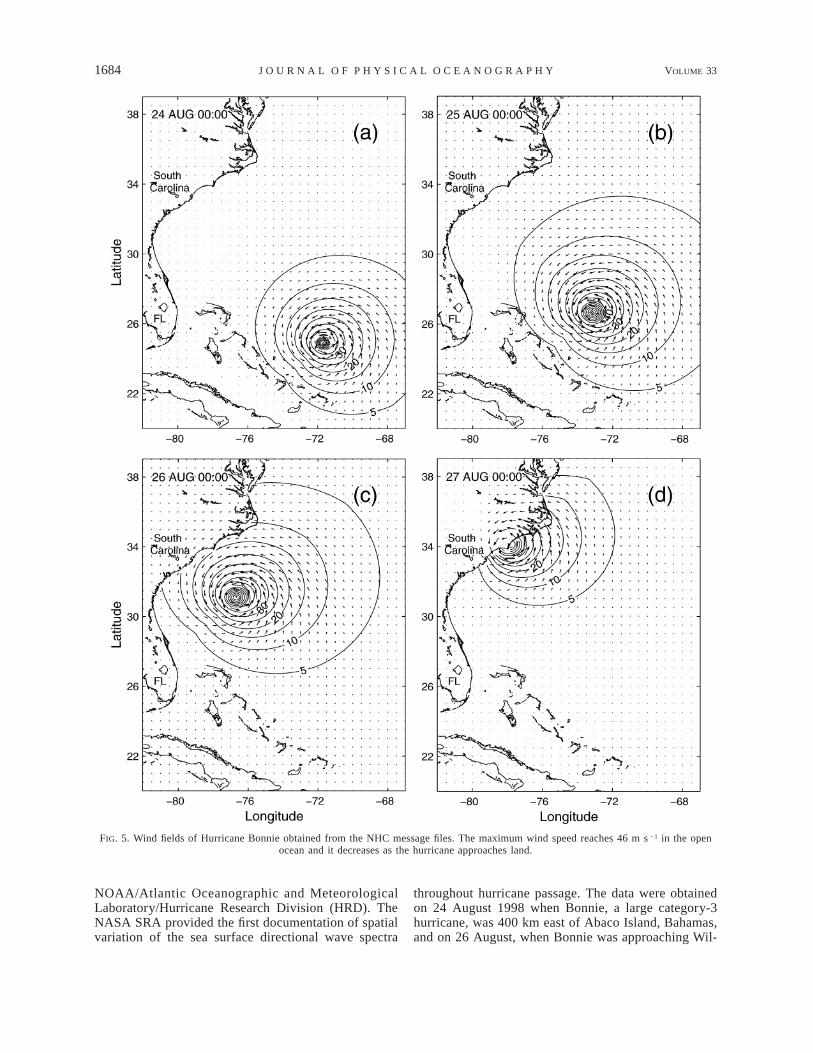
FIG. 5. Wind fields of Hurricane Bonnie obtained from the NHC message files. The maximum wind speed reaches 46 m s 21 in the openocean and it decreases as the hurricane approaches land.
NOAA/Atlantic Oceanographic and MeteorologicalLaboratory/Hurricane Research Division (HRD). TheNASA SRA provided the first documentation of spatialvariation of the sea surface directional wave spectra
throughout hurricane passage. The data were obtainedon 24 August 1998 when Bonnie, a large category-3hurricane, was 400 km east of Abaco Island, Bahamas,and on 26 August, when Bonnie was approaching Wil-
AUGUST 2003 1685M O O N E T A L .
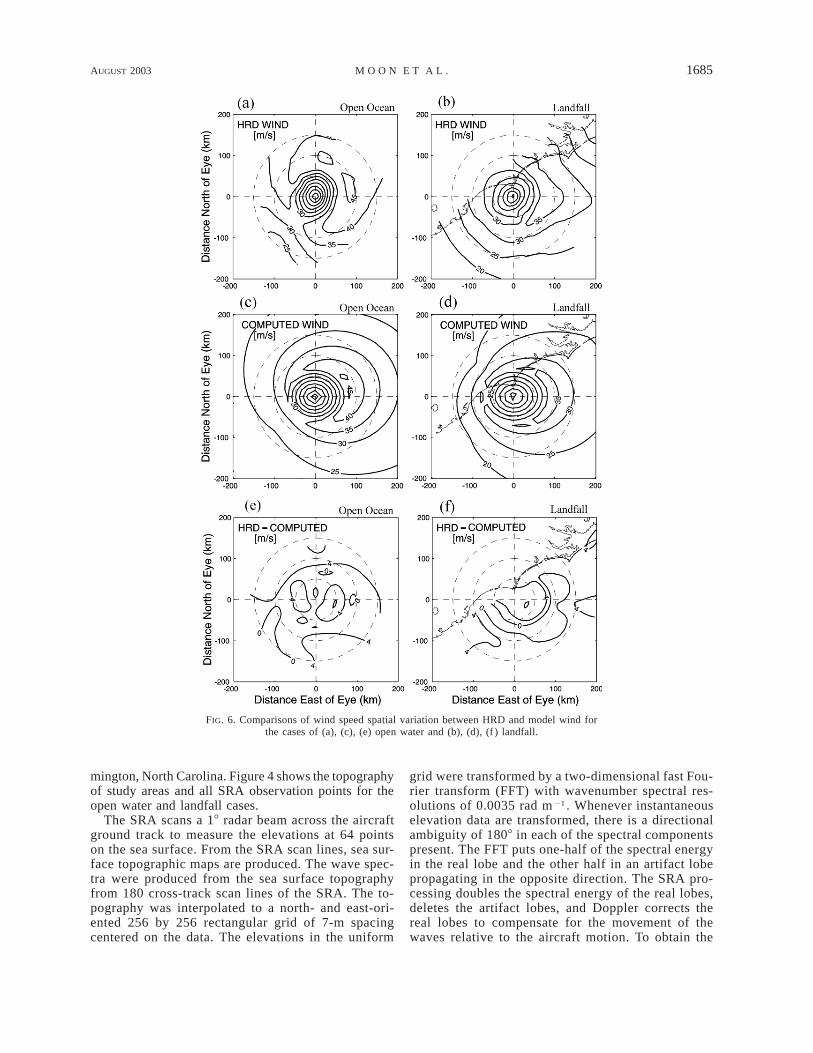
FIG. 6. Comparisons of wind speed spatial variation between HRD and model wind forthe cases of (a), (c), (e) open water and (b), (d), (f ) landfall.
mington, North Carolina. Figure 4 shows the topographyof study areas and all SRA observation points for theopen water and landfall cases.
The SRA scans a 18 radar beam across the aircraftground track to measure the elevations at 64 pointson the sea surface. From the SRA scan lines, sea sur-face topographic maps are produced. The wave spec-tra were produced from the sea surface topographyfrom 180 cross-track scan lines of the SRA. The to-pography was interpolated to a north- and east-ori-ented 256 by 256 rectangular grid of 7-m spacingcentered on the data. The elevations in the uniform
grid were transformed by a two-dimensional fast Fou-rier transform (FFT) with wavenumber spectral res-olutions of 0.0035 rad m 21 . Whenever instantaneouselevation data are transformed, there is a directionalambiguity of 1808 in each of the spectral componentspresent. The FFT puts one-half of the spectral energyin the real lobe and the other half in an artifact lobepropagating in the opposite direction. The SRA pro-cessing doubles the spectral energy of the real lobes,deletes the artifact lobes, and Doppler corrects thereal lobes to compensate for the movement of thewaves relative to the aircraft motion. To obtain the
1686 VOLUME 33J O U R N A L O F P H Y S I C A L O C E A N O G R A P H Y
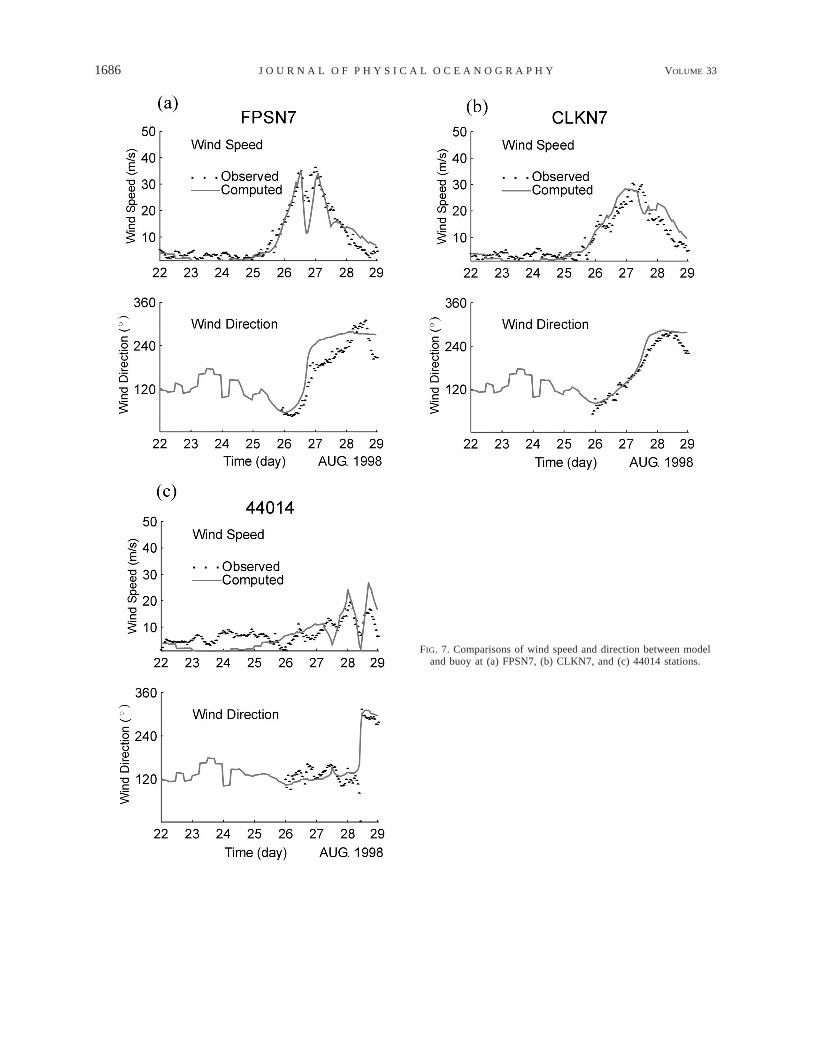
FIG. 7. Comparisons of wind speed and direction between modeland buoy at (a) FPSN7, (b) CLKN7, and (c) 44014 stations.
AUGUST 2003 1687M O O N E T A L .
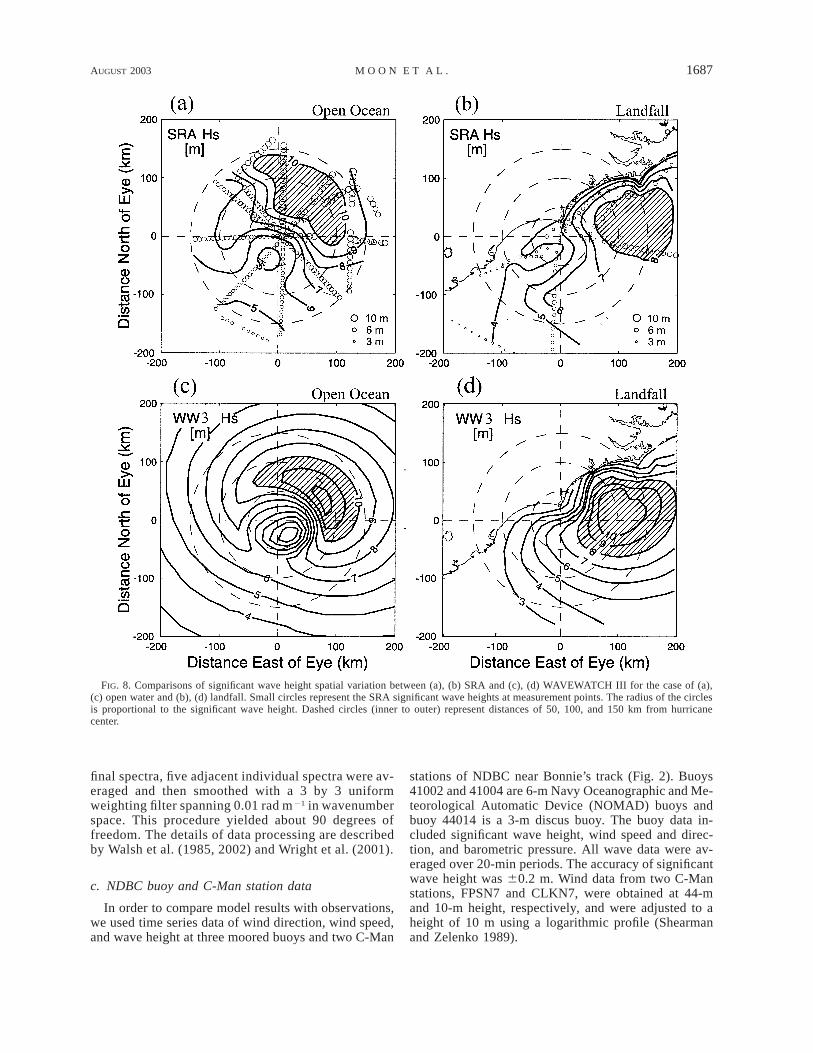
FIG. 8. Comparisons of significant wave height spatial variation between (a), (b) SRA and (c), (d) WAVEWATCH III for the case of (a),(c) open water and (b), (d) landfall. Small circles represent the SRA significant wave heights at measurement points. The radius of the circlesis proportional to the significant wave height. Dashed circles (inner to outer) represent distances of 50, 100, and 150 km from hurricanecenter.
final spectra, five adjacent individual spectra were av-eraged and then smoothed with a 3 by 3 uniformweighting filter spanning 0.01 rad m 21 in wavenumberspace. This procedure yielded about 90 degrees offreedom. The details of data processing are describedby Walsh et al. (1985, 2002) and Wright et al. (2001).
c. NDBC buoy and C-Man station data
In order to compare model results with observations,we used time series data of wind direction, wind speed,and wave height at three moored buoys and two C-Man
stations of NDBC near Bonnie’s track (Fig. 2). Buoys41002 and 41004 are 6-m Navy Oceanographic and Me-teorological Automatic Device (NOMAD) buoys andbuoy 44014 is a 3-m discus buoy. The buoy data in-cluded significant wave height, wind speed and direc-tion, and barometric pressure. All wave data were av-eraged over 20-min periods. The accuracy of significantwave height was 60.2 m. Wind data from two C-Manstations, FPSN7 and CLKN7, were obtained at 44-mand 10-m height, respectively, and were adjusted to aheight of 10 m using a logarithmic profile (Shearmanand Zelenko 1989).
1688 VOLUME 33J O U R N A L O F P H Y S I C A L O C E A N O G R A P H Y
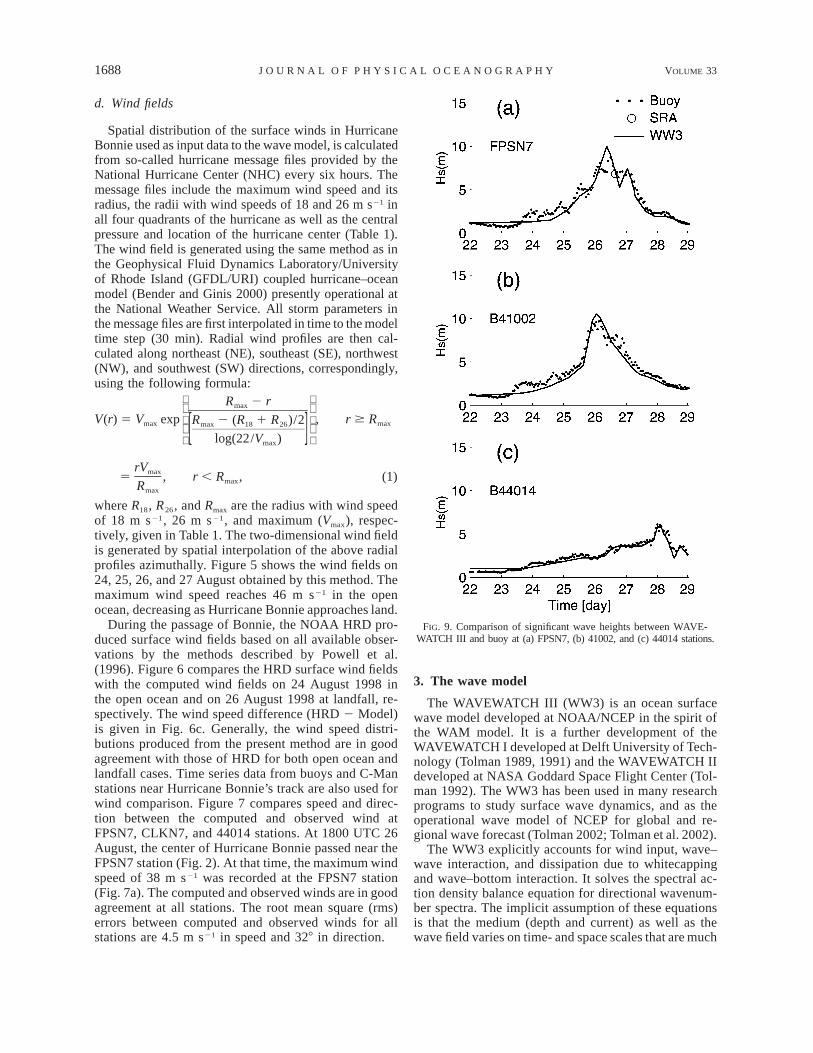
FIG. 9. Comparison of significant wave heights between WAVE-WATCH III and buoy at (a) FPSN7, (b) 41002, and (c) 44014 stations.
d. Wind fields
Spatial distribution of the surface winds in HurricaneBonnie used as input data to the wave model, is calculatedfrom so-called hurricane message files provided by theNational Hurricane Center (NHC) every six hours. Themessage files include the maximum wind speed and itsradius, the radii with wind speeds of 18 and 26 m s21 inall four quadrants of the hurricane as well as the centralpressure and location of the hurricane center (Table 1).The wind field is generated using the same method as inthe Geophysical Fluid Dynamics Laboratory/Universityof Rhode Island (GFDL/URI) coupled hurricane–oceanmodel (Bender and Ginis 2000) presently operational atthe National Weather Service. All storm parameters inthe message files are first interpolated in time to the modeltime step (30 min). Radial wind profiles are then cal-culated along northeast (NE), southeast (SE), northwest(NW), and southwest (SW) directions, correspondingly,using the following formula:
R 2 rmax V(r) 5 V exp , r $ R R 2 (R 1 R )/2max maxmax 18 26 [ ]log(22/V ) max
rVmax5 , r , R , (1)maxRmax
where R18, R26, and Rmax are the radius with wind speedof 18 m s21, 26 m s21, and maximum (Vmax), respec-tively, given in Table 1. The two-dimensional wind fieldis generated by spatial interpolation of the above radialprofiles azimuthally. Figure 5 shows the wind fields on24, 25, 26, and 27 August obtained by this method. Themaximum wind speed reaches 46 m s21 in the openocean, decreasing as Hurricane Bonnie approaches land.
During the passage of Bonnie, the NOAA HRD pro-duced surface wind fields based on all available obser-vations by the methods described by Powell et al.(1996). Figure 6 compares the HRD surface wind fieldswith the computed wind fields on 24 August 1998 inthe open ocean and on 26 August 1998 at landfall, re-spectively. The wind speed difference (HRD 2 Model)is given in Fig. 6c. Generally, the wind speed distri-butions produced from the present method are in goodagreement with those of HRD for both open ocean andlandfall cases. Time series data from buoys and C-Manstations near Hurricane Bonnie’s track are also used forwind comparison. Figure 7 compares speed and direc-tion between the computed and observed wind atFPSN7, CLKN7, and 44014 stations. At 1800 UTC 26August, the center of Hurricane Bonnie passed near theFPSN7 station (Fig. 2). At that time, the maximum windspeed of 38 m s21 was recorded at the FPSN7 station(Fig. 7a). The computed and observed winds are in goodagreement at all stations. The root mean square (rms)errors between computed and observed winds for allstations are 4.5 m s21 in speed and 328 in direction.
3. The wave model
The WAVEWATCH III (WW3) is an ocean surfacewave model developed at NOAA/NCEP in the spirit ofthe WAM model. It is a further development of theWAVEWATCH I developed at Delft University of Tech-nology (Tolman 1989, 1991) and the WAVEWATCH IIdeveloped at NASA Goddard Space Flight Center (Tol-man 1992). The WW3 has been used in many researchprograms to study surface wave dynamics, and as theoperational wave model of NCEP for global and re-gional wave forecast (Tolman 2002; Tolman et al. 2002).
The WW3 explicitly accounts for wind input, wave–wave interaction, and dissipation due to whitecappingand wave–bottom interaction. It solves the spectral ac-tion density balance equation for directional wavenum-ber spectra. The implicit assumption of these equationsis that the medium (depth and current) as well as thewave field varies on time- and space scales that are much
AUGUST 2003 1689M O O N E T A L .
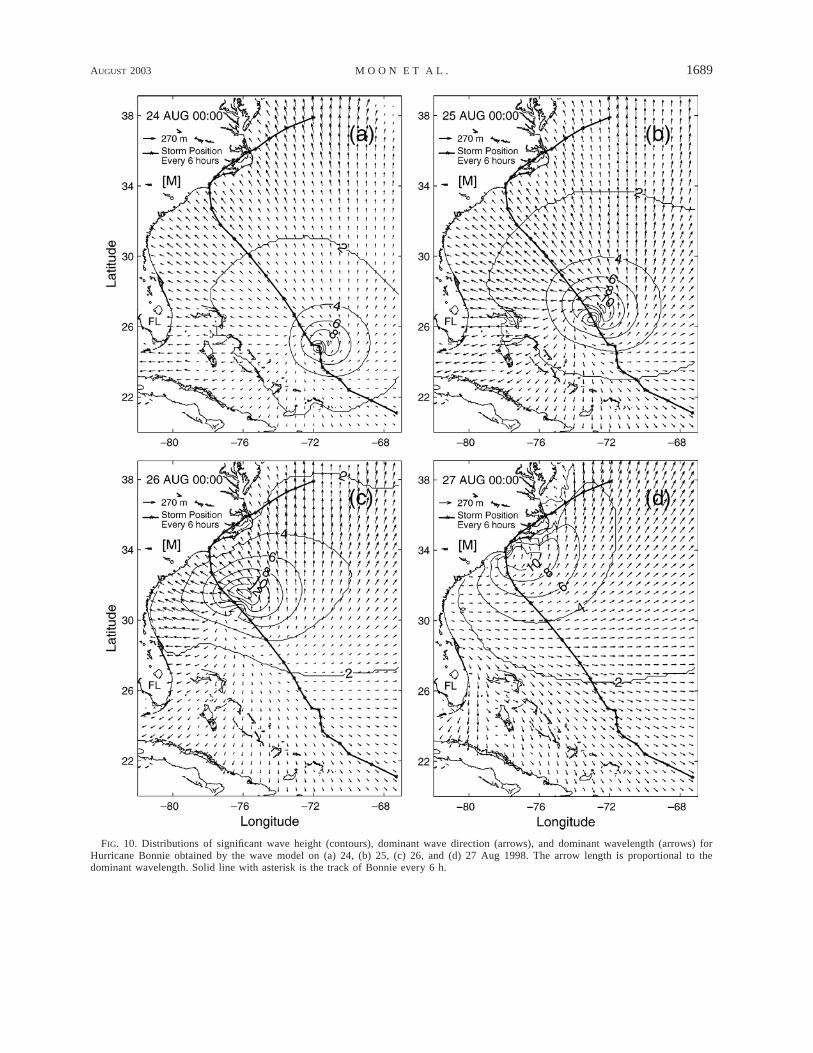
FIG. 10. Distributions of significant wave height (contours), dominant wave direction (arrows), and dominant wavelength (arrows) forHurricane Bonnie obtained by the wave model on (a) 24, (b) 25, (c) 26, and (d) 27 Aug 1998. The arrow length is proportional to thedominant wavelength. Solid line with asterisk is the track of Bonnie every 6 h.
1690 VOLUME 33J O U R N A L O F P H Y S I C A L O C E A N O G R A P H Y
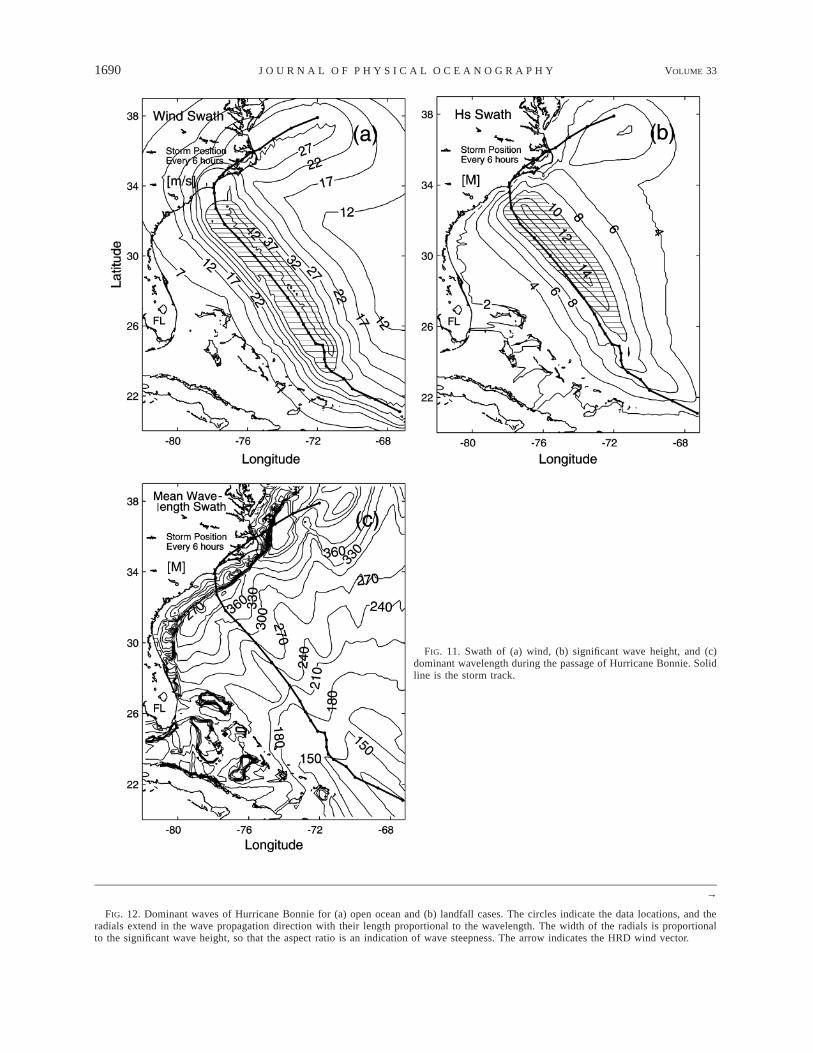
FIG. 11. Swath of (a) wind, (b) significant wave height, and (c)dominant wavelength during the passage of Hurricane Bonnie. Solidline is the storm track.
→
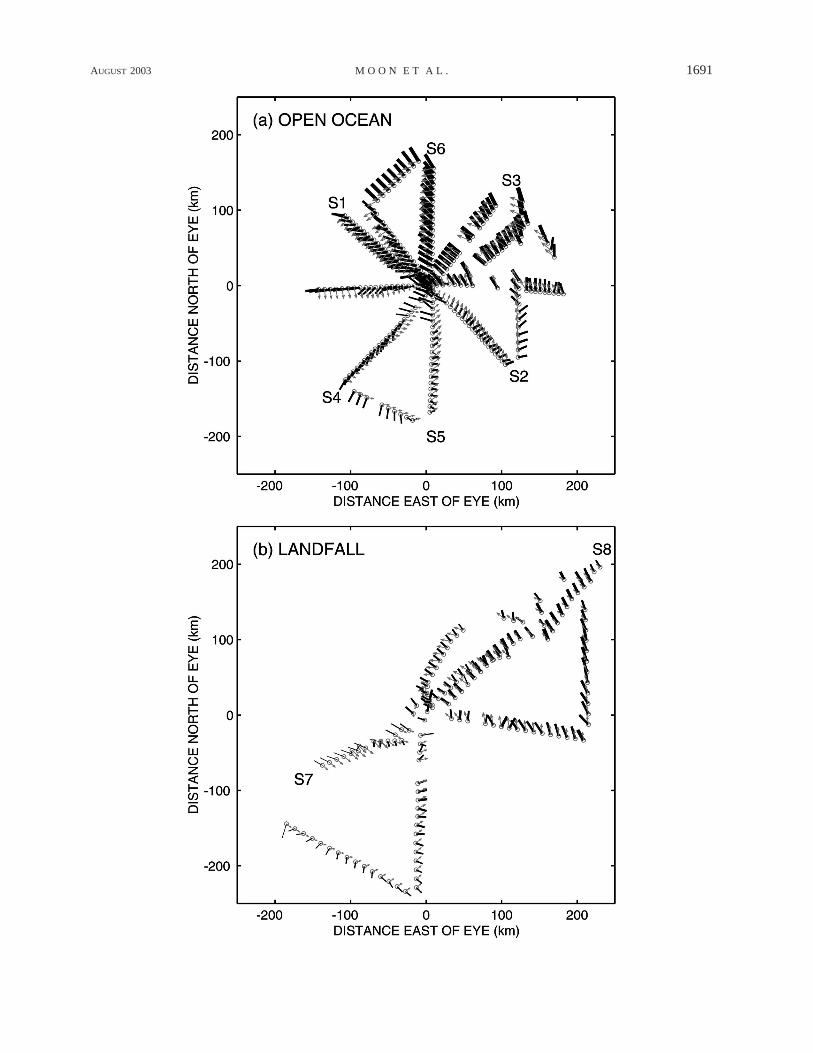
FIG. 12. Dominant waves of Hurricane Bonnie for (a) open ocean and (b) landfall cases. The circles indicate the data locations, and theradials extend in the wave propagation direction with their length proportional to the wavelength. The width of the radials is proportionalto the significant wave height, so that the aspect ratio is an indication of wave steepness. The arrow indicates the HRD wind vector.
AUGUST 2003 1691M O O N E T A L .
1692 VOLUME 33J O U R N A L O F P H Y S I C A L O C E A N O G R A P H Y
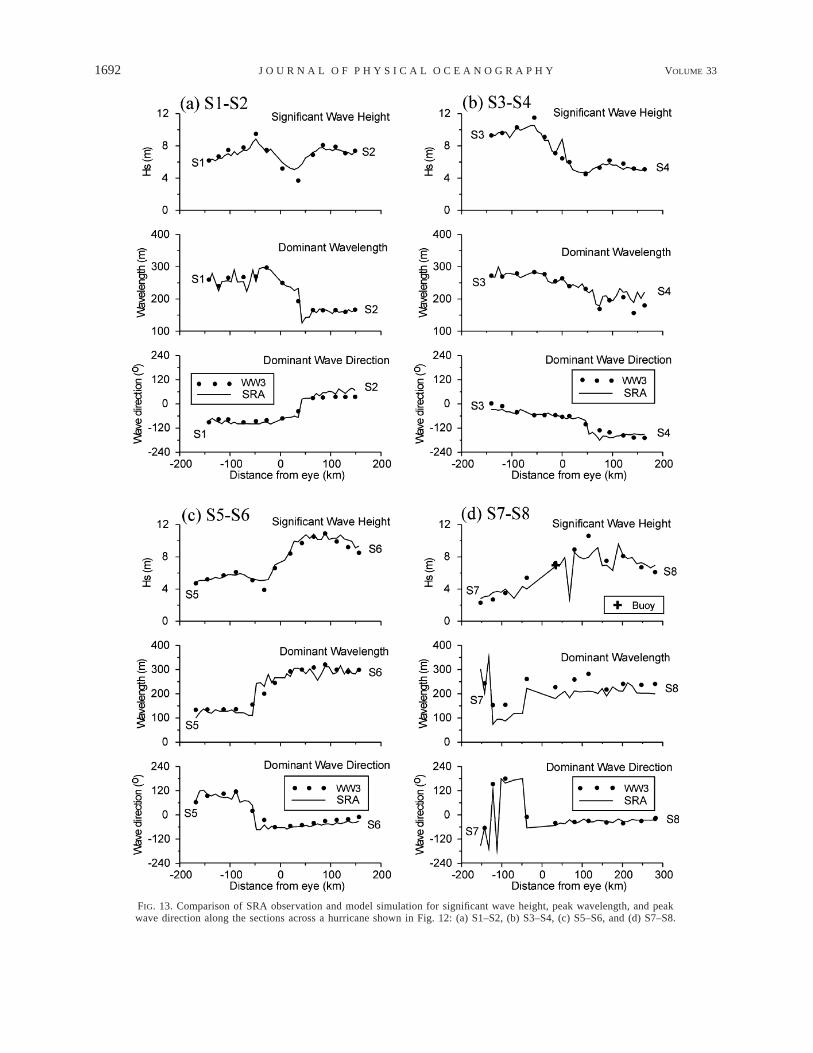
FIG. 13. Comparison of SRA observation and model simulation for significant wave height, peak wavelength, and peakwave direction along the sections across a hurricane shown in Fig. 12: (a) S1–S2, (b) S3–S4, (c) S5–S6, and (d) S7–S8.
AUGUST 2003 1693M O O N E T A L .
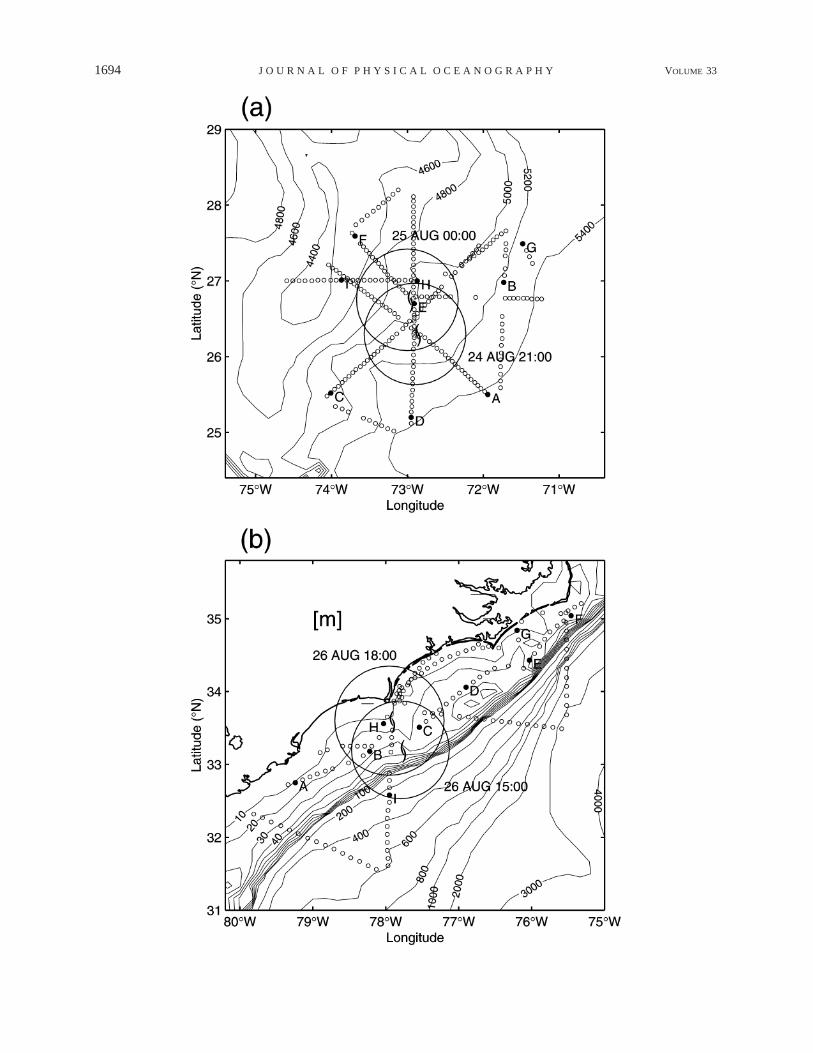
TABLE 2. Mean and rms errors of significant wave height, dominant wavelength, and wave direction for open ocean and landfall cases.
Wave
Open ocean
Mean error* Rms error**
Landfall
Mean error Rms error
Total
Mean error Rms error
Height (m)Length (m)Direction (8)
0.0621.4523.73
0.5117.4617.69
0.24245.28210.48
1.3250.0220.05
0.10211.5625.29
0.7828.4918.26
1* Mean error 5 (X 2 X )O obs simN
12** Rms error 5 (X 2 X )O obs sim!N
larger than the corresponding scales of a single wave.The physics included in the model do not cover con-ditions where waves are severely depth limited. Thisimplies that the model can generally be applied on spa-tial scales (grid increments) larger than 1–10 km andoutside the surf zone. The source terms of the WW3use wind–wave interaction according to Chalikov andBelevich (1993), as modified by Tolman and Chalikov(1996) and Tolman (1999), discrete interaction approx-imation (DIA) for nonlinear interactions (as in WAM),dissipation from Tolman and Chalikov (1996), and bot-tom friction as in the Joint North Sea Wave Project(JONSWAP, as in most WAM models). A detailed de-scription of the model is given by Tolman (1999).
The wave model used in this study is a high-resolutionversion of the WW3. Two recent studies (Tolman et al.2002; Wingeart et al. 2001) use time step of 3600 s,wind input interval of 3600 s, 24 spectral directions,and spatial grid of 18 3 1.258 (global model) and 1⁄48 31⁄48 (regional model). The present model uses 1800 s(time step and wind input interval), 36 directions (spec-tral resolution), 1⁄128 3 1⁄128 (spatial grid resolution). Thishigh-resolution model is necessary to resolve the quick-ly varying wave field associated with a hurricane. Thegrid is regularly spaced by longitude–latitude grid, ex-tending from 208 to 398N, 678 to 828W and the wavespectrum is discretized using 25 frequencies extendingfrom 0.0418 to 0.3058 Hz (wavelength of 16–893 m)with a logarithmic increment f n11 5 1.1 f n, where f n isthe nth frequency.
The model is compiled for a distributed memory en-vironment using the Message Passing Interface (MPI)and provides output of directional wave spectra, as wellas mean wave parameters such as significant waveheights (4 ), mean wavelength (2p ), mean wave21ÏE kperiod (2p ), mean wave direction, peak frequency,21sand peak direction. Here, E is spectrum energy, k iswavenumber, s is radian frequency. The peak (domi-nant) frequency is calculated from the one-dimensionalfrequency spectrum using a parabolic fit around the dis-crete peak. The peak (dominant) wavenumber (wave-length) is calculated from the peak frequency using thedispersion relation.
4. Results and discussion
a. Significant wave heights
Accurate prediction of hurricane-generated signifi-cant wave heights is one of the most important factorsin monitoring potentially hazardous conditions for ship-ping routes and coastal environments. Figure 8 com-pares significant wave heights between the SRA obser-vation and the model in the open ocean and at landfall.The contours of Figs. 8a and 8b estimated from the SRAobservations are plotted in positions that are shifted spa-tially from the observation positions according to therelative vector between the eye location at the referencetime and the observation time (Walsh et al. 2002). Non-uniformly spaced SRA data are interpolated to uniformgrid using cubic interpolation method and smoothed todraw clear contours. The pictures are consistent withoriginal ones (Fig. 3) indicated by Walsh et al. (2002).In the open ocean, the shaded areas (inside the 10-mcontour) of the model and the observation are very sim-ilar in their position and shape (Figs. 8a,c). For thelandfall case, the shaded areas (inside the 8-m contour)are also in reasonable agreement between the two results(Figs. 8b,d). The maximum wave heights from the mod-el are 14 and 11 m in the open ocean and at landfall,respectively, while those from SRA are 11 and 8.5 m.These smaller maximum wave heights of SRA, however,may be underestimated in reality because there were notmany data inside the contour. As the hurricane crossedthe continental shelf and approaches the shore, the sim-ulated significant wave heights seemed to decrease by20%, which was due to shoaling effects.
Figure 9 shows a comparison of significant waveheights (Hs) between the model and observations atFPSN7, 41002, and 44014 stations. The maximum waveheights at the three stations reach 9, 10, and 8 m (inobservations) and 10, 10.5, and 7 m (in the model),respectively. The simulated wave heights are generallyin good agreement with the observations throughoutHurricane Bonnie’s passage. The estimated rms errorsat these stations between computed and observed waveheights are 1.4, 1.3, and 0.7 m, respectively. Figure 10shows distributions of significant wave height (con-
1694 VOLUME 33J O U R N A L O F P H Y S I C A L O C E A N O G R A P H Y
AUGUST 2003 1695M O O N E T A L .
→
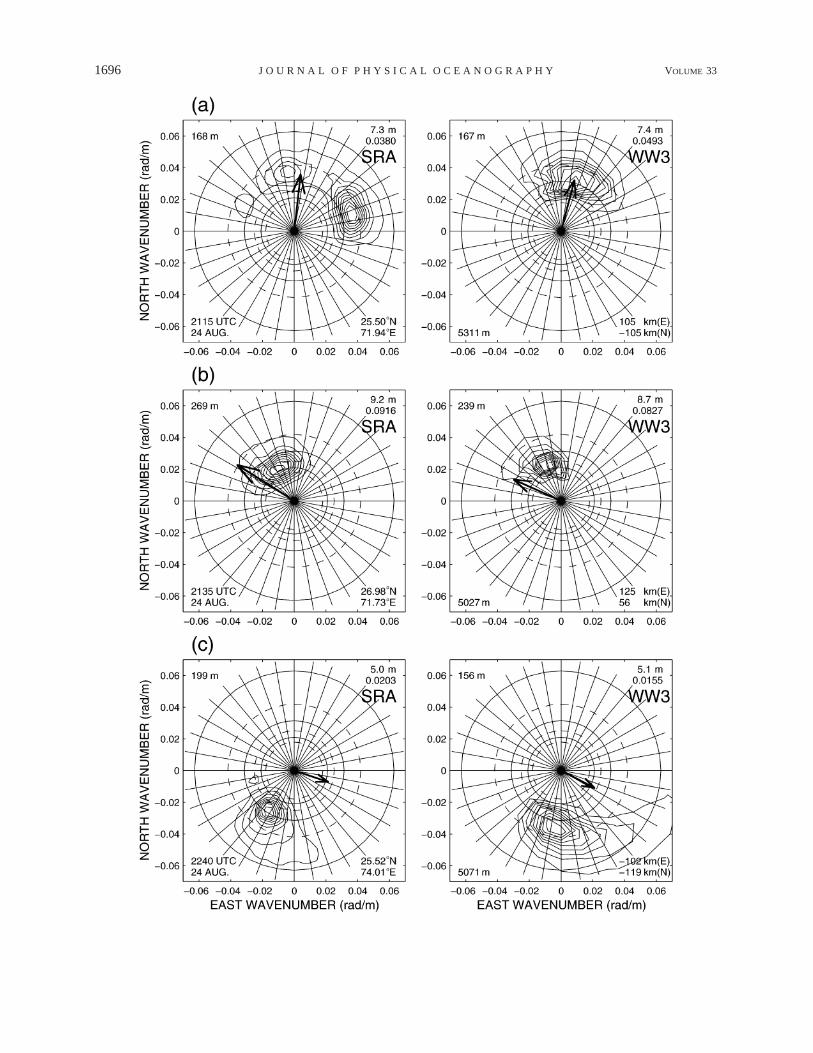
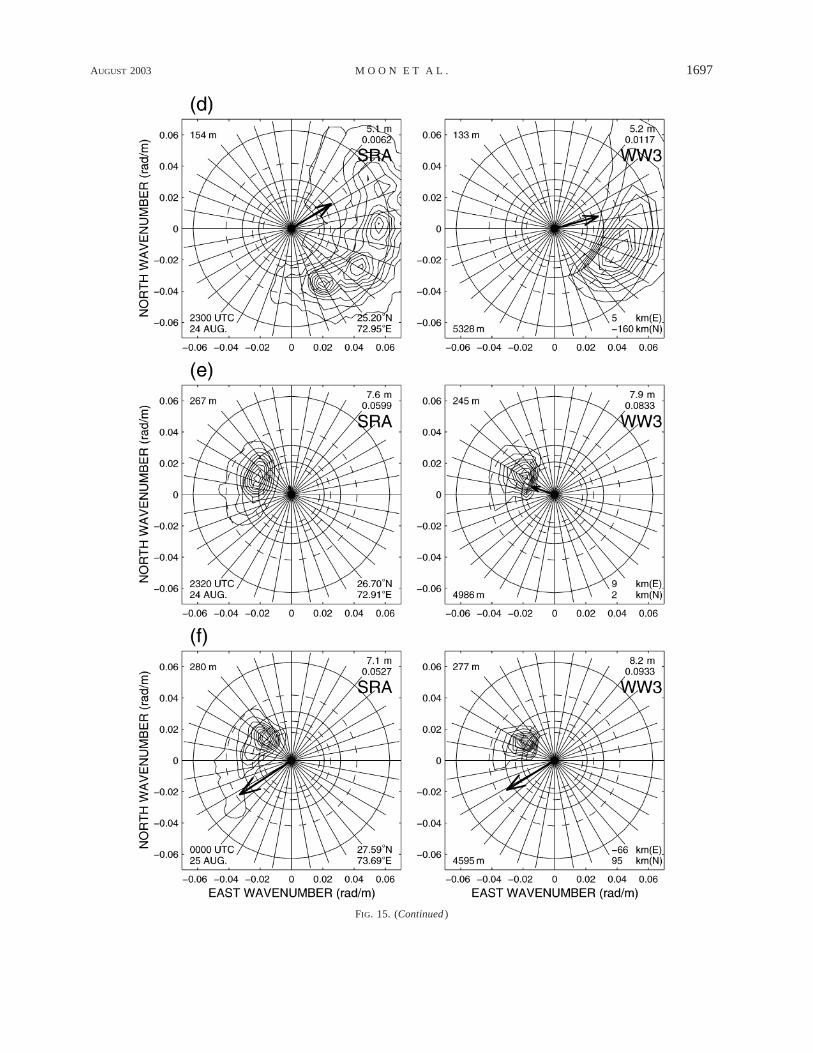
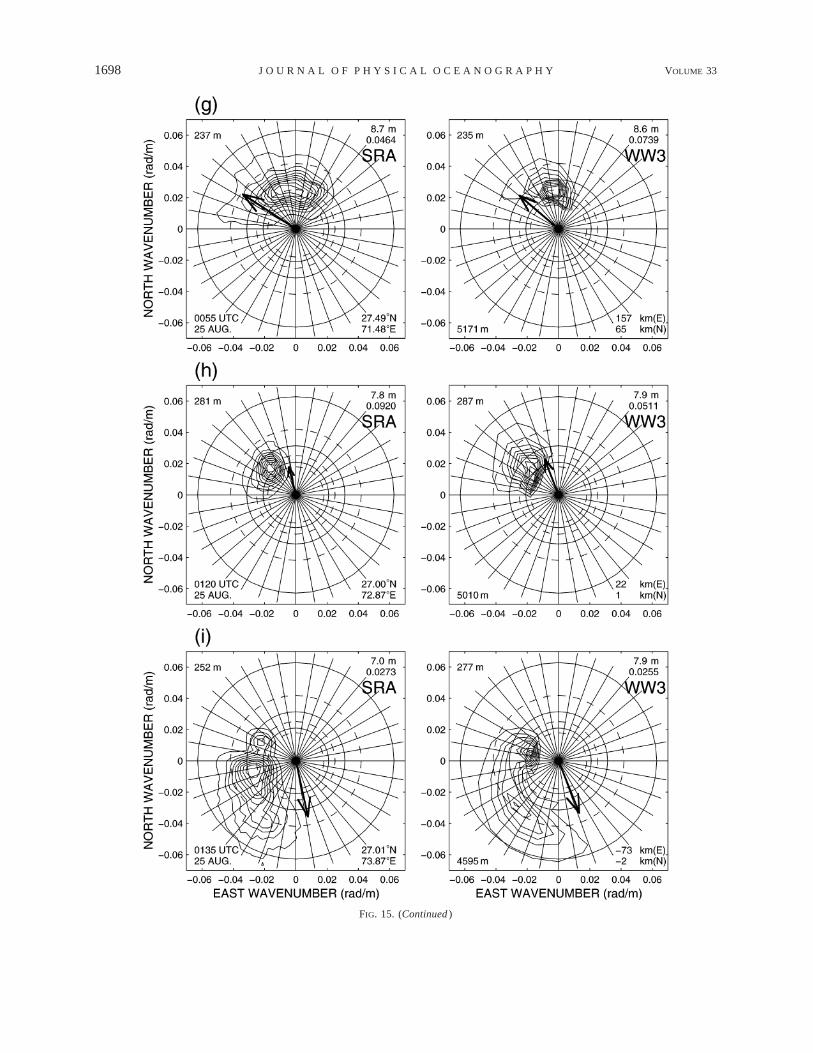
FIG. 15. (left) SRA directional wave spectra and (right) WW3 spectra in the open water on 24 Aug 1998. The dashed circles (outer toinner) correspond to wavelengths of 150, 250, and 350 m. The solid circles indicate wavelengths of 100, 200, and 300 m. Each spectrumcontains nine contours, linearly spaced from 10% to 90% of the peak spectral density. The significant wave height and the peak spectraldensity (m4 rad22) are shown in the upper-right corner of the SRA and the WW3 spectrum. The thick arrows extend in the downwinddirection with their length proportional to the (left) HRD surface wind vectors and (right) the model input wind vectors at each point. Awind speed of 30 m s21 corresponds to a length of 0.03 rad m21. The location north and east of the eye is indicated in the lower-right cornerof each WW3 spectrum. The observed and simulated peak wavelengths are in the upper-left corner of the SRA and WW3 spectrum, respectively.Observation time and location are shown in the lower-left and lower-right corner of the SRA spectrum, respectively. Depth of the SRAstations is in the lower-left corner of the WW3 spectrum.
←
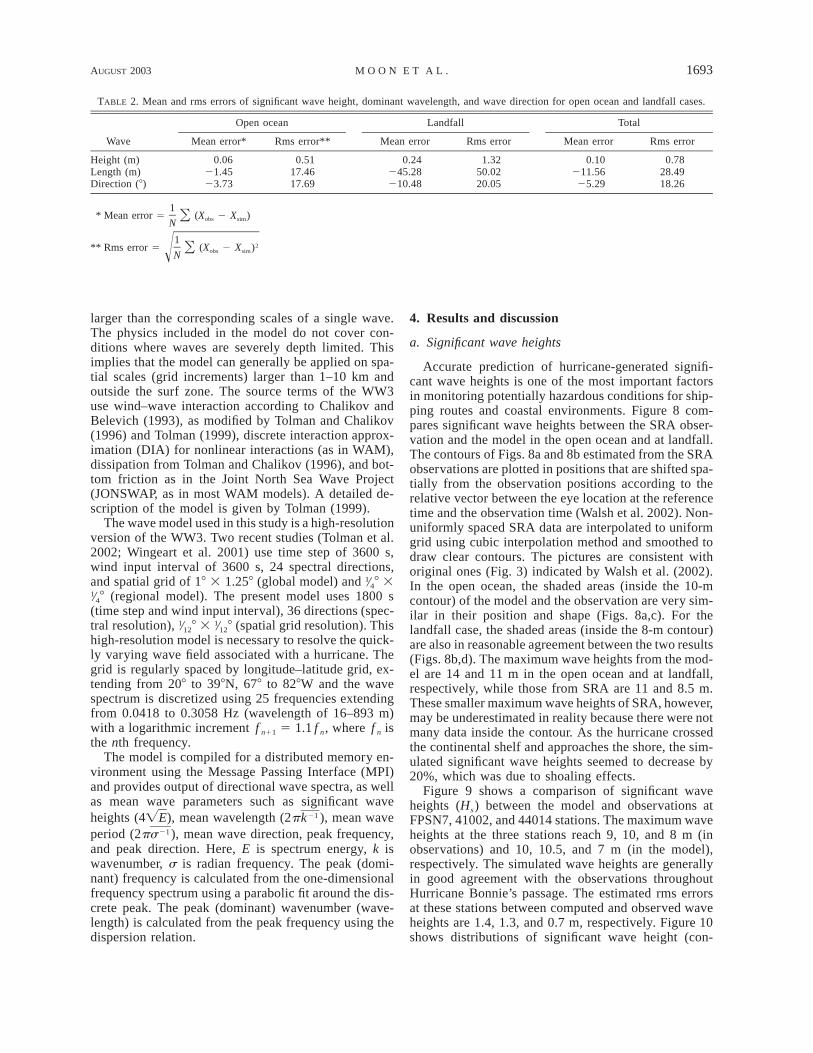
FIG. 14. Topography of study areas and measurement points in the (a) open water on 24 Aug 1998 and (b) at landfall on 26 Aug 1998.Small circles represent all SRA measurement points. Filled circles represent the selected points to compare SRA directional spectra withmodel spectra. Large circles are radii of maximum wind speed during observation.
tours), dominant wave direction (arrows), and dominantwavelength (proportional to the arrow length) on 24,25, 26, and 27 August simulated by the present model.The significant wave height reaches 14 m in the openocean (Fig. 10c) and it is reduced gradually as the hur-ricane approaches the shore (Fig. 10d). The maximumwave heights appear in the right forward quadrant of ahurricane center and propagate in the same direction asthe hurricane. Comparing Fig. 10b and Fig. 10c, themaximum wave height on 26 August is higher than thaton 25 August, even though the observed maximum windspeeds during the two days are the same (Table 1).
Figure 11 is swath pictures of wind, significant waveheight, and dominant wavelength, which show the max-imum values throughout the hurricane passage. Thehigher/longer waves appear to the right of the hurricanealong its track. However, the maximum height of 14 mappears from 0600 UTC 25 August, even though themaximum winds are almost the same between 0600UTC 23 August and 1800 UTC 26 August (Table 1).This appears to be due to the increase of hurricane trans-lation speed from 2 to 8 m s21 between 24 and 26 August(Fig. 3). The effect of the hurricane translation speedon the wave fields will be discussed in section 4e indetail.
b. Cross section of dominant wave fields
From the data of SRA directional wave spectrum,Wright et al. (2001) determined primary, secondary, ortertiary wave fields. Figure 12 shows their results of theprimary (dominant) wave fields relative to the hurricanecenter along each flight leg that crossed the hurricanein the open ocean and at landfall. In the open ocean,the swell propagating toward the northwest with 280–315-m wavelength and 9–11-m heights is dominant inthe right quadrant of the hurricane. The direction of theswell is roughly aligned with that of the translation ofHurricane Bonnie. This seems to be the result of in-creased fetch and duration of the wave growth processin the direction of the motion of the storm (MacAfee
and Bowyer 2000a,b). For the landfall case, the north-west swell is also dominant in the right quadrant of thehurricane, but has smaller wavelength (about 200 m)and height (7–9 m) than in the open ocean, probablydue to bathymetric influence.
In Fig. 13, we now compare the simulated significantwave heights, dominant wavelength, and dominant wavedirection with the SRA observations along each flightleg in Fig. 12. The general spatial distribution in theSRA measurements and the model simulations showexcellent agreement. Mean and rms errors between theSRA and the model (Table 2), which are obtained alongthe sections across the hurricane, show that the modelsimulates significant wave heights, dominant wave-length, and wave direction quite well in the open oceanwith rms errors of 0.5 m, 17 m, and 178, respectively.For the landfall case, however, the simulated dominantwavelength displays noticeable overestimation, 245-mmean error, probably due to the model’s limitations tohandle wave shoaling over shallow areas.
c. Spatial variation of directional wave spectra
In order to evaluate the model’s performance, detailedspectral observation data in all quadrants of a hurricaneare necessary because a hurricane produces complex andquickly varying wave spectra in space and time. In thissection, the model spectra obtained at various positionsrelative to Hurricane Bonnie are compared with thoseof the SRA.
The first dataset of the SRA directional wave spec-trum under Hurricane Bonnie was acquired in the openwater on 24 August 1998, when Bonnie was 400 kmeast of Abaco Island, Bahamas. The second dataset wasobtained in the region between Charleston, South Car-olina, and Cape Hatteras, North Carolina, as HurricaneBonnie was making landfall near Wilmington, NorthCarolina, on 26 August 1998. Wright et al. (2001) andWalsh et al. (2002) documented 142 spectra obtainedfrom these measurements. In this study, eighteen spectraamong those were selected to be compared with the
1696 VOLUME 33J O U R N A L O F P H Y S I C A L O C E A N O G R A P H Y
AUGUST 2003 1697M O O N E T A L .
FIG. 15. (Continued )
1698 VOLUME 33J O U R N A L O F P H Y S I C A L O C E A N O G R A P H Y
FIG. 15. (Continued )
AUGUST 2003 1699M O O N E T A L .
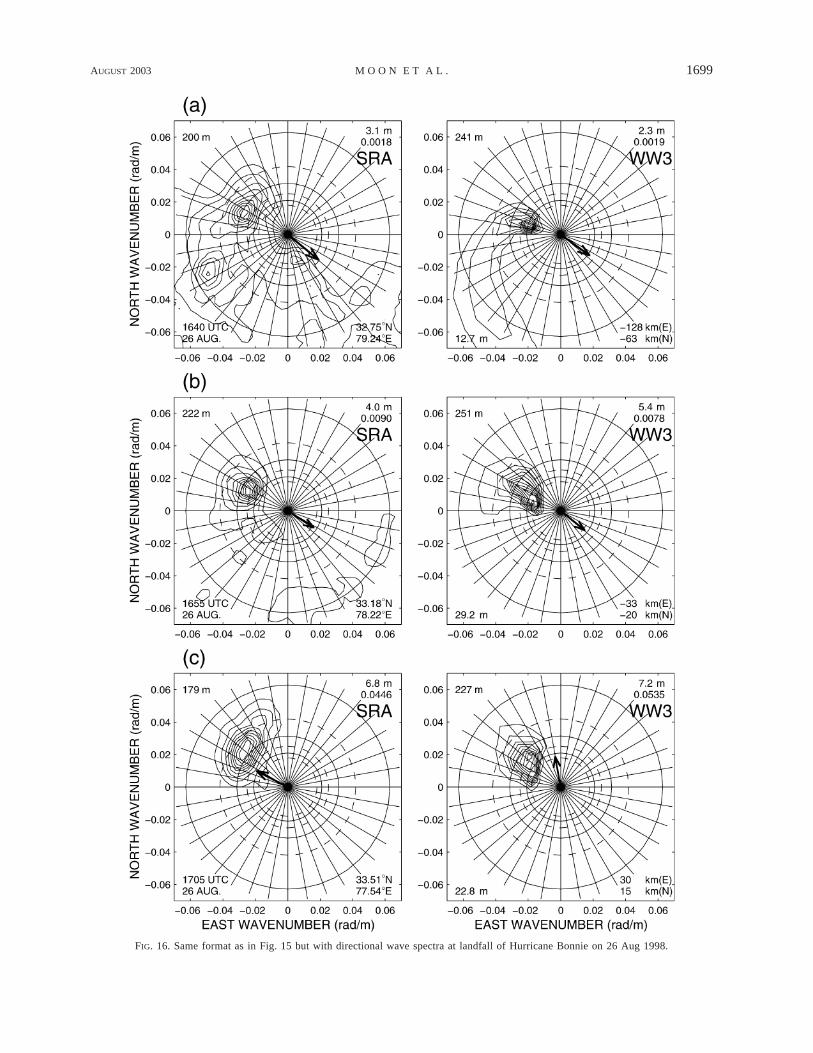
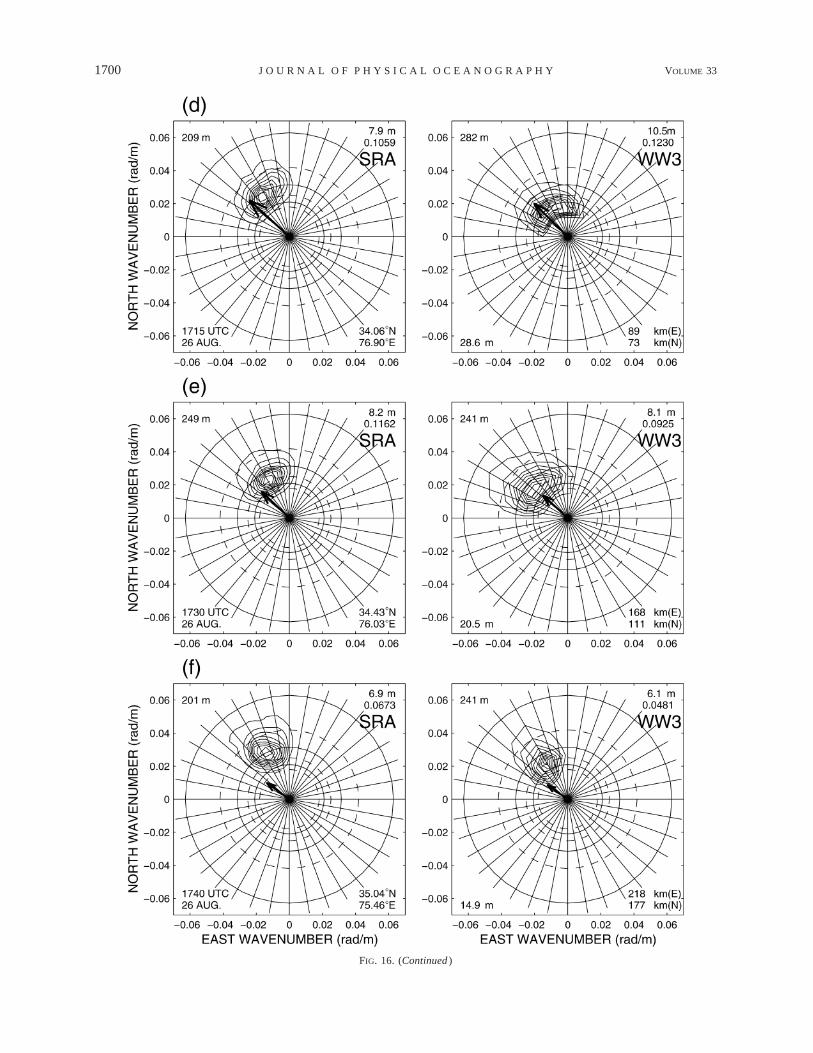
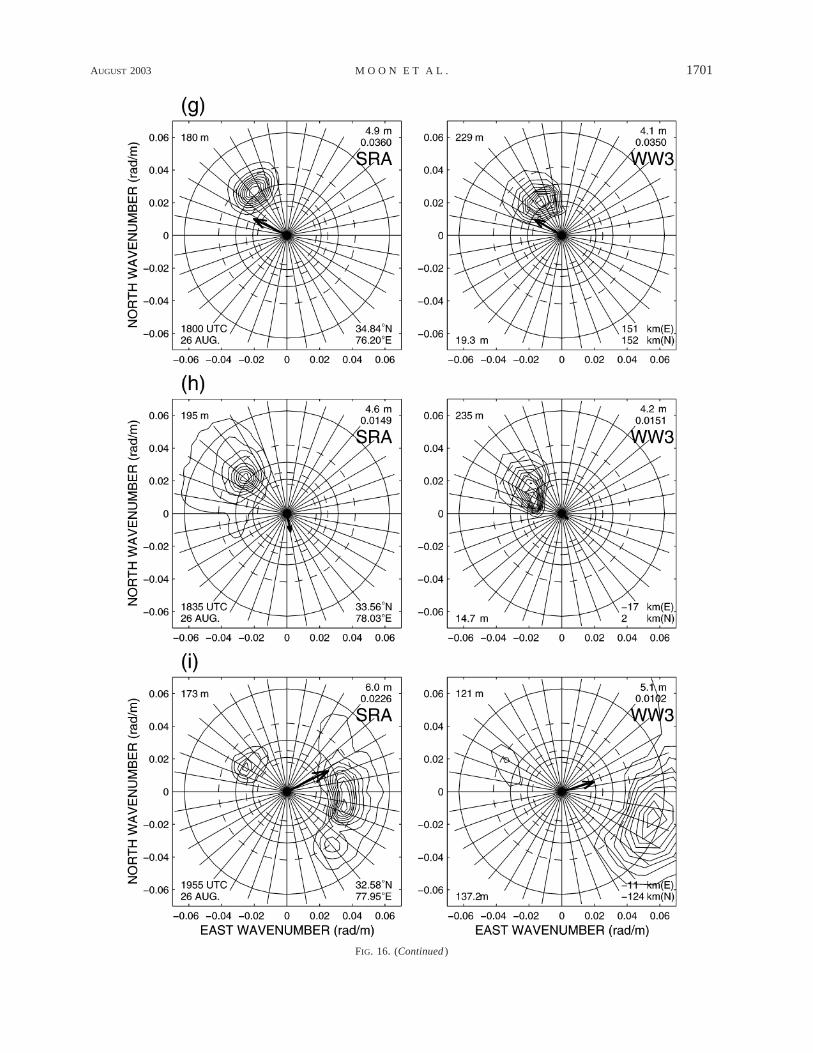
FIG. 16. Same format as in Fig. 15 but with directional wave spectra at landfall of Hurricane Bonnie on 26 Aug 1998.
1700 VOLUME 33J O U R N A L O F P H Y S I C A L O C E A N O G R A P H Y
FIG. 16. (Continued )
AUGUST 2003 1701M O O N E T A L .
FIG. 16. (Continued )
1702 VOLUME 33J O U R N A L O F P H Y S I C A L O C E A N O G R A P H Y
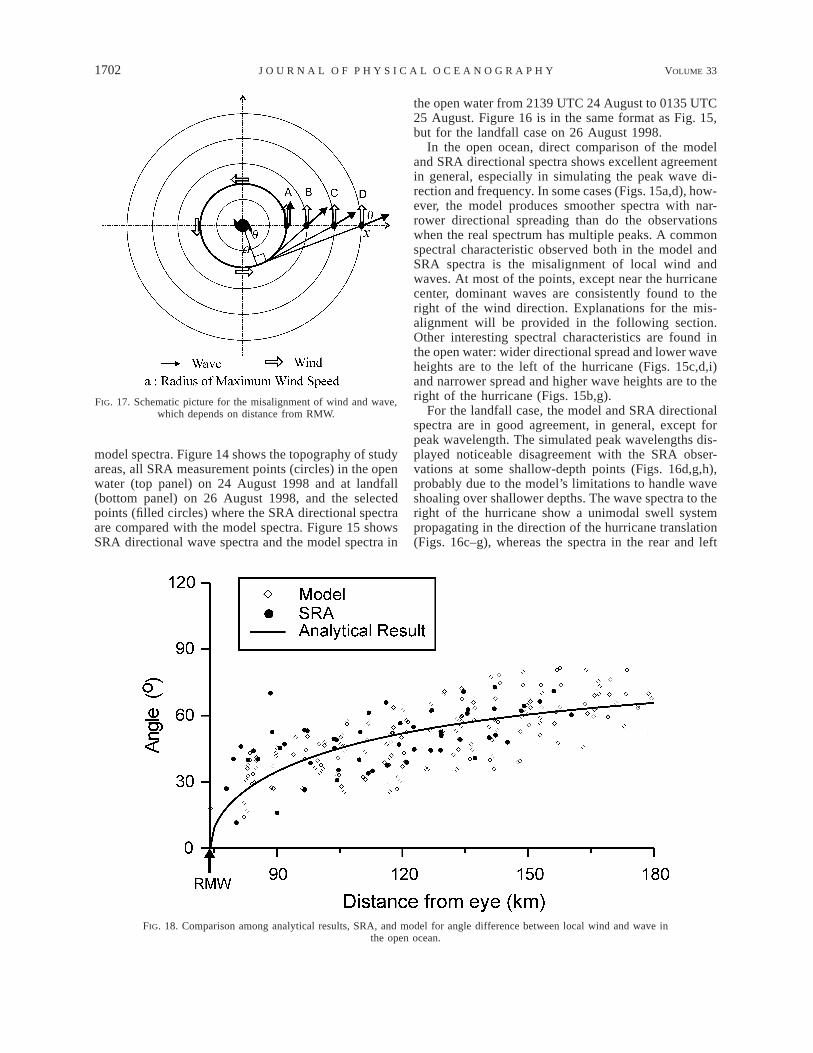
FIG. 17. Schematic picture for the misalignment of wind and wave,which depends on distance from RMW.
FIG. 18. Comparison among analytical results, SRA, and model for angle difference between local wind and wave inthe open ocean.
model spectra. Figure 14 shows the topography of studyareas, all SRA measurement points (circles) in the openwater (top panel) on 24 August 1998 and at landfall(bottom panel) on 26 August 1998, and the selectedpoints (filled circles) where the SRA directional spectraare compared with the model spectra. Figure 15 showsSRA directional wave spectra and the model spectra in
the open water from 2139 UTC 24 August to 0135 UTC25 August. Figure 16 is in the same format as Fig. 15,but for the landfall case on 26 August 1998.
In the open ocean, direct comparison of the modeland SRA directional spectra shows excellent agreementin general, especially in simulating the peak wave di-rection and frequency. In some cases (Figs. 15a,d), how-ever, the model produces smoother spectra with nar-rower directional spreading than do the observationswhen the real spectrum has multiple peaks. A commonspectral characteristic observed both in the model andSRA spectra is the misalignment of local wind andwaves. At most of the points, except near the hurricanecenter, dominant waves are consistently found to theright of the wind direction. Explanations for the mis-alignment will be provided in the following section.Other interesting spectral characteristics are found inthe open water: wider directional spread and lower waveheights are to the left of the hurricane (Figs. 15c,d,i)and narrower spread and higher wave heights are to theright of the hurricane (Figs. 15b,g).
For the landfall case, the model and SRA directionalspectra are in good agreement, in general, except forpeak wavelength. The simulated peak wavelengths dis-played noticeable disagreement with the SRA obser-vations at some shallow-depth points (Figs. 16d,g,h),probably due to the model’s limitations to handle waveshoaling over shallower depths. The wave spectra to theright of the hurricane show a unimodal swell systempropagating in the direction of the hurricane translation(Figs. 16c–g), whereas the spectra in the rear and left
AUGUST 2003 1703M O O N E T A L .
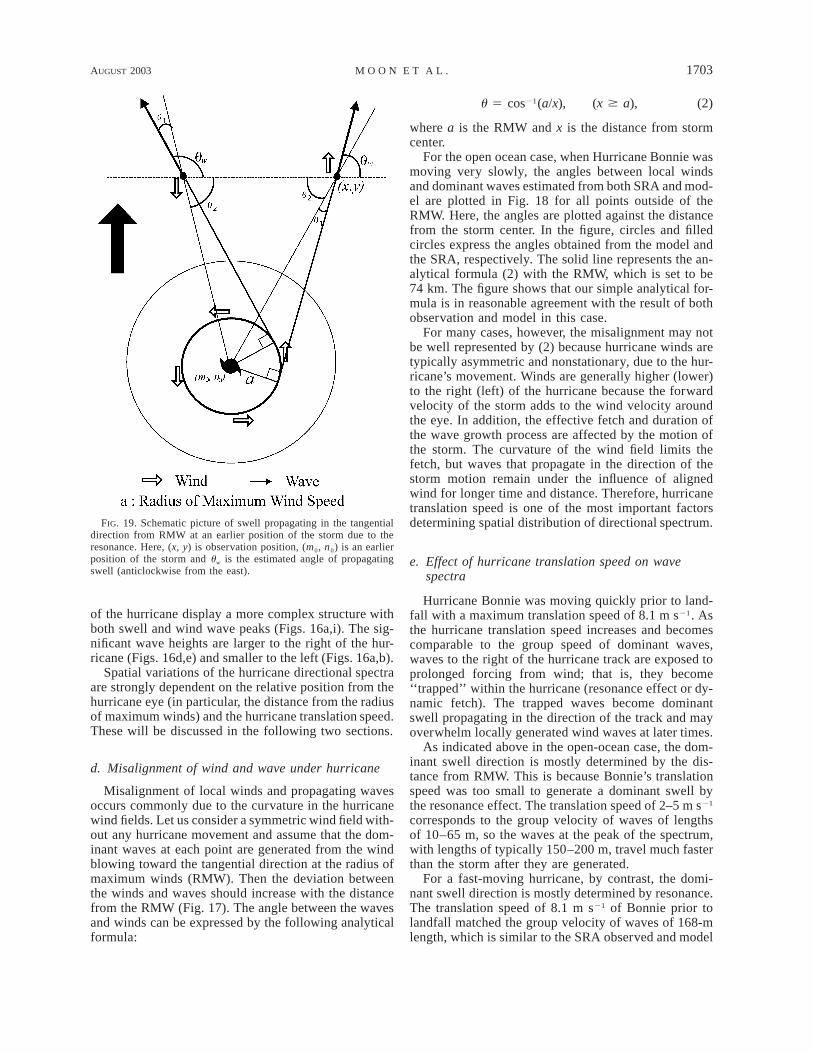
FIG. 19. Schematic picture of swell propagating in the tangentialdirection from RMW at an earlier position of the storm due to theresonance. Here, (x, y) is observation position, (m0, n0) is an earlierposition of the storm and uw is the estimated angle of propagatingswell (anticlockwise from the east).
of the hurricane display a more complex structure withboth swell and wind wave peaks (Figs. 16a,i). The sig-nificant wave heights are larger to the right of the hur-ricane (Figs. 16d,e) and smaller to the left (Figs. 16a,b).
Spatial variations of the hurricane directional spectraare strongly dependent on the relative position from thehurricane eye (in particular, the distance from the radiusof maximum winds) and the hurricane translation speed.These will be discussed in the following two sections.
d. Misalignment of wind and wave under hurricane
Misalignment of local winds and propagating wavesoccurs commonly due to the curvature in the hurricanewind fields. Let us consider a symmetric wind field with-out any hurricane movement and assume that the dom-inant waves at each point are generated from the windblowing toward the tangential direction at the radius ofmaximum winds (RMW). Then the deviation betweenthe winds and waves should increase with the distancefrom the RMW (Fig. 17). The angle between the wavesand winds can be expressed by the following analyticalformula:
21u 5 cos (a/x), (x $ a), (2)
where a is the RMW and x is the distance from stormcenter.
For the open ocean case, when Hurricane Bonnie wasmoving very slowly, the angles between local windsand dominant waves estimated from both SRA and mod-el are plotted in Fig. 18 for all points outside of theRMW. Here, the angles are plotted against the distancefrom the storm center. In the figure, circles and filledcircles express the angles obtained from the model andthe SRA, respectively. The solid line represents the an-alytical formula (2) with the RMW, which is set to be74 km. The figure shows that our simple analytical for-mula is in reasonable agreement with the result of bothobservation and model in this case.
For many cases, however, the misalignment may notbe well represented by (2) because hurricane winds aretypically asymmetric and nonstationary, due to the hur-ricane’s movement. Winds are generally higher (lower)to the right (left) of the hurricane because the forwardvelocity of the storm adds to the wind velocity aroundthe eye. In addition, the effective fetch and duration ofthe wave growth process are affected by the motion ofthe storm. The curvature of the wind field limits thefetch, but waves that propagate in the direction of thestorm motion remain under the influence of alignedwind for longer time and distance. Therefore, hurricanetranslation speed is one of the most important factorsdetermining spatial distribution of directional spectrum.
e. Effect of hurricane translation speed on wavespectra
Hurricane Bonnie was moving quickly prior to land-fall with a maximum translation speed of 8.1 m s21. Asthe hurricane translation speed increases and becomescomparable to the group speed of dominant waves,waves to the right of the hurricane track are exposed toprolonged forcing from wind; that is, they become‘‘trapped’’ within the hurricane (resonance effect or dy-namic fetch). The trapped waves become dominantswell propagating in the direction of the track and mayoverwhelm locally generated wind waves at later times.
As indicated above in the open-ocean case, the dom-inant swell direction is mostly determined by the dis-tance from RMW. This is because Bonnie’s translationspeed was too small to generate a dominant swell bythe resonance effect. The translation speed of 2–5 m s21
corresponds to the group velocity of waves of lengthsof 10–65 m, so the waves at the peak of the spectrum,with lengths of typically 150–200 m, travel much fasterthan the storm after they are generated.
For a fast-moving hurricane, by contrast, the domi-nant swell direction is mostly determined by resonance.The translation speed of 8.1 m s21 of Bonnie prior tolandfall matched the group velocity of waves of 168-mlength, which is similar to the SRA observed and model
1704 VOLUME 33J O U R N A L O F P H Y S I C A L O C E A N O G R A P H Y
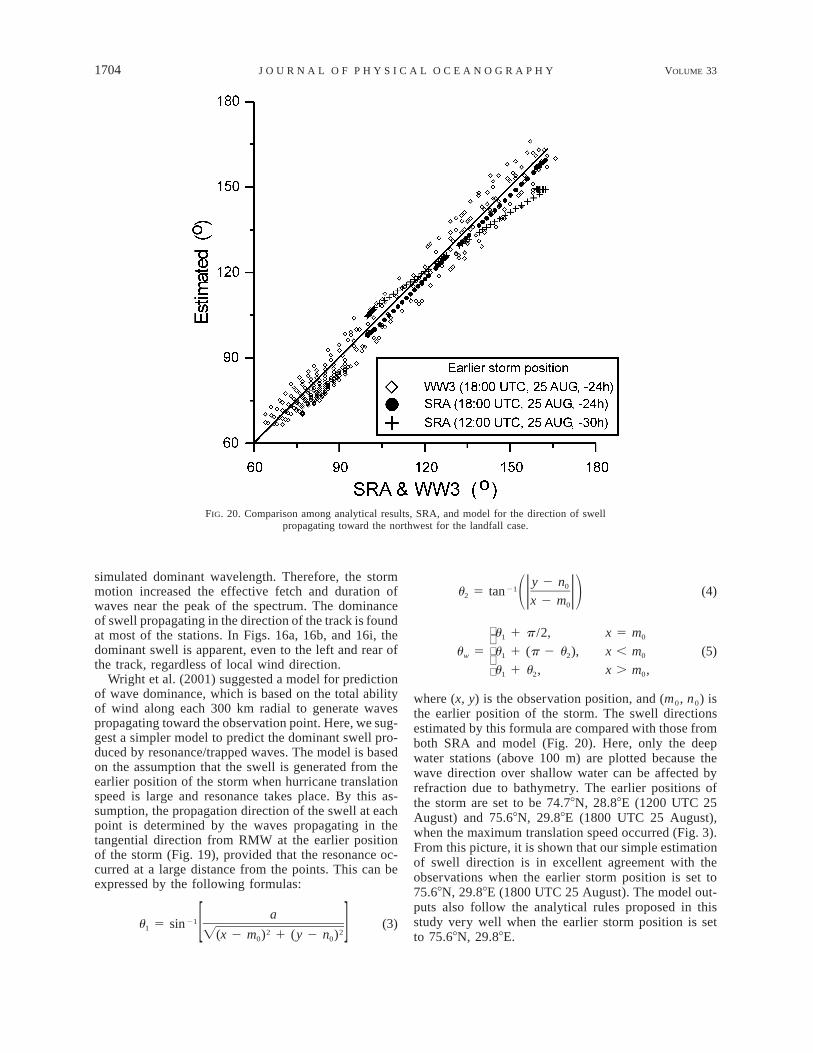
FIG. 20. Comparison among analytical results, SRA, and model for the direction of swellpropagating toward the northwest for the landfall case.
simulated dominant wavelength. Therefore, the stormmotion increased the effective fetch and duration ofwaves near the peak of the spectrum. The dominanceof swell propagating in the direction of the track is foundat most of the stations. In Figs. 16a, 16b, and 16i, thedominant swell is apparent, even to the left and rear ofthe track, regardless of local wind direction.
Wright et al. (2001) suggested a model for predictionof wave dominance, which is based on the total abilityof wind along each 300 km radial to generate wavespropagating toward the observation point. Here, we sug-gest a simpler model to predict the dominant swell pro-duced by resonance/trapped waves. The model is basedon the assumption that the swell is generated from theearlier position of the storm when hurricane translationspeed is large and resonance takes place. By this as-sumption, the propagation direction of the swell at eachpoint is determined by the waves propagating in thetangential direction from RMW at the earlier positionof the storm (Fig. 19), provided that the resonance oc-curred at a large distance from the points. This can beexpressed by the following formulas:
a21u 5 sin (3)1
2 2[ ]Ï(x 2 m ) 1 (y 2 n )0 0
y 2 n021u 5 tan (4)2 ) )1 2x 2 m0
u 1 p /2, x 5 m1 0u 5 u 1 (p 2 u ), x , m (5)w 1 2 0u 1 u , x . m , 1 2 0
where (x, y) is the observation position, and (m0, n0) isthe earlier position of the storm. The swell directionsestimated by this formula are compared with those fromboth SRA and model (Fig. 20). Here, only the deepwater stations (above 100 m) are plotted because thewave direction over shallow water can be affected byrefraction due to bathymetry. The earlier positions ofthe storm are set to be 74.78N, 28.88E (1200 UTC 25August) and 75.68N, 29.88E (1800 UTC 25 August),when the maximum translation speed occurred (Fig. 3).From this picture, it is shown that our simple estimationof swell direction is in excellent agreement with theobservations when the earlier storm position is set to75.68N, 29.88E (1800 UTC 25 August). The model out-puts also follow the analytical rules proposed in thisstudy very well when the earlier storm position is setto 75.68N, 29.88E.
AUGUST 2003 1705M O O N E T A L .
5. Summary and conclusions
Hurricane Bonnie was one of the most powerful hur-ricanes to directly hit the coast of North Carolina duringrecent decades, and its translation speed varied from 2to 8 m s21. In this study, the Hurricane Bonnie direc-tional wave spectra obtained from NASA Scanning Ra-dar Altimeter are compared with ocean wave model re-sults. The wave model, a version of the WAVEWATCHIII, uses a high-resolution grid (1⁄128 3 1⁄128) to simulatethe sea surface spectra of hurricane-generated windwaves. This is the first detailed comparison betweenmodel simulations and observations of the spatial dis-tribution of hurricane directional wave spectra in bothopen ocean and landfall cases.
The modeling results show that, excluding shallowareas near the shore, the model yields an excellent sim-ulation of directional spectrum as well as significantwave height, dominant wavelength, and wave directionunder hurricane wind forcing. The present simulationallows more complete analyses of the hurricane-gen-erated wave field than do observations at limited timeand space.
From the results of observation and numerical mod-eling, we have found that the hurricane-generated wavefield is mostly determined by two factors: the distancefrom the hurricane center or the radius of maximumwind and hurricane translation speed. For the case of ahurricane with low translation speed, the dominant wavedirection is mainly determined by the distance from thehurricane center. For the case of a fast-moving hurri-cane, the dominant waves are mostly determined byresonance. When the group velocity of dominant wavesis close to the hurricane translation speed, their growthmay be significantly enhanced due to the resonance ef-fect, and the swell produced by the resonance dominateswave systems over its propagating areas.
We have suggested simple analytical models for es-timating the swell directions for both slow- and fast-moving storms. The swell directions derived from thesemodels demonstrate excellent agreement with those ofSRA observation and numerical simulation.
The present study clearly demonstrates that using re-alistic wind forcing and a high-resolution WAVE-WATCH III model may yield successful simulations ofsurface wave fields in hurricane conditions.
Acknowledgments. For this research Il-Ju Moon, IsaacGinis, and Tetsu Hara were supported by the NationalScience Foundation through Grant ATM 0001038.
REFERENCES
Avila, L. A., cited 1998: Preliminary report: Hurricane Bonnie 19–30 August 1998. NOAA National Hurricane Center/Tropical Pre-diction Center. [Available online at http://www.nhc.noaa.gov/1998bonnie.html.]
Barber, N. F., and F. Ursell, 1948: The generation and propagation ofocean waves and swell. Philos. Trans. Roy. Soc. London, 240A,527–560.
Bauer, E., S. Hasselmann, K. Hasselmann, and H. C. Graber, 1992:Validation and assimilation of Seaseat altimeter wave heightsusing the WAM wave model. J. Geophys. Res., 97 (C8), 12 671–12 682.
Bender, M. A., and I. Ginis, 2000: Real-case simulations of hurricane–ocean interaction using a high-resolution coupled model: Effectson hurricane intensity. Mon. Wea. Rev., 128, 917–946.
Chalikov, D. V., and M. Yu. Belevich, 1993: One-dimensional theoryof the wave boundary layer. Bound.-Layer Meteor., 63, 65–96.
Dell’Osso, L., L. Bertotti, and L. Cavaleri, 1992: The Gorbush Stormin the Mediterranean Sea: Atmospheric and wave simulation.Mon. Wea. Rev., 120, 77–90.
Holt, B., A. K. Lie, D. W. Wang, A. Gnanadesikan, and H. S. Chen,1998: Tracking storm-generated waves in the northeast PacificOcean with ERS-1 synthetic aperture radar imagery and buoys.J. Geophys. Res., 103 (C4), 7917–7929.
Komen, G. J., L. Cavaleri, M. Donelan, K. Hasselmann, S. Hassel-mann, and P. A. E. M. Janssen, 1994: Dynamics and Modelingof Ocean Waves. Cambridge University Press, 520 pp.
MacAfee, A. W., and P. J. Bowyer, 2000a: Trapped-fetch waves in atransitioning tropical cyclone (Part I: The need and the theory).Preprints, 24th Conf. on Hurricanes and Tropical Meteorology,Fort Lauderdale, FL, Amer. Meteor. Soc., 292–293.
——, and ——, 2000b: Trapped-fetch waves in a transitioning trop-ical cyclone (Part II: Analytical and predictive model). 24thConf. on Hurricanes and Tropical Meteorology, Fort Lauderdale,FL, Amer. Meteor. Soc., 165–166.
Monaldo, F. M., and R. C. Beal, 1998: Comparison of SIR-C SARwavenumber spectra with WAM model predictions. J. Geophys.Res., 103 (C9), 18 815–18 825.
Powell, M. D., S. H. Houston, and T. Reinhold, 1996: HurricaneAndrew’s landfall in south Florida. Part I: Standardizing mea-surements for documentation of surface wind fields. Wea. Fore-casting, 11, 304–328.
Prasadkumar, B., R. Kalra, S. K. Dube, P. C. Sinha, A. D. Rao, R.Kumar, and A. Sarkar, 2000: Extreme wave conditions over theBay of Bengal during severe cyclone—Simulation experimentwith two spectral wave models. Mar. Geod., 23, 91–102.
Shearman, R. J., and A. A. Zelenko, 1989: Wind measurements re-duction to a standard level. Marine Meteorology and RelatedOceanography Activities Rep. 22, WMO/TD 311, 30 pp.
Tolman, H. L., 1989: The numerical model WAVEWATCH: A thirdgeneration model for the hindcasting of wind waves on tides inshelf seas. Communications on Hydraulic and Geotechnical En-gineering Rep. 89-2, Delft University of Technology, 72 pp.
——, 1991: A third-generation model for wind waves on slowlyvarying, unsteady, and inhomogeneous depths and currents. J.Phys. Oceanogr., 21, 782–797.
——, 1992: Effects of numerics on the physics in a third-generationwind-wave model. J. Phys. Oceanogr., 22, 1095–1111.
——, 1998: Validation of a new global wave forecast system at NCEP.Ocean Wave Measurements and Analysis, B. L. Edge and J. M.Helmsley, Eds., ASCE, 777–786.
——, 1999: User manual and system documentation of WAVE-WATCH-III version 1.18. Tech. Note 166, Ocean ModelingBranch, NCEP, National Weather Service, NOAA, U.S. De-partment of Commerce, 110 pp. [Available online at http://polar.wwb.noaa.gov/waves/wavewatch.]
——, 2002: Validation of WAVEWATCH III version 1.15 for a globaldomain. NOAA/NWS/NCEP/OMB Tech. Note 213, 33 pp. [Avail-able online at http://polar.ncep.noaa.gov/waves/references.html.]
——, and D. Chalikov, 1996: Source terms in a third-generation windwave model. J. Phys. Oceanogr., 26, 2497–2518.
——, B. Balasubramaniyan, L. D. Burroughs, D. Chalikov, Y. Y.Chao, H. S. Chen, and V. M. Gerald, 2002: Development andimplementation of wind-generated ocean surface wave modelsat NCEP. Wea. Forecasting, 17, 311–333.
Walsh, E. J., D. W. Hancock, D. E. Hines, R. N. Swift, and J. F. Scott,1985: Directional wave spectra measured with the surface con-tour radar. J. Phys. Oceanogr., 15, 566–592.

1706 VOLUME 33J O U R N A L O F P H Y S I C A L O C E A N O G R A P H Y
——, and Coauthors, 2002: Hurricane directional wave spectrum spa-tial variation at landfall. J. Phys. Oceanogr., 32, 1667–1684.
WAMDI group, 1988: The WAM model—A third generation oceanwave prediction model. J. Phys. Oceanogr., 18, 1775–1810.
Wingeart, K. M., W. C. O’Reilly, T. H. C. Herbers, P. A. Wittmann,R. E. Jenssen, and H. L. Tolman, 2001: Validation of operationalglobal wave prediction models with spectral buoy data. Ocean
Wave Measurement and Analysis, B. L. Edge and J. M. Hemsley,Eds., ASCE, 590–599.
Wright, C. W., and Coauthors, 2001: Hurricane directional wave spec-trum spatial variation in the open ocean. J. Phys. Oceanogr., 31,2472–2488.
Wyatt, L. R., 1995: The effect of fetch on the directional spectrumof Celtic Sea storm waves. J. Phys. Oceanogr., 25, 1550–1559.