numerical simulation of an open sorption thermal energy
TRANSCRIPT

Instructions for use
Title Numerical simulation of an open sorption thermal energy storage system using composite sorbents built into ahoneycomb structure
Author(s) Liu, Hongzhi; Nagano, Katsunori
Citation International Journal of Heat and Mass Transfer, 78, 648-661https://doi.org/10.1016/j.ijheatmasstransfer.2014.07.034
Issue Date 2014-11
Doc URL http://hdl.handle.net/2115/57488
Type article (author version)
File Information Numerical simulation of an open sorption thermal.pdf
Hokkaido University Collection of Scholarly and Academic Papers : HUSCAP

International Journal of Heat and Mass Transfer
1
Numerical simulation of an open sorption thermal energy storage system using
composite sorbents built into a honeycomb structure
Hongzhi Liu*, Katsunori Nagano
Environmental System Research Laboratory, Hokkaido University, N13-W8 Sapporo 060-
8628, Japan
Abstract
A new composite mesoporous honeycomb material was developed to be a thermal energy
storage medium that can contact the functional fluid directly. In our previous study, this
honeycombed composite material acted as a promising sorption thermal energy storage
medium in an open system, exhibiting a lower regeneration temperature as 80°C, high
volumetric heat storage density, and high stability. In the present study, a one-dimensional
transient model was used to predict both the heat storage process (desorption process) and
heat release process (sorption process) occurring in the open sorption thermal energy storage
unit. Our model was validated using the experimental results obtained in our previous
experiments, and a close agreement was observed for the sorption process. Some discrepancy
was observed in the desorption process, but it has been explained. The sorption and
desorption processes were simulated repeatedly for 20 cycles, whose result was also
compared with the experimental result. The operating parameters of the open thermal energy
storage system were evaluated to determine its operation performance. Finally, our open
thermal energy storage system was assumed to be incorporated into a paint-drying system,
within which the heat storage unit is regenerated for ten hours by the exhaust heat produced
by a blower in the daytime and releases its stored heat during the nighttime for 14 hours. The
simulation result shows that almost 51.3% of the blower’s waste heat can be reutilized if the
proposed thermal energy storage system is incorporated.

International Journal of Heat and Mass Transfer
2
Keywords: Composite mesoporous material; Open sorption thermal energy storage; Heat and
mass transfer; Linear driving force model (LDF)
International Journal of Heat and Mass Transfer
3
1. Introduction
Thermal energy storage technology has the potential to meet society’s need for more
efficient, environmentally friendly energy use in a variety of sectors, and it appears to be the
only viable solution to overcome the mismatch between the supply and demand of thermal
energy [1]. Effective storage of thermal energy could reduce both fossil energy demand and
carbon dioxide emissions. A composite thermal energy storage material with low heat loss
and high heat storage density for the storage of low-temperature industrial waste heat (80°C)
was developed in our previous work [2]. The composite material based on a natural
mesoporous stone (Wakkanai siliceous shale (WSS)), whose main composition is SiO2, was
built into a honeycomb shape, and it was installed in an open sorption thermal energy storage
system, with which it can be regenerated by hot air at 80-120°C. Compared to the traditional
sensible heat storage and latent heat storage materials, the developed composite material
exhibits low heat loss as it can be stored at ambient temperatures as long as it is separated
with the functional gas (water vapor) [3]. Another advantage of this material would be the
low cost, due to the low price of natural mudstone WSS and cheap CaCl2. Furthermore, from
the viewpoint of thermal energy storage density, this material can compete with the
traditional sensible heat storage and phase change materials from Fig.16 in [2].
So far, there are few research studies about open sorption thermal energy storage system.
Wu and Zhu and Wu et al. [4, 5] developed an open-type thermal energy storage setup with
40 kg composite sorbent pellets (silica gel filled with CaCl2). Moreover, they also reported a
three-dimensional numerical model [6] to determine the dynamic characteristics of composite
sorbents and to calculate the specific capacity and coefficient of performance (COP) of the
open system. According to their results, the developed system showed high thermal energy
storage density and can be regenerated at low temperature (<100ºC). Ostrovskii et al. [7, 8]
have proposed a non-stationary model to describe water sorption in a flow adsorber with a

International Journal of Heat and Mass Transfer
4
fixed bed of selective water sorbents (SWSs) (calcium chloride in a porous matrix) at
pressures of 7 atm and 1 atm, respectively. An analytical expression for the sorption rate
constant as a function of the moisture content of the sorbent is proposed that takes into
account the monotonic decrease in this constant with an increase in the amount of water
sorbed. Unfortunately, both of the two open systems described above keep the functional
fluid flow through the inter particles of their composite materials without an individual flow
passage for fluid, which would cause a high pressure drop. Moreover, a heat exchanger is
needed to improve the heat exchange between the air and the composite material [4].
In fact, the heat and mass transfer between the flowing air and the composite material
occurring in this open system is very similar with the heat and mass transport which happens
in solid desiccant systems. Many researchers have simulated heat and moisture transfer in
solid desiccant systems, in which the coupled heat and moisture transfer is of great
importance to the system performance [9]. Among these models, Charoensupaya et al. [10]
proposed a one-dimensional heat and mass transfer model to analyze an open-cycle desiccant
cooling system based on a hypothetical isotherm equation. Then a one-dimensional transient
model has been established by Zheng et al. [11, 12], with which the optimum rotational speed
for air dehumidification was determined. Zhang et al. [13] also proposed a one-dimensional
theoretical model based on the size and structure of the channel in their desiccant wheel for
wheel design optimization. However, the actual transfer process occurring in the desiccant
wheel cannot be reflected by these models, as the solid side resistance (heat conduction and
mass diffusion within solid side) were ignored. Realizing the above problem, many
researchers have developed models by taking both gas and solid side resistances into account,
including Majumdar [14], Ge et.al [15], Gao et al. [16], Zhang and Niu [9, 17], Yamaguchi et
al. [18] etc. By considering both the gas and solid side resistance, the precisions of simulation
models can be greatly improved [15].

International Journal of Heat and Mass Transfer
5
Compared to the common solid desiccant system, the operating relative humidity range of
our system is much larger (2%-95%) during the sorption process. In this case, the formation
of crystalline hydrate needs to be considered. Compared to the traditional solid desiccant
materials, the presence of hydrates or salt solution in the matrix’s pores, however, can
significantly change the sorbent capacity and also induce qualitatively new phenomena [8],
which increases the difficulty of simulating the sorption and desorption processes of
composite materials. In order to increase the precision of simulation results, Ge et al. [15]
used a one-dimensional model to predict the performance of silica gel haloid compound
desiccant wheel by considering both the gas and solid side resistances. For the solid side
resistance, both pore diffusion and surface diffusion have been considered.
The objective of our current research is to simulate the processes of sorption (heat release)
and desorption (heat storage) within this thermal energy storage unit quickly and accurately
by numerical simulation. Such a simulation can be used to predict the temperature
distribution of the thermal energy storage unit and the flowing air, quickly evaluate the
performance of the thermal energy storage system, and optimize the air conditions for
practical applications. Moreover, the air condition and the necessary volume of this
composite thermal energy storage unit are expected to be designed and calculated by this
model according to the requirement of a certain application.

International Journal of Heat and Mass Transfer
6
Nomenclature
Abbreviation
COP coefficient of performance;
LDF linear driving force model;
SWSs selective water sorbents;
WSS Wakkanai siliceous shale;
Symbols
Bih heat transfer Biot number (−);
Bim mass transfer Biot number (−);
Cp specific heat (J/ (kg∙K));
da Hydraulic diameter of the air channel (m);
Dm molecular diffusion coefficient (m2/s);
DK Knudsen diffusion coefficient (m2/s);
DP overall pore diffusivity (m2/s);
Ds coefficient of surface diffusion (m2/s);
Ds,0 constant for surface diffusivity calculation (m2/s);
Deff Apparent pore diffusion coefficient based on gas side (m2/s);
fa air flow rate (m3/h);
f air flow rate, fa /3600 (m3/s);
h heat transfer coefficient (W/(m2∙K));
hm convective mass transfer coefficient (m/s);
ka air side mass transfer coefficient based on solid side (m/s);
ks solid side mass transfer coefficient (m/s);
K overall mass transfer coefficient (m/s);
L length of the unit (m);
International Journal of Heat and Mass Transfer
7
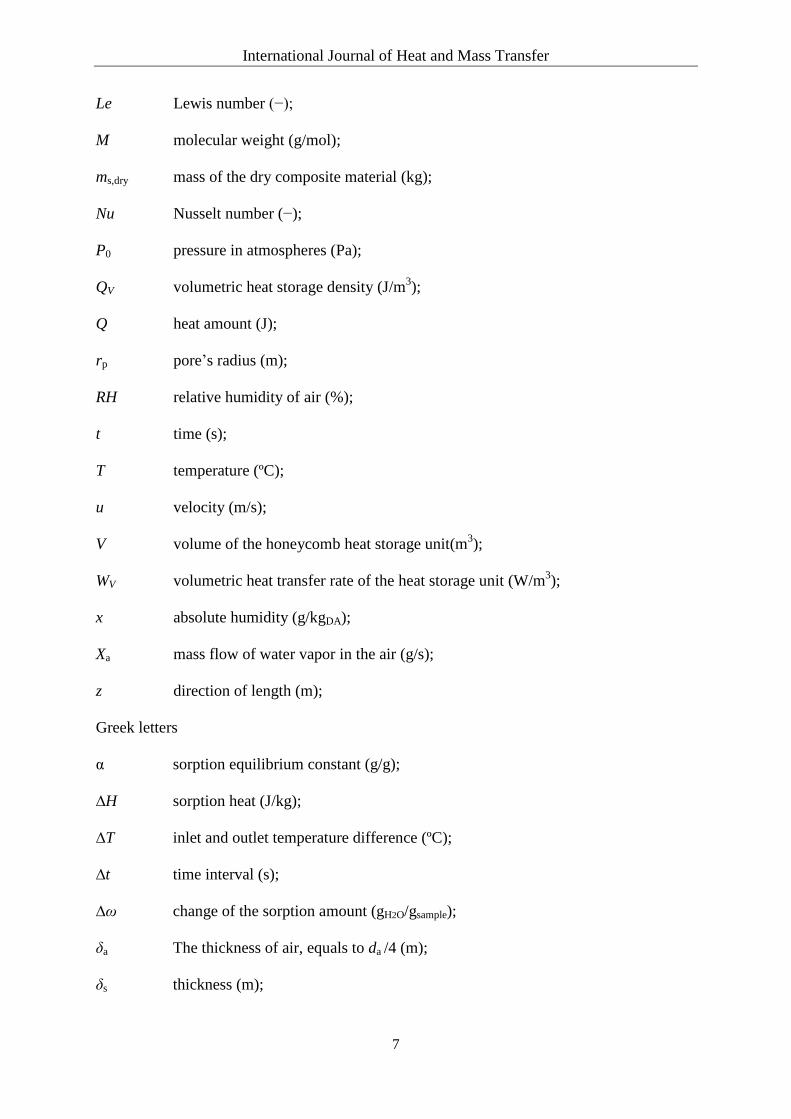
Le Lewis number (−);
M molecular weight (g/mol);
ms,dry mass of the dry composite material (kg);
Nu Nusselt number (−);
P0 pressure in atmospheres (Pa);
QV volumetric heat storage density (J/m3);
Q heat amount (J);
rp pore’s radius (m);
RH relative humidity of air (%);
t time (s);
T temperature (ºC);
u velocity (m/s);
V volume of the honeycomb heat storage unit(m3);
WV volumetric heat transfer rate of the heat storage unit (W/m3);
x absolute humidity (g/kgDA);
Xa mass flow of water vapor in the air (g/s);
z direction of length (m);
Greek letters
α sorption equilibrium constant (g/g);
∆H sorption heat (J/kg);
∆T inlet and outlet temperature difference (ºC);
∆t time interval (s);
∆ω change of the sorption amount (gH2O/gsample);
δa The thickness of air, equals to da /4 (m);
δs thickness (m);

International Journal of Heat and Mass Transfer
8
ε coefficient of heat extraction performance during the heat release process (−);
εs Porosity of the composite porous material (−);
η heat recovery rate (−);
λ effective thermal conductivity (W/(m∙K));
ρ bulk density (kg/m3);
τp tortuosity of real pores (−);
τs tortuosity factor for surface diffusion (−);
ω sorption amount (gH2O/gsample);
ωs sorption amount on the gas and solid surface (gH2O/gsample);
Subscripts
a air;
CaCl2 calcium chloride;
desor desorption process;
dry dry state of composite material;
e equilibrium state;
eff effective;
H2O water or water vapor;
max maximum;
in inlet;
out outlet;
s solid material;
sor sorption process;
0 initial condition;
International Journal of Heat and Mass Transfer
9
2. Mathematical model
For a thermal energy storage system, heat storage process and heat release process are
included. An open sorption thermal energy storage experimental setup was built as described
in our previous study [2]. In the heat storage (heat charging or endothermic) process, hot air
is used to regenerate the material, during which the water vapor bonded to the material is
discharged to the ambient environment and the heat is stored. In the heat release (heat
discharging or exothermic) mode, high-humidity air flows through the system to recover the
exothermic heat due to the sorption of the water vapor. A composite mesoporous honeycomb
thermal energy storage unit was the key component in that open sorption thermal energy
storage system operated under atmospheric pressure of 1 atm. The honeycomb structure can
assure high heat and mass transfer contact area with a low pressure drop. The pressure drop is
less than 15 Pa at a flow rate of 10 m3/h when the dimension of the unit is 10 cm × 10 cm ×
10 cm. The thermal energy storage unit was made by impregnating calcium chloride (CaCl2)
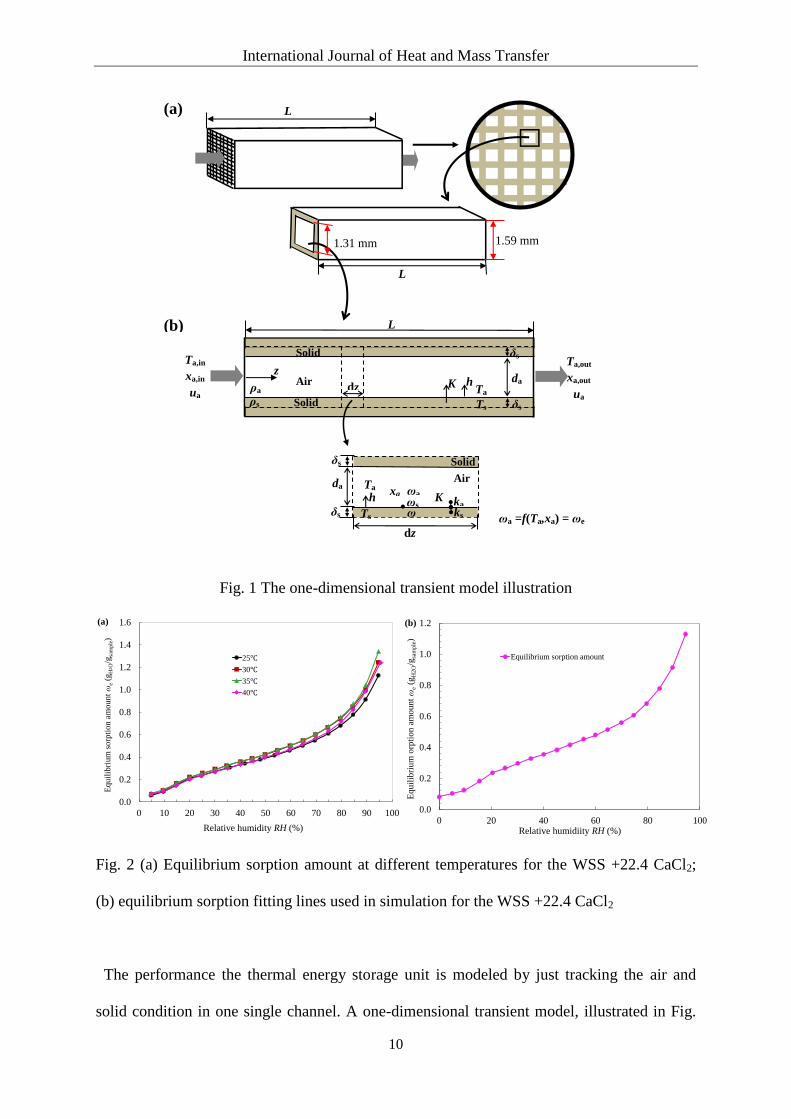
into the mesopores of WSS honeycomb unit. The schematic of the honeycomb structure and a
cross section of one channel used in the model are shown in Fig. 1(a), in which the length is
illustrated as L and size of each channel can also be checked. Three samples with different
CaCl2 contents were made, and were short for WSS + 2.2 wt % CaCl2, WSS + 13.0 wt%
CaCl2, WSS + 22.4 wt% CaCl2, respectively. The physical properties of these composite
mesoporous materials including pore volume distributions, porosity and true density.etc can
be checked in Fig. 2 and Table 1 in reference [2].
International Journal of Heat and Mass Transfer
10
L
L
1.59 mm
L
z Ta,out
xa,out
ua dz
δs
K Ta
Air
Solid
(a)
(b)
Solid δs
h ρa
ρs
da
1.31 mm
Ta,in
xa,in
ua Ts
dz
h
δs
K
Ta
Ts
da
Air
Solid
δs
xa ωa
ω ωs
ωa =f(Ta,xa) = ωe
ka ks
Fig. 1 The one-dimensional transient model illustration
0.0
0.2
0.4
0.6
0.8
1.0
1.2
1.4
1.6
0 10 20 30 40 50 60 70 80 90 100
Eq
uil
ibri
um
so
rpti
on
am
ou
nt ω
e(g
H2O/g
sam
ple)
Relative humidity RH (%)
(a)
25℃
30℃
35℃
40℃
0.0
0.2
0.4
0.6
0.8
1.0
1.2
0 20 40 60 80 100
Equil
ibri
um
orp
tion a
mount ω
e(g
H2
O/g
sam
ple)
Relative humidiity RH (%)
(b)
Equilibrium sorption amount
Fig. 2 (a) Equilibrium sorption amount at different temperatures for the WSS +22.4 CaCl2;
(b) equilibrium sorption fitting lines used in simulation for the WSS +22.4 CaCl2
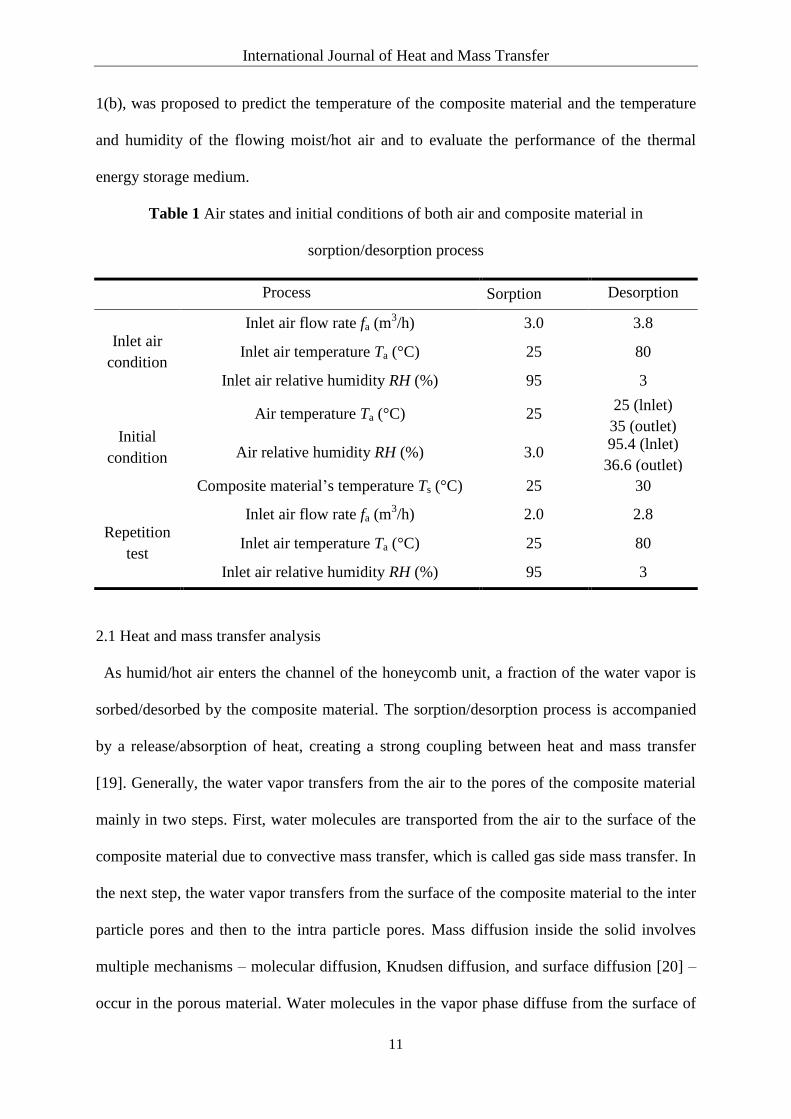
The performance the thermal energy storage unit is modeled by just tracking the air and
solid condition in one single channel. A one-dimensional transient model, illustrated in Fig.
International Journal of Heat and Mass Transfer
11
1(b), was proposed to predict the temperature of the composite material and the temperature
and humidity of the flowing moist/hot air and to evaluate the performance of the thermal
energy storage medium.
Table 1 Air states and initial conditions of both air and composite material in
sorption/desorption process
Process Sorption Desorption
Inlet air
condition
Inlet air flow rate fa (m3/h) 3.0 3.8
Inlet air temperature Ta (°C) 25 80
Inlet air relative humidity RH (%) 95 3
Initial
condition
Air temperature Ta (°C) 25 25 (lnlet)
35 (outlet)
Air relative humidity RH (%) 3.0 95.4 (lnlet)
36.6 (outlet)
Composite material’s temperature Ts (°C) 25 30
Repetition
test
Inlet air flow rate fa (m3/h) 2.0 2.8
Inlet air temperature Ta (°C) 25 80
Inlet air relative humidity RH (%) 95 3
2.1 Heat and mass transfer analysis
As humid/hot air enters the channel of the honeycomb unit, a fraction of the water vapor is
sorbed/desorbed by the composite material. The sorption/desorption process is accompanied
by a release/absorption of heat, creating a strong coupling between heat and mass transfer
[19]. Generally, the water vapor transfers from the air to the pores of the composite material
mainly in two steps. First, water molecules are transported from the air to the surface of the
composite material due to convective mass transfer, which is called gas side mass transfer. In
the next step, the water vapor transfers from the surface of the composite material to the inter
particle pores and then to the intra particle pores. Mass diffusion inside the solid involves
multiple mechanisms – molecular diffusion, Knudsen diffusion, and surface diffusion [20] –
occur in the porous material. Water molecules in the vapor phase diffuse from the surface of

International Journal of Heat and Mass Transfer
12
the composite solid layer to the surface of the particles through molecular and Knudsen
diffusion in the inter-particle pores. The sorbed water molecules then diffuse from the surface
of the particles into the intra-particle pores through surface diffusion, and water vapor
molecules in the intra-particle pores diffuse through molecular and Knudsen diffusion [21].
The mass transfer is also accompanied by heat transfer. Heat transfer between the flowing air
and the channel of the composite material occurs primarily due to the convective heat transfer
along the surface of each channel. The heat transfer inside the solid layer would be the heat
conduction between the solid particles.
2.1.1 Heat transfer Biot number
The heat transfer Biot number Bih is calculated to determine whether thermal conduction on
the solid side is relevant, which is defined as follows:
s
s
ih
hB
(1)
The convective heat transfer coefficient is estimated from the Nusselt number Nu for
developed laminar flow in a square channel, considering constant and uniform temperature at
the interface as 2.89.
a
ah Nud
(2)
The effective thermal conductivity is considered to be related to the amount of water sorbed.
s s,dry H O2 (3)
Thickness of the solid layer δs of 0.14 mm and thermal conductivity of the dry material λs,dry
of 0.2 W/(m∙K) were used for the Biot number Bih calculation. The calculated maximum heat
transfer Biot number Bih for our system is 0.035; therefore, the solid inside heat conduction
resistance can be ignored due to the small heat transfer Biot number (Bih < 0.1).

International Journal of Heat and Mass Transfer
13
2.1.2 Mass transfer Biot number
Similar to the heat transfer Biot number Bih, the mass transfer Biot number Bim is introduced
to determine the dominant mass transfer resistance [22]. Bim represents the relative
importance of the intraparticle diffusion resistance and fluid to particle mass transfer
resistance, which is defined as follows [20]:
s
eff
mim
hB
D
(4)
The solid inside mass transfer resistance can be ignored if the mass transfer Biot number is
small (Bim <0.1), similar to the requirement for ignoring heat conduction for small heat
transfer Biot numbers [21].
The gas side mass transfer coefficient hm is estimated after the calculation of the convective
heat transfer coefficient. When both heat and mass transfer occur simultaneously, the mass
and heat transfer coefficients are related by the Lewis equation [23]:
a ,a
m
p
hh
C Le (5)
The molecular diffusion coefficient Dm is calculated based on the kinetic theory of gases,
and for a water vapor-air mixture, it is given by [14, 17]:
1.6854 s
0
( 273.15)1.758 10m
TD
P
(6)
In the above equation, P0 is the pressure in atmospheres (Pa). The calculated molecular
diffusion coefficient is on an order of 1.0 × 10⁻⁵
m2/s.
Knudsen diffusion DK is significant at low pressure and small pore diameter, and it depends
on the radius of the pore rp and the material’s temperature Ts [24]:
1/2
p s97 (( 273.15) / )KD r T M (7)
The average pore diameter of WSS + 22.4 wt% CaCl2 is about 6 nm. When temperature is
25ºC, the calculated Knudsen diffusion coefficient DK is 1.18 × 10⁻⁶
m2/s.
International Journal of Heat and Mass Transfer
14
The overall pore diffusivity DP inside the solid pores can be obtained from Bosanquit’s
equation [20]:
1/ 1/ 1/P m KD D D (8)
Surface diffusion Ds, the transport of sorbed molecules on the pore surface, can be
expressed as a function of temperature [25]:
3
,0
s
exp( 0.974 10 )273.15
s s
HD D
T
(9)
Ds,0 is a constant for surface diffusion calculation, which has a constant value of 1.6×10⁻⁶
m2/s. The calculated surface diffusion coefficient is in the order of 1.0 × 10
-10 m
2/s.
The pore diffusion and the surface diffusion are considered to occur in parallel [18]. The
apparent pore diffusion coefficient Deff was defined by taking the water vapor content
gradient as the driving force of diffusion [20].
s seff
p a s
sp
DD D
(10)
In the above equation, α reflects the local slope of the equilibrium sorption amount to the
absolute humidity, and it can be represented as: e ad / dx . τp accounts for the increase in
diffusional length due to the tortuosity of real pores, which is set as 3 in this study assuming
the random pore direction [20]. τs is the tortuosity factor for surface diffusion, which accounts
for the increase in diffusion resistance in real pores compared with theoretically smooth
surface [22], which is set the same as τp in this calculation. In this study, the overall pore
diffusivity DP is in the order of 1.0 × 10⁻⁷
m2/s, whiles the effective surface diffusion
coefficient, the latter term of Eq. (10), based on the pore diffusion is in the order of 1.0 × 10⁻⁵
m2/s. Therefore, the surface diffusion is dominant compared to the pore diffusion in the
composite material, and the apparent pore diffusion coefficient can be changed to the
following equation:

International Journal of Heat and Mass Transfer
15
seff
a s
sDD
(11)
The calculated Bim is about 0.3 when the calculating temperature is 25ºC, indicating that
neither the gas side mass transfer resistance nor the mass diffusion inside the composite
material can be ignored.
2.2 Governing equations
2.2.1 Assumptions
The governing equations describing the mass and energy balances are developed based on
the following assumptions:
(1) The structure and composition of the honeycomb unit are assumed homogeneous.
(2) All the channels are considered identical in the calculations.
(3) The pressure and temperature of the air are assumed to be constant in the direction
perpendicular to air flow, and the air’s velocity is assumed to be constant along the thickness
of the air layer and throughout the sorption/desorption process. Pressure, temperature, and the
amount of sorbed water vapor are assumed to be constant along the thickness of the
composite material.
(4) The flowing air is incompressible and laminar because the hydraulic diameter of each cell
is 1.31 mm, and a typical Reynolds number is in the order of 100.
(5) The heat conduction and water vapor diffusion in the air along the length of the material
is negligible.
(6) Convective heat transfer is used to describe the interfacial heat transfer between the solid
composite material and the airflow.
(7) The specific heat and density of the dry composite material are constant.
(8) The impregnation of hydroscopic salt is assumed not to affect the sorption process such as
the diffusion of water vapor into solid salt or through the liquid film of CaCl2∙nH2O.
International Journal of Heat and Mass Transfer
16
(9) The LDF model is adopted to predict the sorption rate by considering both the gas side
and the solid side mass transfer resistances.
2.2.2 Conservation equations
The mass conservation equation for water vapor in the air can be written as follows:
a a sa a a s
a
x xu
t z t
(12)
The moisture balance of the composite material can be written using the Linear driving force
(LDF) model:
e
s
( )K
t
(13)
The energy conservation equation for the air is as follows:
a aa ,a a a ,a s a
a
( )p p
T T hC u C T T
t z
(14)
The energy conservation equation for the composite solid is as follows:
ss ,s a s s
s
( ) ( )p
T hC T T H
t t
(15)
The specific heat of the composite material is considered to be related to the amount of
water vapor sorbed according to Eq. (16):
,s ,s,dry ,H O2p p pC C C (16)
2.2.3 Boundary and initial conditions
(1) Boundary conditions
Inlet condition: Uniform distributions of Ta and xa are assumed as the inlet air condition.
International Journal of Heat and Mass Transfer
17
a a,inx x , a a,inT T at z = 0 (17a)
Outlet condition: The adiabatic and impermeable condition of the outlet of the thermal
energy storage unit was set. It is assumed that the absolute humidity gradient and temperature
gradient of the air vanished at the outlet of the channel.
a 0x
z
, a 0
T
z
at z = L (17b)
(2) Initial condition
The initial sorption amount of the composite material of one process is equal to the final
sorption amount of the reverse process. The temperature distribution along the length of the
heat storage unit is constant, as are the temperature and moisture of the air. Therefore, the
initial conditions for the air and the composite material are set as follows:
a a,0x x , a a,0T T , s s,0T T , 0 sor/desor at t = 0 (18)
2.3 Parameter settings
2.3.1 Determination of the equilibrium sorption amount
Two phases of H2O co-exist, namely, gas and sorbed water inside the pores of the composite
medium. The water vapor sorption isotherms of the composite material were tested by the
water vapor sorption analyzer Hydrosorb HS-1 (Quantachrome Instruments). At the four
measured temperatures (25, 30, 35, 40°C), the equilibrium sorption amount is essentially
independent of temperature and only related to the relative humidity, as shown in Fig. 2(a).
Therefore, the equilibrium sorption amount ωe is assumed to be independent of temperature,
and is only a function of relative humidity in the calculation.
e ( )f RH (19)
The water vapor sorption isotherms shown in Fig. 2(a) was tested by heating the material at
150ºC under the vacuum condition for 4 hours to make sure that the material had been dried
International Journal of Heat and Mass Transfer
18
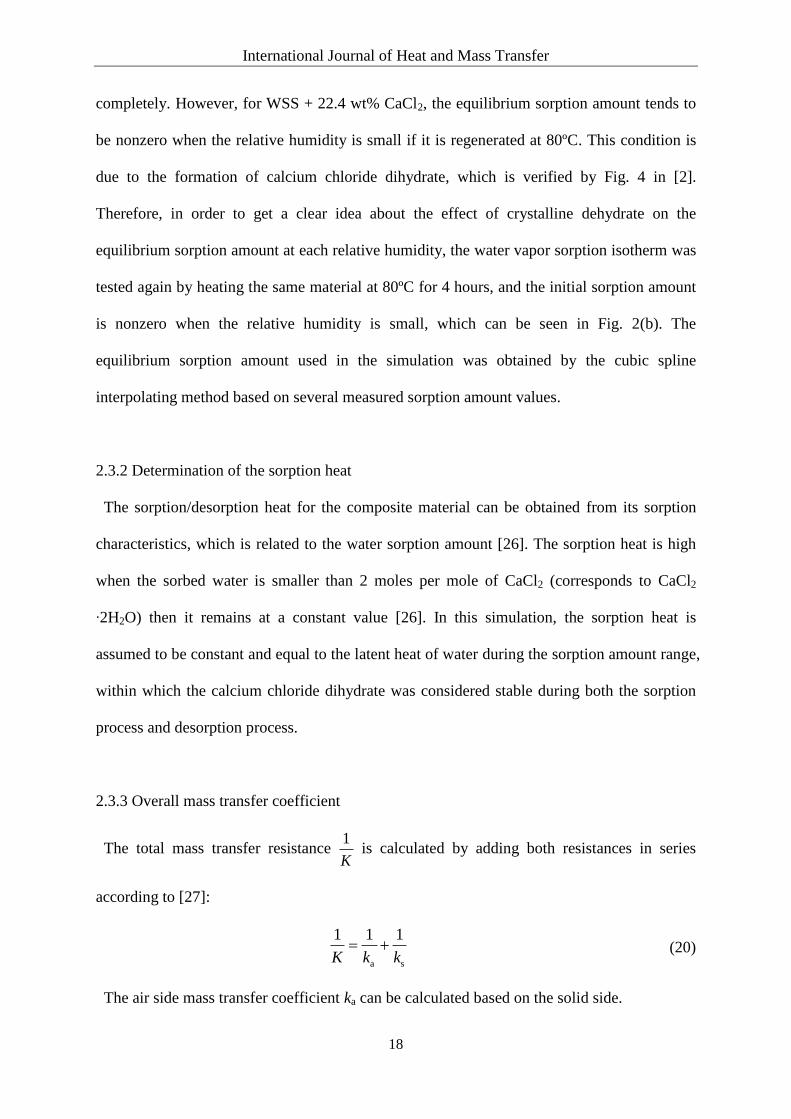
completely. However, for WSS + 22.4 wt% CaCl2, the equilibrium sorption amount tends to
be nonzero when the relative humidity is small if it is regenerated at 80ºC. This condition is
due to the formation of calcium chloride dihydrate, which is verified by Fig. 4 in [2].
Therefore, in order to get a clear idea about the effect of crystalline dehydrate on the
equilibrium sorption amount at each relative humidity, the water vapor sorption isotherm was
tested again by heating the same material at 80ºC for 4 hours, and the initial sorption amount
is nonzero when the relative humidity is small, which can be seen in Fig. 2(b). The
equilibrium sorption amount used in the simulation was obtained by the cubic spline
interpolating method based on several measured sorption amount values.
2.3.2 Determination of the sorption heat
The sorption/desorption heat for the composite material can be obtained from its sorption
characteristics, which is related to the water sorption amount [26]. The sorption heat is high
when the sorbed water is smaller than 2 moles per mole of CaCl2 (corresponds to CaCl2
∙2H2O) then it remains at a constant value [26]. In this simulation, the sorption heat is
assumed to be constant and equal to the latent heat of water during the sorption amount range,
within which the calcium chloride dihydrate was considered stable during both the sorption
process and desorption process.
2.3.3 Overall mass transfer coefficient
The total mass transfer resistance 1
K is calculated by adding both resistances in series
according to [27]:
a s
1 1 1
K k k (20)
The air side mass transfer coefficient ka can be calculated based on the solid side.

International Journal of Heat and Mass Transfer
19
aa
s
mhk
(21)
The solid side mass transfer coefficient ks is defined by the following equation according to
[20, 28]:
s
s
15 sDk
(22)
2.4 Numerical solution and experimental validation
The governing equations were discretized using the explicit finite difference (FDM) method.
The discrete equations were derived over each length interval and time interval and
numerically solved by Fortran code.
In this study, experimental results from tests of the open sorption thermal energy storage
setup were used to validate the simulation results. The dimensions of the thermal energy
storage unit were 20 cm (length) × 10 cm (width) ×10 cm (height). The WSS + 22.4 wt%
CaCl2 was chosen for the validation of this program due to its excellent performance in
previous experiments, and the simulation conditions are shown in Table 1. The calculated
outlet air absolute humidity, change of the sorption amount, outlet air temperature, and the
composite material’s temperature and corresponding instantaneous sorption amount, as well
as the relevant experimental values, are illustrated in Fig. 3(a), (b) and Fig. 4 for the sorption
process and in Fig. 5(a), (b) and Fig. 6 for the desorption process, respectively.
International Journal of Heat and Mass Transfer
20
0.0
0.1
0.2
0.3
0.4
0.5
0
2
4
6
8
10
12
14
16
18
20
0 100 200 300 400 500 600
Ch
ang
e o
f so
rpti
on
am
ou
nt
(gH
2O/g
sam
ple)
Ab
solu
te h
um
idit
y o
f ai
r x a
(g/k
gD
A)
Time (min)
(a)
Inlet air -simulation
Outlet air -simulation
Inlet air -experiment
Outlet air -experiment
Change of sorption amount-simulation
Change of sorption amount-experiment
0
0.2
0.4
0.6
0.8
1
1.2
10
20
30
40
50
60
70
0 100 200 300 400 500 600
So
rpti
on
am
ou
nt
(gH
2O/g
sam
ple)
Tem
per
atu
re (
ºC)
Time (min)
(b) Inlet air -simulation Inlet air -experimentOutlet air -simulation Outlet air -experiment1 cm -simulation 1 cm -experiment12 cm -simulation 12 cm -experiment1 cm - sorption amount 12 cm -sorption amount
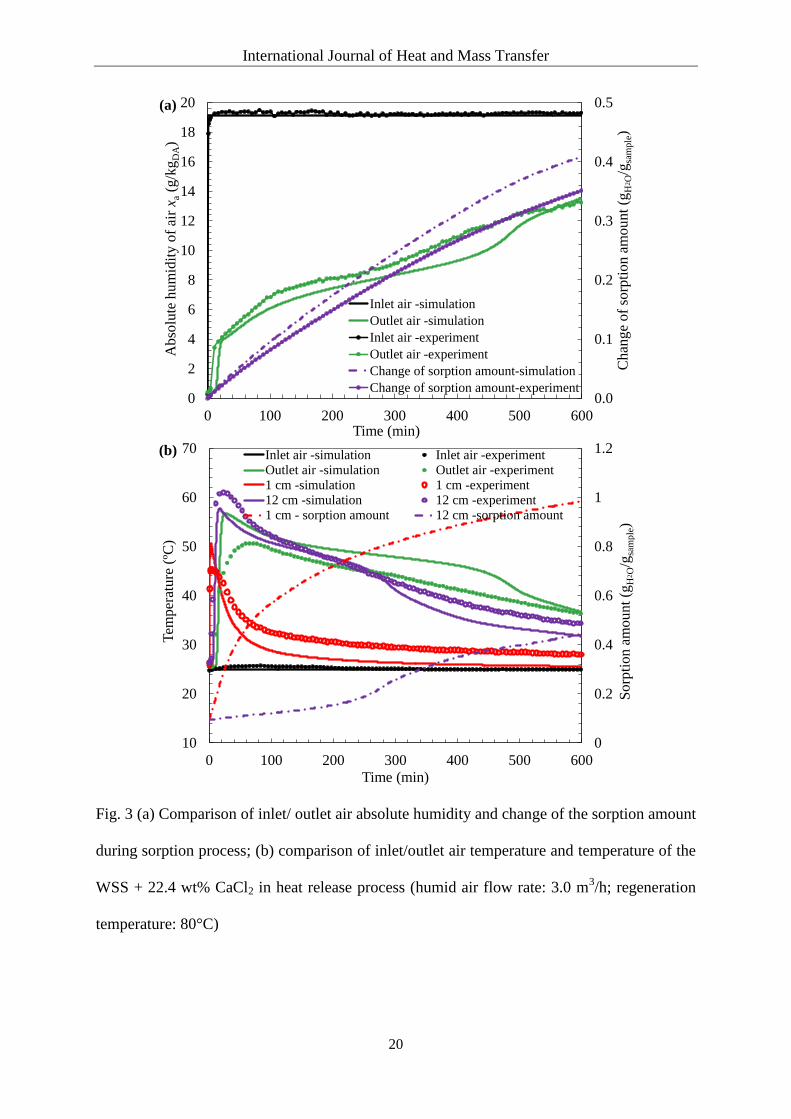
Fig. 3 (a) Comparison of inlet/ outlet air absolute humidity and change of the sorption amount
during sorption process; (b) comparison of inlet/outlet air temperature and temperature of the
WSS + 22.4 wt% CaCl2 in heat release process (humid air flow rate: 3.0 m3/h; regeneration
temperature: 80°C)
International Journal of Heat and Mass Transfer
21
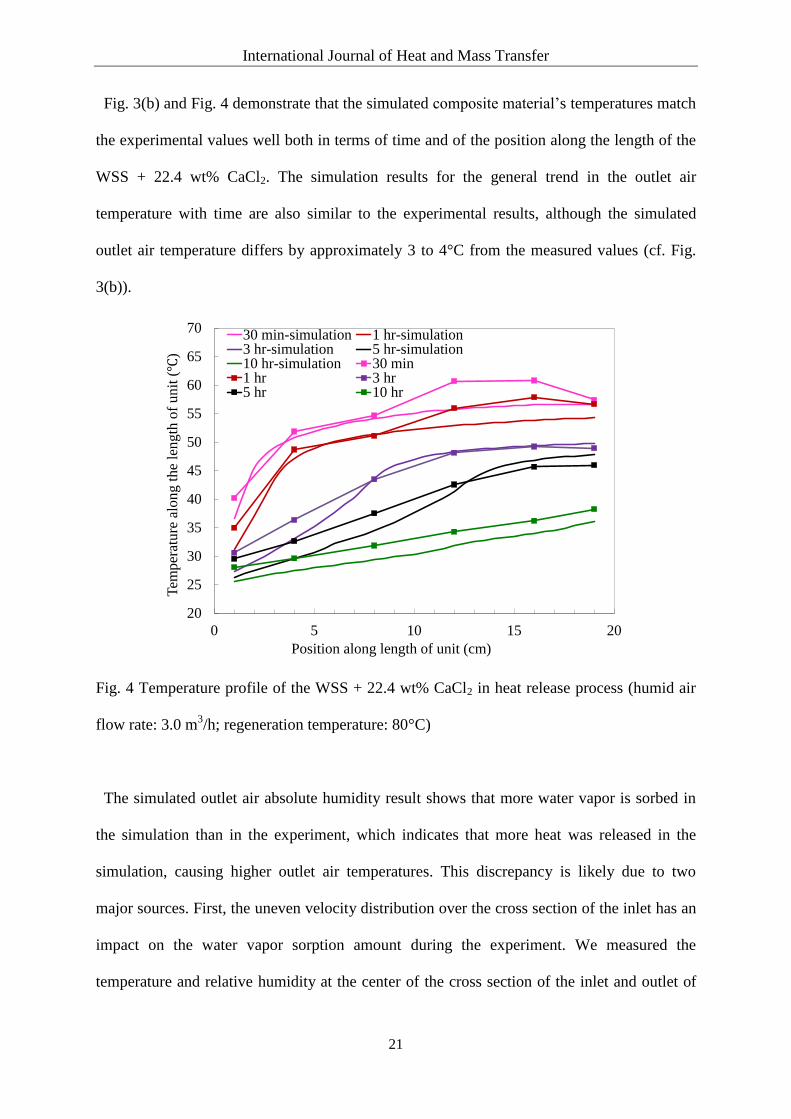
Fig. 3(b) and Fig. 4 demonstrate that the simulated composite material’s temperatures match
the experimental values well both in terms of time and of the position along the length of the
WSS + 22.4 wt% CaCl2. The simulation results for the general trend in the outlet air
temperature with time are also similar to the experimental results, although the simulated
outlet air temperature differs by approximately 3 to 4°C from the measured values (cf. Fig.
3(b)).
20
25
30
35
40
45
50
55
60
65
70
0 5 10 15 20
Tem
per
atu
re a
lon
g t
he
len
gth
of
un
it (℃
)
Position along length of unit (cm)
30 min-simulation 1 hr-simulation3 hr-simulation 5 hr-simulation10 hr-simulation 30 min1 hr 3 hr5 hr 10 hr
Fig. 4 Temperature profile of the WSS + 22.4 wt% CaCl2 in heat release process (humid air
flow rate: 3.0 m3/h; regeneration temperature: 80°C)
The simulated outlet air absolute humidity result shows that more water vapor is sorbed in
the simulation than in the experiment, which indicates that more heat was released in the
simulation, causing higher outlet air temperatures. This discrepancy is likely due to two
major sources. First, the uneven velocity distribution over the cross section of the inlet has an
impact on the water vapor sorption amount during the experiment. We measured the
temperature and relative humidity at the center of the cross section of the inlet and outlet of

International Journal of Heat and Mass Transfer
22
the heat storage unit. The highest sorption behavior (high relative humidity can produce a
high sorption amount according to Fig. 2(b)) was calculated according to the measured inlet
air relative humidity. Second, according to Fig. 5(b), the measured final temperature (< 80°C)
of the latter part of the heat storage unit affects the equilibrium sorption amount in the
desorption process. In the simulation, the initial sorption amount in the sorption process is
defined as the sorption amount under the local air’s relative humidity, which is higher than
the actual value for the latter part of the heat storage unit.

International Journal of Heat and Mass Transfer
23
0.0
0.1
0.2
0.3
0.4
0.5
0
5
10
15
20
25
30
0 100 200 300 400
Ch
ang
of
sorp
tio
n a
mo
un
t (g
H2O/g
sam
ple)
Ab
solu
te h
um
idit
y o
f ai
r (g
/kg
DA)
Time (min)
(a) Inlet air -simulationOutlet air -simulationInlet air -experimentOutlet air -experimentChange of sorption amount-simulationChange of sorption amount-experiment
0
0.2
0.4
0.6
0.8
1
1.2
20
30
40
50
60
70
80
90
100
0 100 200 300 400
So
rpti
on
am
ou
nt
(gH
2O/g
sam
ple)
Tem
per
atu
re (
ºC)
Time (min)
(b) Inlet air -simulation Inlet air -experimentOutlet air -simulation Outlet air -experiment1 cm -simulation 1 cm -experiment12 cm -simulation 12 cm -experiment1 cm - sorption amount 12 cm - sorption amount
Fig. 5 (a) Comparison of inlet/ outlet air absolute humidity and change of the sorption amount
during desorption process; (b) comparison of inlet/outlet air temperature and temperature of
the WSS + 22.4 wt% CaCl2 in heat desorption process (hot air flow rate: 3.8 m3/h;
regeneration temperature: 80°C)

International Journal of Heat and Mass Transfer
24
25
30
35
40
45
50
55
60
65
70
75
80
85
90
95
100
0 5 10 15 20
Tem
per
atu
re a
lon
g t
he
len
gth
of
un
it (℃
)
Position along length of the unit (cm)
30 min-simulation 1 hr-simulation3 hr-simulation 5 hr-simulation6 hr-simulation 30 min1 hr 3 hr5 hr 6 hr
Fig. 6 Temperature profile of the WSS + 22.4 wt% CaCl2 in heat storage process (hot air flow
rate: 3.8 m3/h; regeneration temperature: 80°C)
Comparison of the regeneration process results are illustrated in Fig. 5(a), (b) and Fig. 6.
The calculated material’s temperature, as well as the outlet air temperature and absolute
humidity, approximately fit the measured values during the beginning of the desorption
process. However, the calculated material’s temperature, outlet air temperature, and outlet
absolute humidity lag behind the measured values as the desorption process progresses. This
discrepancy is mainly caused by (a) the higher calculated sorption amount in the sorption
process and (b) the difference in the change of sorption amount between the sorption process
(cf. Fig. 3(a)) and the desorption process (cf. Fig. 5(a)) in the experiment. The uneven
distribution of velocity over the cross section of the heat storage unit also contributes to this
difference. For the sorption process, the velocity of the humid air is lower than that of the hot
air in the desorption process. Therefore, the uneven distribution in the relative humidity of the
inlet air is more pronounced in the sorption process than in the desorption process.

International Journal of Heat and Mass Transfer
25
20
25
30
35
40
45
50
0 100 200 300 400 500 600
Ou
tlet
air
tem
per
atu
re T
a,o
ut(º
C)
Time (min)
(a)
1 experiment 1 simulation
5 experiment 5 simulation
10 experiment 10 simulation
15 experiment 15 simulation
20 experiment 20 simulation
20
25
30
35
40
45
50
55
60
65
70
0 100 200 300 400 500
Ou
tlet
air
tem
per
atu
re T
a,o
ut(º
C)
Time (min)
(b)
1 experiment 1 simulation5 experiment 5 simulation10 experiment 10 simulation15 experiment 15 simulation20 experiment 20 simulation
Fig. 7 (a) Comparison of the outlet air temperature during the heat release process; (b)
comparison of the outlet temperature during the regeneration process of the WSS + 22.4 wt%
CaCl2 (humid air flow rate: 2.0 m3/h; hot air flow rate: 2.8 m
3/h; regeneration temperature:
80°C)
International Journal of Heat and Mass Transfer
26
Regeneration/sorption processes were simulated 20 times using a humid air flow rate of 2.0
m3/h, an air temperature of 25°C, a hot air flow rate of 2.8 m
3/h, and a regeneration
temperature of 80°C by inputting the initial conditions repeatedly according to the
experimental measurements. The comparison of the simulated outlet air temperature and the
experimental results is illustrated in Fig. 7(a) and (b). The simulated outlet air temperature
differs only slightly from the measured values in the sorption process in contrast to the larger
discrepancy observed for the desorption process. The likely reasons for the discrepancy
observed in the desorption process have been explained above. The results of the repeated
simulations allow us to ensure that this program can provide a stable performance over many
operation times.
3. Definitions of performance evaluation indices
Numerical tests of the WSS + 22.4 wt% CaCl2 under various thermal energy storage
conditions were performed to test the effect of each key parameter, determine the best
practical operating conditions, and evaluate the performance of the open sorption thermal
energy storage system.
To evaluate the performance of the thermal energy storage system, we used multiple
performance indices. The volumetric heat storage density QV (available heat output in the
sorption process per m3), the actual total heat output Qsor, the maximum potential stored heat
Qmax, and the coefficient and effective coefficient of heat extraction performance ε and εeff in
the heat release process were defined as follows:
,a a a,out a,in( ) /V pt
Q C f T T dt V
(23)
In the above equation, during the time interval Δt, the temperature difference of outlet air and
inlet air ΔT is no lower than 15ºC.
International Journal of Heat and Mass Transfer
27
sor s,dry( )( )Q H m (24)
max max s,dry( ) ( )Q H m (25)
max( ) /VQ V Q (26)
eff sor( ) /VQ V Q (27)
The heat recovery rate η of this thermal energy storage system must also be evaluated by
incorporating the performance of the regeneration process, which is important when the
exhaust heat or renewable energy is limited. The total heat consumed to regenerate the
composite material can be calculated from the difference in the inlet and outlet air
temperature:
desor ,a a a,in a,out0( )
t
pQ C f T T dt (28)
η is evaluated as the ratio of the heat released in the sorption process and the heat stored in
the desorption process:
sor desor/Q Q (29)
The effective heat recovery rate ηeff is related to the ratio between the effective heat
absorbed by the flowing air in the sorption process and the total heat input in the desorption
process.
eff desor( ) /VQ V Q (30)
4. Results and Discussion
Because we examined the influence of the filling amount of CaCl2 during the sorption
process in our previous work, we focused on the other important parameters in the present
study. The input parameters for each section are listed in Table 2.
International Journal of Heat and Mass Transfer
28
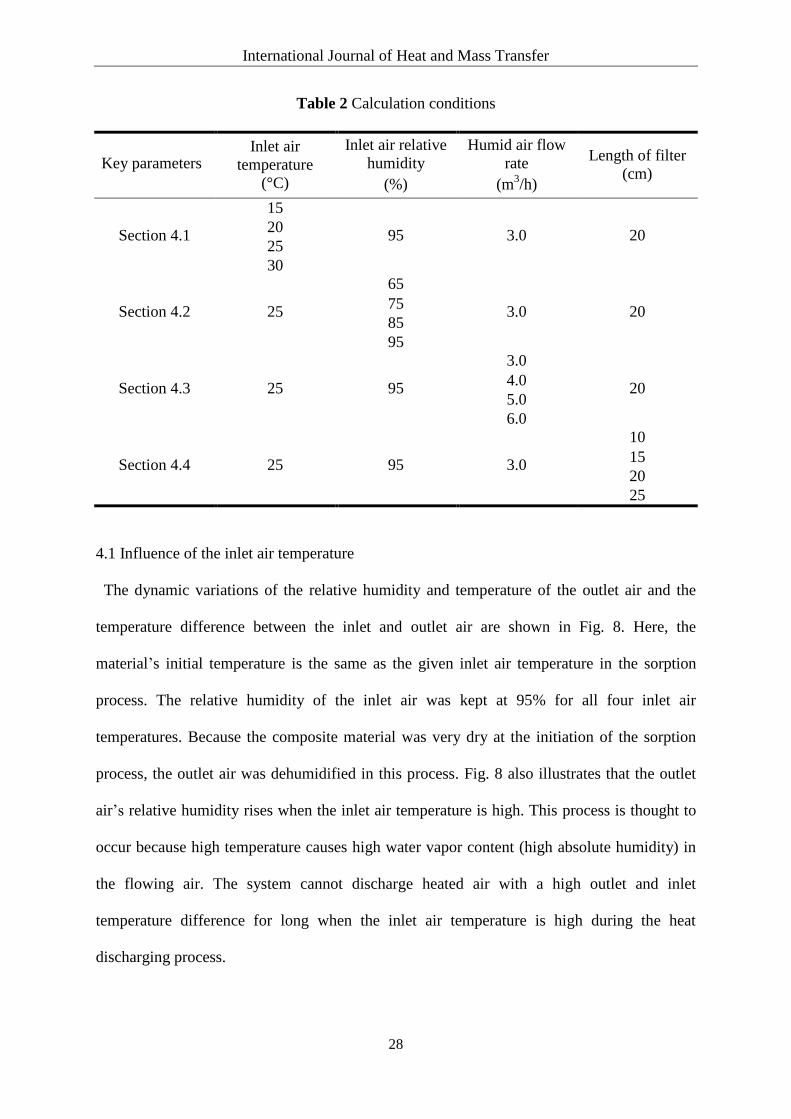
Table 2 Calculation conditions
Key parameters Inlet air
temperature
(°C)
Inlet air relative
humidity
(%)
Humid air flow
rate
(m3/h)
Length of filter
(cm)
Section 4.1
15
95 3.0 20 20
25
30
Section 4.2 25
65
3.0 20 75
85
95
Section 4.3 25 95
3.0
20 4.0
5.0
6.0
Section 4.4 25 95 3.0
10
15
20
25
4.1 Influence of the inlet air temperature
The dynamic variations of the relative humidity and temperature of the outlet air and the
temperature difference between the inlet and outlet air are shown in Fig. 8. Here, the
material’s initial temperature is the same as the given inlet air temperature in the sorption
process. The relative humidity of the inlet air was kept at 95% for all four inlet air
temperatures. Because the composite material was very dry at the initiation of the sorption
process, the outlet air was dehumidified in this process. Fig. 8 also illustrates that the outlet
air’s relative humidity rises when the inlet air temperature is high. This process is thought to
occur because high temperature causes high water vapor content (high absolute humidity) in
the flowing air. The system cannot discharge heated air with a high outlet and inlet
temperature difference for long when the inlet air temperature is high during the heat
discharging process.

International Journal of Heat and Mass Transfer
29
0
5
10
15
20
25
30
35
40
45
0
10
20
30
40
50
60
70
80
0 100 200 300 400 500 600
Ou
tlet
air
rel
ativ
e h
um
idit
y (
%)
Ou
tlet
air
tem
per
atu
re (º
C)
Time (min)
of 15 ºC of 20 ºC of 25 ºC
of 30 ºC of 15 ºC of 20 ºC
of 25 ºC of 30 ºC of 15 ºC
of 20 ºC of 25 ºC of 30 ºCIn
let
and
ou
tlet
air
tem
per
atu
re d
iffe
ren
ce(º
C)
Ta,outTa,out
Ta,out
Ta,out
∆T ∆T
∆T ∆T RHa,out
RHa,outRHa,outRHa,out
Fig. 8 Outlet air relative humidity, outlet air temperature and outlet and inlet air temperature
difference change with time of different inlet air temperatures
4.2 Effect of the inlet air relative humidity
As shown in Fig. 9, the duration of the discharge of high-temperature outlet air is prolonged
when the relative humidity increases. Indeed, the equilibrium sorption amount also increases
with higher relative humidity according to the isothermal equilibrium sorption amount line
shown in Fig. 2(b). It is notable that the water vapor content of the inlet air has an important
impact on the outlet air temperature during the heat release process due to the high sorption
amount at high relative humidity. The relative humidity of the inlet air is an important
parameter for the optimal performance of the thermal energy storage unit.
International Journal of Heat and Mass Transfer
30
0
5
10
15
20
25
30
35
40
0
10
20
30
40
50
60
0 100 200 300 400 500 600
Ou
tlet
air
rel
ativ
e hu
mid
ity (
%)
Ou
tlet
air
tem
per
ature
(ºC
)
Time (min)
at 65% at 75% at 85% at 95% at 65% at 75% at 85% at 95%
Ta,out
RHa,out
RHa,out RHa,out
RHa,out
Ta,out
Ta,outTa,out
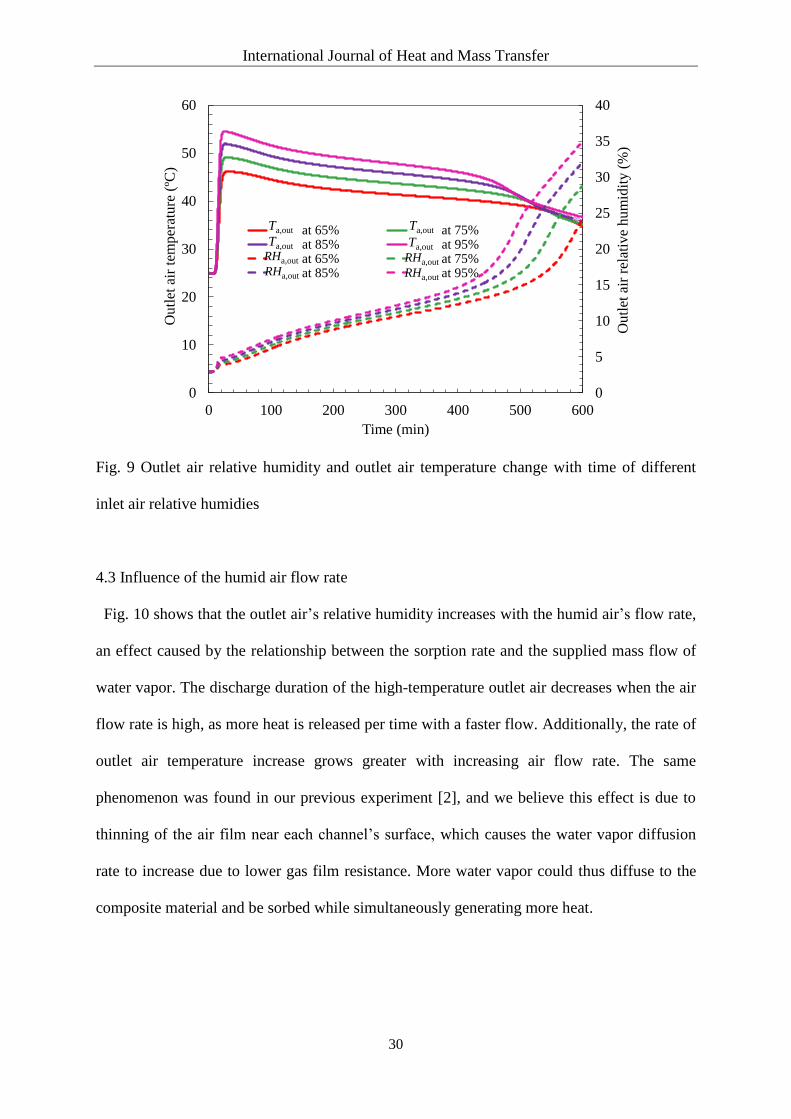
Fig. 9 Outlet air relative humidity and outlet air temperature change with time of different
inlet air relative humidies
4.3 Influence of the humid air flow rate
Fig. 10 shows that the outlet air’s relative humidity increases with the humid air’s flow rate,
an effect caused by the relationship between the sorption rate and the supplied mass flow of
water vapor. The discharge duration of the high-temperature outlet air decreases when the air
flow rate is high, as more heat is released per time with a faster flow. Additionally, the rate of
outlet air temperature increase grows greater with increasing air flow rate. The same
phenomenon was found in our previous experiment [2], and we believe this effect is due to
thinning of the air film near each channel’s surface, which causes the water vapor diffusion
rate to increase due to lower gas film resistance. More water vapor could thus diffuse to the
composite material and be sorbed while simultaneously generating more heat.

International Journal of Heat and Mass Transfer
31
0
10
20
30
40
50
60
70
10
15
20
25
30
35
40
45
50
55
60
0 100 200 300 400 500 600
Ou
tlet
air
rel
ativ
e h
um
idit
y (
%)
Ou
tlet
air
tem
per
atu
re (
ºC)
Time (min)
of 3.0 m³/h of 4.0 m³/h of 5.0 m³/h of 6.0 m³/h of 3.0 m³/h of 4.0 m³/h of 5.0 m³/h of 6.0 m³/hRHa,out
Ta,outTa,out
Ta,out
Ta,out
RHa,out
RHa,outRHa,out
Fig. 10 Outlet air relative humidity and outlet air temperature change with time of different
humid air flow rates
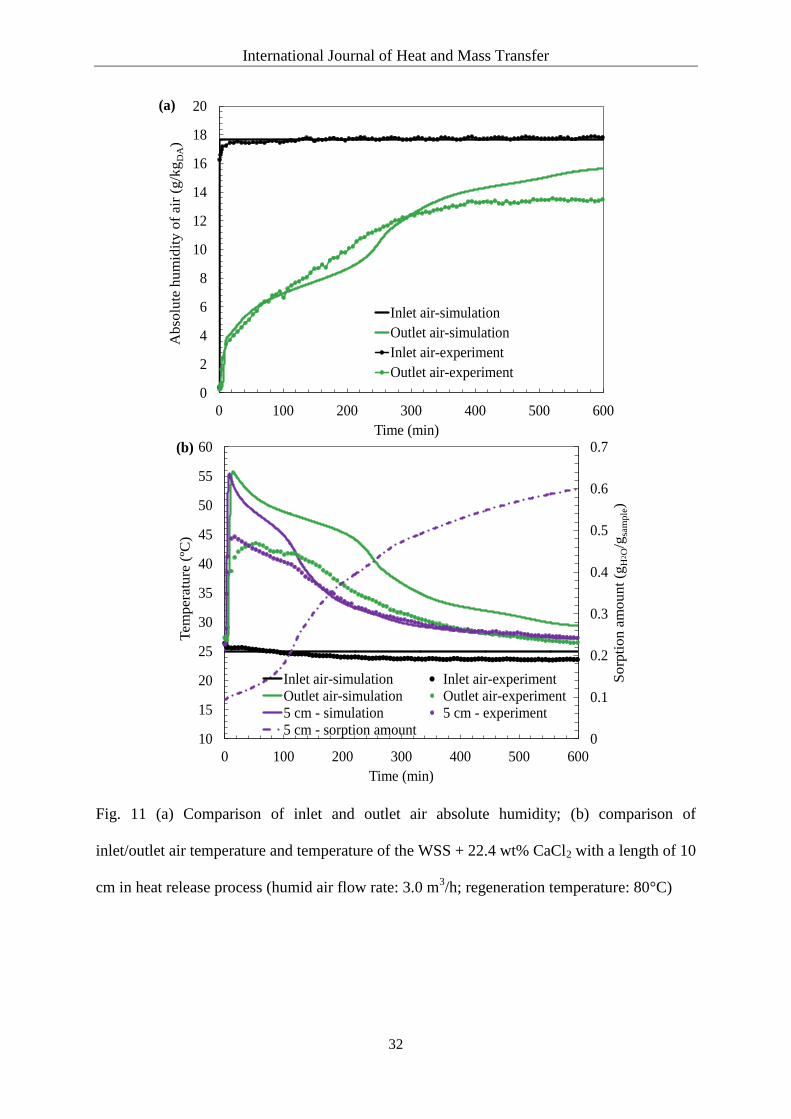
4.4 Influence of the length of the thermal energy storage unit
The performance of the WSS + 22.4 wt% CaCl2 with a length of 10 cm is compared with
the experimental results illustrated in Fig. 11(a) and (b). The simulated outlet air absolute
humidity and the temperature of the material approximately fit the measured values,
indicating that our simulation can be applied to predict the behavior of thermal energy storage
units with different lengths. The results for various lengths are shown in Fig. 12. Increasing
the length of the heat storage unit increases the contact time between the flowing air and each
channel. A longer one thus leads to a longer-duration discharge of high-temperature outlet air.
However, the maximum outlet temperature of the longer one is not significantly higher than
that of the shorter one.
International Journal of Heat and Mass Transfer
32
0
2
4
6
8
10
12
14
16
18
20
0 100 200 300 400 500 600
Ab
solu
te h
um
idit
y o
f air
(g
/kg
DA)
Time (min)
(a)
Inlet air-simulation
Outlet air-simulation
Inlet air-experiment
Outlet air-experiment
0
0.1
0.2
0.3
0.4
0.5
0.6
0.7
10
15
20
25
30
35
40
45
50
55
60
0 100 200 300 400 500 600
So
rpti
on
am
ou
nt
(gH
2O/g
sam
ple)
Tem
pera
ture
(ºC
)
Time (min)
(b)
Inlet air-simulation Inlet air-experimentOutlet air-simulation Outlet air-experiment5 cm - simulation 5 cm - experiment5 cm - sorption amount
Fig. 11 (a) Comparison of inlet and outlet air absolute humidity; (b) comparison of
inlet/outlet air temperature and temperature of the WSS + 22.4 wt% CaCl2 with a length of 10
cm in heat release process (humid air flow rate: 3.0 m3/h; regeneration temperature: 80°C)

International Journal of Heat and Mass Transfer
33
0
10
20
30
40
50
60
70
20
25
30
35
40
45
50
55
60
0 100 200 300 400 500 600
Ou
tlet
air
rel
ativ
e h
um
idit
y (
%)
Ou
tlet
air
tem
per
atu
re (
ºC)
Time (min)
of 10 cm of 15 cm of 20 cm of 25 cm of 10 cm of 15 cm of 20 cm of 25 cm
Ta,out
RHa,out
Ta,out
Ta,out
Ta,out
RHa,out
RHa,out
RHa,out
Fig. 12 Outlet air relative humidity and outlet air temperature change with time of different
length of the thermal energy storage units
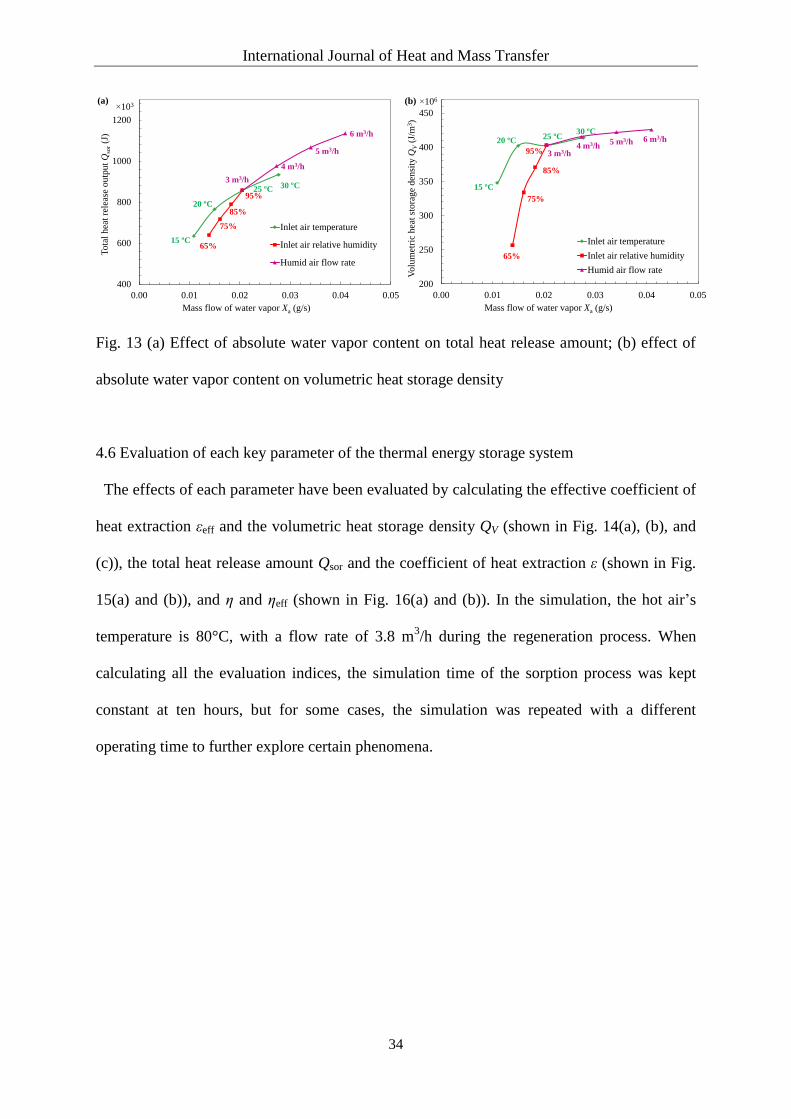
4.5 Comprehensive evaluation of the mass flow of water vapor in the humid air
Inlet air temperature, relative humidity, and flow rate all influence the same parameter, mass
flow of water vapor Xa, defined by the equation Xa = ρa f xa,in. The effect of the mass flow of
water vapor can be seen in Fig. 13(a) and (b). When more water vapor is supplied, more
water vapor can be sorbed, releasing more heat (cf. Fig. 13(a)). Moreover, with higher
amounts of supplied water vapor, the effective heat that can be utilized per unit volume will
be higher. For a given humid air flow rate, the higher the mass flow of water vapor, the better
the performance, with heat released and volumetric heat storage density both increasing with
the mass flow of water vapor.
International Journal of Heat and Mass Transfer
34
15 ºC
20 ºC
25 ºC 30 ºC
65%
75%
85%
95%
3 m3/h
4 m3/h
5 m3/h
6 m3/h
400
600
800
1000
1200
0.00 0.01 0.02 0.03 0.04 0.05
To
tal
hea
t re
leas
e o
utp
ut
Qso
r(J
)
Mass flow of water vapor Xa (g/s)
(a)
Inlet air temperature
Inlet air relative humidity
Humid air flow rate
�103
15 ºC
20 ºC25 ºC
30 ºC
65%
75%
85%
95% 3 m3/h4 m3/h
5 m3/h 6 m3/h
200
250
300
350
400
450
0.00 0.01 0.02 0.03 0.04 0.05
Volu
met
ric
hea
t st
ora
ge
den
sity
QV
(J/m
3)
Mass flow of water vapor Xa (g/s)
(b)
Inlet air temperature
Inlet air relative humidity
Humid air flow rate
�106
Fig. 13 (a) Effect of absolute water vapor content on total heat release amount; (b) effect of
absolute water vapor content on volumetric heat storage density
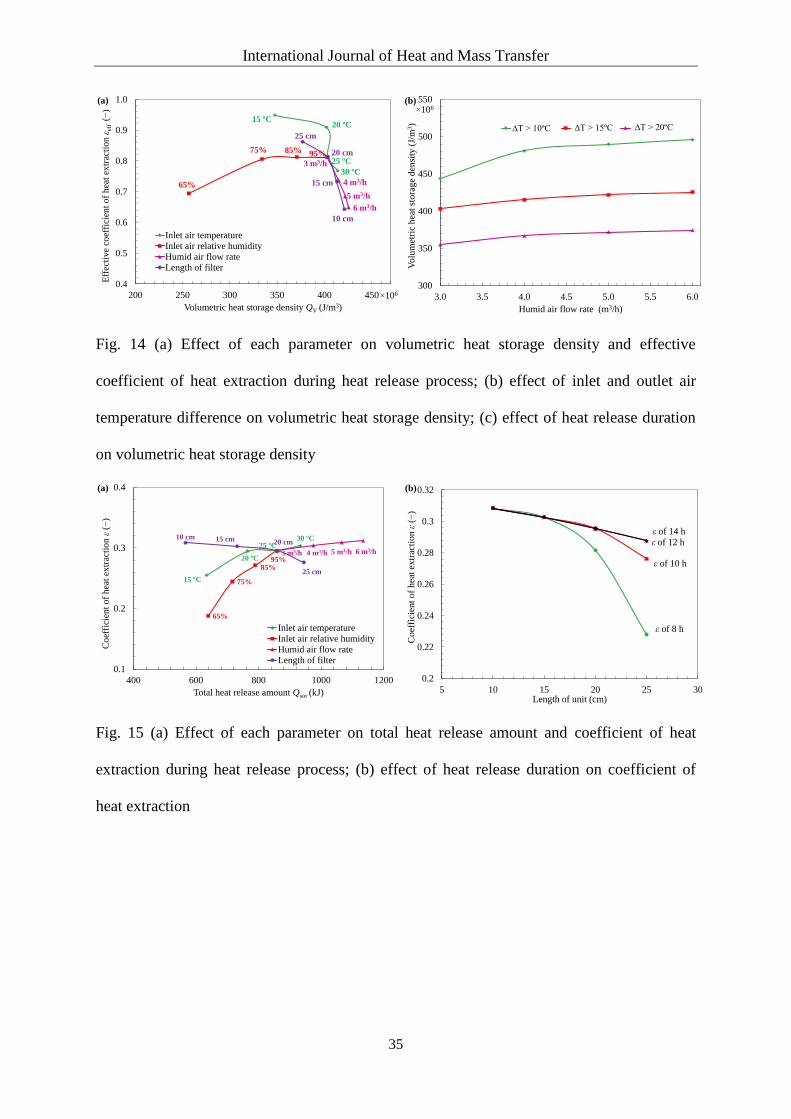
4.6 Evaluation of each key parameter of the thermal energy storage system
The effects of each parameter have been evaluated by calculating the effective coefficient of
heat extraction εeff and the volumetric heat storage density QV (shown in Fig. 14(a), (b), and
(c)), the total heat release amount Qsor and the coefficient of heat extraction ε (shown in Fig.
15(a) and (b)), and η and ηeff (shown in Fig. 16(a) and (b)). In the simulation, the hot air’s
temperature is 80°C, with a flow rate of 3.8 m3/h during the regeneration process. When
calculating all the evaluation indices, the simulation time of the sorption process was kept
constant at ten hours, but for some cases, the simulation was repeated with a different
operating time to further explore certain phenomena.
International Journal of Heat and Mass Transfer
35
15 ºC20 ºC
25 ºC
30 ºC
65%
75% 85% 95%
3 m3/h
4 m3/h
5 m3/h
6 m3/h
10 cm
15 cm
20 cm
25 cm
0.4
0.5
0.6
0.7
0.8
0.9
1.0
200 250 300 350 400 450
Eff
ecti
ve
coef
fici
ent
of
hea
t ex
trac
tio
n ε
eff
(−)
Volumetric heat storage density QV (J/m3)
(a)
Inlet air temperature
Inlet air relative humidity
Humid air flow rate
Length of filter
�106
300
350
400
450
500
550
3.0 3.5 4.0 4.5 5.0 5.5 6.0
Vo
lum
etri
c h
eat
sto
rag
e d
ensi
ty (
J/m
3)
Humid air flow rate (m3/h)
(b)�106
∆T > 15ºC∆T > 10ºC ∆T > 20ºC
Fig. 14 (a) Effect of each parameter on volumetric heat storage density and effective
coefficient of heat extraction during heat release process; (b) effect of inlet and outlet air
temperature difference on volumetric heat storage density; (c) effect of heat release duration
on volumetric heat storage density
15 ºC
20 ºC
25 ºC30 ºC
65%
75%
85%95%
3 m3/h 4 m3/h 5 m3/h 6 m3/h
10 cm 15 cm 20 cm
25 cm
0.1
0.2
0.3
0.4
400 600 800 1000 1200
Co
effi
cien
t o
f h
eat
extr
acti
on
ε(−
)
Total heat release amount Qsor (kJ)
(a)
Inlet air temperature
Inlet air relative humidity
Humid air flow rate
Length of filter
0.2
0.22
0.24
0.26
0.28
0.3
0.32
5 10 15 20 25 30
Coef
fici
ent
of
hea
t ex
trac
tion
ε(−
)
Length of unit (cm)
(b)
ε of 8 h
ε of 10 h
ε of 12 h
ε of 14 h
Fig. 15 (a) Effect of each parameter on total heat release amount and coefficient of heat
extraction during heat release process; (b) effect of heat release duration on coefficient of
heat extraction
International Journal of Heat and Mass Transfer
36
15 ºC
20 ºC
25 ºC 30 ºC
65%
75%85%
95%
3 m3/h
4 m3/h
5 m3/h
6 m3/h10 cm
15 cm
20 cm25 cm
0.40
0.45
0.50
0.55
0.60
0.65
0.70
0.75
0.65 0.70 0.75 0.80 0.85 0.90
ηef
f(−
)
η (−)
Inlet air temperature Inlet air relative humidity
Humid air flow rate Length of filter
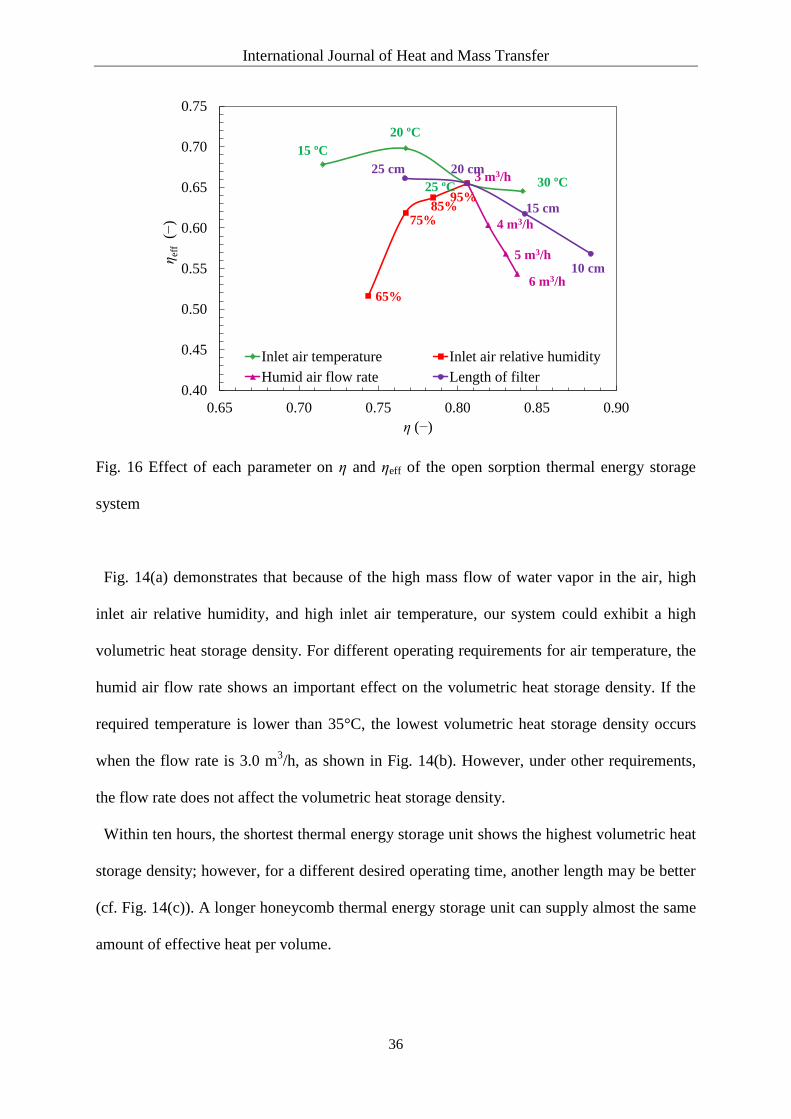
Fig. 16 Effect of each parameter on η and ηeff of the open sorption thermal energy storage
system
Fig. 14(a) demonstrates that because of the high mass flow of water vapor in the air, high
inlet air relative humidity, and high inlet air temperature, our system could exhibit a high
volumetric heat storage density. For different operating requirements for air temperature, the
humid air flow rate shows an important effect on the volumetric heat storage density. If the
required temperature is lower than 35°C, the lowest volumetric heat storage density occurs
when the flow rate is 3.0 m3/h, as shown in Fig. 14(b). However, under other requirements,
the flow rate does not affect the volumetric heat storage density.
Within ten hours, the shortest thermal energy storage unit shows the highest volumetric heat
storage density; however, for a different desired operating time, another length may be better
(cf. Fig. 14(c)). A longer honeycomb thermal energy storage unit can supply almost the same
amount of effective heat per volume.

International Journal of Heat and Mass Transfer
37
The effective coefficient of heat extraction increases when the inlet air relative humidity or
the length of the heat storage unit rises or when the humid air flow rate decreases. When the
relative humidity is maximized, the humid air flow rate is 3 m3/h and the inlet air temperature
is kept at 20 to 30ºC, the system achieves a high volumetric heat storage density, as well as a
high εeff, as illustrated in Fig. 14(a).
When high mass flow of water vapor is supplied (cf. Fig. 13(a)), the resulting inlet air
relative humidity, inlet air temperature, and speed of the humid air can produce a high total
heat release amount. According to Fig. 15(a), if the heat release time is within ten hours, the
heat storage unit’s length is shorter than 25 cm and shows almost the same coefficient of heat
extraction. However, if hot air is needed for duration longer than ten hours, a longer one
provides a better performance compared to cases where hot air is provided for a shorter time
due to its higher sorption ability, as illustrated in Fig. 15(b).
When the exhaust heat or renewable heat to be stored is limited, the heat recovery rate η and
effective heat recovery rate ηeff must be considered to evaluate the whole cycle’s performance.
Fig. 16 indicates that, due to the effect of the mass flow of water vapor, high inlet air
temperature, high relative humidity, and a large air low rate produce a high heat recovery rate,
while a shorter one can achieve a high η due to the high sorption amount of the whole thermal
energy storage unit. However, a longer one can provide a better ηeff for a release duration of
ten hours due to its high εeff.
Based on the above analysis, the optimal operating conditions for ten hours of heat release
are as follows: Ta,in = 25°C or 30°C, RHa,in = 95%, fa = 3.0 m3/h, L = 20 cm or 25 cm to get a
high volumetric heat storage density QV, a high effective coefficient of heat extraction εeff and
a high effective heat recovery rate ηeff. If a longer-duration heat release is required, a longer
thermal energy storage unit is necessary.

International Journal of Heat and Mass Transfer
38
4.7 Simulation of an application of the open thermal heat storage system
In this section, the thermal energy storage system is applied to a paint-drying system. When
thick coats of paint are needed for large pumps, the hot ventilated air required for paint
drying is usually supplied by a kerosene-fueled blower during the daytime. Ventilation with
natural outdoor air is generally used during the nighttime (cf. Fig. 17(a)). Speeding up the
drying process while minimizing the cost is an important challenge. One solution is to run the
kerosene-fueled blowers in the nighttime as well as during the day, but doing so requires
watchmen and is thus costly. Therefore, we propose the incorporation of our open sorption
thermal energy storage unit into this system. The exhaust heat from the kerosene-fueled
blowers employed during the daytime can be stored using the thermal energy storage unit.
The stored heat can be utilized to heat up ventilated air, which can be employed in the drying
booth during the nighttime as shown in Fig. 17(b). Another advantage of this system is the
low relative humidity of the supply air from the thermal energy storage unit. Our system can
simultaneously shorten the drying process and save energy.
Outside air
Paint
drying
booth
Kerosene
(100)
Exhaust gas (37), 185
kW
Kerosene
fueled blower
Outside air
Paint
drying
booth
(a)
Kerosene
fueled blower
Exhaust gas
(37), 185 kW
Kerosene
(100)
Paint
drying
booth
Outside
air
Hot air (63)
316kW
Thermal energy
storage unit
(b)
Kerosene
fueled blower
Hot air (63)
316kW
Paint
drying
booth
Outside
air
Hot air
(40 – 60) ºC
Water spray heat
exchanger
Gas to gas heat exchanger
Thermal energy
storage unit
Fig. 17 (a) Previous paint drying system; (b) improved system incorporated with the
International Journal of Heat and Mass Transfer
39
developed sorption thermal energy storage unit
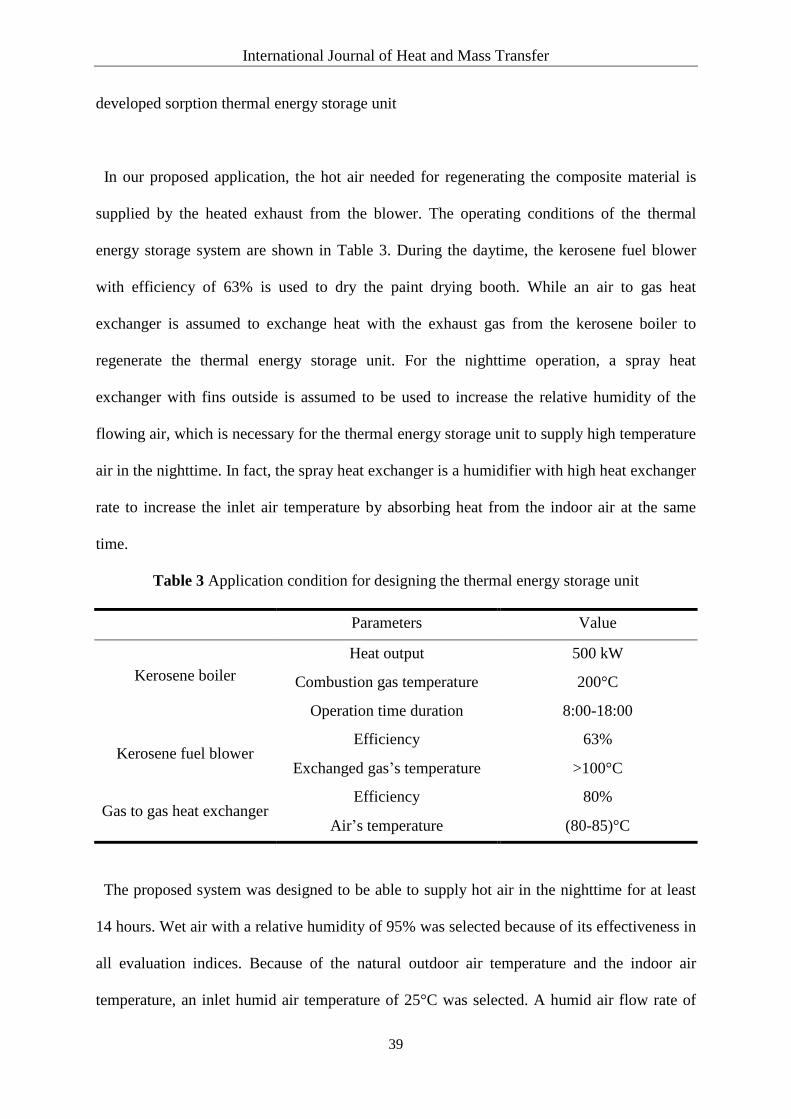
In our proposed application, the hot air needed for regenerating the composite material is
supplied by the heated exhaust from the blower. The operating conditions of the thermal
energy storage system are shown in Table 3. During the daytime, the kerosene fuel blower
with efficiency of 63% is used to dry the paint drying booth. While an air to gas heat
exchanger is assumed to exchange heat with the exhaust gas from the kerosene boiler to
regenerate the thermal energy storage unit. For the nighttime operation, a spray heat
exchanger with fins outside is assumed to be used to increase the relative humidity of the
flowing air, which is necessary for the thermal energy storage unit to supply high temperature
air in the nighttime. In fact, the spray heat exchanger is a humidifier with high heat exchanger
rate to increase the inlet air temperature by absorbing heat from the indoor air at the same
time.
Table 3 Application condition for designing the thermal energy storage unit
Parameters Value
Kerosene boiler
Heat output 500 kW
Combustion gas temperature 200°C
Operation time duration 8:00-18:00
Kerosene fuel blower Efficiency 63%
Exchanged gas’s temperature >100°C
Gas to gas heat exchanger Efficiency 80%
Air’s temperature (80-85)°C
The proposed system was designed to be able to supply hot air in the nighttime for at least
14 hours. Wet air with a relative humidity of 95% was selected because of its effectiveness in
all evaluation indices. Because of the natural outdoor air temperature and the indoor air
temperature, an inlet humid air temperature of 25°C was selected. A humid air flow rate of

International Journal of Heat and Mass Transfer
40
3.0 m3/h was chosen to ensure a sufficient duration of hot air release, as illustrated in Fig. 10,
and high εeff and ηeff, as shown in Fig. 14(a) and Fig. 16, respectively. According to Fig. 14(c),
when the air flow rate is 3 m3/h, the 25 cm thermal energy storage unit achieves the same
available heat for operating times of 12 hours and 14 hours, indicating that the maximum
available heat can be reached within 12 hours for this thermal energy storage unit length. For
the proposed application, a longer one of at least 33 cm was used to supply air at
temperatures greater than 40°C for 14 hours.
For the heat storage process, hot air from the gas-to-gas heat exchanger flows through the
heat storage unit for ten hours to regenerate it. The flow rate of the hot air through each
thermal energy storage unit was set to at least 3.8 m3/h in order to be regenerated completely
within ten hours. If the simulated results fulfilled the requirements of the drying system, the
size of the heat storage unit was then decided according to the exhaust heat supply side and
the performance of the storage unit.
Fig. 18 shows the outlet air temperature and relative humidity trends during the sorption and
desorption processes. According to our simulation, the hot air (temperature greater than 40°C)
generated by the thermal energy storage unit can dry the painting booth for 14 hours with low
relative humidity in nighttime. The exhaust heat produced during the daytime operation of the
blowers can also regenerate the heat storage unit successfully.

International Journal of Heat and Mass Transfer
41
0
10
20
30
40
50
60
70
80
90
100
0
10
20
30
40
50
60
70
80
90
100
8:00 12:00 16:00 20:00 0:00 4:00 8:00
Inle
t an
d o
utl
et a
ir t
elat
ive
hu
mid
ity
(%
)
Inel
t an
d o
utl
et a
ir t
emp
erat
ure
(ºC
)
Time (hr)
- desorption - sorption - desorption - sorption - desorption - sorption - desorption - sorption
Ta,in
Ta,in
Ta,out
Ta,out
RHa,in
RHa,in
RHa,out
RHa,out
Fig. 18 Simulated outlet air relative humidity and outlet air temperature during the sorption
and desorption processes, respectively
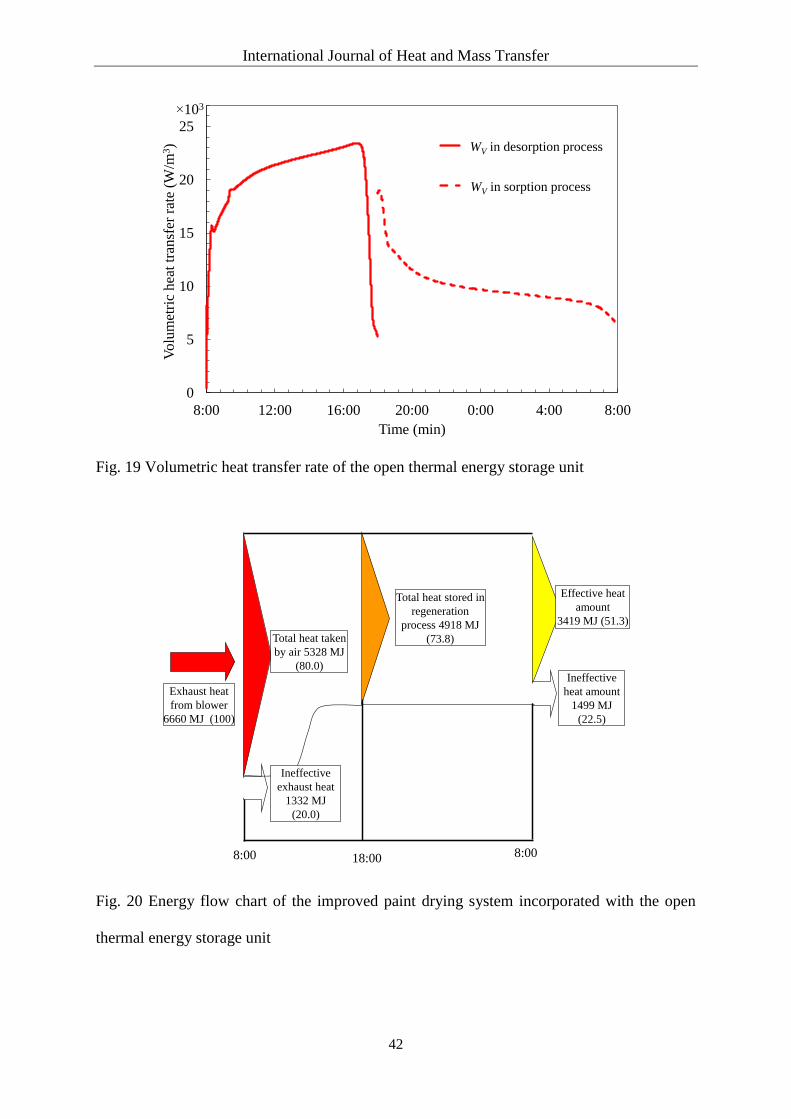
The volumetric heat transfer rate, a key parameter defined in Eq. (31), effectively
determines the size of the thermal energy storage system, as is shown in Fig. 19.
,a a a,out a,in /V pW C f T T V (31)
From the value of the desorption volumetric heat transfer rate and the exhaust heat amount,
the necessary volume of the thermal energy storage unit was determined to be 7.7 m3, which
means that at least 2300 thermal energy storage unit with dimensions: 10 cm (width) ×10 cm
(height) ×33 cm (length) are necessary.
International Journal of Heat and Mass Transfer
42
0
5
10
15
20
25
8:00 12:00 16:00 20:00 0:00 4:00 8:00
Vo
lum
etri
c h
eat
tran
sfer
rat
e (W
/m3)
Time (min)
WV in desorption process
WV in sorption process
�103
Fig. 19 Volumetric heat transfer rate of the open thermal energy storage unit
Exhaust heat
from blower
6660 MJ (100)
Total heat taken
by air 5328 MJ
(80.0)
Effective heat
amount
3419 MJ (51.3)
Ineffective
heat amount
1499 MJ
(22.5)
8:00 18:00 8:00
Total heat stored in
regeneration
process 4918 MJ
(73.8)
Ineffective
exhaust heat
1332 MJ
(20.0)
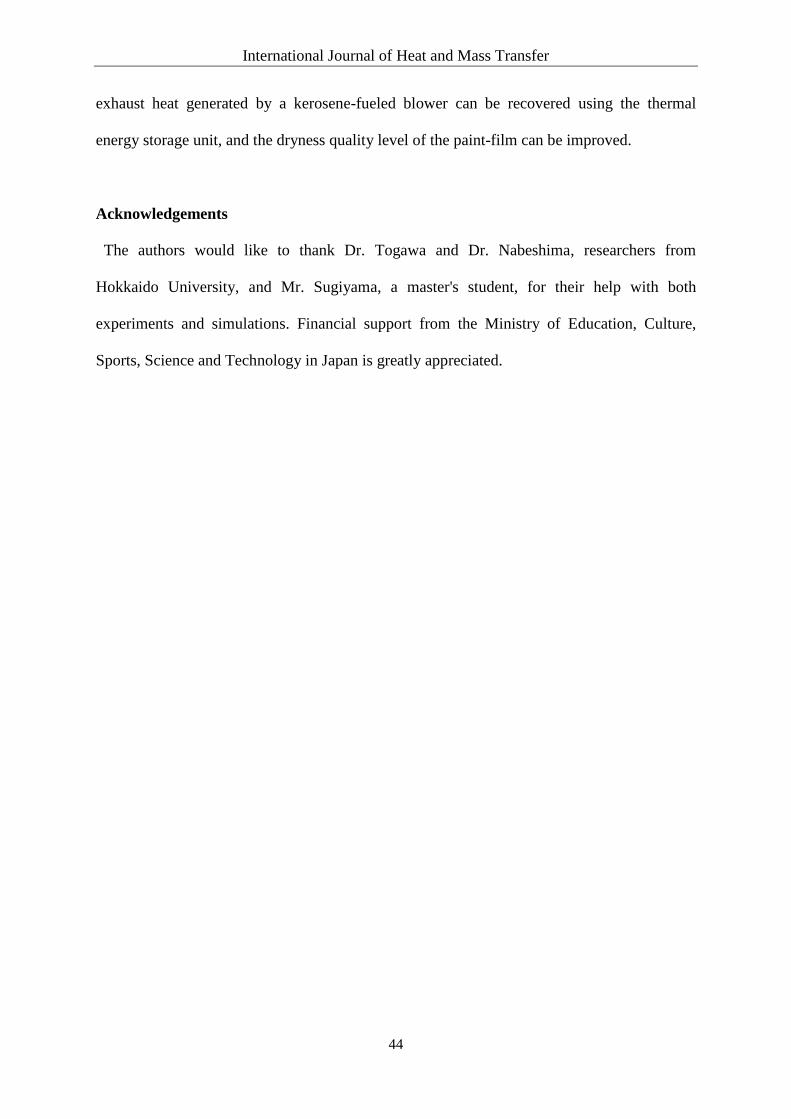
Fig. 20 Energy flow chart of the improved paint drying system incorporated with the open
thermal energy storage unit

International Journal of Heat and Mass Transfer
43
The energy flow chart for this application shown in Fig. 20 was studied to investigate the
efficiency of the thermal energy storage system in the drying process. The total exhaust heat
generated by the blower is 6660 MJ within its operation time, and a fraction of this heat
(4918 MJ) must be utilized to regenerate the thermal energy storage unit in the daytime. The
effective heat needed to dry the paint-film is approximately 3419 MJ at nighttime, which is
approximately 51.3% of the total exhaust heat. Thus, the thermal energy storage unit can
recover half of the exhaust heat and improve the dryness quality (keeping proper temperature
and low relative humidity of supplied air) of the paint-film.
5. Conclusions
A numerical simulation model was created to investigate the capability of a composite
mesoporous thermal energy storage unit to store thermochemical energy. This program,
based on the effect of coupled heat and mass transfer, effectively simulates our open sorption
thermal energy storage system. From the numerical results, we obtained the following
conclusions:
1. The simulation results can approximately predict the experimental values. The
discrepancies observed between simulation and experiment in the desorption process have
been explained above.
2. Using our simulation program, we analyzed the effects of the inlet air temperature and
relative humidity, humid air flow rate, and thermal energy storage unit length on the system’s
performance. Optimal operating conditions were thus selected as follows: Ta,in = 25°C or
30°C, RHa,in = 95%, fa = 3.0 m3/h, L = 20 or 25 cm for a heat release duration of ten hours.
3. A realistic application was proposed and simulated. Based on the simulation results, the
thermal energy storage unit can supply air with a temperature greater than 40°C for 14 hours,
and the unit can be regenerated within ten hours during the daytime. Finally, 51.3% of the
International Journal of Heat and Mass Transfer
44
exhaust heat generated by a kerosene-fueled blower can be recovered using the thermal
energy storage unit, and the dryness quality level of the paint-film can be improved.
Acknowledgements
The authors would like to thank Dr. Togawa and Dr. Nabeshima, researchers from
Hokkaido University, and Mr. Sugiyama, a master's student, for their help with both
experiments and simulations. Financial support from the Ministry of Education, Culture,
Sports, Science and Technology in Japan is greatly appreciated.

International Journal of Heat and Mass Transfer
45
References
[1] I. Dincer, Thermal energy storage systems as a key technology in energy conservation,
International Journal of Energy Research 26 (2002) 567-588.
[2] H. Liu, K. Nagano, D. Sugiyama, J. Togawa, M. Nakamura, Honeycomb filters made
from mesoporous composite material for an open sorption thermal energy storage system to
store low-temperature industrial waste heat, International Journal of Heat and Mass Transfer
65 (2013) 471-480.
[3] G. Balasubramanian, M. Ghommem, M.R. Hajj, W.P. Wong, J.A. Tomlin, I.K. Puri,
Modeling of thermochemical energy storage by salt hydrates, International Journal of Heat
and Mass Transfer 53 (2010) 5700-5706.
[4] D. Zhu, H. Wu, S. Wang, Experimental study on composite silica gel supported CaCl2
sorbent for low grade heat storage, International Journal of Thermal Sciences 45 (2006) 804-
813.
[5] H. Wu, S. Wang, D. Zhu, Effects of impregnating variables on dynamic sorption
characteristics and storage properties of composite sorbent for solar heat storage, Solar
Energy (2007) 864-871.
[6] H. Wu, S. Wang, D. Zhu, Y. Ding, Numerical analysis and evaluation of an open-type
thermal storage system using composite sorbents, International Journal of Heat and Mass
Transfer 52 (2009) 5262-5265.
[7] N.M. Ostrovskii, N.A. Chumakova, N.M. Bukhavtsova, N.V. Vernikovskaya, Y.I. Aristov,
Effect of capillary condensation on water sorption by composite calcium chloride in a porous
matrix sorbents, Theoretical Foundations of Chemical Engineering 41(2) (2007) 200-204.
[8] N.M. Ostrovskii, N.A. Chumakova, N.M. Bukhavtsova, N.V. Vernikovskaya, Y.I.
Aristov., Modeling of the limiting step of Water Sorption by Composite Sorbents of the

International Journal of Heat and Mass Transfer
46
“Calcium Chloride in Porous Matrix” Type, Theoretical Foundations of Chemical
Engineering 41(1) (2007) 83-90.
[9] J.L. Niu, L.Z. Zhang, Effects of wall thickness on the heat and moisture transfers in
desiccant wheels for air dehumidification and enthalpy recovery, International
Communications in Heat and Mass Transfer 29(2) (2002) 255-268.
[10] D. Charoensuphya, W.M. Worek, Parametric study of an open-cycle adiabatic, solid,
desiccant cooling system, Energy 13(9) (1988) 739-747.
[11] W. Zheng, W.M. Worek, Numerical simulation of combined heat and mass transfer
processes in a rotary dehumifier, Numerical Heat Transfer, Part A: Applications 23(2) (1993)
211-232.
[12] W. Zheng, W.M. Worek, D. Novosel, Performance optimization of rotary dehumidifiers,
Journal of Solar Energy Engineering 117 (1995) 40-44.
[13] X.J. Zhang, Y.J. Dai, R.Z. Wang, A simulation study of heat and mass transfer in a
honeycombed rotary desiccant dehumidifer, Applied Thermal Engineering 23 (2003) 989-
1003.
[14] P. Majumdar, Heat an mass transfer in composite desiccant pore structure for
dehumidification, Solar Energy 97(1) (1998) 1-10.
[15] T.S. Ge, F. Ziegler, R.Z. Wang, A mathematical model for predicting the performance of
a compound desiccant wheel (A model ofcompound desiccant model), Applied Thermal
Engineering 30 (2010) 1005-1015.
[16] Z. Gao, V.C. Mei, J.J. Tomlinson, Theoretical analysis of dehumidification process in a
desiccant wheel, Heat Mass Transfer 41 (2005) 1033-1042.
[17] L.Z. Zhang, J.L. Niu, Performance comparisons of desiccant wheels for air
dehumidification and enthalpy recovery, Applied Thermal Engineering 22 (2002) 1347-1367.
International Journal of Heat and Mass Transfer
47
[18] S. Yamaguchi, K. Saito, Numerical and experimental performance analysis of rotary
desiccant wheels, International Journal of Heat and Mass Transfer 60 (2013) 51-60.
[19] A.G. Fedorov, R. Viskanta, Analysis of transient heat/mass transfer and
adsorption/desorption internations, International Journal of Heat and Mass Transfer 42 (1999)
803-819.
[20] M. Suzuki, Adsorption engineering. Japan, Kodansya Ltd., Tokyo and Elsevier Science
Publishers B. V., Amsterdam, 1990.
[21] C.Q. Zhai, Performance modeling of desiccant wheel design and operation, Doctor
degree, Carnegie Mellon University, 2008.
[22] H.H. Xing, Desiccant Dehumidification Analysis, Master Thesis Master of Science in
Building Technology, Massachusetts Institute of Technology, 2000.
[23] Y.A. Cengel, Heat Transfer: A Practical Approach, second ed., McGraw-Hill, 2003, pp.
759.
[24] J. Karger, D. M.Ruthven, D. N.Theodorou, Diffusion in Nanoporous Materials, 2
Volume Set. 2012, pp. 85-108.
[25] K.J. Sladek, E.R. Gilliland, R.F. Baddour, Diffusion on surface. 2. Correlation of
diffusivities of physically and chemically adsorbed species, Industrial and Engineering
Chemistry Fundamentals 13(2) (1974) 100-105.
[26] Y.I. Aristov, M.M.Tokarev, G.Cacciola, G. Restuccia, Selective water sorbents for
multiple applications, 1. CaCl2 confined in mesopores of silica gel: sorption properties,
Reaction Kinetics and Catalysis Letters 59(2) (1996) 325-333.
[27] T. Tsujiguchi, A. Kodama, Optimum operating/design concept for adsorbent desiccant
wheel, Porceeding of Japan Society of Refregerating and Air Conditioning Engineers,
Sapporo, Japan, 2012, pp. 107-118.

International Journal of Heat and Mass Transfer
48
[28] A. Sakoda, M. Suzuki, Fundamental study on solar powered adsorption cooling system,
Journal of Chemical Engineering of Japan 17(1) (1984) 52-57.