numerical modelling of size effect on subgrade reaction
TRANSCRIPT

Computational Research Progress in Applied Science & Engineering
©PEARL publication, 2017
CRPASE Vol. 03(03), 115-122, September 2017
ISSN 2423-4591
Numerical Modelling of Size Effect on Subgrade Reaction Modulus Using DEM
Hadi Ahmadia, Saman Farzi Sizkowb
a Department of Civil Engineering, University of Guilan, Iran b School of Civil and Environmental Engineering, Amirkabir University of Technology, Iran
Keywords Abstract
Size effect,
Modulus of subgrade
reaction,
Discrete element method,
Uniform sand,
Plate load test.
In the flexible foundation analysis theories, such as beam on elastic foundation and
Winkler’s model, the modulus of subgrade reaction is proposed as the soil’s resilience
coefficient in a semi-infinite environment. The modulus of subgrade reaction is usually
determined in field-study form and through the plate loading test. One of the influential
parameters in the modulus of subgrade reaction is the size of the particles and aggregates.
The present research has evaluated the effect of particle size on the modulus of subgrade
reaction using numerical simulation and discrete element method. To this aim, samples with
completely identical granulation conditions as well as samples with relatively uniform
granulation, having finite particle range were modeled in different sizes and stress-
displacement variations were measured in them through the discrete element method. Given
the uniformity of type and shape of the aggregates, the results of the numerical modeling
show that the medium size has a direct relationship with the modulus of subgrade reaction
of the sand; specifically, in the high percentage density, increase in size of the aggregates
greatly increases the modulus of subgrade reaction. These variations are almost linear in
completely uniform aggregates and show a relatively logarithmic process in samples with a
limited size range.
1. Introduction
The modulus of subgrade reaction implies the elastic
behavior of the soil under loading by flexible foundation.
This parameter is generally defined by the results of plate
load test as follows
𝐾𝑆 =𝑞
𝑠 (1)
where q and s are the stress on the plate and vertical
deformation of the rigid plate, respectively [1]. In flexible
foundation analysis theories, such as the beam on elastic
foundation and Winkler’s model, the modulus of subgrade
reaction is proposed as the soil’s resilience coefficient in a
semi-infinite environment [2]. This parameter is generally
determined using the plate load test and based on ASTM
D1194 standard. Biot presented an experimental relationship
for the modulus of subgrade reaction wherein the mentioned
coefficient depends on elastic parameters, stiffness of the
loaded beam and the underlying soil [3]. Terzaghi has
evaluated the modulus of subgrade reaction and the
conditions influential in employing it to interfere the
flexibility of foundation on the soil. The role of parameters
such as shape of the plate, flexibility and also the depth of its
Corresponding Author:
E-mail address: [email protected]
Received: 12 June 2017; Accepted: 18 September 2017
deployment in the reaction module has been studied.
Terzaghi showed that the modulus of subgrade reaction is
reduced with increase in width of the plate [4]. Selvadurai
has studied the loading effect zone in a flexible plate [5].
Also, Vesic' has studied the geometric effect of loading on
the modulus of subgrade reaction [6]. Makhlouf and Stewart
have evaluated the factors affecting the stiffness and
elasticity modulus of the dry sand [7]. Okeagu and Abdel-
Sayed have conducted a study on determining the factors
affecting normal modulus of subgrade reaction for the
flexible surface conduits [8]. Also, some analyses have been
done using the finite element method under this condition.
The results obtained by these researchers showed that the soil
reaction coefficients significantly depend on loading
conditions, the distance between the openings, depth of the
soil and loading direction. Ismael has studied the coefficient
of subgrade reaction on desert sand for the flexible footing
[9]. Lin et al., have also evaluated the modulus of subgrade
reaction and stiffness features of the sandy coarse-
aggregated soils in form of studying the deformability
behavior [10]. Daloglu, and Vallabhan proposed a method
to evaluate the equal modulus of subgrade reaction for use in
Winkler’s model [11]. That study has proposed graphs

Ahmadi and Farzi Sizkow - Comput. Res. Prog. Appl. Sci. Eng. Vol. 03(03), 115-122, September 2017
116
through which value of the equivalent subgrade reaction
modulus can be determined using the geometric
characteristics and system’s condition. Moayedi and Naeini
have evaluated the subgrade reaction modulus in gravely
soils based on the results from the in-situ Standard
Penetration Test (SPT) [12]. The results which have been
conducted on coarse-aggregated sediments of Tehran show
the relationship among the two in-situ tests of SPT and PLT.
Dey and Basudhar (2008) investigated flexible behavior of
the beams and the foundations on a coarse sandy bed. In
those studies, the role of Ks in flexible foundations was
analyzed based on Winkler’s spring theory and the standard
four-element viscoelastic Burger model [13]. Meshkat
(2007) has evaluated the influence of loading scale and
direction on response coefficient of the foundation using the
plate load test [14]. Also, Ahmadi and Meshkat (2008) have
studied the subgrade reaction modulus variations with
foundation’s dimensions and proposing a relationship for
Tehran’s soil using the plate load test [15].
Present research tries to evaluate the influence of size of
granular soil particles on the subgrade reaction modulus and
soil stiffness by analyzing the soil’s granular behavior. To
this aim, the discrete element method was used and the
results from numerical simulation were validated using the
results of the physical modeling done on Anzali sand.
2. Discrete Element Method
Discrete Element Method (DEM) is a set of numerical
techniques specifically used to model the behavior of the
discrete systems such as the granular environments. Discrete
element method was first introduced by Cundall in 1971 [16]
to simulate the behavior of the interlocking rocks and then
developed by Cundall and Strack in 1979 [17] for the
granular products. In recent years, use of discrete element
method to simulate the microstructure behavior of the
granular materials such as sand has been greatly expanded.
Especially, many improvements have been made in
simulating the laboratory tests such as direct shear test [18-
20], triaxial test [21, 22], true triaxial test [23], cycle triaxial
test [24], cycle loading [25], hollow cylindrical torsional test
[26] and oedometer consolidation test [27]. In other
geothechnical issues, researches by Cleary and Campbel
(1993), He et al. (2010) and Jiang and Murakami (2012) in
analysis of landslide and stability of the grider [28], Cleary
(2000) in analysis of excavation [29], as well as El Shamy
and Zamani (2011) [30] to investigate the seismic response
of the surface foundations considering the soil-foundation-
structure interaction [30], can also be mentioned.
A discrete element simulation system is generally
composed of four main components including component
display, call detection, physics and visualization [31].
compared to finite element and finite volume methods,
discrete element method is a non-mesh method which solves
the numerical problems considering mechanical properties
of a particle and mathematical calculations on it. Interaction
between the components is done only through the contact
points. Thus, little equations must be solved for each
element. Therefore, forces and displacements for each
particle wherever in the system can be followed and
examined separately. But, due to very large number of the
particles for a real problem modelling and therefore, the very
high operating volumes, it is often not possible to take actual
dimensions for a particle and different parameters of the
problem will have changes in scale. In the analysis using the
discrete element method, two basic rules will govern:
1. The law of motion (Newton’s second law),
2. Force displacement law.
The law of motion applies to every particle and includes
force and momentum. The force displacement law is applied
to every contact and observes the rules of continous
environments while obsrving the relative motion. The
contact forces can be solved in form of Fn normal forces and
Fs tangent forces in equilibrium equations through providing
a resistence by locating a set of springs and dampers. There
are several models for analyzing the contact mechanics. The
linear and contact model of Hertz-Mindelin are appropriate
models for non-cohesive granular materials and these models
are used for many of the discrete element method codes for
such issues. Figure 1 shows the components of linear model
(a) and Hertz-Mindelin contact model (b) schematically. The
linear method is in fact the extention of Hertz-model by
Cundall (1979) which is a simple and quick solution in the
calculations. In this model, relative forces and displacements
are associated by the fixed contact stiffness among the two
particles. While in Hertz-Mindelin contact model, the
relative forces and displacements establish a non-linear
connection in form of unstable contact stiffness which is a
function of geometric properties and type of the materials
and the connection is made by placing a series of springs and
dampers in the contact area.
a) b)
Figure 1. Schematic view of the components of linear model (a) and Hertz-Mindelin contact model (b)
Ahmadi and Farzi Sizkow - Comput. Res. Prog. Appl. Sci. Eng. Vol. 03(03), 115-122, September 2017
117
3. Formulation of Discrete Elements
In the studied environment, the sand particles are under
the gravity forces and the contact forces among the
particles. Hence, the equations of motion and momentum
are defined in Eqs. (2) and (3) to describe the motion of a
discrete particle [32]
𝑚𝑝�̈�𝑝 = 𝑚𝑝𝑎𝑔 + ∑ 𝑓𝑐𝑁𝑐𝑝
𝑐=1 (2)
𝐼𝑝̈𝑝 = ∑ 𝑟𝑐 × 𝑓𝑐𝑁𝑐𝑝
𝑐=1 (3)
where �̈�𝑝 is the transitional displacement, ̈𝑝 is the
rotational displacement and 𝑚𝑝 is mass of the pth particle,
fc is the interparticle force, rc is the distance from center of
the mass to the contact point at the cth contact surface and
Ncp is the number of contacts around the particles. Also, 𝑎𝑔
is the gravitational acceleration vector. The interparticel
force at contact is consisted of two components of normal
and tangential (shear) and can be written as Eq. (4)
𝑓𝑝 = 𝑓𝑝𝑛 + 𝑓𝑝
𝑠 (4)
where 𝑓𝑝𝑛 and 𝑓𝑝
𝑠 are the normal and shear components of
the interparticle force, respectively which are obtained from
the following relations
𝑑𝑓𝑛 = (𝐾𝑛𝑑𝑢𝑛 + 𝐶𝑛𝑑�̇�𝑛)𝑛 (5)
𝑑𝑓𝑠 = (𝐾𝑠𝑑𝑢𝑠 + 𝐶𝑠𝑑�̇�𝑠) (6)
So that, the normal unit vector and the n and s
superscripts respectively represent normal and shear
components.
The maximum pressure among the particles 𝑝𝑚𝑎𝑥, is
determined using Eqs. (7) and (8) considering the contact
surface radios of 𝑎 and normal force of 𝑓𝑛 [33]
𝑝𝑚𝑎𝑥 =3𝑓𝑛
2𝜋𝑎2 (7)
If there is no adherence,
𝑓𝑛 =4𝐸𝑒𝑞
3𝑅𝑒𝑞𝑎3 (8)
where Eeq and Req respectively are the equivalent elastic
module and the equivalent radios. The total normal
displacement is also obtained from Eq. (9)
𝛿𝑛 =𝑎2
𝑅𝑒𝑞 (9)
The following equation (Eq. (10)) is established
between the normal force and displacements
𝑓𝑛 = −𝐾𝑛(𝛿𝑛)3/2 (10)
Also, the normal elastic constant 𝐾𝑛 from the equivalent
parameters of the two adjacent particles is also in Eq. (11)
𝐾𝑛 =4
3𝐸𝑒𝑞√𝑅𝑒𝑞 (11)
True tangent force 𝛿𝑠 is calculated considering the
previous tangent force 𝛿𝑠0 and tangential displacement
changes 𝛿𝑠 − 𝛿𝑠0by the tangential stiffness (Eq. (12) and
Eq. (13).
𝑓𝑠 = 𝑓𝑠0 + 𝐾𝑠(𝛿𝑠 − 𝛿𝑠0) (12)
𝐾𝑠 = 𝐾𝑠0 (1 −2
3𝐾𝑠0𝛿𝑠
𝜇𝑓𝑛 )
1/2
(13)
where 𝜇 is the friction coefficient. With the equivalent shear
stiffness of Eeq, equivalent radius of Req and the true normal
displacement of 𝛿𝑛 we have
𝐾𝑠0 = 8𝐺𝑒𝑞√𝑅𝑒𝑞𝛿𝑛 (14)
in another way, since the stress-displacement relation in the
true normal force is uniqe, we have
𝐾𝑠 = 𝐾𝑠0 (1 −𝑓𝑠
𝜇𝑓𝑛)1/3
(15)
𝐾𝑠 = 8𝐺𝑒𝑞𝜃𝛿𝑛 ± 𝜇(1 − 𝜃)∆𝑓𝑛
∆𝛿𝑛 (16)
where the negative sign is for loading conditions. Whenever
|𝐹𝑠| ≤ 𝜇|𝐹𝑛|, the 𝜃 parameter will equal 1. The maximum
tangential stress limit in fact follows the Coulomb’s Friction
Law.
|𝐹𝑠| ≤ 𝜇|𝐹𝑛| (17)
In the above equations, the equal normal and shear
stiffness constants are determined through the Eq. (18) and
Eq. (19)
1
𝐸𝑒𝑞=
1−𝜈𝑖2
𝐸𝑖+
1−𝜈𝑗2
𝐸𝑗 (18)
1
𝐺𝑒𝑞=
2−𝜐𝑖
𝐺𝑖+
2−𝜐𝑗
𝐺𝑗 (19)
4. Numerical Analysis
4.1. Modelling Conditions
In this study, Itasca PFC3D version 5 software was used
to investigate the strsee-displacement variation of the sand
in different particle sizes. This software is a discrete element
method code which models the particles and borders based
on definition of the balls and the walls. The commnds
required for madelling are applicable using the FISH
programming language [34]. In modelling, the particles are
considered in rigid form but can overlap.
4.2 Input Parameters
In modelling the plate load test on a sandy soil under
staged loading, a small scale sample is used to reduce the
computational time. Thus, the space size of the model is 100
(length), 100 (width) and 110 (height) mm and the
foundation is a square with a side about 8.16 mm (Figure 2)
which however, height of the sample will be lower than
height of the container after reaching the equilibrium.
Number of the balls used in each modelling condition has
been determined based on size of the articles and its prosity
amount. 27 clamps (mass) has also been used to apply the
gravitational load, so that weight of the clams is increased
in each stage.

Ahmadi and Farzi Sizkow - Comput. Res. Prog. Appl. Sci. Eng. Vol. 03(03), 115-122, September 2017
118
Figure 2. Schematic view of the produced model
The lateral walls are included in form of periodic
boundaries and vertical loading is performed after
equilibrium of the initial conditions of the sample in stage
form. Considering the minimization done, the scale of other
parameters and units has been calculated based on the
results from Iai et al. [35]. Accordingly, the strain scale
factor is determined from the Eq. (20)
𝜇 = 𝜇 ((𝑉𝑠)𝑚
(𝑉𝑠)𝑝)
2
(20)
where in, 𝜇 is the length scale factor and (Vs)m and (Vs)p are
shear wave velocity of earth deposits respectively for the
model and the actual conditions considered for model
testing on loose sand 𝜇 = 1 according to the
recommendation of Iai et al. [34]. In this way, 𝜇 length scale
factor, density 𝜇𝜌 and strain 𝜇 have been considered to be
1/6, 1 and 1, respectively. By applying these factors, the
values used in input parameters are given in form of Table
1. The normal stiffness value, based on the measurement
values and the performed calibration has been considered
by Ahmadi et al. [35] for Anzali Sand and applied for all
samples with similar density indexes in equal form, in order
to study the influence of particle size.
Table 1. Input parameters for DEM simulation
Parameter Value
Assembly of particles
Diameter variable
Normal stiffness 5×10⁵ N/m
Shear stiffness 5×10⁵ N/m
Normal critical damping ratio 0.1
Shear critical damping ratio 0.0
Friction coefficient 5.0
Density 2660 kg/cm3
Porosity 0.38 to 0.43
Boundary conditions (walls)
Normal stiffness 1010 N/m
Shear stiffness 1010 N/m
Friction coefficient 0.5
5. Laboratory Evaluation
5.1. Laboratory Equipments
The device used to perform a static loading test , in order
to assess the sand settlement conditions, includes a rigid and
cube-shaped box maesuring 60 × 60 cm in the plan and
about 60 cm height located on a steel frame. One side of the
cubic box is made of a plexiglass plate and in transparent
form. A hydroloc loading jack is installed on the device to
apply vertical load which includes a vertical displacement
gauge (LVDT) to measure the magnitude of the
deformation in the sample level. Force exercise planning
has been done in a way that the test can be carried out both
by stress control and strain control. In these tests, loading
was performed in form of strain control. The device
includes a digital data logger which can record the load
values and deformations. The lower plate for applying
uniform stress to the sample is square-shaped, completely
rigid with a 10×10 size in the plan. Figure 3 shows a view
of the loading box used in this study.
Figure 3. Image of the loading box apparatus
5.2. Characteristics of Soil
This study has used Anzali sand as a criterion of
geotechnical parameters in numerical modelling. The major
soils forming Anzali are the fine-aggregated and uniform
sand. The geotechnical studies carried out in many of these

Ahmadi and Farzi Sizkow - Comput. Res. Prog. Appl. Sci. Eng. Vol. 03(03), 115-122, September 2017
119
areas have confirmed this issue to a great depth [36]. The
existing sand are generally quiet uniform, fine-aggregated
to very fine-aggregated with a densification from loose to
medium. This has been confirmed According to the
geotechnical studies conducted in many of these areas and
to a great depth. It can be said that the typical Anzali sand
has a D50 around 0.2 to 0.3 mm and in a bad-aggregated
form, it includes a very narrow range of particle size. Also,
studies on shear strenght of Anzali sand showed that for a
clean sand with solidation stress of 150 kPa, the friction
angle corresponding to the steady state resistence is about
30 degrees which is decreased with a 20 percent increase in
amount of fine-aggregated material (silt) by about 26
degrees. The soil used is a relatively uniform fine-
aggregated sand of Anzali which has typically covered
many of the subsurface layers in coastal city of Anzali. Sand
aggregation has been shown in Figure 4 and typical
specifications of the soil used in the tests are shown in Table
2.
Figure 4. Grain size distribution of Anzali sand
Table 2. Some specifications of Anzali sand
Parameter Value
Classification (USCS) SP
Coefficient of uniformity (Cu) 2.28
Coefficient of curvature (Cc) 1.11
Specific gravity (Gs) 2.66
Maximum void ratio (emax) 0.83
Minimum void ratio (emin) 0.57
Average grain size (D50) 0.24mm
Effective grain size (D10) 0.12mm
5.3. Comparison of Laboratory Results and Numerical
Simulation
In order to verify the accuracy of the results obtained
from numarical modeling, the results of loading the
laboratory plate performed on Anzali sand was compared to
similar conditions simulated by PFC3D. Figure 5 shows the
comparison of the results obtained from numerical
simulation of Anzali sand under gravity loading by the
discrete element method with the results tested on Anzali
sand by a physical modeling apparatus. The sand density
condition has been applied to the laboratory sample in a loos
condition, with a relative density of about 30 percents for
the sample and similarly, a porosity around 0.42 is
considered in DEM analysis. Comparison of the results
shows that the applied method has a good accuracy for
predicting stress-displacement behaviour of the sandy soil.
Figure 5. Comparison of laboratory results and numerical
simulation on loose sand
6. Analysis of the Results
In order to investigate the effect of size on the modulus of
subgrade reaction, the modelling has been done in two
aggregation modes and each in two conditions of loos and
dense. In the first stage, only the aggregates with the same
size were used. Based on the scale used for Anzali sand, in
this case, real size of the sand has been considered 0.2, 0.5,
1.0 and 1.5 mm and has been simulated with the same
previous scale in PFC3D. In the latter case, the aggregates
are considered relatively uniform and for aggregation
ranges in sizes of 0.1 to 0.3, 0.3 to 0.50, 0.4 to 0.8 and 0.8
to 1.6 mm. In loose conditions, the samples are made with
a porosity of n=0.38. Table 3 shows the size characteristics
of each sample and also the number of particles obtained in
different conditions in the simulation.
The results from modeling the samples have been shown
in form of a stress variation diagram based on vertical
displacement of the loading plate in Figures 6 and 7 for the
samples with completely identical sizes and Figures 8 and 9
for the samples with relatively uniform dimensions.
Considering the loading in simulation, DEM has been done
in form of stress control (stepwise stress). As expected, the
samples with lower hollowwness (n=0.38) have had the
ability of larger loads and in loos samples with less stresss
the sample has become unstable.
Figure 6. Variations of stress-displacement for completely equal
sizes on loose condition from DEM

Ahmadi and Farzi Sizkow - Comput. Res. Prog. Appl. Sci. Eng. Vol. 03(03), 115-122, September 2017
120
Table 3. Size characteristics of samples for DEM analysis
Number of particles Apparent Density Particle size in model(mm) Real size (mm) Particle size property Sample No.
533986 Loose 0.6 0.2 equal size 1
34175 Loose 1.5 0.5 equal size 2
4271 Loose 3.0 1 equal size 3
1265 Loose 4.5 1.5 equal size 4
561606 Dense 0.6 0.2 equal size 5
35942 Dense 1.5 0.5 equal size 6
4492 Dense 3.0 1 equal size 7
1331 Dense 4.5 1.5 equal size 8
426381 Loose 0.3 – 0.9 0.1 – 0.3 relatively uniform 9
62778 Loose 0.9 – 1.5 0.3 – 0.5 relatively uniform 10
17834 Loose 1.2 – 2.4 0.4 – 0.8 relatively uniform 11
2227 Loose 2.4 – 4.8 0.8 – 1.6 relatively uniform 12
449349 Dense 0.3 – 0.9 0.1 – 0.3 relatively uniform 13
65845 Dense 0.9 – 1.5 0.3 – 0.5 relatively uniform 14
18665 Dense 1.2 – 2.4 0.4 – 0.8 relatively uniform 15
2324 Dense 2.4 – 4.8 0.8 – 1.6 relatively uniform 16
Figure 7. Variations of stress-displacement for completely equal
sizes on dense condition from DEM
Figure 8. Variations of stress-displacement for relatively uniform
sizes on loose condition from DEM
Based on definition of subgrade reaction modulus,
gradient of the stress-displacement diagram has been
determined, the results of which for different samples are
shown in figures 10 and 11, respectively for the samples
with quit similar sizes and samples with relatively similar
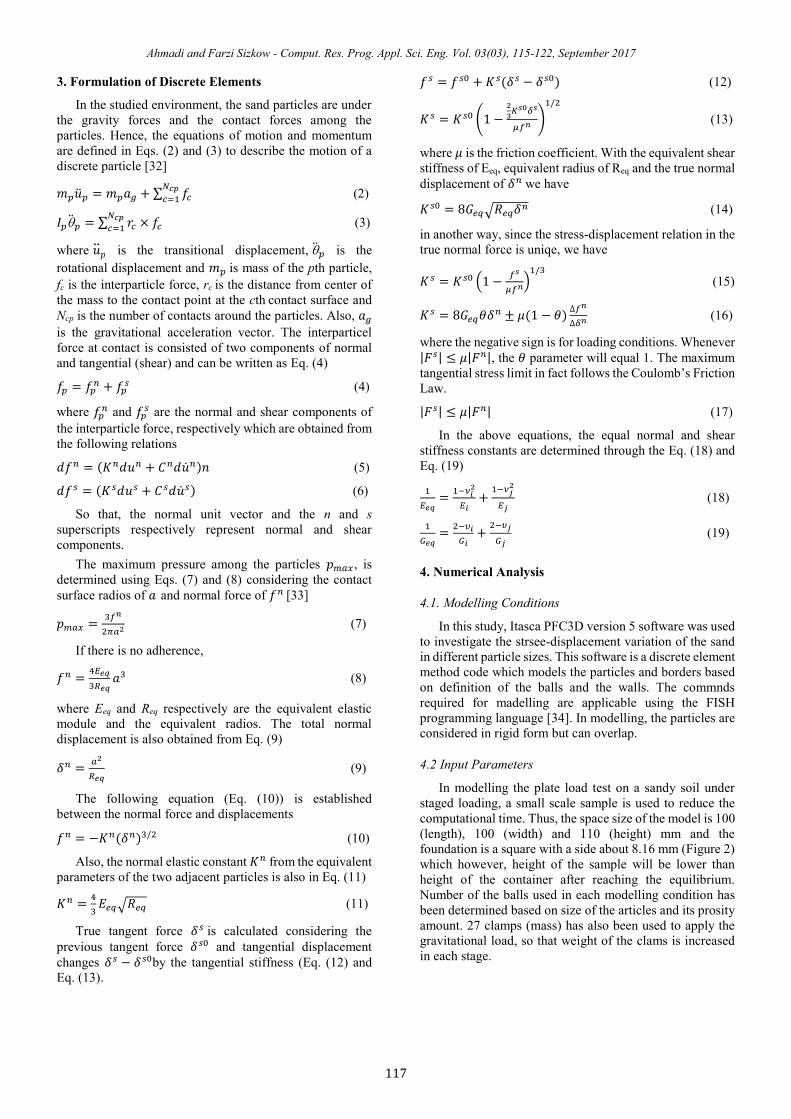
sizes. Based on the obtained results, in samples with quite
equal sizes, increase in size of the aggregates from 0.2 mm
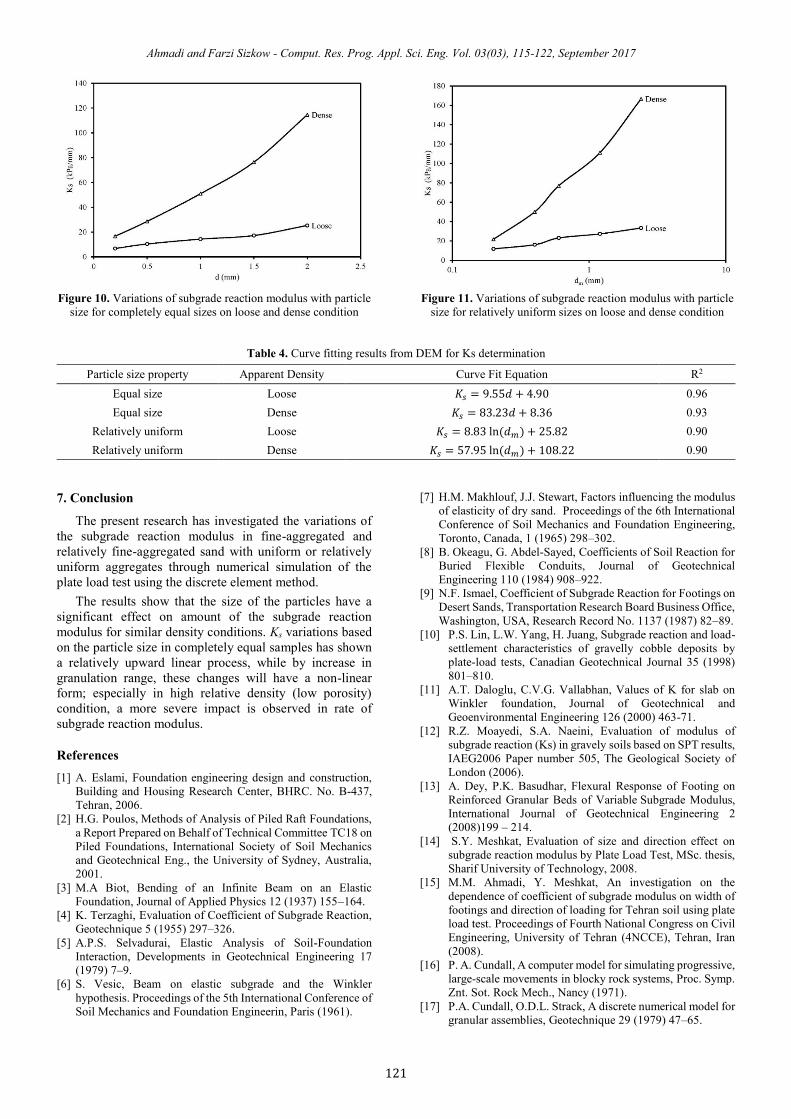
to 1.5 mm results in a 2.5 fold increase in Ks. In semi-
uniform fine-aggregated samples with aggregation interval,
by growth in medium size of the particles from 0.2 to 1.2
mm we observe a 5-fold increase in Ks for dense conditions.
Also, the results show that although in both cases, increase
in size of the aggregates results in increase in amount of
subgrade reaction modulus, process of this increase is
different in various situations. For the samples with
completely equal sizes, a relatively linear relationship can
be observed among Ks and the particle diameter (d).
Although various fittings have shown that Ks variations with
particle diameter (d) for the samples with completely equal
sizes in form of a exponential function have higher
correlation coefficients but up to a size around 1.5 mm,
linear relationship has also a high correlation. However, in
relatively uniform fine-aggregated samples with a
aggregation interval, the relationship among increase in Ks
with average particle diameter (dm) is not linear and has a
roughly logarithmic process. Table 4 shows the fited
relationships for different granulation and consendation
conditions and also the correlation coefficients for each one.
In these relationships, Ks is based on KPa/mm and d and dm
are based on mm. Therefore, it is expected that in addition
to the fact that size of the particles is a very effective
paraemeter in soil stiffness under axial loading, aggregate
distribution can also have a decisive role in value of this
parameter. Since size of the sand particles in nature is not
quite equal and uasually has a granulation interval (although
limitted), it is expected that variations of subgrade reaction
modulus based on medium particle size have an upward and
linear process and especially in the samples with a higher
relative density, intensity of these variations will be more in
fine-aggregated samples.
Figure 9. Variations of stress-displacement for relatively uniform
sizes on dense condition from DEM
Ahmadi and Farzi Sizkow - Comput. Res. Prog. Appl. Sci. Eng. Vol. 03(03), 115-122, September 2017
121
Figure 10. Variations of subgrade reaction modulus with particle
size for completely equal sizes on loose and dense condition
Figure 11. Variations of subgrade reaction modulus with particle
size for relatively uniform sizes on loose and dense condition
Table 4. Curve fitting results from DEM for Ks determination
R2 Curve Fit Equation Apparent Density Particle size property
0.96 𝐾𝑠 = 9.55𝑑 + 4.90 Loose Equal size
0.93 𝐾𝑠 = 83.23𝑑 + 8.36 Dense Equal size
0.90 𝐾𝑠 = 8.83 ln (𝑑𝑚) + 25.82 Loose Relatively uniform
0.90 𝐾𝑠 = 57.95 ln (𝑑𝑚) + 108.22 Dense Relatively uniform
7. Conclusion
The present research has investigated the variations of
the subgrade reaction modulus in fine-aggregated and
relatively fine-aggregated sand with uniform or relatively
uniform aggregates through numerical simulation of the
plate load test using the discrete element method.
The results show that the size of the particles have a
significant effect on amount of the subgrade reaction
modulus for similar density conditions. Ks variations based
on the particle size in completely equal samples has shown
a relatively upward linear process, while by increase in
granulation range, these changes will have a non-linear
form; especially in high relative density (low porosity)
condition, a more severe impact is observed in rate of
subgrade reaction modulus.
References
[1] A. Eslami, Foundation engineering design and construction,
Building and Housing Research Center, BHRC. No. B-437,
Tehran, 2006.
[2] H.G. Poulos, Methods of Analysis of Piled Raft Foundations,
a Report Prepared on Behalf of Technical Committee TC18 on
Piled Foundations, International Society of Soil Mechanics
and Geotechnical Eng., the University of Sydney, Australia,
2001.
[3] M.A Biot, Bending of an Infinite Beam on an Elastic
Foundation, Journal of Applied Physics 12 (1937) 155–164.
[4] K. Terzaghi, Evaluation of Coefficient of Subgrade Reaction,
Geotechnique 5 (1955) 297–326.
[5] A.P.S. Selvadurai, Elastic Analysis of Soil-Foundation
Interaction, Developments in Geotechnical Engineering 17
(1979) 7–9.
[6] S. Vesic, Beam on elastic subgrade and the Winkler
hypothesis. Proceedings of the 5th International Conference of
Soil Mechanics and Foundation Engineerin, Paris (1961).
[7] H.M. Makhlouf, J.J. Stewart, Factors influencing the modulus
of elasticity of dry sand. Proceedings of the 6th International
Conference of Soil Mechanics and Foundation Engineering,
Toronto, Canada, 1 (1965) 298–302.
[8] B. Okeagu, G. Abdel-Sayed, Coefficients of Soil Reaction for
Buried Flexible Conduits, Journal of Geotechnical
Engineering 110 (1984) 908–922.
[9] N.F. Ismael, Coefficient of Subgrade Reaction for Footings on
Desert Sands, Transportation Research Board Business Office,
Washington, USA, Research Record No. 1137 (1987) 82–89.
[10] P.S. Lin, L.W. Yang, H. Juang, Subgrade reaction and load-
settlement characteristics of gravelly cobble deposits by
plate-load tests, Canadian Geotechnical Journal 35 (1998)
801–810.
[11] A.T. Daloglu, C.V.G. Vallabhan, Values of K for slab on
Winkler foundation, Journal of Geotechnical and
Geoenvironmental Engineering 126 (2000) 463-71.
[12] R.Z. Moayedi, S.A. Naeini, Evaluation of modulus of
subgrade reaction (Ks) in gravely soils based on SPT results,
IAEG2006 Paper number 505, The Geological Society of
London (2006).
[13] A. Dey, P.K. Basudhar, Flexural Response of Footing on
Reinforced Granular Beds of Variable Subgrade Modulus,
International Journal of Geotechnical Engineering 2
(2008)199 – 214.
[14] S.Y. Meshkat, Evaluation of size and direction effect on
subgrade reaction modulus by Plate Load Test, MSc. thesis,
Sharif University of Technology, 2008.
[15] M.M. Ahmadi, Y. Meshkat, An investigation on the
dependence of coefficient of subgrade modulus on width of
footings and direction of loading for Tehran soil using plate
load test. Proceedings of Fourth National Congress on Civil
Engineering, University of Tehran (4NCCE), Tehran, Iran
(2008).
[16] P. A. Cundall, A computer model for simulating progressive,
large-scale movements in blocky rock systems, Proc. Symp.
Znt. Sot. Rock Mech., Nancy (1971).
[17] P.A. Cundall, O.D.L. Strack, A discrete numerical model for
granular assemblies, Geotechnique 29 (1979) 47–65.
Ahmadi and Farzi Sizkow - Comput. Res. Prog. Appl. Sci. Eng. Vol. 03(03), 115-122, September 2017
122
[18] Thornton, L. Zhang, Numerical Simulations of the Direct
Shear Test, Chemical Engineering & Technology 26 (2003)
153–156.
[19] J. Wang, M. Gutierrez, Discrete element simulations of
direct shear specimen scale effects, Geotechnique 60 (2010)
395–409.
[20] M. Hazeghian, A. Soroush, DEM simulation of reverse
faulting through sands with the aid of GPU computing,
Computers and Geotechnics 66 (2015) 253–263.
[21] L. Cui, C. O’Sullivan, S. O’Neill, An analysis of the triaxial
apparatus using a mixed boundary three-dimensional
discrete element model, Geotechnique 57 (2007) 831–844.
[22] J. de Bono, G. McDowell, D. Wanatowski, Discrete element
modelling of a flexible membrane for triaxial testing of
granular material at high pressures, Géotechnique Letters 2
(2012) 199–203.
[23] S.A.G. Torres, D.M. Pedroso, D. J. Williams, H.B.
Mühlhaus, Strength of non-spherical particles with
anisotropic geometries under triaxial and shearing loading
configurations, Granular Matter 15 (2013) 531–542.
[24] N.S. Nguyen, S. François, G. Degrande, Discrete modeling
of strain accumulation in granular soils under low amplitude
cyclic loading, Computers and Geotechnics 62 (2014) 232–
243.
[25] M. Hu, C. O’Sullivan, R.R. Jardine, M. Jiang, Study on the
Deformation of Loose Sand under Cyclic Loading by DEM
simulation. GeoShanghai 2010 International Conference,
Shanghai, June 3–5 (2010).
[26] N. Ravichandran, B. Machmer, H. Krishnapillai, K. Meguro,
Micro-scale modeling of saturated sandy soil behavior
subjected to cyclic loading, Soil Dynamics and Earthquake
Engineering 30 (2010) 1212–1225.
[27] J. de Bono, G. McDowell, An insight into the yielding and
normal compression of sand with irregularly-shaped
particles using DEM, Powder Technology 271 (2015) 270–
277.
[28] M. Jiang, A. Murakami, Distinct element method analyses
of idealized bonded-granulate cut slope, Granular Matter 14
(2012) 393–410.
[29] P.W. Cleary, DEM simulation of industrial particle flows:
case studies of dragline excavators, mixing in tumblers and
centrifugal mills, Powder Technology 109 (2000) 83–104.
[30] U. El Shamy and N. Zamani, Discrete element method
simulations of the seismic response of shallow foundations
including soil‐foundation‐structure interaction, International
Journal for Numerical and Analytical Methods in
Geomechanics 36 (2011) 1303–1329.
[31] R.M. O'Connor, J.R. Torczynski, D.S. Preece, J.T. Klosek,
J.R. Williams, Discrete element modeling of sand
production, International Journal of Rock Mechanics and
Mining Sciences 34 (1997) 3–4.
[32] G. Lian, C. Thornton and D. Kafui, Trubal: A 3-D computer
program for modeling particle assemblies. Aston university,
1994.
[33] K.L. Johnson, Contact Mechanics. Cambridge University
Press, 1985.
[34] Itasca Particle Flow Code, PFC3D, ver 5.00, Itasca
Consulting Group, Inc (2014).
[35] S. Iai, T. Tobita, T. Nakahara, Generalised scaling relations
for dynamic centrifuge tests, Geotechnique 55 (2005) 355–
362.
[36] H. Ahmadi, A. Eslami, M. Arabani, Characterization of
sedimentary Anzali sand for static and seismic studies
purposes, International Journal of Geography and Geology
4 (2015) 155–169.