numerical modelling of bed sorting and armouring in
TRANSCRIPT
14th International Symposium on River Sedimentation, September 16-19, 2019, Chengdu, China
Numerical Modelling of Bed Sorting and Armouring in Meandering Channels -
Applications from the East Fork Lewis River - Ridgefield Pits Area, USA
Shuang Gao*1, Mitchell Smith1, Ian Teakle1, Keith Marcoe2 and Paul Kolp2
1 BMT Eastern Australia, Australia
2 The Lower Columbia Estuary Partnership, USA
* e-mail: [email protected]
Abstract
A multiple sediment fraction module was developed to predict bed morphological change with
allowances for bed sorting and armouring. Meyer-Peter Müller’s equation is applied to predict the
scale of bedload for bed materials of different grain sizes. In order to assess the impact of bed sorting
and armouring the model assumes that the river bed consists of two layers: (1) a surface exchange layer
that can coarsen and regulate the supply of different sediment fractions based on the sediment
composition; and (2) a sub-surface layer that supplies sediments as the surface layer is eroded. The
model was validated against existing publications of lab-scale and field experiments. The modelled
results show agreement with the experimental data, indicating the model is capable of predicting the
morphological changes with the consideration of the sorting of bed materials. The model was then
applied to estimate the potential for channel stability, including patterns of aggradation and degradation
in a reach of the East Fork River, Oregon, USA.
Keywords: Numerical modelling, river morphology, bed sorting, bed armouring, TUFLOW FV
1 Introduction
Natural river bed materials typically consist of sediment mixtures comprising different grain sizes
and sediment types. In a meandering river, coarse materials tend to exist near outer banks while finer
sands and silts settle near the inner banks. Both bed armouring and sediment sorting play a key role in
this redistribution of sediments. To reliably estimate sediment transport rates and long-term river
morphology it is necessary that the underlying transport models include these processes.
Various sediment transport formulae have been developed to estimate the scale of
suspended/bedload transports based on both experimental data and theoretical considerations (Meyer-
Peter and Müller, 1948; Ashida and Mitchiue 1971; van Rijn 2007a, 2007b) and these formulae have
been widely applied in numerical models. Ashida et al (1990) conducted a lab scale experiment to
study bed sorting behavior in a meandering channel and applied a depth-averaged shallow water model
to predict the bed morphology. Maeshima et al (2011) later carried out field experiments in a straight
and curving channel, and applied a quasi-3D shallow water model to simulate the bed morphology
under the influence of strong secondary currents. These well controlled experimental studies have also
provided valuable verification data for developing numerical models to predict fluvial sediment
transport and morphological processes.
With advancements in computational power 3D modelling has become increasingly efficient and
accessible to examine complex river flow behavior. Here the 3D numerical engine TUFLOW FV is
applied to model the hydrodynamics coupled with a sediment transport module resolving multiple
sediment fractions in order to predict changes in bed morphology. The model is validated against the
two experimental datasets of Ashida and Maeshima and then applied to real world case study to
estimate the potential for channel stability, including patterns of aggradation and degradation, in a
reach of the East Fork Lewis River, Washington USA.

14th International Symposium on River Sedimentation, September 16-19, 2019, Chengdu, China
2 Numerical Model
2.1 Hydraulic Model
TUFLOW FV is a finite volume numerical engine that solves the conservative integral form of the
non-linear shallow water equations, including viscous flux terms and source terms (Guard et al, 2013).
For the present application a three-dimensional approach using sigma-coordinates was adopted to
consider the impact of secondary currents occurring in meandering channels. The standard k-ε closure
in GOTM, a generic one-dimensional water column turbulence model (http://www.gotm.net), was
employed for the parameterisation of vertical turbulent fluxes of momentum.
2.2 Bed Shear Stress
The bed shear stress predicted by the 3D hydraulic model is used to estimate the bedload transport
rate and the suspended sediment concentration:
𝜏𝑏𝑥 = 𝜌𝐶𝑏𝑢𝑏√𝑢𝑏2 + 𝑣𝑏
2 (1)
𝜏𝑏𝑦 = 𝜌𝐶𝑏𝑣𝑏√𝑢𝑏2 + 𝑣𝑏
2 (2)
where, τbx and τby are the bed shear stress in the Cartesian x and y direction, ρ is the density of water,
ub and vb are the velocity at the bottom cells, and Cb is the bottom drag coefficient calculated using a
roughness-length relationship:
𝐶𝑏 = (𝜅
𝑙𝑛(30𝑧′/𝑘𝑠))2
(3)
where, κ is the von Karman’s constant, z' is the height of the bottom cell above the bed level, and ks is
the effective bed roughness length.
2.3 Bedload
The bedload transport rate along the direction of the bed shear stress is estimated using the Meyer-
Peter and Müller equation:
Φ =𝑞𝑏
[𝑔(𝑠 − 1)𝑑2 ]1/2
= 8(𝜏∗ − 𝜏∗𝑐)1/2 (4)
where, Φ is the dimensionless bedload transport rate, qb is the bedload transport rate per unit width, g
is the gravity acceleration, s is the ratio of densities of sediment and water, d is the representative grain
size, τ* is the Shields parameter and the τ*c is the critical value of τ* at threshold of motion:
𝜏∗ =𝜏𝑏
𝑔𝜌(𝑠 − 1)𝑑 (5)
This study also employed Shimizu et al (1995)’s method to consider the impact of bed slope on the
direction of bedload transport. The bedload components in the direction of the bed shear stress �̂� and
perpendicular to the direction of the bed shear stress �̂� have the following relationship:
Φ = √Φ�̂�2 +Φ�̂�
2 (6)
with
Φ�̂�
Φ�̂�
= −√𝜏∗𝑐
𝜇𝑠𝜇𝑘𝜏∗
𝜕𝑧
𝜕�̂� (7)
where, µs and µk are the static and kinetic friction coefficient (assumed as 0.6 and 0.48, respectively)
and 𝜕𝑧/𝜕�̂� is the bed slope component perpendicular to bed shear stress direction.
2.4 Suspended Load
The suspended load transport rate is modelled using a standard 3D mass conservation equation, with
a sediment pickup rate of:
𝐸 = 𝑤𝑠𝐶𝑎 (8)

14th International Symposium on River Sedimentation, September 16-19, 2019, Chengdu, China
where, ws is the settling velocity, and Ca is the reference concentration close to the bed given by (van
Rijn 2007b).
2.5 Bed Sorting and Armouring
To assess the impact of the bed sorting and armouring the model assumes that the river bed consists
of two layers: (1) a surface exchange layer that can coarsen and regulate the supply of different
sediment fractions based on the sediment composition; and (2) a sub-surface layer that supplies
sediments as the surface layer is eroded (Figure 1). This idea is similar to Ashida et al (1990)’s
exchange layer method and the Active Layer Mixing Method used in HEC-RAS (Brunner, 2016).
Figure 1. An illustration of bed armouring process. (a) The surface layer consists of 50% of sands
and 50% of cobbles initially; (b) As the finer fraction is eroded, the sub-surface layer sediments are
pushed up to the surface layer proportionally to the sediment composition; (3) The surface layer
coarsens and regulates the supply of erodible fine sediment.
A discrete number of sediment fractions can be used to represent the bed material size distribution.
The bedload transport rates and pickup rates are calculated for each fraction using equations (6) ~ (8),
and adjusted proportionally based on the volumetric portion at the surface exchange layer Vs,i:
Φ𝑖′ = Φ𝑖
𝑉𝑠,𝑖∑𝑉𝑠,𝑖
(9)
𝐸𝑖′ = 𝐸𝑖
𝑉𝑠,𝑖∑𝑉𝑠,𝑖
(10)
where, Φi and Ei are the dimensionless bedload transport rate and pickup rate calculated by equations
(6) and (8) for each fraction assuming the bed is completely filled by one sediment fraction, while Φi'
and Ei' are those rates considering the supply of different sediment fractions based on the bed sediment
composition.
Finally, the bed elevation zb is changed based on the following equation:
(1 − 𝜆)𝜌𝑠𝜕𝑧𝑏
𝜕𝑡+
𝜕∑𝑞𝑏𝑖,𝑥′
𝜕𝑥+
𝜕∑𝑞𝑏𝑖,𝑦′
𝜕𝑦+ Σ(𝑤𝑠𝑖𝐶𝑏𝑖 − 𝐸𝑖
′) = 0 (11)
where, λ is the bed layer porosity, ρs is the density of bed material and Cb is the sediment concentration
at the bottom cell.
3 Model Verifications
3.1 Experiments
The sediment model was validated by comparing modelling results with two published experiments.
Ashida et al (1990) conducted a lab-scale experiment of a meandering channel with bed material
ranging from d10=0.5mm to d90=4mm. The experiment was started with a flat channel bed and was run
until the bed form reached steady state conditions. Maeshima et al (2011) carried out a field-scale
experiment in a straight and meandering channel with a trapezoidal cross section using a bed material
distribution closer to gravel-bed rivers (d10=1mm ~ d90=200mm). A low flow of 2.0 m3/s was applied
to form an initial bed elevation and material distribution and higher flows were applied consecutively.
The bed elevation was recorded between each run. The experimental conditions are summarised in

14th International Symposium on River Sedimentation, September 16-19, 2019, Chengdu, China
Table 1, the scales of the experimental flumes are illustrated in Figure 2, and the sediment size
distributions are presented in Figure 3.
Table 1. Summary of experimental and field conditions.
Study Case Flow Rate (l/s) Depth (cm) Median Grain Size (mm) Cell Size (m)
Ashida et al
(1990)
A1 1.2 1.65 1.74 0.03 * 0.02
A2 3.6 4.26 1.74 0.03 * 0.02
Maeshima et al
(2011)
M1 2.0 0.34 50 0.5 * 0.25
M2 3.2 0.56 50 0.5 * 0.25
M3 8.0 0.80 50 0.5 * 0.25
East Fork Lewis
River
E1 141.6 50 5~10
E2 588.9 50 5~10
Figure 2. Experimental channels of (a) Ashida et al (1990) and (b)Maeshima et al (2011)
Figure 3. (a) Sediment size distributions of the experimental and field studies. (b) Typical surface
and sub-surface layer of the East Fork Lewis River bed material.

14th International Symposium on River Sedimentation, September 16-19, 2019, Chengdu, China
For both model validations bed material was represented via a discrete number of sediment fractions
based on reported particle size distributions (refer Table 2). The modelled bed roughness length ks was
first calibrated to reproduce the water depths/levels reported in the experiments and was then applied
to the sediment transport calculations (Equation 3). Soulsby (1997)’s formula was used to estimate the
critical Shields parameters τ*c for the median grain size, and the Egiazaroff’s method (as described in
van Rijn 2007c) was used to determine τ*c for each grain size. The thickness of the surface exchange
layer was specified to be equivalent to the global d90. For Maeshima et al (2011)’s experiments an
idealised initial cross section was applied throughout the channel due to the lack of initial bed elevation
data.
Table 2. Representative sediment sizes used in the simulations
Ashida et al (1990)
Representative Size (mm) 0.7 1.3 1.74 2.5 4
Size Distribution (mm) < 1.1 1.1 - 1.5 1.5 - 2.0 2.5 - 3.0 > 3.0
Maeshima et al (2011)
Representative Size (mm) 2 10 50 100 200
Size Distribution (mm) < 6 6 - 25 25 - 75 75 - 150 > 150
EF Lewis River
Representative Size (mm) 2 25 50 100 -
Size Distribution (mm) < 8 8 - 32 32 - 64 64 - 256 -
3.2 Experimental Results Comparison to Ashida et al (1990)
Figure 4 and Figure 5 provide the measured and simulated results of bed elevation change for Cases
A1 and A2. Case A1’s flowrate of 1.2 l/s results in peak bed shear stresses only slightly exceeding the
critical shear stresses of the bed materials (0.8~2.0 N/m2). Case A2 with a higher flowrate of 3.6 l/s
results in stress of 1.6~6.2 N/m2, which are well above the critical values resulting in widespread
sediment movement and bed response. The model reproduced the locations of the maximum erosion
(near Φ=90° and 270°) and deposition (at Φ=0° ~ 90° and 180° ~ 270°) in Case A1. However, the
maximum erosion depth was underestimated, and the maximum deposition depth was overestimated.
This could be attributed to the accuracy of the empirical bedload formula near the threshold of motion.
On the other hand, the magnitudes of the erosion and deposition were well predicted in Case A2,
however, the position of maximum erosion occurred slightly downstream compared with the
experiment. This may indicate that the induced helical flow circulation is not sufficiently strong in the
model, however without velocity measurements this hypothesis could not be directly tested.

14th International Symposium on River Sedimentation, September 16-19, 2019, Chengdu, China
Figure 4. Measured and simulated bed elevation changes of Ashida et al (1990)’s experiment Case
A1. (a) Measured; (b) Simulated.
Figure 5. Measured and simulated bed elevation changes of Ashida et al (1990)’s experiment Case
A2. (a) Measured; (b) Simulated.
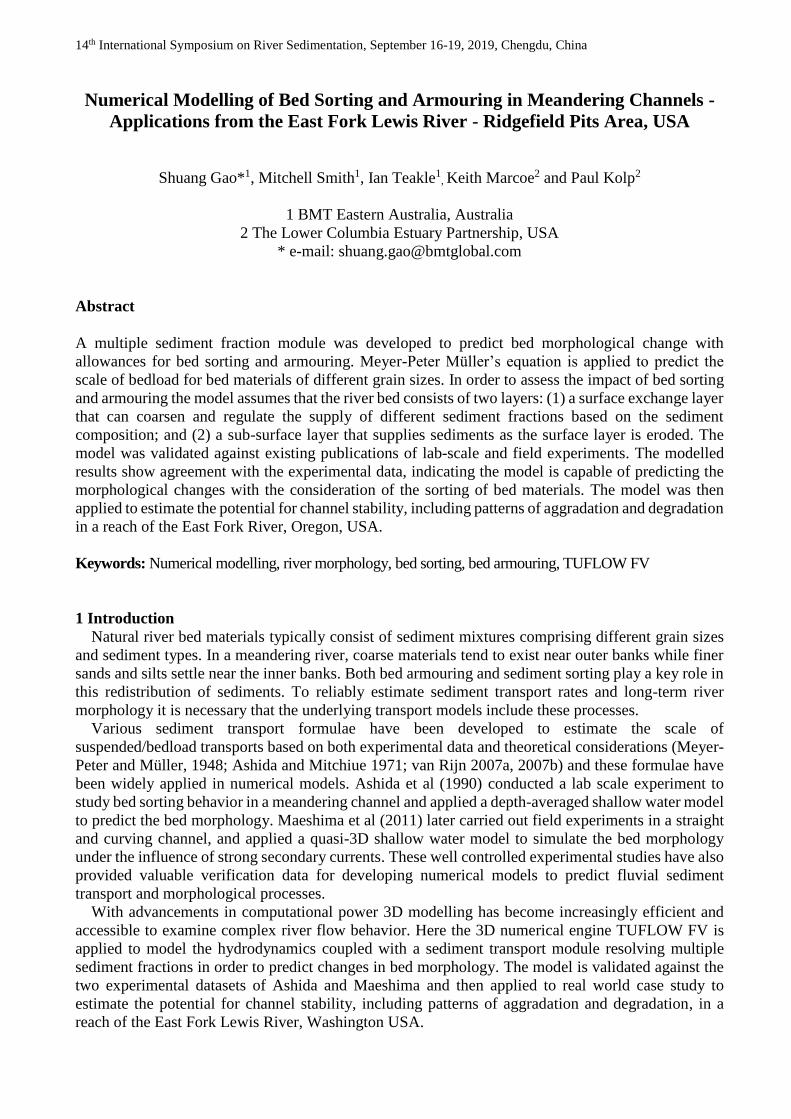
3.3 Experimental Results Comparison to Maeshima et al (2011)
Figure 6 presents the measured and simulated change in bed elevation results immediately prior and
following Case M3. Significant erosion along the outer bank of the curved section and deposition along
the inner bank are observed in the measurements (from cross section 6 to 9). The magnitudes of the
erosion and deposition are well modelled, however, the location of erosion/deposition occurs slightly
downstream compared to that measured (from cross section 8 to 11). Similar to the previous section
this may in part be due to under-prediction of the strength of the helical flow circulation, but may also
be due to the fact that the right/left bank were not at even elevations in the experiment (please refer to
the Figure of Maeshima et al, 2011). Figure 7 compares the absolute bed elevation at cross sections 4
and 8. At cross section 4, some slumping occurs as the bank is eroded and deposited into the main
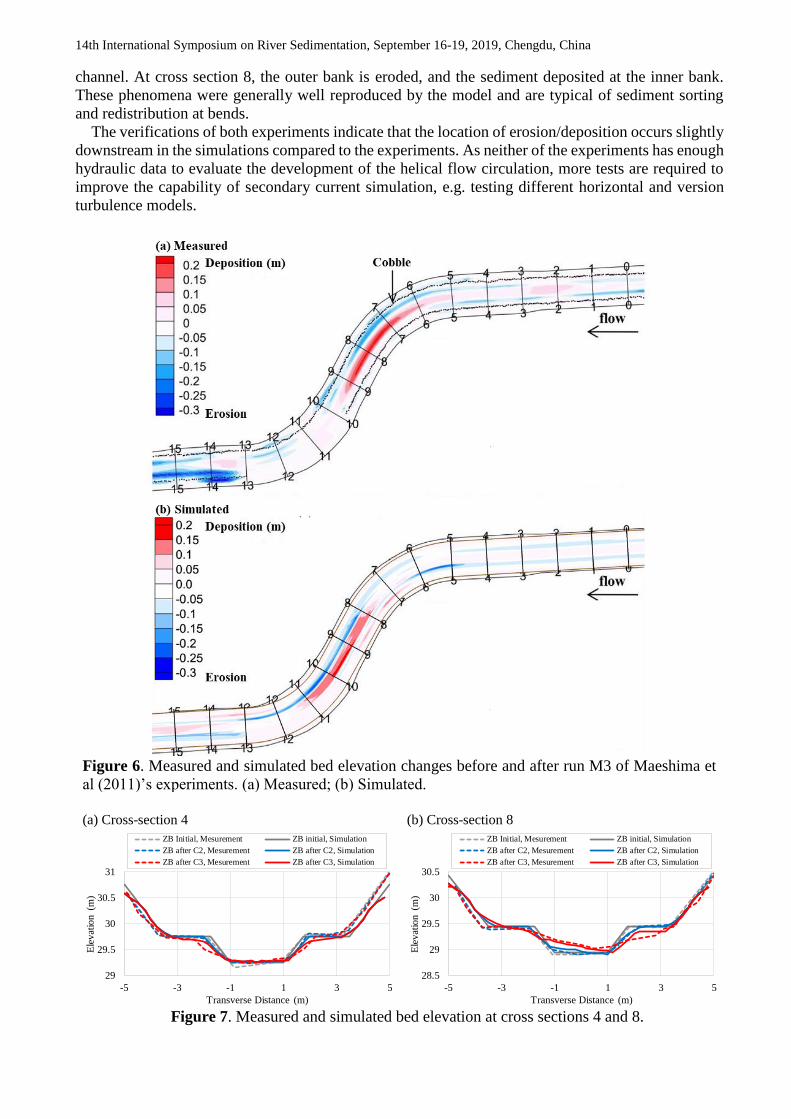
14th International Symposium on River Sedimentation, September 16-19, 2019, Chengdu, China
channel. At cross section 8, the outer bank is eroded, and the sediment deposited at the inner bank.
These phenomena were generally well reproduced by the model and are typical of sediment sorting
and redistribution at bends.
The verifications of both experiments indicate that the location of erosion/deposition occurs slightly
downstream in the simulations compared to the experiments. As neither of the experiments has enough
hydraulic data to evaluate the development of the helical flow circulation, more tests are required to
improve the capability of secondary current simulation, e.g. testing different horizontal and version
turbulence models.
Figure 6. Measured and simulated bed elevation changes before and after run M3 of Maeshima et
al (2011)’s experiments. (a) Measured; (b) Simulated.
(a) Cross-section 4
(b) Cross-section 8
Figure 7. Measured and simulated bed elevation at cross sections 4 and 8.
29
29.5
30
30.5
31
-5 -3 -1 1 3 5
Ele
vat
ion (
m)
Transverse Distance (m)
ZB Initial, Mesurement ZB initial, Simulation
ZB after C2, Mesurement ZB after C2, Simulation
ZB after C3, Mesurement ZB after C3, Simulation
28.5
29
29.5
30
30.5
-5 -3 -1 1 3 5
Ele
vat
ion (
m)
Transverse Distance (m)
ZB Initial, Mesurement ZB initial, Simulation
ZB after C2, Mesurement ZB after C2, Simulation
ZB after C3, Mesurement ZB after C3, Simulation

14th International Symposium on River Sedimentation, September 16-19, 2019, Chengdu, China
4 Case Study East Fork River - Ridgefield Pits Study Area
4.1 Study Area
Following validation the model was used to infer channel stability, including patterns of aggradation
and degradation in a reach of the East Fork Lewis River - Ridgefield Pits Area. The channel in this
region has a critical influence on the life histories of salmonids throughout the catchment. Historic
gravel mining activities in the area have created deep floodplain lakes (Figure 8a). Following cessation
of mining the main river channel avulsed into the nine abandoned gravel pits during the 1996 flood.
The modified regime has created deep and cold ponds along the main river course which are
unfavorable to the migration of salmonids, forming a barrier to upstream spawning habitats. Since
1996 the river has been highly dynamic, changing course frequently as can be seen from the historical
flow paths of the river (Figure 8b). Field sediment survey of the study area indicated a distinct in-
channel surface armour layer consisting of material size of 15 ~ 200mm with a finer sub-surface layer
of much wider sediment distribution range (Figure 3). Therefore, it is expected that bed
sorting/amouring has a significant influence on the river morphological response and thus was an
excellent case study to assess the performance of the new bed armouring routines.
The Ridgefield Pits model domain is bounded by the black dashed polygon in Figure 8b.
Bathymetric/topographic data collected in 2017 was applied as the initial bed elevation. Aerial
photography and sediment data were used to estimate an initial bed sediment distribution. To improve
this sediment distribution a constant flowrate of 140m3/s (or 5000cfs) was applied for an extended
period to allow the formation of an initial equilibrium bed armour layer. The selection of this flowrate
followed review of historical flow data, aerial photography and model predicted bed shear stresses and
was sufficient to transport and redistribute fine sediments whilst not being large enough to mobilise
armour material. Following bed warmup the December 2015 (588.9 m3/s or 20800 ft3/s peak flow rate)
was modelled and comprises the largest complete hydrograph from the available record. The sediment
fractions used in the modelling are summarised in Table 2. Sediment entering and exiting the model
was assumed to be identical to that adjacent to the model boundary, a so-called zero-gradient boundary.
Figure 8. Google aerial images of the Ridgefield Pits area in (a) 1990 and (b) 2017.
4.2 Simulation results and discussions
Figure 9a shows the flood hydrograph of the December 2015 event, while Figure 9b~9d present a
snapshot of bed elevation changes before, during and after the flood peak. Before the peak (Figure 9b),
the model predicts degradation near the outer bank of the bend and at the entrances of the small
avulsion channel (highlighted by the white arrows). At the flood peak (Figure 9c), the straight section
upstream of the bend was eroded significantly, and the eroded sediments moved downstream. After
the flood (Figure 9d), these sediments eventually settle at the entrance of the bend and in the location
of the old Pit 1 and 2 (refer Figure 8a). In general, degradation is expected to happen at the outer bank

14th International Symposium on River Sedimentation, September 16-19, 2019, Chengdu, China
of the bend and at the entrance of the avulsion channel after such a flood event, and aggradation is
expected at the entrance of the bend inside the pits. This is consistent with the trend observed from the
Google aerial imagery (Figure 10). The model result also implies that the morphological change in an
actual flood event is a dynamic process unlike the experiments, where near steady-state bed
morphology was attained under steady flow conditions. Therefore, it is crucial to conduct more field
scale simulations under different flow rates and durations in order to understand the long-term channel
stability.
(a) Flood hydrograph
(b) 2015/12//08
(c) 2015/12//09
(d) 2015/12//22
Figure 9. East Fork Lewis River simulation. (a) Flood hydrograph, and the simulated bed elevation
changes (b) before the flood peak, (c) during the flood peak, and (d) after the flood.
(a) 2014/07
(b) 2016/07
Figure 10. Google areal images of the modelling area before and after the 2015 flood. (a) 2014 dry
season; and (b) 2016 dry season.
0
100
200
300
400
500
600
01/12/15 08/12/15 15/12/15 22/12/15 29/12/15
Flo
w R
ate
(m
3/s
)
Date

14th International Symposium on River Sedimentation, September 16-19, 2019, Chengdu, China
5 Conclusions and Future Studies
A multiple sediment fraction module was developed for the 3D numerical engine TUFLOW FV to
predict bed morphological change with allowances for bed sorting and armouring. The modelling
results showed agreement with two existing publications of lab-scale and field experiments. The model
also demonstrated capability to estimate the potential for channel stability, including patterns of
aggradation and degradation in a real-world gravel river.
Recommendations arising from the research and testing are:
• The accuracy of a hydrodynamic model to predict the development of helical flow circulations
in meandering channels is fundamental to accurately predicting morphological evolution.
Therefore, model validation against detailed measurements of the velocity fields created by
helical flow circulations would be highly beneficial.
• The morphological change in an actual flood event is a dynamic and non-steady-state process.
Models would benefit from validation against dynamic flow field experiments or field data.
• Field scale simulations under different flow rates and durations would be beneficial to
understand long-term channel stability and further assist with model validation.
References
[1] Meyer-Peter, E. and Müller, R. (1948): “Formulas for bed-load transport”. Proceedings of 2nd
meeting of the International Association for Hydraulic Structures Research, Stockholm, 39-64.
[2] Ashida, K. and Michiue, M. (1971): “Studies on bed load transportation for nonuniform sediment
and river bed variation”. Disaster Prevention Research Institute Annuals, Kyoto University, No.
14 B, 259-273. (in Japanese)
[3] Van Rijn, L., C. (2007a): “Unified view of sediment transport by currents and waves. I: Initiation
of motion, bed roughness and bed load transport”. Journal of Hydraulic Engineering ASCE, Vol.
133, No. 6, 649-667.
[4] Van Rijn, L., C. (2007b): “Unified view of sediment transport by currents and waves. II:
Suspended transport”. Journal of Hydraulic Engineering ASCE, Vol. 133, No. 7, 668-689.
[5] Ashida, K., Egashira, S., Liu, B., and Umemoto M. (1990): “Sorting and bed topography in
meander channels”. Disaster Prevention Research Institute Annuals, Kyoto University, No. 33 B-
2, 261-279. (in Japanese)
[6] Maeshima, T., Iwasa, M., Osada, K., and Fukuoka, S. (2011): “Study of river-bed variation and
its grain size distribution in compound stony-bed river with meandering and straight channel”.,
Proceedings of Hydraulic Engineering, JSCE, Vol. 55. (in Japanese)
[7] Guard, P., Nielsen, C., Ryan, P. Teakle, I., Moriya, N. and Kobayashi, T. (2013): “Parameter
sensitivity of a 2D finite volume hydrodynamic model and its application to tsunami simulation”.
Proceedings of 2013 IAHR Congress, Beijing, China.
[8] Shimizu, Y., Watanabe, Y. and Toyabe, T. (1995): “Finite amplitude bed topography in straight
and meandering rivers”. JSCE Journal of Hydraulic, Coastal and Environmental Engineering, No.
509/II-30, 67-78. (in Japanese)
[9] Brunner, G., W. (2016): “HEC-RAS, river analysis system hydraulic reference manual”. US Army
Corps of Engineers.
[10] Van Rijn, L., C. (2007c): “Unified view of sediment transport by currents and waves. III: Graded
beds”, Journal of Hydraulic Engineering ASCE, Vol. 133, No. 7, 761-775.

14th International Symposium on River Sedimentation, September 16-19, 2019, Chengdu, China
Errata
Page 2, Equation (7): replace Φ�̂�
Φ�̂�
by Φ�̂�
Φ�̂�
Page 4, Table 1: the unit of the flow rates for East Fork Lewis River models are m3/s, not l/s
Page 7, Figure 7: replace “C2” and “C3” by “M2” and “M3”, respectively