numerical modelling and experimental validation in ...chiumenti.rmee.upc.edu/doc/papers/(55)...
TRANSCRIPT

NM
M,
a
b
c
d
a
ARRAA
KAMPSFH
1
mlmt
eS
e(j
h2
Additive Manufacturing 18 (2017) 171–185
Contents lists available at ScienceDirect
Additive Manufacturing
journa l homepage: www.e lsev ier .com/ locate /addma
umerical modelling and experimental validation in Selective Laserelting
ichele Chiumenti a,b, Eric Neiva a,b,∗, Emilio Salsi a,b, Miguel Cervera a,b, Santiago Badia a,b
Joan Moya a,b, Zhuoer Chen c,d, Caroline Lee c,d, Christopher Davies c,d
Centre Internacional de Mètodes Numèrics en Enginyeria (CIMNE), Building C1, Campus Nord UPC, Gran Capitán S/N, E-08034 Barcelona, SpainUniversitat Politècnica de Catalunya, Jordi Girona 1-3, Edifici C1, E-08034 Barcelona, SpainDepartment of Mechanical and Aerospace Engineering, Monash University, VIC 3800, AustraliaMonash Centre for Additive Manufacturing, Monash University, VIC 3800, Australia
r t i c l e i n f o
rticle history:eceived 10 May 2017eceived in revised form 25 July 2017ccepted 6 September 2017vailable online 22 September 2017
eywords:dditive manufacturing (AM) processetal deposition (MD) process
owder-bed technologieselective Laser Melting (SLM)inite-element (FE) modellingeat transfer analysis
a b s t r a c t
In this work a finite-element framework for the numerical simulation of the heat transfer analysis ofadditive manufacturing processes by powder-bed technologies, such as Selective Laser Melting, is pre-sented. These kind of technologies allow for a layer-by-layer metal deposition process to cost-effectivelycreate, directly from a CAD model, complex functional parts such as turbine blades, fuel injectors, heatexchangers, medical implants, among others. The numerical model proposed accounts for different heatdissipation mechanisms through the surrounding environment and is supplemented by a finite-elementactivation strategy, based on the born-dead elements technique, to follow the growth of the geometrydriven by the metal deposition process, in such a way that the same scanning pattern sent to the numer-ical control system of the AM machine is used. An experimental campaign has been carried out at theMonash Centre for Additive Manufacturing using an EOSINT-M280 machine where it was possible to fab-ricate different benchmark geometries, as well as to record the temperature measurements at differentthermocouple locations. The experiment consisted in the simultaneous printing of two walls with a totaldeposition volume of 107 cm3 in 992 layers and about 33,500 s build time. A large number of numerical
simulations have been carried out to calibrate the thermal FE framework in terms of the thermophysicalproperties of both solid and powder materials and suitable boundary conditions. Furthermore, the largesize of the experiment motivated the investigation of two different model reduction strategies: exclusionof the powder-bed from the computational domain and simplified scanning strategies. All these methodsare analysed in terms of accuracy, computational effort and suitable applications.© 2017 Elsevier B.V. All rights reserved.
. Introduction
Additive manufacturing (AM) or 3D Printing refers to a group ofanufacturing processes that build up a three-dimensional object
ayer upon layer, directly from a Computer-Aided Design (CAD)
odel. This technology has been traditionally used for rapid pro-otyping using plastic materials. Nowadays, it allows for the 3D
∗ Corresponding author at: Centre Internacional de Mètodes Numèrics en Enginy-ria (CIMNE), Building C1, Campus Nord UPC, Gran Capitán S/N, E-08034 Barcelona,pain.
E-mail addresses: [email protected] (M. Chiumenti),[email protected] (E. Neiva), [email protected]. Salsi), [email protected] (M. Cervera), [email protected] (S. Badia),[email protected] (J. Moya).
ttp://dx.doi.org/10.1016/j.addma.2017.09.002214-8604/© 2017 Elsevier B.V. All rights reserved.
printing of metallic components ready to be exploited for manyindustrial applications.
The most important benefit of AM is the ability to cost-effectively create objects with shapes and properties that werepreviously near-impossible to produce with conventional manu-facturing processes, such as casting or forging. AM can easily printvery complex geometries with cavities, thin walls or lattice struc-tures and it is also competitive for customised design in a shortproduction time.
This work addresses the numerical simulation of AM processesof metal components by powder-bed technologies, such as Selec-tive Laser Melting (SLM), Direct Metal Laser Sintering (DMLS) orElectron Beam Melting (EBM). Many industrial sectors are adopt-
ing them to fabricate their products, such as turbine blades, fuelinjectors, and microturbines in aerospace and aeronautics; wheelsuspensions, heat exchangers, and break disks in the automotive
1 Manu
ie
Da
(
(
(((
metdbc
mffp
oratpp
msdedpAo
ecthtto
es[[am
satl
Ob
72 M. Chiumenti et al. / Additive
ndustry; dental bridges and implants in the medical industry, orven jewels in the consumer goods sector.
A typical printing process by powder-bed technology, such asMLS in Fig. 1, occurs in a closed chamber with a gas controlledtmosphere and consists of the following steps:
1) A new layer of powder, around 30–60 �m thick, is spread overthe building platform with the levelling blade.
2) A high-energy and focused laser melts the region of powderthat belongs to the current cross section of the object. The lasermoves according to a predefined scanning path.
3) The building platform is lowered to accommodate a new layer.4) Steps 1–3 are repeated until the whole model is created.5) Loose unfused powder is removed during post processing.
Nowadays, process design and certification of products built byetal AM relies on an expensive and time-consuming trial-and-
rror procedure. This situation prevents a wider adoption of theseechnologies by the industry. In order to leverage the freedom inesign, cost efficiency and immediacy that AM offers, one possi-le solution is to shift to a virtual-based design, using predictiveomputer simulation tools.
Many researchers have already used the finite-element (FE)ethod to analyse metal deposition processes in AM with dif-
erent technologies [2,36,1,28,29,45,11,22], often taking advantagerom the knowledge acquired in modelling other metal formingrocesses, such as casting or welding [3,10,5,27,18,12].
FE modelling has been mainly employed to assess the influencef process parameters [46,38,30] and to evaluate distortions andesidual stresses [34,13,23,16,9]. In this sense, thermal modelling,part from being an input for the mechanical analysis, is fundamen-al to characterise the melt pool and the microstructure in an AMrocess [20,25,33,41] and also guides the selection of the printingrocess parameters in engineering design [32,26,44].
The scope of this work is the FE analysis of the AM process byetal deposition at the component scale. Hence the focus is the
tudy of the heat transfer process according to the energy intro-uced into the system by the heat source (laser, electron beam,tc.), as well as the heat dissipation through the boundaries of theomain which define the component during its fabrication. Thehenomena occurring in the melt pool and in the surrounding Heatffected Zone (HAZ) can also be analysed [17,7,37,24,35,40], but areut of the scope of this work.
Furthermore, two aspects deserve especial attention when mod-lling powder-bed technologies. First, the lateral walls of theomponent are in permanent contact with the unsintered powderhroughout the printing and cooling processes. As a consequence,eat conduction through the powder must be modelled. Second,he layer thickness is typically very small (about 30–60 �m), sohat building industrial parts requires the deposition of thousandsf layers. Therefore, computational efficiency is paramount.
Computational complexity is one of the reasons why mostxperimental studies with powder-bed technologies considerhort single-part builds of less than 15 layers and 1 cm3 volume36,22,14,30]. Fewer works attempt at higher deposition volumes15,34], longer processes [16], or multiple parts [19,34], but barelyny of these experimental builds approach the limits of currentachines.
Besides, strict discretisation requirements [47], specifying meshizes smaller than the laser beam spot size, are necessary to obtainn accurate local thermal response, especially, to capture the peakemperature distribution, but they also increase the computational
oad to a point where engineering applications are out of reach.Several methods have been introduced to overcome this burden.n the one hand, adaptive mesh refinement and coarsening haveeen explored to reduce the size of the spatial problem [15,31]. On
facturing 18 (2017) 171–185
the other hand, reduced models with simplified scanning strate-gies have been introduced [19,21]. These models are not capableof predicting the complex thermal history (local superheating andsupercooling). Therefore, they are not suitable for further mechan-ical or microscale analyses. However, they are able to capture anaccurate global thermal response. For this reason, they are a reliableand efficient alternative for other engineering applications, such asoptimisation of the process parameters or process planning. In spiteof the benefits, the authors consider that these reduction strate-gies have been object of few numerical analysis and contrast withphysical experiments.
This given, the purpose of this work is to enhance the FEframework developed and experimentally validated for both wire-feeding [6] and blown-powder technologies [8] to deal with thethermal analysis of AM processes by powder-bed technology. Thistask is supported by an exhaustive experimental campaign carriedout at the Monash Centre for Additive Manufacturing (MCAM) in Mel-bourne, Australia, using an EOSINT M280 machine and Ti–6Al–4Vpowder. The scale of the experiment is unprecedented and rep-resentative of big industrial cases: simultaneous printing of two95 cm3 and 12 cm3 walls in 992 layers and about 33,500 s buildtime.
The computational framework proposed here is calibrated bycomparing the temperature evolution obtained at different ther-mocouple locations during the full duration of the AM process withthe corresponding experimental measurements. The experimentalsetting is also used to investigate different numerical approaches,in order to find the best simulation practice when dealing withpowder-bed technologies.
With regard to the thermal loss through the powder, twoalternatives are examined: (1) including the powder-bed into thecomputational model with appropriate estimations of the ther-mophysical properties of the powder, as done in [14,34], or (2)a novel approach that excludes the powder-bed and models thecorresponding heat loss with an equivalent heat flux through thelateral walls of the component as immersed into the unsinteredpowder.
As for the computational complexity, this work assesses theimpact of considering simplified scanning strategies on the accu-racy of the solution and the simulation time. The analysis ends witha comparative evaluation of the advantages and disadvantages ofeach model reduction approach and recommended applications.
The outline of this work is as follows. First, the formulation ofthe heat transfer problem is detailed in Section 2. The FE activa-tion technique used to simulate the metal deposition is explainedin Section 3. Section 4 describes the experimental setting at theMCAM. The calibration of the numerical model and the evaluationof the different simulation approaches is addressed in Section 5.Finally, Section 6 presents the conclusions of this work.
2. Heat transfer analysis
2.1. Governing equation
Let � be an open bounded domain in R3 with smooth boundary
∂�, representing a thermodynamic continuum. � grows in timeduring the fabrication process. After the printing, it remains fixed,while cooling down to the room temperature.
The governing equation to describe the temperature evolutionduring the printing and the cooling phases of the AM process is the
balance of energy equation, expressed asH = −∇ · q + r, in �, t > 0, (1)

M. Chiumenti et al. / Additive Manufacturing 18 (2017) 171–185 173
F ick, is spread over the building platform with the levelling blade. (2) A laser source meltst e building platform is lowered to accommodate a new layer. (4) Steps 1–3 are repeatedu processing.
wtc
aa
td
H
wct
ihdhcbH
a
C
wt
q
w
2
tdhhtb
wf
ig. 1. A printing process by DMLS. (1) A new layer of powder, around 30–60 �m thhe region of powder that belongs to the current cross section of the object. (3) Thntil the whole model is created. (5) Loose unfused powder is removed during post
here H is the rate of enthalpy per unit volume, r the heat suppliedo the system per unit volume by the internal sources and q the heatonduction flux.
For an AM process, the heat source r(t) is the energy input from very intense and concentrated laser beam that moves in timeccording to a user-defined deposition sequence, the scanning path.
The enthalpy rate per unit volume H is defined, in terms of theemperature T and the rate of the latent heat released/absorbeduring the phase-change process L, as
˙ (T, fL) = C(T)T + �(T)L, (2)
here C(T) is the (temperature dependent) heat capacity coeffi-ient, given by the product of the density of the material �(T) andhe specific heat c(T).
The amount of latent heat is negligible in front of the energynput introduced by the heat source. Moreover, in the HAZ, latenteat is absorbed when the laser fuses the powder particles. Imme-iately after, the material solidifies and the same amount of latenteat is released. These two phase transformations occur very fast,ompared to the thermal diffusion process. As a result, the energyalance due to the phase change is null and very localised at theAZ, so its global effect is minor in the heat transfer analysis [8].
According to this, the balance of energy equation can be stateds
(T)T − ∇ · (k(T)∇T) = r, in �, t > 0, (3)
here the conduction heat flux per unit area q is proportional tohe gradient of temperature, according to Fourier’s law:
= −k(T)∇T, (4)
ith k(T) > 0 the (temperature-dependent) thermal conductivity.
.2. Boundary conditions
Due to the high conductivity of metals, heat conduction throughhe building platform and thermal loss through the loose pow-er in which the component is immersed are the predominanteat transfer mechanisms in powder-bed technology. However,eat radiation and convection through the surfaces in contact withhe environment must also be accounted for. Fig. 2 illustrates the
oundary conditions of the problem.Considering a partition (∂�c, ∂�p, ∂�e) of the boundary ∂�,here ∂�c represents the contact surface with the printing plat-
orm, ∂�p the contact surface with the powder-bed, and ∂�e the
Fig. 2. A close-up of Fig. 1 gathering the boundary conditions of the problem: (1)Heat conduction through the building platform. (2) Heat conduction through thepowder bed. (3) Heat convection and heat radiation through the free surface.
external surface in contact with the surrounding environment, theboundary conditions are expressed as:
2.2.1. Heat conduction through the building platformTypically, the dimensions of the building platform (e.g. its ther-
mal inertia) are much larger than the printed part. Hence, it ispossible to prescribe the temperature on the contact surface �c
as
T = Tc, on ∂�c, (5)
where Tc is the temperature of the building platform.
2.2.2. Heat conduction through the powder bedIf the powder bed is included in the computational domain, the
thermophysical properties of the powder are established in termsof the properties of the solid material and the porosity of the gran-ular bed, �.
The density and the specific heat are straightforwardly com-puted as
�p = �solid(1 − �), and (6)
cp = csolid, (7)
but the value of the thermal conductivity, kp, of metal powders isfrequently estimated with empirical expressions, that also dependon the conductivity of the surrounding air or gas, kgas. Among sev-eral models proposed in the literature, the work of Yagi and Kunii

174 M. Chiumenti et al. / Additive Manu
Ftp
[l
k
tc
q
wat
dtp
h
wcp
thhp
ig. 3. Tp is the average temperature of the powder far from the HAZ, where thehermal field is not much affected by the temperature gradient originated by therinting process, and sp is the average size of the process affected zone.
43] for porous beds of metals, revised by Xue and Barlow [42] forow porosity powders, states
p =(
6.3 + 22√
0.09ksolid − 0.016
)ksolid(1 − �)
(ksolid/kgas)(100.523−0.594�) − 1. (8)
Alternatively, if the powder bed is not included in the computa-ional domain, the heat loss by conduction through the powder qp
an be expressed using an equivalent boundary condition, as
p(T) = hp(T − Tp), on ∂�p, (9)
here Tp is the temperature of the powder far enough from the HAZ,nd hp(T) denotes the HTC by conduction between the powder andhe component.
Tp should be known or duly estimated in time during the fulluration of the AM process, but a constant value can be used, ifhe thermal interference among the different components, beingrinted on the same platform at the same time, is negligible.
On the other hand, hp(T) is computed as
p(T) = kp(T)sp
, (10)
here sp accounts for the average size of the region around theomponent, thermally affected by the printing process (e.g. withresence of strong thermal gradients), as shown in Fig. 3.
Introducing an equivalent boundary condition for heat transfer
hrough the powder-bed simplifies the physics of the problem, butas obvious consequences in the error of the predictions. On the oneand, it leads to a reduced computational model with less thermo-hysical properties of the metal powder to be determined. On theFig. 4. FE activation technology: element cl
facturing 18 (2017) 171–185
other hand, though suitable for sensitivity analysis and optimisa-tion of the process parameters, this approach is not recommendedfor applications with strict accuracy requirements.
2.2.3. Heat convection through the surrounding environmentThe heat loss by convection through the surrounding environ-
ment qconv can also be expressed by Newton’s law as
qconv(T) = hconv(T − Te), on ∂�e, (11)
where hconv(T) denotes the HTC by convection through the sur-rounding environment and Te is the temperature of the gas insidethe machine chamber. Te can be assumed constant if the gas tem-perature is controlled or the component is very small compared tothe size of the chamber.
2.2.4. Heat radiationRadiation is an important heat loss mechanism at the HAZ, due
to the high-temperature field induced by the heat source. The radi-ation heat flux qrad can be calculated using Stefan–Boltzmann’slaw:
qrad(T) = ��(T4 − Te
4), on ∂�e. (12)
Here, � is the Stefan–Boltzmann constant and � is the emissivityof the radiating surface, a measure of the efficiency of the body asa radiation emitter. The contribution of heat radiation can also beexpressed as
qrad(T) = hrad(T − Te), on ∂�e, (13)
where
hrad(T) = ��(T3 + T2Te + TT2
e + T3e
). (14)
Heat is lost through the environment by a combination of con-vection and radiation. In practice, it is difficult to discriminate theeffects of both heat transfer modes. For this reason, the numericalmodel assumes a combined heat transfer law, accounting for bothheat convection and radiation:
qloss(T) = hloss(T − Te), on ∂�e. (15)
In this case, qloss represents the heat flux due to the simultaneousconvection and radiation mechanisms, and hloss is the correspond-ing equivalent HTC.
3. FE modelling of the AM process
Metal deposition is modelled by moving the heat source alonga predefined scanning pattern. Hence, the geometry of the com-ponent grows in time according to the sintering process thattransforms metal powder into a new solid layer.
assification and heat affected volume.

M. Chiumenti et al. / Additive Manufacturing 18 (2017) 171–185 175
Fig. 5. Base plate and printed walls.
therm
cttia
dfi
•
•
•
stsb
3
i
Fig. 6. Location of
The numerical simulation of this process requires an ad-hoc pro-edure to apply the volumetric heat source r in space and timeo the elements affected by the moving energy input, as well aso include into the computational domain those elements form-ng a new layer of material. This procedure is referred to as the FEctivation technique.
The activation strategy used in this work is the born-ead-elements technique [6,8]. It classifies the elements of thenite-element mesh into: active, activated, and inactive elements:
Active elements are those elements representing the buildingplatform, as well as the ones already activated by the metal depo-sition process.Activated elements are the ones affected by the energy input dur-ing the current time step and inactive previously to this moment.Inactive elements have not yet been included into the (active)computational domain.
According to this, the computational domain is defined by theet of active and activated elements, as seen in Fig. 4(A). To updatehe computational domain from one time step to the next one, aearch algorithm is used to identify the elements that are affectedy the heat source during the current time increment.
.1. Space and time discretisation of the heat source
The representation of the heat source within the FE frameworks detailed in [8]. The melt pool moves from a given position xn to
ocouple channels.
the following position xn+1 in the interval �t = tn+1 − tn accordingto the predefined scanning sequence.
The total volume affected by the power input V�tpool
in thisinterval, referred to as the Heat Affected Volume (HAV), can be rep-resented as a cuboid of length vs�t, being vs the scanning speed,and cross-section given by the average laser spot size wpool , and theaverage layer thickness LT, as shown in Fig. 4(B). The heat sourceterm r in Eq. (1) is only applied to the elements inside the HAV.
At each time step, these elements are found with an octree-based search algorithm. If an inactive element belongs to the HAV,then it is activated. The volume of the melt-pool is computed as
V�t,hpool
=∑
(e) ∈ HAV
V (e) (16)
and the (average) density distribution from the heat source is com-puted as
r = W
V�t,hpool
, (17)
where W is the laser power [W] and is the heat absorptioncoefficient, a measure of the laser efficiency. This power redistri-bution preserves the total energy input, regardless of the FE meshemployed.
The same care devoted to estimate the energy delivered bythe laser beam must be placed to compute the heat dissipatedthrough the boundaries of the computational domain. For this rea-son, another search procedure is used to update the contour surface

176 M. Chiumenti et al. / Additive Manufacturing 18 (2017) 171–185
he tem
aba
pdIoph
wfppcstt
3
�uo
Fig. 7. Steps to carry out t
t each time step of the simulation, in order to update the currentoundary surfaces subject to heat radiation and convection (�e)nd heat conduction through the powder bed (�p).
One of the added features of this FE activation technique is theossibility of specifying the scanning path using the same inputata as for the process machine, for instance, with a Common Layer
nterface (CLI) file format [8,39]. A CLI file describes the movementf the laser in the plane of each layer with a complex sequence ofolylines, to define the (smooth) boundary of the component, andatch patterns, to fill the inner section.
This is a great advantage because it simplifies the end-user work,hen integrating the machine directives with the software inter-
ace. However, the scanning path only defines the sequence ofoints along which the power input moves, as well as the referencelane where the laser beam is focused. The scanning path does notontain any information regarding the velocities of the laser, theize of the melt pool, the spot-size of the laser or the thickness ofhe deposited layer. These values must be separately specified byhe end-user.
.2. Definition of scanning strategy
As seen in Fig. 4(B), during a time increment the laser movesx = |xn+1 − xn| = vs�t along the scanning path. From the end-
ser point of view, it is more convenient to prescribe �x, insteadf �t, and let the software compute the time discretisation as
perature measurements.
�t = vs/�x. In this manner, different approximations of the scan-ning path, i.e. scanning strategies, can be defined according to theaccuracy requirements.
For instance, taking �x ≈ h, where h is the element size, leadsto a high-fidelity representation of the scanning path, an element-by-element activation at the cost of a high number of time steps.Alternatively, the simulation can be accelerated by defining �x asthe length of one hatch, several hatches or even a whole layer. As acounterpart, this strategy only recovers average temperature fields,being not able to capture the local thermal history [8].
The choice of the scanning strategy depends on the target AMsimulation. A high-fidelity approach is affordable when simulat-ing wire-feeding processes, where the layer thickness is around1 mm. However, in powder-bed technologies, the layer thicknessreduces to 30–60 �m. As a result, thousands of layers of mate-rial must be added to build an industrial part and the high-fidelitystrategy results in unreasonable computational times. In this case,hatch-by-hatch or layer-by-layer depositions should be considered.
4. Experimental campaign
An experimental campaign is carried out at the Monash Cen-tre for Additive Manufacturing (MCAM) in Melbourne, Australia,with the purpose of calibrating the thermal analysis FE frameworkdescribed in Section 2 for powder-bed methods.

M. Chiumenti et al. / Additive Manufacturing 18 (2017) 171–185 177
MaTct
tti4p
ittrtoFrt
dbipt
c99
df
Table 1Process parameters adopted by the EOS Machine.
Power input 280 [W]Scanning speed 1200 [mm/s]Layer thickness 30 [�m]Hatch distance 140 [�m]Beam offset 15 [�m]Recoat time 9.36 [s]Relocation time 0.03 [s]
Fig. 8. Scanning pattern used in the printing process.
The printing system employed for the experiments is the EOSINT280 from Electro Optical Systems (EOS) GmbH. It makes use of
n Yb-fibre laser with variable beam width and power up to 400 W.he printing process is carried out in a closed 250 × 250 × 325 mm3
hamber in a controlled argon atmosphere to prevent oxidation ofhe part. The argon flow is kept laminar.
Fig. 5 shows the samples geometry for the numerical calibra-ion. These consist of two specimens printed simultaneously: ahin wall measuring 5 × 80 × 50 mm3 and a thicker wall measur-ng 40 × 80 × 50 mm3. The two walls are separated by a distance of0 mm. The base plate has dimensions of 252 × 252 × 45 mm3. Ti64owder is used for the printing operation.
The thermocouples for the temperature measurements arenserted into holes at different locations of the two specimens. Forhis purpose, the printing job has to be interrupted after an ini-ial deposition of 20.24 mm high and the powder bed has to beemoved. Four thermocouples are installed in each sample: the firsthree separated by 5 mm in the vertical direction and the fourthne displaced 10 mm horizontally from the top one, as shown inig. 6. Next, the powder bed is restored, and the scanning sequenceesumed, as described in Fig. 7. As thermocouples are not welded,heir measurements can be affected by air trapped in their holes.
K-type thermocouples and a Graphtec GL-900 8 high-speedata-logger are used for the data gathering. Temperature data coulde measured only from six channels, because the fourth channel
n both walls was broken during the setup operations. The sam-ling rate of the data logger is 1 ms and the time constant of thehermocouples is 7 ms.
Table 1 shows the process parameters used for the printing pro-ess. As observed, the layer thickness is set to 30 �m, meaning that92 layers are deposited in about 33,500 s (a little bit more than
h) to build the samples.A unidirectional scanning strategy is applied along the longitu-
inal direction of both samples. In Fig. 8 the scanning sequence usedor the printing process is described. The scanning path alternates
Fig. 9. Ti6Al4V titanium alloy thermal bulk material properties.

178 M. Chiumenti et al. / Additive Manufacturing 18 (2017) 171–185
the la
bdi
tids
opaob
5
5
mfTt
sws
Fbmrcmwt
ppni1tttor
Fig. 10. The FE mesh conforms to
etween odd and even layers. Note that the number of hatchesrawn does not correspond to the actual number of hatches, which
s notably higher according to the power beam size.The printed samples are made of Ti6Al4V Titanium alloy. The
emperature-dependent properties of the bulk material, cover-ng the range from room temperature to fusion temperature, areepicted in Fig. 9. The base plate is made of CP Ti, a material withimilar thermal properties as those of Ti64.
Complementary experiments were done to estimate the densityf the porous bed, as it is formed layer-by-layer during the printingrocess. According to these measurements, the packing density isbout 2405 kg/m3 at room temperature. Thus, the relative densityf Ti64 powder is around 54%, with respect to the density of theulk material at room temperature.
. Numerical results and discussion
.1. Initial calibration of the model
The in-house research software COupled MEchanical and Ther-al (COMET) [4] is suitably enhanced to provide a FE framework
or the heat transfer analysis of AM by powder-bed technologies.he model is calibrated against the experimental data obtained athe MCAM research centre.
The numerical model selected for the calibration procedurehould reproduce as close as possible the physical process. Like-ise, the size of the simulation should be chosen to enable a full
ensitivity analysis in reasonable computational times.For the most accurate simulation of the metal deposition, the
E mesh must conform to the printed layers, the mesh size muste smaller than the laser beam spot size, and the scanning pathust be tracked element by element. However, meeting these
equirements in this experiment is extremely difficult from theomputational point of view. For instance, assuming a uniformesh with element size 50 × 50 × 30 �m, a single layer of the thickall is composed of 1,280,000 elements to be printed in 1,280,000
ime steps.For these reasons, in a first stage of the calibration process, the
owder bed has been excluded from the analysis and the scanningath has been approximated to obtain a computationally affordableumerical model. On the one hand, these two assumptions have an
mpact on the accuracy, as discussed in Section 2.2.2 and Section, but it was the only possibility to perform the sensitivity analysiso calibrate the numerical model for the whole build process. On
he other hand, the experimental measurements are perturbed byhe air trapped in the thermocouple holes and the sampling ratef the data logger, which delays the thermocouple response whenegistering peak temperature values.yers, as seen in the close-up plots.
This given, the FE discretisation consists of a structured meshof 150,048 hexahedral elements and 194,150 nodes. Fig. 10 showsthe numerical model considered for the numerical simulation ofthe printing process. This model includes the building platform toaccount for the heat dissipation by conduction, but excludes thepowder bed. Hence, the heat loss by conduction through the pow-der bed is modelled through the equivalent heat flux described inSection 2.
To further decrease the computational cost, the mesh size isadapted according to the different regions in the model. Small5 × 5 ×0.03 mm elements are specified at the deposition regions,while a larger mesh size is specified below the deposition regionsand the base plate. As a result of approximating the scanning pathand using a uniform heat source distribution, the mesh size nolonger needs to be smaller than the laser spot size to obtain anaverage thermal response with a relative error bounded by 10%. Itsuffices that it conforms to the hatch width (5 mm).
The simulation starts when the printing job is resumed afterplacing the thermocouples and continues throughout the deposi-tion of the remaining 992 layers, up to the cooling of the wholeensemble. Each new layer is printed in four steps:
(1) The scanning sequence corresponding to a new layer of the thinsample is performed;
(2) The laser moves from the thin sample to the thick sample (relo-cation time);
(3) The scanning sequence corresponding to a new layer of thethick sample is carried out;
(4) The platform is lowered and a new powder layer is spread. Dur-ing the recoat time, the heat transfer analysis to account for thecooling process of the samples is performed.
The building platform is kept at 100 ◦C during the whole printingprocess. The average temperature of the powder, as well as thetemperature inside the chamber, used for the calibration of the heattransfer coefficients (heat loss by convection and radiation), areset to constant values of 83 ◦C and 35 ◦C, respectively, according toon-site measurements.
The HTC for the heat convection model is calibrated to1.0 W/m2 K. The powder conductivity required to deal with theheat dissipation through the powder bed is obtained takingkTi64 = 7 W/m K and kargon = 0.016 W/m K at 20 ◦C. Hence, accord-ing to Eq. (8), kp results in about 0.14 W/m K. Repeating theevaluation at 800 ◦C, the resulting HTC is kp = 0.60 W/m K. Hence,
according to the average temperature of the powder, the powderconductivity used for the simulations is kp = 0.20 W/m K. Further-more, sp = 40 mm, leading to an equivalent HTC by conduction ofhp = 5.0 W/m2 K.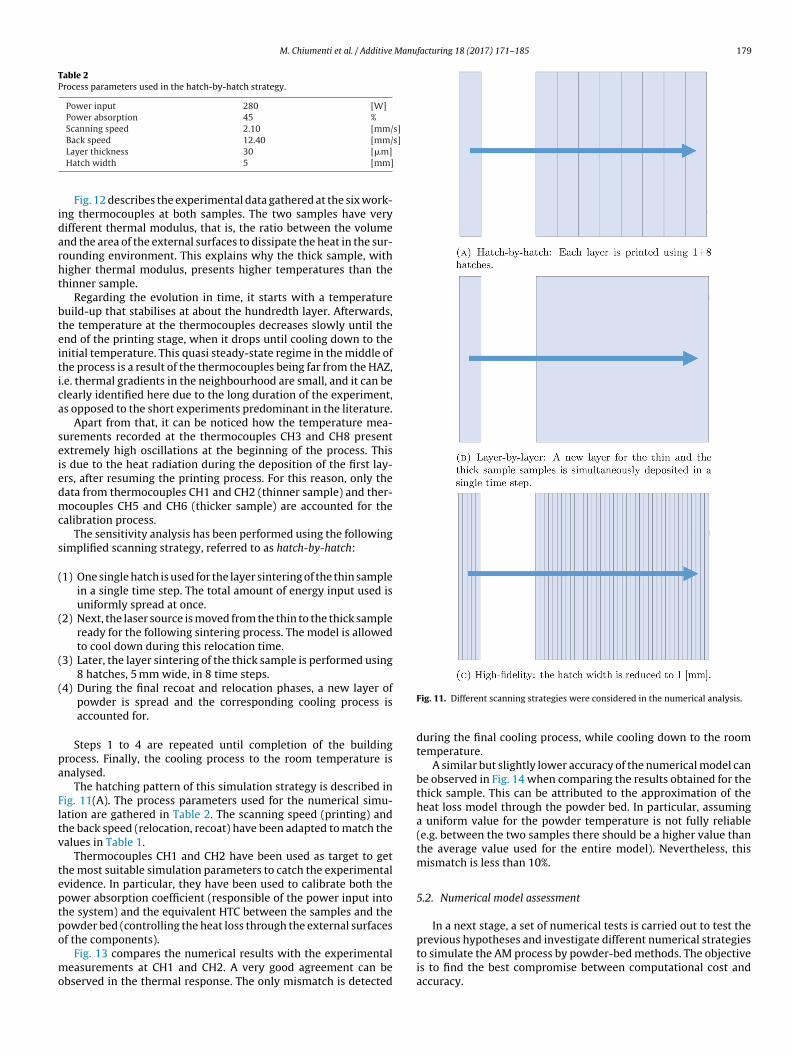
M. Chiumenti et al. / Additive Manufacturing 18 (2017) 171–185 179
Table 2Process parameters used in the hatch-by-hatch strategy.
Power input 280 [W]Power absorption 45 %Scanning speed 2.10 [mm/s]Back speed 12.40 [mm/s]
idarht
bteitica
seiedmc
s
(
(
(
(
pa
Fltv
teptpo
mo
Layer thickness 30 [�m]Hatch width 5 [mm]
Fig. 12 describes the experimental data gathered at the six work-ng thermocouples at both samples. The two samples have veryifferent thermal modulus, that is, the ratio between the volumend the area of the external surfaces to dissipate the heat in the sur-ounding environment. This explains why the thick sample, withigher thermal modulus, presents higher temperatures than thehinner sample.
Regarding the evolution in time, it starts with a temperatureuild-up that stabilises at about the hundredth layer. Afterwards,he temperature at the thermocouples decreases slowly until thend of the printing stage, when it drops until cooling down to thenitial temperature. This quasi steady-state regime in the middle ofhe process is a result of the thermocouples being far from the HAZ,.e. thermal gradients in the neighbourhood are small, and it can belearly identified here due to the long duration of the experiment,s opposed to the short experiments predominant in the literature.
Apart from that, it can be noticed how the temperature mea-urements recorded at the thermocouples CH3 and CH8 presentxtremely high oscillations at the beginning of the process. Thiss due to the heat radiation during the deposition of the first lay-rs, after resuming the printing process. For this reason, only theata from thermocouples CH1 and CH2 (thinner sample) and ther-ocouples CH5 and CH6 (thicker sample) are accounted for the
alibration process.The sensitivity analysis has been performed using the following
implified scanning strategy, referred to as hatch-by-hatch:
1) One single hatch is used for the layer sintering of the thin samplein a single time step. The total amount of energy input used isuniformly spread at once.
2) Next, the laser source is moved from the thin to the thick sampleready for the following sintering process. The model is allowedto cool down during this relocation time.
3) Later, the layer sintering of the thick sample is performed using8 hatches, 5 mm wide, in 8 time steps.
4) During the final recoat and relocation phases, a new layer ofpowder is spread and the corresponding cooling process isaccounted for.
Steps 1 to 4 are repeated until completion of the buildingrocess. Finally, the cooling process to the room temperature isnalysed.
The hatching pattern of this simulation strategy is described inig. 11(A). The process parameters used for the numerical simu-ation are gathered in Table 2. The scanning speed (printing) andhe back speed (relocation, recoat) have been adapted to match thealues in Table 1.
Thermocouples CH1 and CH2 have been used as target to gethe most suitable simulation parameters to catch the experimentalvidence. In particular, they have been used to calibrate both theower absorption coefficient (responsible of the power input intohe system) and the equivalent HTC between the samples and theowder bed (controlling the heat loss through the external surfaces
f the components).Fig. 13 compares the numerical results with the experimentaleasurements at CH1 and CH2. A very good agreement can be
bserved in the thermal response. The only mismatch is detected
Fig. 11. Different scanning strategies were considered in the numerical analysis.
during the final cooling process, while cooling down to the roomtemperature.
A similar but slightly lower accuracy of the numerical model canbe observed in Fig. 14 when comparing the results obtained for thethick sample. This can be attributed to the approximation of theheat loss model through the powder bed. In particular, assuminga uniform value for the powder temperature is not fully reliable(e.g. between the two samples there should be a higher value thanthe average value used for the entire model). Nevertheless, thismismatch is less than 10%.
5.2. Numerical model assessment
In a next stage, a set of numerical tests is carried out to test theprevious hypotheses and investigate different numerical strategies
to simulate the AM process by powder-bed methods. The objectiveis to find the best compromise between computational cost andaccuracy.
180 M. Chiumenti et al. / Additive Manufacturing 18 (2017) 171–185
Fig. 12. Experimental data gathered for both sample locations.
Fig. 13. Hatch-by-hatch (reference): numerical results at the thin sample.
): numerical results at the thick sample.
sabudot
Table 3Porosity and thermal conductivity of the Titanium powder.
Fig. 14. Hatch-by-hatch (reference
First, the powder bed is added to the model. In this case, theize of the FE discretisation is much bigger, including 594,368 hex-hedral elements and 649,230 nodes. This model is about six timesigger than the previous one (without powder bed) and the sim-lation time is almost four times longer (from 1 day to about 4
ays). The thermophysical properties of the Titanium powder arebtained as defined in Section 2, with the values of porosity andhermal conductivity listed in Table 3.Porosity 46 %Thermal conductivity 0.20 [W/m K]
Fig. 15 compares the numerical results with and without includ-ing the powder bed in the simulation. The results are not as goodas in the previous case, even if the model is more realistic. Thisis due to several reasons: (1) the results strongly depend on the

M. Chiumenti et al. / Additive Manufacturing 18 (2017) 171–185 181
Fig. 15. Numerical results with or without (reference) including the powder bed into the computational domain.
Fig. 16. Numerical results obtained by layer-by-layer and 4-layer-by-4-layer strategies.
ined w
tddi(s
Fig. 17. Numerical results obta
hermophysical properties used to characterise the metal pow-er: density, specific heat and conductivity, all of them should beefined in terms of the actual temperature field. The available lim-
ted characterisation of the powder made difficult their calibration;
2) the much higher computational cost made extremely slow theensitivity analysis.ith a high-fidelity simulation.
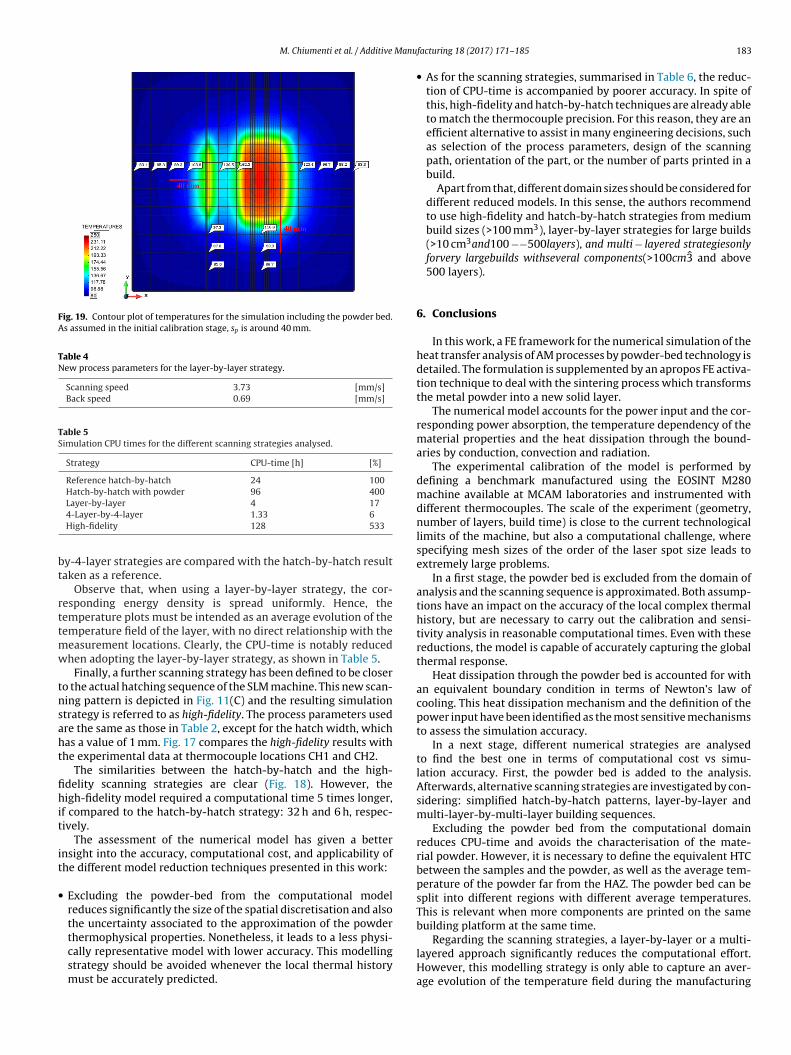
Besides, this simulation is useful to examine the values of sp andthe average temperature of the powder. Fig. 19 shows that sp isaround 40 mm and the powder temperature is 83 ◦C. However, it isalso evident that the average temperature of the powder between
the two samples should be approximately 135 ◦C, instead of 83 ◦C.The next numerical simulations are intended to assess differ-ent scanning strategies. First, a layer-by-layer building strategy has

182 M. Chiumenti et al. / Additive Manufacturing 18 (2017) 171–185
F erent
p
bw
(
(
ig. 18. Contour plots of temperatures for the analysed scanning strategies at diffath simplifies.
een selected to reduce as much as possible the simulation time,hile providing reasonable accuracy. Hence:
1) One single time step is used to add simultaneously a new layerfor both samples. The energy density used is spread homoge-neously at once. The sintering time includes the relocation time,that is, the time used by the laser to move from the ending point
of the scanning sequence at thin sample to the starting point atthe thick sample.2) Further time steps are performed to account for the coolingprocess during the recoating and relocation times, when the
time steps. The locality of the temperature distribution decreases as the scanning
building platform is lowered and a new layer of powder isspread.
(3) The discretisation of the powder bed is avoided.
Steps 1 and 2 are repeated until completing the building process.Later, the cooling process to the room temperature ends the anal-ysis. The scanning pattern of this simulation strategy is describedin Fig. 11(B). The new values of the scanning speed and the back
speed are gathered in Table 4.Similarly, a multi-layer-by-multi-layer simulation strategy canbe considered for further reduction of the computational cost. InFig. 16, the numerical results with both layer-by-layer and 4-layer-
M. Chiumenti et al. / Additive Manu
Fig. 19. Contour plot of temperatures for the simulation including the powder bed.As assumed in the initial calibration stage, sp is around 40 mm.
Table 4New process parameters for the layer-by-layer strategy.
Scanning speed 3.73 [mm/s]Back speed 0.69 [mm/s]
Table 5Simulation CPU times for the different scanning strategies analysed.
Strategy CPU-time [h] [%]
Reference hatch-by-hatch 24 100Hatch-by-hatch with powder 96 400
bt
rttmw
tnsaht
fihit
it
•
Layer-by-layer 4 174-Layer-by-4-layer 1.33 6High-fidelity 128 533
y-4-layer strategies are compared with the hatch-by-hatch resultaken as a reference.
Observe that, when using a layer-by-layer strategy, the cor-esponding energy density is spread uniformly. Hence, theemperature plots must be intended as an average evolution of theemperature field of the layer, with no direct relationship with the
easurement locations. Clearly, the CPU-time is notably reducedhen adopting the layer-by-layer strategy, as shown in Table 5.
Finally, a further scanning strategy has been defined to be closero the actual hatching sequence of the SLM machine. This new scan-ing pattern is depicted in Fig. 11(C) and the resulting simulationtrategy is referred to as high-fidelity. The process parameters usedre the same as those in Table 2, except for the hatch width, whichas a value of 1 mm. Fig. 17 compares the high-fidelity results withhe experimental data at thermocouple locations CH1 and CH2.
The similarities between the hatch-by-hatch and the high-delity scanning strategies are clear (Fig. 18). However, theigh-fidelity model required a computational time 5 times longer,
f compared to the hatch-by-hatch strategy: 32 h and 6 h, respec-ively.
The assessment of the numerical model has given a betternsight into the accuracy, computational cost, and applicability ofhe different model reduction techniques presented in this work:
Excluding the powder-bed from the computational modelreduces significantly the size of the spatial discretisation and alsothe uncertainty associated to the approximation of the powder
thermophysical properties. Nonetheless, it leads to a less physi-cally representative model with lower accuracy. This modellingstrategy should be avoided whenever the local thermal historymust be accurately predicted.facturing 18 (2017) 171–185 183
• As for the scanning strategies, summarised in Table 6, the reduc-tion of CPU-time is accompanied by poorer accuracy. In spite ofthis, high-fidelity and hatch-by-hatch techniques are already ableto match the thermocouple precision. For this reason, they are anefficient alternative to assist in many engineering decisions, suchas selection of the process parameters, design of the scanningpath, orientation of the part, or the number of parts printed in abuild.
Apart from that, different domain sizes should be considered fordifferent reduced models. In this sense, the authors recommendto use high-fidelity and hatch-by-hatch strategies from mediumbuild sizes (>100 mm3), layer-by-layer strategies for large builds(>10 cm3and100 −−500layers), and multi − layered strategiesonlyforvery largebuilds withseveral components(>100cm3 and above500 layers).
6. Conclusions
In this work, a FE framework for the numerical simulation of theheat transfer analysis of AM processes by powder-bed technology isdetailed. The formulation is supplemented by an apropos FE activa-tion technique to deal with the sintering process which transformsthe metal powder into a new solid layer.
The numerical model accounts for the power input and the cor-responding power absorption, the temperature dependency of thematerial properties and the heat dissipation through the bound-aries by conduction, convection and radiation.
The experimental calibration of the model is performed bydefining a benchmark manufactured using the EOSINT M280machine available at MCAM laboratories and instrumented withdifferent thermocouples. The scale of the experiment (geometry,number of layers, build time) is close to the current technologicallimits of the machine, but also a computational challenge, wherespecifying mesh sizes of the order of the laser spot size leads toextremely large problems.
In a first stage, the powder bed is excluded from the domain ofanalysis and the scanning sequence is approximated. Both assump-tions have an impact on the accuracy of the local complex thermalhistory, but are necessary to carry out the calibration and sensi-tivity analysis in reasonable computational times. Even with thesereductions, the model is capable of accurately capturing the globalthermal response.
Heat dissipation through the powder bed is accounted for withan equivalent boundary condition in terms of Newton’s law ofcooling. This heat dissipation mechanism and the definition of thepower input have been identified as the most sensitive mechanismsto assess the simulation accuracy.
In a next stage, different numerical strategies are analysedto find the best one in terms of computational cost vs simu-lation accuracy. First, the powder bed is added to the analysis.Afterwards, alternative scanning strategies are investigated by con-sidering: simplified hatch-by-hatch patterns, layer-by-layer andmulti-layer-by-multi-layer building sequences.
Excluding the powder bed from the computational domainreduces CPU-time and avoids the characterisation of the mate-rial powder. However, it is necessary to define the equivalent HTCbetween the samples and the powder, as well as the average tem-perature of the powder far from the HAZ. The powder bed can besplit into different regions with different average temperatures.This is relevant when more components are printed on the samebuilding platform at the same time.
Regarding the scanning strategies, a layer-by-layer or a multi-layered approach significantly reduces the computational effort.However, this modelling strategy is only able to capture an aver-age evolution of the temperature field during the manufacturing

184 M. Chiumenti et al. / Additive Manufacturing 18 (2017) 171–185
Table 6Comparison of simplified scanning strategies.
Strategy Accuracy CPU-time Applications Build size
Mesh size ≈ laser spot size • • • • • • • • • • Thermomechanical, mesoscale, and microscale analyses. AnyHigh-fidelity • • • ◦ ◦ • • • • ◦ Optimisation of process params., scanning path
gn.Medium or large
ber ontatio
pttsctp
A
PgP
CataHSt
EsARtp
R
[
[
[
[
[
[
[
[
[
[
[
[
[
[
[
[
[
[[
[
[
[
[
[
[
desiHatch-by-hatch • • • ◦ ◦ • • • ◦ ◦Layer-by-layer • • ◦ ◦ ◦ • • ◦ ◦ ◦ Num
orien-Layer-by-n-layer • ◦ ◦ ◦ ◦ • ◦ ◦ ◦ ◦
rocess. To capture the local thermal history at the thermocouples,he high-fidelity approach is preferred because the energy distribu-ion according to the actual scanning sequence is retained. Finally,implified hatch-by-hatch patterns strike a good balance betweenomputational effort and accuracy, turning them into a competi-ive alternative for optimisation of process parameters and processlanning.
cknowledgements
Financial support from the EC – Factories of the Future (FoF)rogram under the CA × Man Project – Computer Aided Technolo-ies for Additive Manufacturing – within Horizon 2020 Frameworkrogramme is gratefully acknowledged.
E. Neiva gratefully acknowledges the support received from theatalan Government through a FI fellowship. S. Badia gratefullycknowledges the support received from the Catalan Governmenthrough the ICREA Acadèmia Research Program. E. Salsi gratefullycknowledges the support received from the European Union’sorizon 2020 research and innovation programme under the Mariekłodowska-Curie Grant Agreement No. 746250. Financial supporto CIMNE via the CERCA Programme/Generalitat de Catalunya.
The experimental work is funded by the Science & Industryndowment Fund program RP04-153 Manufacturing a small demon-trator aero-engine entirely through additive manufacturing andustralia Research CouncilIH130100008 Industrial Transformationesearch Hub for Transforming Australia’s Manufacturing Industryhrough High Value Additive Manufacturing, including financial sup-ort from Safran Power Units and Amaero Engineering.
eferences
[1] A. Anca, V.D. Fachinotti, G. Escobar-Palafox, A. Cardona, Computationalmodelling of shaped metal deposition, Int. J. Numer. Methods Eng. 85(January (1)) (2011) 84–106.
[2] G. Bugeda, M. Cervera, G. Lombera, Numerical prediction of temperature anddensity distributions in selective laser sintering processes, Rapid Prototyp. J. 5(1) (1999) 21–26.
[3] M. Cervera, C. Agelet De Saracibar, M. Chiumenti, Thermo-mechanicalanalysis of industrial solidification processes, Int. J. Numer. Methods Eng. 46(9) (1999) 1575–1591.
[4] M. Cervera, C. Agelet de Saracibar, M. Chiumenti, Comet: Coupled Mechanicaland Thermal Analysis, Data Input Manual, International Center for NumericalMethods in Engineering (CIMNE), Barcelona, 2002.
[5] M. Chiumenti, C.A. de Saracibar, M. Cervera, On the numerical modeling of thethermomechanical contact for metal casting analysis, J. Heat Transf. 130 (6)(2008) 061301.
[6] M. Chiumenti, M. Cervera, A. Salmi, C.A. De Saracibar, N. Dialami, K. Matsui,Finite element modeling of multi-pass welding and shaped metal depositionprocesses, Comput. Methods Appl. Mech. Eng. 199 (37) (2010) 2343–2359.
[7] M. Chiumenti, M. Cervera, N. Dialami, B. Wu, L. Jinwei, C. Agelet de Saracibar,Numerical modeling of the electron beam welding and its experimentalvalidation, Finite Elem. Anal. Des. 121 (2016) 118–133.
[8] M. Chiumenti, X. Lin, M. Cervera, W. Lei, Y. Zheng, W. Huang, Numericalsimulation and experimental calibration of additive manufacturing by blownpowder technology. Part I: Thermal analysis, Rapid Prototyp. J. 23 (2) (2017)448–463.
[9] K. Dai, L. Shaw, Distortion minimization of laser-processed componentsthrough control of laser scanning patterns, Rapid Prototyp. J. 8 (5) (2002)270–276.
10] C.A. De Saracibar, M. Cervera, M. Chiumenti, On the formulation of coupledthermoplastic problems with phase-change, Int. J. Plast. 15 (1) (1999) 1–34.
[
[
f parts on single build, location andn of parts.
Large
11] D. Deng, H. Murakawa, Numerical simulation of temperature field andresidual stress in multi-pass welds in stainless steel pipe and comparisonwith experimental measurements, Comput. Mater. Sci. 37 (3) (2006) 269–277.
12] D. Deng, H. Murakawa, W. Liang, Numerical simulation of welding distortionin large structures, Comput. Methods Appl. Mech. Eng. 196 (45) (2007)4613–4627.
13] E.R. Denlinger, J.C. Heigel, P. Michaleris, Residual stress and distortionmodeling of electron beam direct manufacturing Ti–6Al–4V, Proc. Inst. Mech.Eng. Part B: J. Eng. Manuf. 229 (October (10)) (2015) 1803–1813.
14] E.R. Denlinger, V. Jagdale, G.V. Srinivasan, T. El-Wardany, P. Michaleris,Thermal modeling of Inconel 718 processed with powder bed fusion andexperimental validation using in situ measurements, Addit. Manuf. 11 (July)(2016) 7–15, ISSN 2214-8604.
15] E.R. Denlinger, M. Gouge, J. Irwin, P. Michaleris, Thermomechanical modeldevelopment and in situ experimental validation of the Laser Powder-BedFusion process, Addit. Manuf. 16 (August) (2017) 73–80.
16] A.J. Dunbar, E.R. Denlinger, M.F. Gouge, P. Michaleris, Experimental validationof finite element modeling for laser powder bed fusion deformation, Addit.Manuf. 12 (October (Pt A)) (2016) 108–120.
17] J. Goldak, A. Chakravarti, M. Bibby, A new finite element model for weldingheat sources, Metall. Trans. B 15 (2) (1984) 299–305.
18] J.A. Goldak, M. Akhlaghi, Computational Welding Mechanics, Springer Science& Business Media, 2006.
19] N.E. Hodge, R.M. Ferencz, R.M. Vignes, Experimental comparison of residualstresses for a thermomechanical model for the simulation of selective lasermelting, Addit. Manuf. 12 (October (Pt B)) (2016) 159–168.
20] D. Hu, R. Kovacevic, Modelling and measuring the thermal behaviour of themolten pool in closed-loop controlled laser-based additive manufacturing,Proc. Inst. Mech. Eng. Part B: J. Eng. Manuf. 217 (4) (2003) 441–452.
21] J. Irwin, P. Michaleris, A line heat input model for additive manufacturing, J.Manuf. Sci. Eng. 138 (June (11)) (2016), 111004–111004-9.
22] S. Kolossov, E. Boillat, R. Glardon, P. Fischer, M. Locher, 3D FE simulation fortemperature evolution in the selective laser sintering process, Int. J. Mach.Tools Manuf. 44 (February (2–3)) (2004) 117–123.
23] M. Labudovic, D. Hu, R. Kovacevic, A three dimensional model for direct lasermetal powder deposition and rapid prototyping, J. Mater. Sci. 38 (1) (2003)35–49.
24] P. Lacki, K. Adamus, Numerical simulation of the electron beam weldingprocess, Comput. Struct. 89 (11) (2011) 977–985.
25] Y. Lee, W. Zhang, Modeling of heat transfer, fluid flow and solidificationmicrostructure of nickel-base superalloy fabricated by laser powder bedfusion, Addit. Manuf. 12 (October) (2016) 178–188.
26] Y. Li, D. Gu, Thermal behavior during selective laser melting of commerciallypure titanium powder: numerical simulation and experimental study, Addit.Manuf. 1-4 (October) (2014) 99–109.
27] L.-E. Lindgren, Computational Welding Mechanics, Elsevier, 2014.28] A. Lundbäck, L.-E. Lindgren, Modelling of metal deposition, Finite Elem. Anal.
Des. 47 (October (10)) (2011) 1169–1177.29] S. Marimuthu, D. Clark, J. Allen, A. Kamara, P. Mativenga, L. Li, R. Scudamore,
Finite element modelling of substrate thermal distortion in direct laseradditive manufacture of an aero-engine component, Proc. Inst. Mech. Eng.Part C: J. Mech. Eng. Sci. 227 (9) (2013) 1987–1999.
30] L. Parry, I. Ashcroft, R. Wildman, Understanding the effect of laser scanstrategy on residual stress in selective laser melting throughthermo-mechanical simulation, Addit. Manuf. 12 (October) (2016) 1–15.
31] N. Patil, D. Pal, H. Khalid Rafi, K. Zeng, A. Moreland, A. Hicks, D. Beeler, B.Stucker, A generalized feed forward dynamic adaptive mesh refinement andderefinement finite element framework for metal laser sintering – Part I:Formulation and algorithm development, J. Manuf. Sci. Eng. 137 (August (4))(2015) 041001.
32] R.B. Patil, V. Yadava, Finite element analysis of temperature distribution insingle metallic powder layer during metal laser sintering, Int. J. Mach. ToolsManuf. 47 (7) (2007) 1069–1080.
33] P. Peyre, P. Aubry, R. Fabbro, R. Neveu, A. Longuet, Analytical and numericalmodelling of the direct metal deposition laser process, J. Phys. D: Appl. Phys.41 (2) (2008) 025403.
34] P. Prabhakar, W. Sames, R. Dehoff, S. Babu, Computational modeling ofresidual stress formation during the electron beam melting process forInconel 718, Addit. Manuf. 7 (July) (2015) 83–91.
35] M. Rahman, W. Maurer, W. Ernst, R. Rauch, N. Enzinger, Calculation ofhardness distribution in the HAZ of micro-alloyed steel, Weld. World 58 (6)(2014) 763–770.
36] I.A. Roberts, C.J. Wang, R. Esterlein, M. Stanford, D.J. Mynors, Athree-dimensional finite element analysis of the temperature field during

Manu
[
[
[
[
[
[
[
[
[
[powders: simulation and experimental study, Int. J. Adv. Manuf. Technol. 51(November (5–8)) (2010) 649–658.
[47] L. Zhang, E.W. Reutzel, P. Michaleris, Finite element modeling discretizationrequirements for the laser forming process, Int. J. Mech. Sci. 46 (April (4))
M. Chiumenti et al. / Additive
laser melting of metal powders in additive layer manufacturing, Int. J. Mach.Tools Manuf. 49 (October (12–13)) (2009) 916–923.
37] D. Rosenthal, Mathematical theory of heat distribution during welding andcutting, Weld. J. 20 (5) (1941) 220s–234s.
38] B. Song, S. Dong, H. Liao, C. Coddet, Process parameter selection for selectivelaser melting of Ti6Al4V based on temperature distribution simulation andexperimental sintering, Int. J. Adv. Manuf. Technol. 61 (August (9–12)) (2012)967–974.
39] The Common Layer Interface (CLI) Universal Format, Common Layer Interface(CLI) Version 2.0 File Description, n.d. (accessed: 26.08.16).
40] Y. Tian, C. Wang, D. Zhu, Y. Zhou, Finite element modeling of electron beamwelding of a large complex Al alloy structure by parallel computations, J.Mater. Process. Technol. 199 (1) (2008) 41–48.
41] B. Xiao, Y. Zhang, Laser sintering of metal powders on top of sintered layersunder multiple-line laser scanning, J. Phys. D: Appl. Phys. 40 (21) (2007) 6725.
42] S. Xue, J.W. Barlow, Models for the prediction of the thermal conductivities ofpowders, in: Solid Freeform Fabrication Symposium Proceedings, Center forMaterials Science, University of Texas at Austin, Austin, TX, 1991, pp. 62–69.
facturing 18 (2017) 171–185 185
43] S. Yagi, D. Kunii, Studies on effective thermal conductivities in packed beds,AIChE J. 3 (September (3)) (1957) 373–381.
44] J. Yin, H. Zhu, L. Ke, W. Lei, C. Dai, D. Zuo, Simulation of temperaturedistribution in single metallic powder layer for laser micro-sintering, Comput.Mater. Sci. 53 (1) (2012) 333–339.
45] S. Zekovic, R. Dwivedi, R. Kovacevic, Thermo-structural finite element analysisof direct laser metal deposited thin-walled structures, in: Proceedings SFFSymposium, Austin, TX, 2005.
46] D.Q. Zhang, Q.Z. Cai, J.H. Liu, L. Zhang, R.D. Li, Select laser melting of W–Ni–Fe
(2004) 623–637.