numerical modeling of mud volcanoes and their … filemurton and biggs 2 marine geology 14/6/01 our...
TRANSCRIPT
Murton and Biggs 1 Marine Geology 14/6/01
NUMERICAL MODELING OF MUD VOLCANOES AND THEIR FLOWS USING
CONSTRAINTS FROM THE GULF OF CADIZ
Bramley Murton and Juliet Biggs*
Southampton Oceanography Centre, Empress Dock, Southampton, SO14 3ZH, EnglandE_mail: [email protected]
*Currently at: Dept. of Earth Sciences, University of Cambridge, Downing Street, Cambridge, CB23EA, England.
Abstract
Mud volcanoes, ranging in size between 50cm and 800m high, are found both on land and in
submarine environments. Their variation in height and shape reflects the driving forces building
them and the physical properties of their materials. The driving force behind the construction of
mud volcanoes is overpressure of fluidised mud at depth within the sediment column. Although
some component of overpressure may derive from volatile generation in a mud reservoir by
dehydration of clay minerals and regional tectonic compressive stresses, a major parameter is the
thickness of the sediment column. The maximum height theoretically attained by mud volcanoes is,
therefore, largely a function of the density contrast between the fluidised mud and its sedimentary
overburden, and the depth of the mud source. From a model of isostatic compensation between the
mud column and the sediment column, we are able to predict the depth of fluidised mud reservoirs
beneath mud volcanoes. Once erupted, the general behaviour of mud flows is also predictable.
Using a viscous-gravity current model to describe the eruption of individual mud flows, we argue
that conical-shaped mud volcanoes comprise multiple, superimposed radial flows. The model
demonstrates that the thickness, eruption rate and speed of mud flows is strongly dependant on the
viscosity, density and over-pressure of the fluidised mud. Assuming continuity in these parameters,
the model predicts the lowermost flows will be the oldest, thickest and have the greatest length
while the uppermost flows will be the youngest and thinnest and shortest. This model is in contrast
to more traditional models of stratiform mud volcano construction in which younger flows
progressively bury older ones and travel furthest from the summit.
Murton and Biggs 2 Marine Geology 14/6/01
Our model predictions are tested against observations of submarine mud volcanoes in the Gulf of
Cadiz and the Moroccan Margin. The surface morphology of two prominent circular mud
volcanoes, their bathymetric profiles and evidence from gravity cores taken from their summits are
consistent with the volcanoes having reached their maximum height, and being formed from a
series of superimposed radial flows in which the outer ones are oldest. Applying our model to the
two studied mud volcanoes, we derive quantitative estimates of flow rates, exit and flow velocities,
eruption durations, heights and conduit radii. For example, with an average kinematic viscosity of
1.5m2s-1 for the fluidised mud breccia, a density of 1.8 g/cc, and individual flow heights of between
1.3m and 1.6m, we calculate eruption rates of between 10 and 20m3s-1. At these rates, the mud
flows require between 5 and 12hrs to reach the flanks of the volcanoes. For a flow rate of 10m3s-1,
the volcano has an average conduit radius of 1.4m, giving an exit velocity for the fluidised mud
breccia of about 1.6ms-1. Also, using our model of isostatic compensation, we predict the depth of
the mud reservoir to be about 4600m. To construct conical-shaped mud volcanoes of ~250m height,
like the two studied in the Gulf of Cadiz, we estimate a total of ~234 flows taking a minimum of
117 days of eruption activity.
469 words
Key words: Mud volcanoes, numerical modelling, Gulf of Cadiz
1 Introduction
Submarine mud volcanoes, ranging in size between 50cm and 800m high occur world-wide on
continental shelves, slopes and in the abyssal parts of inland seas. It is estimated that total number
of submarine mud volcanoes is between one thousand and one hundred thousand (Milkov, 2000).
Two major processes are identified as forming mud volcanoes: high sedimentation rates and lateral
tectonic compression, both causing over-pressure of a fluidised mud source at depth within the
sediment column. Within these processes, two basic mechanisms are further thought to account for
the actual eruption of fluidised mud on the sea floor: the unroofing and exposure of upward
migrating shale diapirs, and the rise of fluidised sediments along crustal pathways that typically
include fault planes. In both cases, fluid subsurface migration is considered critical to the formation
of mud volcanoes (Milkov, 2000).

Murton and Biggs 3 Marine Geology 14/6/01
Some studies (e.g. from the Barbados accretionary complex) have linked the morphology of
submarine mud volcanoes to different development stages and processes of mud fluidisation
(Limonov et al., 1997; Lance et al., 1998). Conical-shaped mud volcanoes ("mud-mounds" or
gryphons), that do not have any central summit "mud lakes" (or salses), are formed by the
expulsion of plastic mud in concentric radial flows. In contrast, shearing within the feeder conduit
liquifies the mud leading to the formation of flat-top mud volcanoes ("mud-pies") with central
"mud lakes" and elongated, radial mud-flow tongues. In both types, the mud is found to have
plastic fluid behaviour in which the plastic threshold decreases with porosity. Thixotropy is
associated with high porosity (e.g. more than 70%), which is often related to the dissociation of gas
hydrate (Lance et al., 1998).
Often mud volcanoes are associated with methane fluxes, either as free gas or, depending on
ambient temperature and pressure conditions, as gas hydrate (Limonov et al., 1997; Cronin et al.,
1997). On this basis, Hovland et al. (1997) argue that the global flux of methane to the atmosphere
from the world's terrestrial and submarine mud volcanoes is "highly significant".
The relative difficulty in studying submarine mud volcanoes, compared with their terrestrial
counterparts, leaves substantial gaps in our knowledge about modes of formation, the duration and
frequency of eruptions and the fluxes of mud and volatiles from the subsurface. Here, we attempt to
introduce a simplified, numerical model for the formation of conical-shaped mud volcanoes. Our
model is based on data for mud volcanoes in the Gulf of Cadiz, collected during cruises TTR-9 and
TTR-10 of the RV Professor Logachev. The model yields estimates for eruption rate and duration
of the two individual mud volcanoes. Although we base our model on what are described as the
"conical" types of mud volcano, it is useful as a way of identifying the first order paramaters that
control mud volcano formation in general and as a way of estimating the fluxes of fluids from the
subsurface.
2 Data

Murton and Biggs 4 Marine Geology 14/6/01
The data used here are from a study of the Gulf of Cadiz, made during cruises TTR-9 and TTR10
of the R/V Professor Logachev (figure 1) and reported primarily by Gardner (2000) in Kenyon et
al., (2000).
2.1 Geological Setting
Interaction between the Iberian and African plates have resulted in a complex sedimentary and
tectonic history for the Gulf of Cadiz and adjacent continental margins, in the eastern North
Atlantic. This history includes several episodes of extension and compresion since the Triassic
(Wilson et al., 1989, Dewey et al., 1989; Srivasta et al., 1990; and Maldonado et al., 1999). During
the Late Tortonian, westward movement of the Gibralta Arc caused the Gulf of Cadiz to form a
forearc basin (Maldonado and Comas, 1992). As a result, olistrome emplacement occurred forming
accretionary wedge-type clastic deposition and later deformation (Blankenship, 1992; Flynch et al.,
1996; Maldonado and Somoza, 1997; Maldonado et al., 1999). In the Early Pliocene, extensional
collapse of the basin, coupled with mud and shale diapirism, influenced sediment deposition
(Rodero et al., 1999; Maldonado et al, 1999).
During research cruise TTR-9, three regions of mud volcanism were identified in the Gulf of Cadiz
region: the Western Moroccan Field, Middle Moroccan Field and Eastern Moroccan Field
(Gardner, 2000; Gardner, 2001). Here, we focus on results from two mud volcanoes (named Yuma
and Ginsburg - Gardner, 2000), identified in the Middle Moroccan Field. These were initially
identified from 30kHz sidescan sonar records, and subsequently confirmed from deep-tow camera
observations, grab and gravity cores (Gardner, 2000). Single channel seismic data reveal that mud
volcanism post-dates sedimentation and is probably Holocene to recent in age (Gardner, 2000).

Murton and Biggs 5 Marine Geology 14/6/01
Figure 1 Location map of the study area in the Gulf of Cadiz, eastern North Atlantic.
The two mud volcanoes, Yuma and Ginsburg, lie along an approximately NNW-SSE-oriented line.
Their centres are separated by ~7km, and both volcanoes are roughly 4km in diameter with a
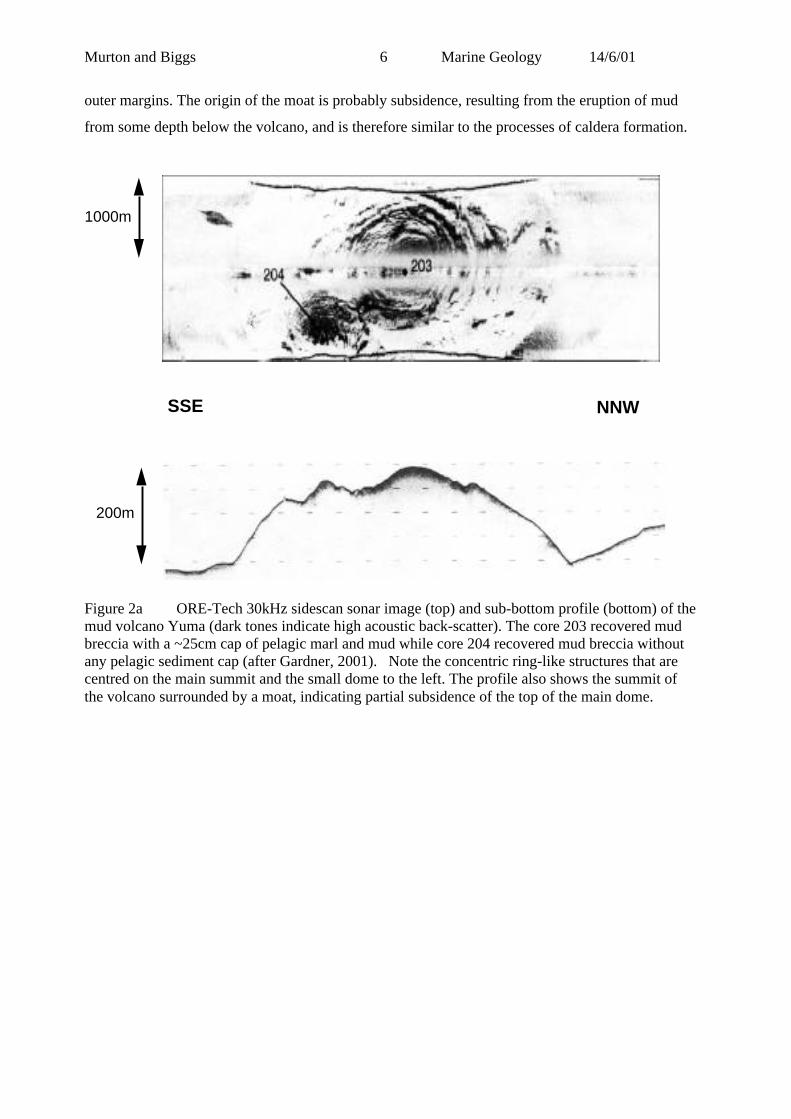
vertical relief of about 200m (Figure 2a and b). The northern-most mud volcano (Yuma) consists of
a large, flat-topped dome, upon which is a smaller dome. Both domes have concentric ring
structures of high back scatter facies surrounding their centres. Theses ring structures have an
amplitude of up to a meter, and comprises circular ridges and troughs. On gravity coring, it was
found that the summit of the main dome had a thin layer of pleagic clay and marl (less than 50cm
thick) overlying a thick sequence of mud breccia, while pelagic sediments were absent from the
smaller dome (Gardner, 2000). The southern-most mud volcano (Ginsburg) is of similar
proportions to Yuma, but comprises only one conical dome. Like Yuma, the Ginsburg dome is
surrounded by concentric rings of ridges and troughs, of a similar wavelength and amplitude.
Gravity cores from Ginsburg returned a thin layer of pelagic clay and marl overlying mud breccia
at the summit (Gardner, 2000). Both mud volcanoes have convex flank slopes, with Yuma having a
flatter top compared with Ginsburg. Thier flanks have similar gradients of about 1:10. Together,
Ginsburg and Yuma are located within a moat-like depression, 80-90m deep, that encloses their
Mad
erira
Horsedhoe Plain
Tagus Abyssal Plain
Gorringe bank
Tore
Ris
e
Coral Patch Seamounts
IBERIA
AFRICA
Gulf of Cadiz
Azores
20°W 18°W 16°W 14°W 12°W 10°W 8°W 6°W
20°W 18°W 16°W 14°W 12°W 10°W 8°W 6°W
40°N
38°N
36°N
34°N
40°N
38°N
36°N
34°N
Murton and Biggs 6 Marine Geology 14/6/01
outer margins. The origin of the moat is probably subsidence, resulting from the eruption of mud
from some depth below the volcano, and is therefore similar to the processes of caldera formation.
Figure 2a ORE-Tech 30kHz sidescan sonar image (top) and sub-bottom profile (bottom) of themud volcano Yuma (dark tones indicate high acoustic back-scatter). The core 203 recovered mudbreccia with a ~25cm cap of pelagic marl and mud while core 204 recovered mud breccia withoutany pelagic sediment cap (after Gardner, 2001). Note the concentric ring-like structures that arecentred on the main summit and the small dome to the left. The profile also shows the summit ofthe volcano surrounded by a moat, indicating partial subsidence of the top of the main dome.
1000m
200m
SSE NNW

Murton and Biggs 7 Marine Geology 14/6/01
Figure 2b ORE-Tech 30kHz sidescan sonar image (top) and sub-bottom profile (bottom) of themud volcano Ginsburg. The summit core 206G recovered mud breccia with a ~50cm cap of pelagicmarl and mud (after Gardner, 2001). Note, as for Yuma, the concentric ring-like structures that arecentred on the main summit of the dome. Also note the elongated flow-like structure on the right-hand flank. Unlike Yuma, however, the profile of Ginsburg is more conical indicating there hasbeen little subsidence.
Density measurements made on mud breccia immediately after recovery from the summits of both
mud volcanoes yield a range from 2.0g/cc to 1.75g/cc. Viscosity measurements were made for mud
breccia using a capillary method. This involved forcing a known volume of fresh mud breccia
through a tube of known diameter under constant pressure. Different volumes were tested and
repeated several times. The tests confirmed a plastic fluid behaviour for the mud breccia,
recognised for mud volcanoes elsewhere (Lance et al., 1998), and yielded a wide range of
kinematic viscosity (ν) of between 0.9 and 3m2s-1. The range of results reflect heterogeneities in the
mud breccia, with clastic fragments and variable fluidity. Shear strength measurements, made by
Gardner (pers comm.) yield shear strength values of ~5kPa and 8kPa for mud breccia recovered
from Ginsburg and Yuma, respectively. Although no free gas was evident in the mud breccias, in
1000m
200m
SSE NNW

Murton and Biggs 8 Marine Geology 14/6/01
situ gas hydrate crystals were recovered from approximately 1.5m below the summit of Yuma
(Gardner, 2000). The presence of free gas, variable fluid contents, as well as larger lithclasts (up to
several centimetres in diameter) within the mud breccia will alter its effective viscosity. For the
purposes of simplifying our modelling, we have treated the mud breccia as homogeneous and
assumed an average density of 1.8g/cc and effective kinematic viscosity of 1.5m2s-1. The accuracy
of these paramaters is not imperative here, since we are only developing a generic model for the
mud volcanoes. Variations in the parameter values may alter the final results, but will not alter the
general form of the model. Obviously, to more accurately constrain the evolution of individual
volcanoes, these paramaters need to be determined precisely for each system.
3 Results and Discussion
3.1 An isostatic Model
In the following section we develop a simple buoyancy model to relate the maximum height of a
mud volcano to the thickness of its overburden. Such a buoyancy–driven, or isostatic equilibrium,
concept is not new and has been applied to igneous volcanic provinces in the past (Vogt, 1974;
Cann and Smith, 1993). Its application to mud volcanoes is new, however, and can reveal important
information about the depth of the source of the mud breccia within the sediment pile. These
estimates allow, among other things, comparison with seismically determined depths to the mud
breccia source as well as indications of the stratigraphic depth of origin for lithoclasts contained
within the mud breccia (Sadekov and Ovsyannikov, 2000).
All mud volcanoes require that, at some depth within the sediment pile beneath them, they have a
reservoir or source of fluidised mud. What drives this mud to the surface is a combination of over
pressure, caused to a large extent by the density and weight of the overburden, with possible
contributions from mineral dehydartion reactions, as well as biogenic and authogenic gas
generation. Assuming over pressure is largely a function of overburden, the maximum height a mud
volcano can achieve is a balance between the weight of the over burden and the weight of the mud
column from the top of the volcano to the mud reservoir. For mud volcanoes that have achieved
their maximum height, we can assume that this reservoir is located at a depth of isostaic

Murton and Biggs 9 Marine Geology 14/6/01
compensation. For example, the pressure at the base of the column of mud breccia connecting the
reservoir to the top of the volcano, plus the overlying seawater, must equal the pressure at the base
of the sediment pile plus the overlying seawater (see figure 3).
Figure 3 Schematic figure describing the main feature of the isostatic columns of: mud
breccia, the mud volcano, and a two-layered sediment column model.
where,
ρm = density of mud ~ 1.8 x 10³ kgm-3
ρw = density of seawater ~ 1 x 10³ kgm-3
ρs1 = density of uppermost sediment ~ 1.65 x 10³ kgm-3
ρs2 = density of lowermost sediment ~ 1.9 x 10³ kgm-3
hs1 = height of uppermost sediment column (i.e 1km)
hs2 = height of lower sediment column above depth of isostatic compensation (i.e depth of mud reservoir -
to be determined)
h v
hw
hw- h v
hs
ρwρw
ρm
Normal Seafloor Column
Mud VolcanoColumn
ρs1
2ρs
1
hs2
mud volcano
mud breccia column
mud breccia source

Murton and Biggs 10 Marine Geology 14/6/01
hw = hieght of water column above surrounding seafloor
hv = height of volcano above surrounding seafloor ~ 266m (Ginsburg)
A critical parameter in this calculation is the density structure of the sediment pile through which
the mud breccia passes. Because no well data are available from the vicinity of Ginsburg and Yuma
mud volcanoes, we have used a compilation of sediment density values from accretionary
sedmentary sequences, extracted from ODP results (Mascle et al., 1988; Shipley et al., 1995; Karig,
1986; ODP www data source, 2001). The sediment density profile demonstrates an increase in
density from 1.3g/cc at the surface to approximately 2g/cc below a depth of 2000m subsurface
(figure 4). For the purposes of this contribution, we use a simplified two layer sediment density
model. For the uppermost 1km we use an average density of 1.65g/cc and for sediment deeper than
1km we assume an average density of 1.9g/cc.
Figure 4 Compilation of clastic sediment density from ODP holes in accretionary complexesincluding the Barbados Forearc Wedge (see references). The sediment column increases in densityfrom 1.3 to 1.9 over the uppermost 1km.
Gravity cores from the summits of both Yuma and Ginsburg mud volcanoes, taken during cruises
TTR9 and TTR10, found a drape of pelagic sediment overlying the mud breccia (Gardner, 2000).
1
1.2
1.4
1.6
1.8
2
2.2
2.4
0 1000 2000 3000 4000 5000
Sediment depth (m)
density (g/cc)
compilation from ODP wells
Murton and Biggs 11 Marine Geology 14/6/01
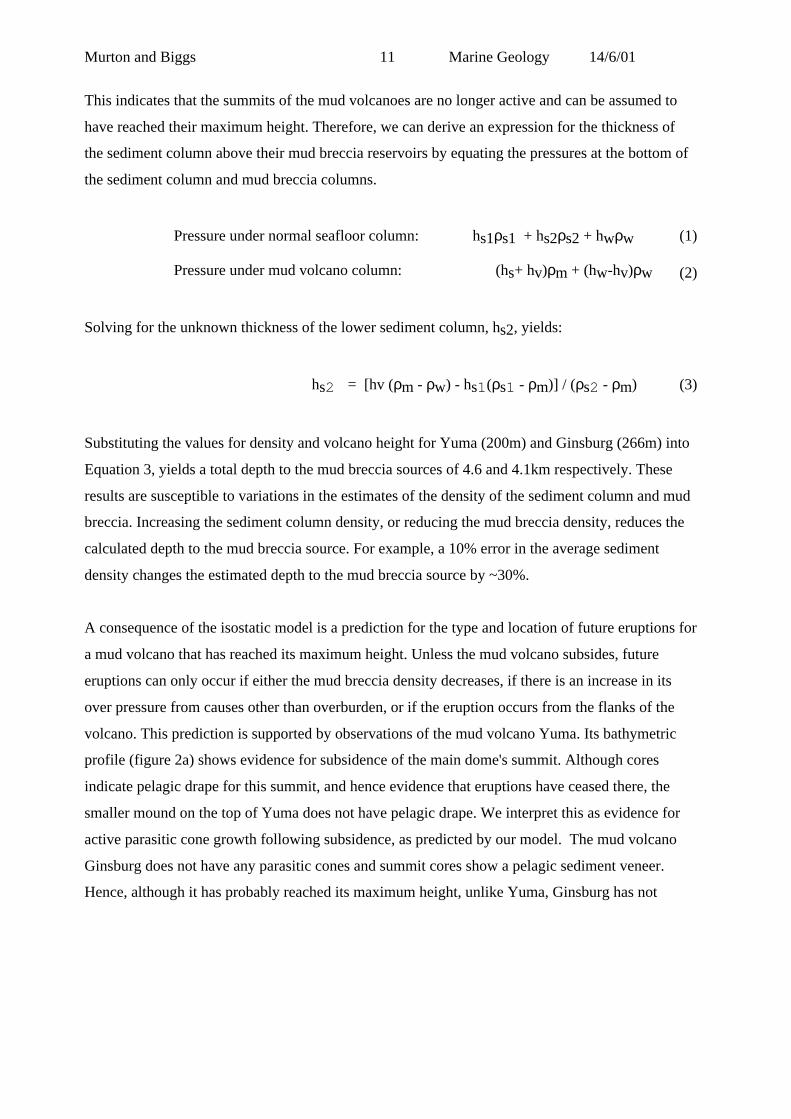
This indicates that the summits of the mud volcanoes are no longer active and can be assumed to
have reached their maximum height. Therefore, we can derive an expression for the thickness of
the sediment column above their mud breccia reservoirs by equating the pressures at the bottom of
the sediment column and mud breccia columns.
Pressure under normal seafloor column: hs1ρs1 + hs2ρs2 + hwρw (1)
Pressure under mud volcano column: (hs+ hv)ρm + (hw-hv)ρw (2)
Solving for the unknown thickness of the lower sediment column, hs2, yields:
hs2 = [hv (ρm - ρw) - hs1(ρs1 - ρm)] / (ρs2 - ρm) (3)
Substituting the values for density and volcano height for Yuma (200m) and Ginsburg (266m) into
Equation 3, yields a total depth to the mud breccia sources of 4.6 and 4.1km respectively. These
results are susceptible to variations in the estimates of the density of the sediment column and mud
breccia. Increasing the sediment column density, or reducing the mud breccia density, reduces the
calculated depth to the mud breccia source. For example, a 10% error in the average sediment
density changes the estimated depth to the mud breccia source by ~30%.
A consequence of the isostatic model is a prediction for the type and location of future eruptions for
a mud volcano that has reached its maximum height. Unless the mud volcano subsides, future
eruptions can only occur if either the mud breccia density decreases, if there is an increase in its
over pressure from causes other than overburden, or if the eruption occurs from the flanks of the
volcano. This prediction is supported by observations of the mud volcano Yuma. Its bathymetric
profile (figure 2a) shows evidence for subsidence of the main dome's summit. Although cores
indicate pelagic drape for this summit, and hence evidence that eruptions have ceased there, the
smaller mound on the top of Yuma does not have pelagic drape. We interpret this as evidence for
active parasitic cone growth following subsidence, as predicted by our model. The mud volcano
Ginsburg does not have any parasitic cones and summit cores show a pelagic sediment veneer.
Hence, although it has probably reached its maximum height, unlike Yuma, Ginsburg has not
Murton and Biggs 12 Marine Geology 14/6/01
experienced summit subsidence and hence there is no reactivation of eruptions. This interpretation
is also supported by the fact that Ginsburg is taller than Yuma (by 66m). Assuming both have a
similar depth source of fluidised mud, then the model predicts that the lower volcano would be the
more active, which it is.
3.2 An Eruption Model
In the next section, we attempt to model the processes controlling the eruption, spread and
thickness of individual mud breccia flows, and hence understand what ultimately determines the
shape of individual mud volcanoes. As already stated, the following modelling is essentially
generic. Although we apply it to conical mud volcanoes, and specifically to the two mud volcanoes
Yuma and Ginsburg, the form of the model is independent of the input values. The main value of
our modelling is to establish the critical parameters that need to be measured from mud volcanoes
to understand their physical formation, and to set order-of-magnitude constraints on some of the
processes.
3.2.1 Input parameters
In order to quantify the flows from mud volcano eruptions, a few basic controlling parameters need
to be known. Essential to all calculations involving flows of this type are the physical properties of
the fluid, in particular its density and viscosity. Strictly, the viscosity of the mud is a simplification,
since it exhibits a plastic fluid behaviour and has a finite shear strength. The finite shear strength is
demonstated by the fact that the mud volcanoes form elevated domes. A volcano comprising a
purely viscous, Newtonian fluid would continue spreading until its thickness tended towards zero.
For the purposes of our modelling, we assume a constant viscosity. Since the shear strength is
included in our measurement of the effective viscosity, and it is evident that the mud volcanoes
comprise a series of individual units, we assume gravity driven viscous flow to describe the
eruption and spread of the mud over the seafloor. The shear strength of the mud breccia only
becomes important at the outer boundary conditions of the flow (i.e. when the flow velocity tends
towards zero), when gravity induced, viscous stresses within the flow tend towards the value of the
shear strength. Similarly, we make no attempt to introduce any component of non-laminar flow
Murton and Biggs 13 Marine Geology 14/6/01
within the mud eruptions, nor is there any expression for friction between the flow and its base as
we consider these make a minor contribution to the total force balance.
3.2.2 A viscous-gravity current flow: a numerical analogue
To construct a simple model we can realistically analyse, we consider mud volcanoes to erupt at a
constant volume flux, Q, from a point source with a constant conduit diameter, onto a flat,
horizontal base. The volume flux, Q, is controlled by the buoyancy of the mud and its kinematic
viscosity, ν. This produces a radially symmetric, laminar flow, whose properties at a given radius
and time are uniform. In the case of a 'bottom current', such as that formed by a mud volcano, the
erupted material (density ρ) is denser that the ambient fluid (density ρa, where ρ > ρa ) and so it
flows along the bottom. The flow is driven by this density contrast which is usually expressed in
terms of 'reduced gravity', g', where:
g' = g∆ρ/ρ, (∆ρ = ρ - ρa) (4)
The flow is retarded by viscous drag (kinematic viscosity, ν) and is retarded by inertia, provided
the discharge Froude number is sub-critical, i.e.
Ui/ (g'hi)1/2 < 1 (5)
where Ui is the horizontal inflow velocity and hi is the depth of the inlet opening (after Didden and
Maxworthy, 1982)
For viscous gravity flows, Didden and Maxworthy (1982) describes three main forces, buoyancy,
viscosity and inertia, and compare the magnitudes of these at different time (t). For t < t1 (see Eqn
6), viscous drag is negligible and inertia is the dominant retarding force.
t1 = (Q/g' ν)1/2 (6)
In order to quantify this initial condition we need to produce an initial estimate of flow rate. The
isostatic model, already used to estimate the depth of the mud reservoir, can also be used to predict

Murton and Biggs 14 Marine Geology 14/6/01
the pressure difference (P) between the top and bottom of the eruptive column for an immature mud
volcano. In its initial stage of formation, the volcano is fed by a reservoir or source of mud at depth
within the sediment column. At this stage, the volcano has not yet formed any elevated structure at
the surface. The pressure difference between the ends of the eruptive column is thus equivalent to
the pressure at the base of a column of mud breccia equivalent in height to the depth of the mud
source. Using the mud volcano Ginsburg as an example, with an estimated reservoir depth of
4600m and a mud density of 1.8 x 10³kgm-3, the resulting pressure difference is 8.1x 10⁷Nm-2.
To estimate the flow rate of the mud breccia as it initially erupts, we treat the flow through the
volcano conduit (i.e. the open structure linking the summit of the volcano to the fluidised mud
source at depth) as forced viscous fluid flow through a capillary (see Equation 7). The driving force
is a result of the pressure difference between the top and bottom of the mud breccia column and the
retarding forces are viscous drag, friction between non-fluid components of the mud breccia and
the conduit wall and tortuosity of the conduit walls. Although our treatment of the eruption rate as
capillary flow is obviously simplified, the other effects can not be modelled since there is no
evidence for the physical structure of the conduit within and below the mud volcano. Although
these variations will ultimately alter resulting values, they have little effect on the general form of
the solution. With such an assumption we can apply equation 6 to describe the flow rate:
Q = Pπr4/8lη (7)
Where: P is the driving pressure, l is the length of the conduit (in this case the height of the initial
mud breccia column), r is the average radius of the conduit, and η is the dynamic viscosity of the
mud breccia.
Using the mud volcano Ginsburg as an example, we take the initial height of the eruptive column, l,
to be 4600m (derived from our isostatic model) and the dynamic viscosity, η, to be 3000 kgm-1
(measured from the mud breccia). Although none of the data for Ginsburg give a clear indication of
the radius of the conduit, its bathymetric profile shows an approximately flat top with a radius of
100m, providing us with a maximum dimension. To cover a range of possibilities, we calculate the
flow rate, Q, (from Equation 7) and the duration of the inertia-dominated flow, t1 (from Equation
6), for conduit radii across several orders of magnitude; e.g.

Murton and Biggs 15 Marine Geology 14/6/01
If r = 100m, Q = 2.3 x 10⁷m3s-1 , t1 = 2820s = ~1hrs
If r = 10m, Q = 2.3x 10³ m3s-1 t1 = 28s
If r = 1m, Q = 0.23 m3s-1, t1 = 0.3s
The sidescan sonar record for both Yuma and Ginsburg show that each volcano is at least 2 km in
diameter. Cores from the flanks of the volcanoes show individual mud flows of up to 0.5m thick
(Gardner, 2000). It is unlikely that individual viscous flows will take less than a few tens of
minutes to reach the margin of the volcano, and more likely that they take up to several tens of
hours or even days. As an initial condition, if we assume individual eruption duration is a matter of
tens of hours or days, and the conduit radius anything up to a few tens of metres, then the length of
the initial period of inertia dominated flow is negligible in comparison. For the time being,
therefore, if we assume that the conduit radius is of the order of several tens of metres radius, we
can ignore the initial period of inertially retarded flow behaviour. In the following sections, we will
gain a better estimate the volume flux, allowing us to return to this point; first to prove that t1 is
indeed negligible and second to improve our estimate of the conduit radius. Also, although the
effects of inertial retarding forces will change the details of the flow only during the initial brief
period, it will not significantly change the overall phenomena described here.
For t > t1, the dominant retarding force is the viscous drag force. In this regime, Didden and
Maxworthy (1982) calculate the height at the eruptive centre, h0, and the radius of the flow, R, to
be described by the following two expressions:
R ~ (g'Q3/ν)1/8t1/2 (8)
h0 ~ (νQ/g')1/4 (9)
(The symbol ~ denotes accuracy is only to the nearest order of magnitude)

Murton and Biggs 16 Marine Geology 14/6/01
Furthermore, by differentiating the radius with respect to time, and assuming a constant flow rate,
an expression for the velocity of the flow front, U, can be found:
U ~ (g'Q3/ν)1/8t-1/2 (10)
Estimation of Flow Rate
As a first approximation we consider the mud volcanoes to have been erupted as single events.
Using our measurements of volcano height, radius, viscosity and density (derived for mud breccia
from Yuma and Ginsburg), equation (9) predicts that an individual flow (h0) of approximately
200m height would require a flow rate of about 5 x 10⁹ m3s-1 to form. Equation (8) then predicts
an eruption duration of only 0.1s. These figures are obviously unrealistic and lead us to the
conclusion that the structure must be composed of a series of superimposed, discrete flows.
Equation (9) shows that the central height of an individual mud flow is independent of time. With
constant volume flux, the velocity of the flow front will decrease maintaining a constant flow
thickness. From this we make the assumption that the thickness of a flow, at any given radius, is
independent of time and equal to the height of the flow at its centre. The product of such a model is
a roughly cylindrical flow that spreads radially outwards from its central source or out flow point.
Subsequent eruptions will be superimposed upon preceding ones, building a layered mud volcano
structure.
During construction of mud volcanoes, the eruption of subsequent flows will add to the height of a
volcano. This will reduce the isostatic disequilibrium driving each new eruption, which in turn will
reduce the volume flux (Q) causing the new flow to be both thinner and spread more slowly (from
equations 8 and 9) than its predecessor. Therefore, our model predicts an idealised structure for a
conical mud volcano, like Ginsburg, as one composed of multiple, laminar flows, stacked vertically
and each decreasing in thickness and radius with height (figure 5). Because the surface of each flow
Murton and Biggs 17 Marine Geology 14/6/01
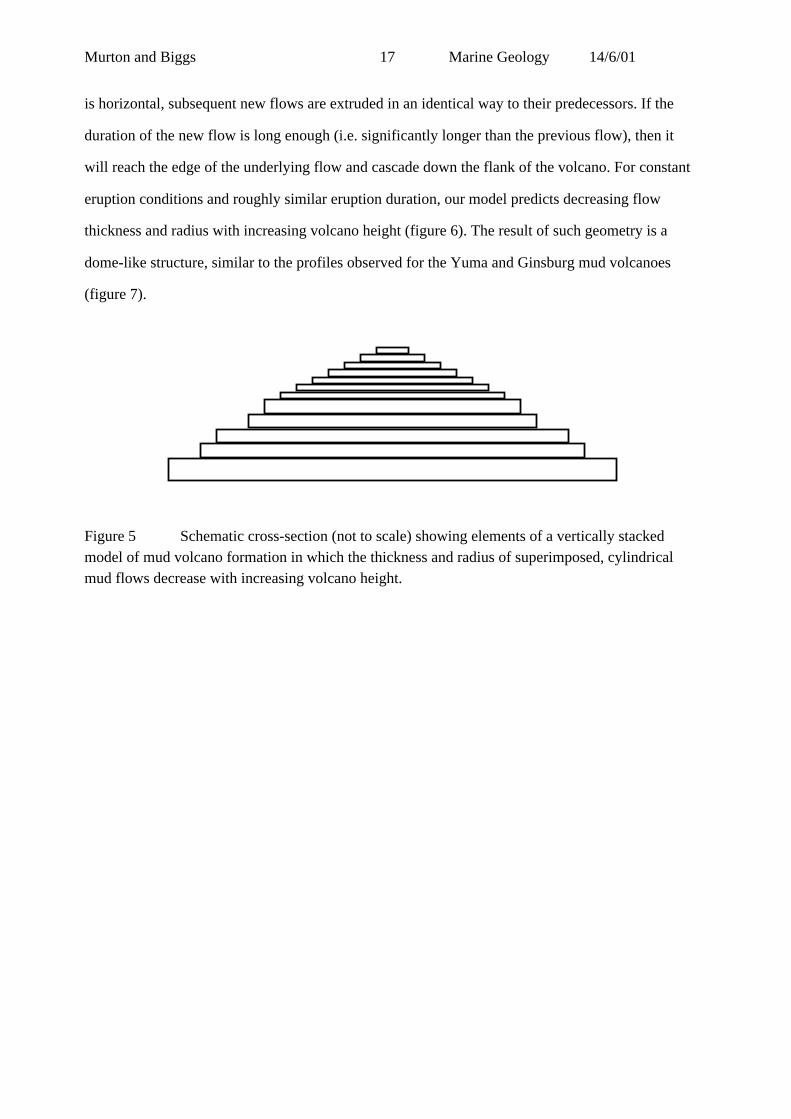
is horizontal, subsequent new flows are extruded in an identical way to their predecessors. If the
duration of the new flow is long enough (i.e. significantly longer than the previous flow), then it
will reach the edge of the underlying flow and cascade down the flank of the volcano. For constant
eruption conditions and roughly similar eruption duration, our model predicts decreasing flow
thickness and radius with increasing volcano height (figure 6). The result of such geometry is a
dome-like structure, similar to the profiles observed for the Yuma and Ginsburg mud volcanoes
(figure 7).
Figure 5 Schematic cross-section (not to scale) showing elements of a vertically stackedmodel of mud volcano formation in which the thickness and radius of superimposed, cylindricalmud flows decrease with increasing volcano height.

Murton and Biggs 18 Marine Geology 14/6/01
Figure 6 Results of modelling individual mud flow thickness and radius with height of thevolcano, using the isostatic equilibrium model to derive the driving force for eruption and a viscous
gravity current flow model for each mud flow. The flow thickness decreases because, as thevolcano height increases, the driving force decreases resulting in a lower volume flux for theerupted mud breccia. Similarly, the flow radius decreases, as the volcano height increases, as a
result of a lower volume flux and hence lower spreading rate for the erupted mud breccia.
0
200
400
600
800
1000
1200
1400
0 50 100 150 200 250 300height of volcano (m)
radius of flow (m)
0.00
0.20
0.40
0.60
0.80
1.00
1.20
1.40
1.60
thickness of flow (m)
Murton and Biggs 19 Marine Geology 14/6/01
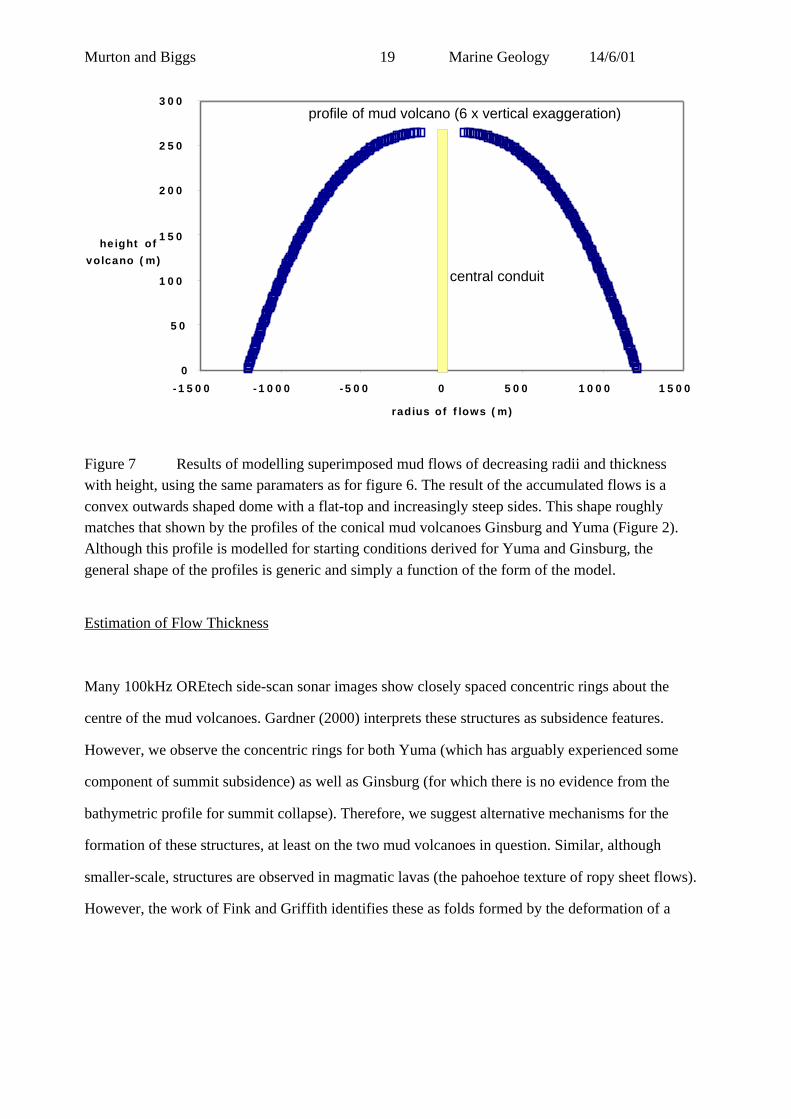
Figure 7 Results of modelling superimposed mud flows of decreasing radii and thicknesswith height, using the same paramaters as for figure 6. The result of the accumulated flows is a
convex outwards shaped dome with a flat-top and increasingly steep sides. This shape roughlymatches that shown by the profiles of the conical mud volcanoes Ginsburg and Yuma (Figure 2).Although this profile is modelled for starting conditions derived for Yuma and Ginsburg, the
general shape of the profiles is generic and simply a function of the form of the model.
Estimation of Flow Thickness
Many 100kHz OREtech side-scan sonar images show closely spaced concentric rings about the
centre of the mud volcanoes. Gardner (2000) interprets these structures as subsidence features.
However, we observe the concentric rings for both Yuma (which has arguably experienced some
component of summit subsidence) as well as Ginsburg (for which there is no evidence from the
bathymetric profile for summit collapse). Therefore, we suggest alternative mechanisms for the
formation of these structures, at least on the two mud volcanoes in question. Similar, although
smaller-scale, structures are observed in magmatic lavas (the pahoehoe texture of ropy sheet flows).
However, the work of Fink and Griffith identifies these as folds formed by the deformation of a
0
50
100
150
200
250
300
-1500 -1000 -500 0 500 1000 1500
height of
volcano (m)
radius of flows (m)
central conduit
profile of mud volcano (6 x vertical exaggeration)
Murton and Biggs 20 Marine Geology 14/6/01
solidifying crust. Obivously this is not applicable to submarine mud volcanoes since there is no
cooling effect of the mud breccia, which is erupted as a fluid at near the ambient temperature of the
seafloor, and no phase transition akin to the solidification during cooling of magmatic lava occurs.
An alternative explanation for the origin of the rings is a periodic fluctuation in flow rate during the
formation of the mud volcano as a single eruption event. However, our analysis has already ruled-
out a single eruption model for the formation of these volcanoes, requiring an alternative
explanation.
Instead, we propose that each ring represents an individual, near-circular, mud flow front. In this
case, our model predicts the lowermost flows are those which have the greatest radius and are
hence the oldest. Furthermore, these outermost rings are more likely to be partially obscured by
pelagic sediment drape and the effects of viscous slumping than the younger, innermost rings.
These predictions are supported by side-scan sonar images of the ring structures which show the
rings toward the centre are very sharply defined (i.e. with less slumping and drape), while the outer
rings appear smoother (i.e. partially buried by pelagic sediment and slumped flow fronts). Our
model does not preclude the over-spill of flows down the volcano flanks. Such over-spill is quite
feasible should the duration of an individual flow allow its front to expand beyond the limit of its
predecessor. However, such over-spills will have a different appearance on side-scan sonar records,
forming down-flank oriented tongues of mud breccia. Although an example of this is evident on the
NW flank of Ginsburg volcano (figure 2), their occurrence is rare on the two conical volcanoes in
question.
For the mud volcano Ginsburg, seven clearly identifiable rings were counted with radii of between
480m and 580m and at heights on the flanks of the volcano of between 125m and 219m (i.e.
spanning a height range of 94m). This gives an average individual flow thickness of 1.3m. For this
value, equation (9) yields a volume flux estimate (Q) of 10m3s-1. In turn, this is substituted into

Murton and Biggs 21 Marine Geology 14/6/01
equation (8) to give an estimated mud flow eruption duration of 12 hrs (i.e. to reach the average
radius for these flows of 530m). For the mud volcano, Yuma, six rings we visible between 420m
and 515m in radius spanning a height of 94m again. This averages to an individual flow thickness
of 1.6m, which when substituted into equation (9) yields a flow rate of 20m3s-1. From equation
(8), about 5hrs would be required to reach the average radius for these flows of 470m. The most
recent flows at the summit of the Yuma and Ginsburg volcanoes are indicated from gravity cores
(e.g. cores AT-203G, AT-204G, AT-206G and AT-213G) to rarely exceed 0.5m thick (Akhmanov
et al., 2000). However, using the constriants provded by the height, radius and mud breccia density
for the volcanoes Yuma and Ginsburg, our model predicts that flow thickness at the summit should
be about 0.4m (e.g. refer to figure 6), which is similar to those observed by Akhmanov et al.,
(2000).
Revised Estimate for Inertially-dominated Flow, Conduit Radius and Calculated Exit Velocity
Our calculated estimates for mud breccia flow rate can now be used to re-assess our preliminary
value of t1, the duration of the initial, inertially-dominated flow regime. We have estimates of flow
rates of between 10 and 20m3s-1 which, when substituted into equation (5), give values of t1as 1.2s
and 2.7s respectively. In comparison with our calculated total flow duration of between 5 and
12hrs, t1is negligible hence justifying our initial assumption.
The data from the mud volcano, Ginsburg, indicates a flow rate of 10m3s-1 at a height of 172m
above the surrounding sea-floor (i.e. height at which the mud flow was erupted) and a mud column
height of 4272m (i.e. 4100m = depth to mud source, plus 172m = height of volcano for calculated
mud flow). Using P = ρgh with ρ = 1.8 x 10³kgm-3, a pressure difference of 7.7 107Nm-2 is
created between the reservoir and the surface. Substituting these values into equation (7) for the
Murton and Biggs 22 Marine Geology 14/6/01
flow rate, Q, gives a conduit radius of only 1.4m. Note that equation (7), when solved for the radius
of the conduit, yields a result that is dependant only on the 1/4 power of the products of viscosity,
conduit length, volume flux, and driving pressure, and therefore is relatively insensitive to the
values of these parameters. Since the volume flux, Q, and exit velocity, ve, are linked only by the
conduit area, A, we can use these figures to determine the vertical velocity of the mud breccia as it
exits the top of the conduit.
Q = ve A (11)
ve = Q/πr2 (12)
Using a calculated volume flux (Q) of 10m3s-1, and a conduit radius (r) of 1.4m, yields a value for
the vertical ascent rate and exit velocity (ve ) of mud breccia at the top of the volcano of 1.6ms-1.
For the volcano Ginsburg, we calculate that, to achieve its observed height of 266 m, requires at
least 234 flows ranging in thickness from ~1.6m (near the base) to ~0.4m (at the summit).
Disregarding periods of inactivity, we calculate a total duration of eruption (i.e. constant for each
flow, but with an undefined hiatus between flows) of about 117 days.
4 Conclusions
The phenomena of mud volcanoes is common in ocean settings globally. Although a variety of
processes is probably involved in their formation, we can reduce the physical processes to a number
of dominant ones that describe the maximum height that a mud volcano can build, the thickness
and radii of individual flows, and the duration and volume flux for each erupted mud flow.
Together, these processes are responsible for the first-order shape of the mud volcano. We have
developed a model for the formation of conical-shaped mud volcanoes, based on buoyancy-driven,
viscously-retarted eruptions. Although a simplification, our modelling of the primary physical
Murton and Biggs 23 Marine Geology 14/6/01
processes allows us to predict the depth to the mud sources as well as determine the flux of material
erupted from within the sediment column. Minimum age constraints can be placed on the duration
of mud flow eruptions and hence on the volcano itself. More importantly, modelling allows an
understanding of the key parameters that control mud volcano evolution. Where different
morphologies are encountered, whether they are in the same mud volcano or between different
volcanoes, the models indicate what physical conditions are dominant in causing these changes.
Results from the modelling, applied to conical-shaped mud volcanoes in the Gulf of Cadiz, predict
an evolution in which the outermost flows are the oldest and thickest, and successively higher,
flows are younger, thinner and have smaller radii than those below. Individual flows, located half
way up the flanks of the mud volcanoes, Ginsburg and Yuma, are found to be between 1.3m and
1.6m. Using a model for viscous gravity flows (Didden and Maxworthy, 1982), flow rates are
calculated to be between 10 and 20m3s-1 requiring up to 12hrs duration and a conduit radius of
about 1.4m, giving an vertical exit velocity of 1.6ms-1. Based on our model, we predict that these
mud volcanoes comprises about 234 individual erupted over a minimum, cumulative period of
activity of 117 days.
Acknowledgements
We are indebted to Michael Ivanov, Neil Kenyon, Joan Gardner and José Monteiro for helpful
discussions concerning the nature of submarine mud volcanism and on specific aspects of this
work, as well as access to the data. Also to the officers and crew of the R/V Professor Logachev
without whom none of the data discussed here would be available. During this work, J. Biggs was
supported by a Southampton Oceanography Centre, Summer School scholarship. B. Murton is
supported by a Natural Environment Research Council core-strategic science programme, within
the Crustal Processes Group at Southampton Oceanography Centre.

Murton and Biggs 24 Marine Geology 14/6/01
References Cited
Akhmanov, G., Akhmetzhanov, A., Stadnitskaya, A., Kozlova, E., Mazurenka, L., Teixeira, F.,
Sautkin, A., Dixon, D., Ovsyannikov, D., Sadekov, A., Rasul, N., Belenkaya, I., Volakova, Yu.,
Suslova, E. and Goncharov, D. Mud diapirism and mud volcananism study: gulf of
Cadiz/Morroccan margin. In: Kenyon, N. H., Ivanov, M. K., Akhmetzhanov, A. M. and
Akhmanov, G. C., (eds), 2000. Multidisciplinary Study of the Geological Processes on the North
East Atlantic and Western Mediterranean Margins. IOC Technical Series 56, UNESCO, 101pp plus
figures.
Blankenship, C. L., 1992, Structure and palaogeography of the External betic Cordillera, southern
Spain. Marine and Petroleum Geology, 9, 256-264.
Cronin, B. T., Ivanov, M. K., Limonov, A. F., Egorov, A., Akhmanov, G. G., Akhmetjanov, A. M.,
Kozlova, E., 1997. New discoveries of mud volcanoes on the eastern Mediterranean
Ridge, Journal of the Geological Society,London, 154: 173-182.
Dewey, J. F., Helman, M. L., Turco, E., Hutton, D. H. W. and Knott, S. D. 1989. Kinematics of the
Western Mediterranean. In: Coward, M. (ed), Alpine Tectonis. Special Publication of the
Geological Society, London. 45, 265-283.
Didden N., Maxworthy T., 1982. The viscous spreading of plane and axisymmetric gravity
currents. Journal of Fluid Mechanics, 121, 27-42.
Flynch, J. A., Bally A. W. and Wu, S., 1996. Emplacement of a passive-margin evaporitic
alochthon in the Betic Cordillera of Spain. Geology, 24, 1, 67-70.
Gardner, J., 2000. Gulf of Cadiz/Moroccan margin, a mud diapirism and mud volcanism study. In:
Kenyon, N. H., Ivanov, M. K., Akhmetzhanov, A. M. and Akhmanov, G. C., (eds), 2000.
Multidisciplinary Study of the Geological Processes on the North East Atlantic and
Western Mediterranean Margins. IOC Technical Series 56, UNESCO, 101pp plus figures.
Gardner, J. M., 2001. Mud volcanoes revealed and sampled on the Western Moroccan continental
margin. Geophysical Research Letters, 28, 339-342.
Hovland, M., Hill, A., Stokes D., 1997. The structure and geomorphology of the Dashgil mud
volcano, Azerbaijan, Geomorphology, 21: (1) 1-15.
Karig, D.E., 1986. Physical properties and mechanical state of accreted sediments in the Nankai
Trough, S. W. Japan. In: Moore, J.C. (Ed.), Structural Fabrics in Deep Sea Drilling Project
Cores from Forearcs,. Mem. Geol. Soc. of Am., 66:117-133.
Murton and Biggs 25 Marine Geology 14/6/01
Kenyon, N. H., Ivanov, M. K., Akhmetzhanov, A. M. and Akhmanov, G. C., (eds) 2000.
Multidisciplinary Study of the Geological Processes on the North East Atlantic and
Western Mediterranean Margins. IOC Technical Series 56, UNESCO, 101pp plus figures.
Lance, S., Henry, P., Le Pichon, X., Lallemant, S., Chamley, H., Rostek, F., Faugeres, J. C.,
Gonthier, E,, Olu. K., 1998. Submersible study of mud volcanoes seaward of the Barbados
accretionary wedge: sedimentology, structure and rheology, Marine Geology, 145, 255-
292.
Limonov, A. F., vanWeering, T. C. E., Kenyon, N. H., Ivanov, M. K. , Meisner, L. B., 1997.
Seabed morphology and gas venting in the Black Sea mud volcano area: Observations
with the MAK-1 deep-tow sidescan sonar and bottom profiler, Marine Geology, 137, 121-
136.
Maldonado, A. and Comas, M. C., 1992. Geology and geophysics of the Alboran Sea: An
introduction. Geo-Marine Letters, 12, 61-651992
Maldonado, A., Somoza, L. and Pallarés, L., 1999. The Betic orogen and the Iberian-African plate
boundary in the Gulf of Cadiz; geological evolution (central North Atlantic), Marine
Geology, 155, 9-43.
Maldonado, A., Somoza, L., 1997. Al zona de fractura Azores-Gibraltay las cadenas beticas en el
Golfo de Cadiz. Evolucion Geologica. Abstract: 2nd Congress Margen continental Iberico
Atlantico. University Cadiz, 71-72.
Mascle, A., Moore, J.C., Taylor, E., et al., 1988. Proc. ODP, Init. Repts., 110: College Station, TX,
(Ocean Drilling Program).
Milkov, A. V., 2000. Worldwide distribution of submarine mud volcanoes and associated gas
hydrates, Marine Geology, 167, 29-42.
Rodero, J., Pallerés, L., and Maldonado, A., 1999. Late Quaternary seismic facies of the Gulf of
Cadiz Spanish continental Margin: depositional processes influenced by sealevel changes
and tectonic controls. Marine Geology, 155, 13-56.
Sadekov, A. Y. and Ovsyannikov, D. O., 2000. Age of rock clasts from the Yuma and mud volcano
bressia on the basis of foraminiferal study (Gulf of Cadiz, NE Atlantic). In: Geological
processes on European continental margins (TTR-9 Post-Cruise Conference). Abstracts,
University of Granada.

Murton and Biggs 26 Marine Geology 14/6/01
Shipley, T., Ogawa, Y., Blum, P., et al., 1995. Proc. ODP, Init. Repts., 156: (Ocean Drilling
Program), College Station, TX, (Ocean Drilling Program).
Smith, D. K., Cann, J. R., 1993. Building the crust at the Mid-Atlantic Ridge, Nature, 365, 707-
715.
Srivastava, S. P., Schouten, H., Roest, W. R., Klitgord, K. D., kovacs, L. C., Veroef, J. and
Macnab, R,. 1990. Iberian plate kinematics; a jumping plate boundary between Eurasia
and Africa. Nature, 344, 756-759.
Vogt, P. R., 1974. Volcano height and plate tectonics, Earth and Planetary Science Letters, 23, 337-
348.
Wilson, R. C. L., Hiscott, R. N., Willis, M. G. and Gradstein E. M., 1989. The Lusitanian basin of
West-Central Portugal: Mesozoic and Tertiary tectonic, stratigraphic, and subsidence
history. In: Tanard, A. J., Balkwill, H. R., (eds), Extensional tectonics and stratigraphy of
the North Atlantic margins. AAPG Memoir 46, 341-361.
WWW-data sources; http://www.ldeo.columbia.edu/BRG/ODP/DATABASE