numerical and physical modelling of scour development …
TRANSCRIPT

1
Fig 1. Venice lagoon with its three inlets
Lido
Malamocco
Chioggia
NUMERICAL AND PHYSICAL MODELLING OF SCOUR DEVELOPMENT AT THE MALAMOCCO INLET
A.P. LUIJENDIJK, K.J. BOS WL | Delft Hydraulics, P.O. Box 177
2600 MH Delft, The Netherlands
A. VENUTI, E. SERAFINI Protecno,S.r.L.
35027 Noventa Padovano, Italy
G. PASSACANTANDO Technital, S.p.A.
20139 Milano, Italy
M.T. BROTTO Consorzio Venezia Nuova
30124 Venezia, Italy
This paper presents the results of the comparison of a numerical model with physical model tests for the existing and future configuration at one of the inlets of the Venice Lagoon. The physical model tests were carried out to study the morphological aspects of the scouring around the breakwaters of the inlet in detail. The numerical model was used to reproduce the physical model simulations. It will be shown that there was a good agreement between the numerical and physical model results including currents and waves.
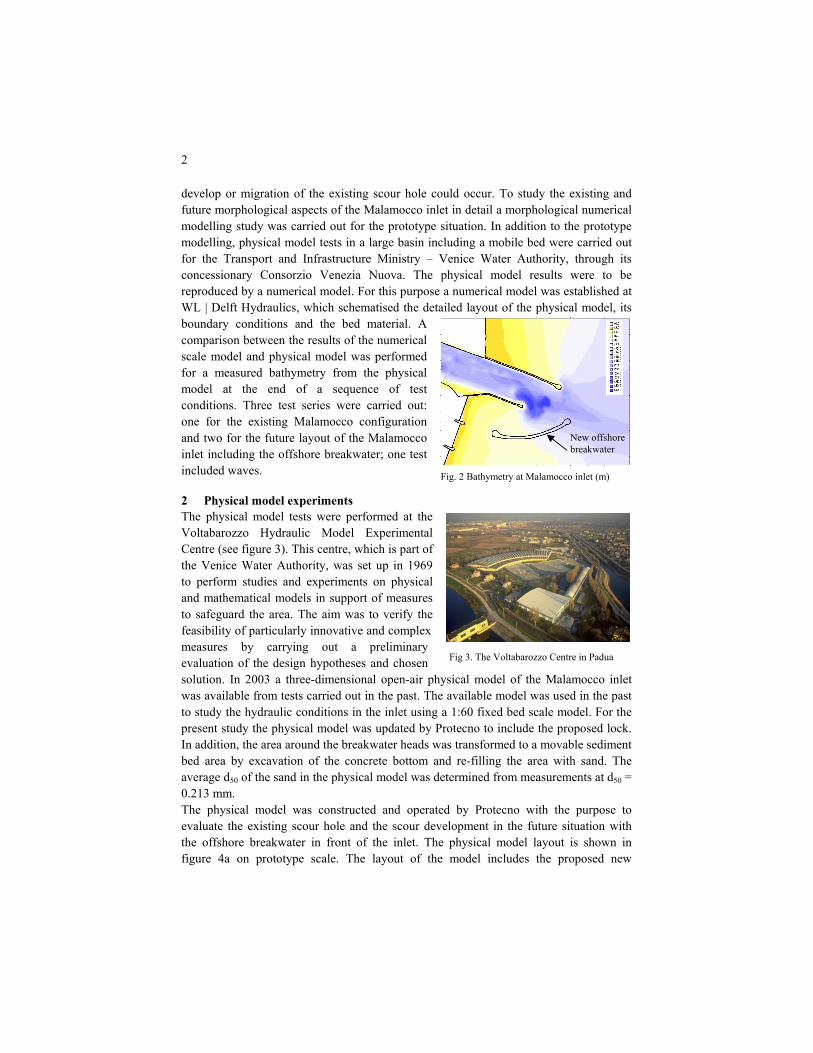
1 Introduction The Venice lagoon is located north-west of the Adriatic Sea and connected with the Adriatic Sea via three inlets: Lido, Malamocco and Chioggia (see Figure 1). In order to protect the city of Venice and the adjacent lagoon against flooding, various measures have been planned comprising a set of mobile gates combined with offshore breakwaters in front of the Venice lagoon inlets. At present scour holes can be found around some of the existing breakwaters. Scour is most pronounced at the Malamocco inlet where scour depths reach more than 20m (see figure 2). Due to the construction of the offshore breakwater in front of the Malamocco inlet it was required to investigate whether new scour holes might
2
Fig 3. The Voltabarozzo Centre in Padua
Fig. 2 Bathymetry at Malamocco inlet (m)
New offshore breakwater
develop or migration of the existing scour hole could occur. To study the existing and future morphological aspects of the Malamocco inlet in detail a morphological numerical modelling study was carried out for the prototype situation. In addition to the prototype modelling, physical model tests in a large basin including a mobile bed were carried out for the Transport and Infrastructure Ministry – Venice Water Authority, through its concessionary Consorzio Venezia Nuova. The physical model results were to be reproduced by a numerical model. For this purpose a numerical model was established at WL | Delft Hydraulics, which schematised the detailed layout of the physical model, its boundary conditions and the bed material. A comparison between the results of the numerical scale model and physical model was performed for a measured bathymetry from the physical model at the end of a sequence of test conditions. Three test series were carried out: one for the existing Malamocco configuration and two for the future layout of the Malamocco inlet including the offshore breakwater; one test included waves.
2 Physical model experiments The physical model tests were performed at the Voltabarozzo Hydraulic Model Experimental Centre (see figure 3). This centre, which is part of the Venice Water Authority, was set up in 1969 to perform studies and experiments on physical and mathematical models in support of measures to safeguard the area. The aim was to verify the feasibility of particularly innovative and complex measures by carrying out a preliminary evaluation of the design hypotheses and chosen solution. In 2003 a three-dimensional open-air physical model of the Malamocco inlet was available from tests carried out in the past. The available model was used in the past to study the hydraulic conditions in the inlet using a 1:60 fixed bed scale model. For the present study the physical model was updated by Protecno to include the proposed lock. In addition, the area around the breakwater heads was transformed to a movable sediment bed area by excavation of the concrete bottom and re-filling the area with sand. The average d50 of the sand in the physical model was determined from measurements at d50 = 0.213 mm. The physical model was constructed and operated by Protecno with the purpose to evaluate the existing scour hole and the scour development in the future situation with the offshore breakwater in front of the inlet. The physical model layout is shown in figure 4a on prototype scale. The layout of the model includes the proposed new

3
Fig 4a. Top view of the physical model Fig. 4b Detailed view of the cross-sections
navigation lock in the inlet. The lock was included in the physical and numerical models as a closed object. The mobile bed area of the physical model is indicated in grey. Figure 4a also shows the model boundaries with six inflow/outflow boundaries at the lagoon side and one inflow/outflow boundary at the sea side. The remaining boundaries of the model are closed. Figure 4b shows the different cross-sections in the physical model along which measurements were performed. Several cross-sections will be presented in
the paper where measured and computed bed levels are compared.
The inflow and outflow of the physical model was controlled by various gates which were operated mechanically and manually. The gates are connected to small channels and water supply basins. The locations of the gates are indicated in Figure 4a. A set of 8 gates are available at the seaward boundary. In the lagoon a gate is available at each channel. Several test series have been carried out with different configurations. Test 1 comprises an ebb condition in the existing situation without the offshore breakwater. In Test 2 the offshore breakwater was constructed and one ebb and three flood conditions were applied. In Test 3 waves were applied on an ebb condition. In Table 1 the discharges through the inlet during the different tests are presented together with the duration in hours.
Table 1. Test conditions in the various tests (discharges in prototype m3/s).
Ebb Flood Duration (model hours) Test 1: Existing situation 15.131 21 Test 2: With offshore breakwater 12.442 17
14.798 19 12.574 17 17.167 17
Test 3: With offshore breakwater and waves 16.975 0.42 Experiments during Test 1 were carried out to reproduce the existing scour hole at the tip of the southern breakwater. The physical model reproduced the general scour development similar as in prototype. After these findings, the offshore breakwater was constructed in the physical model and additional tests were carried out also including waves.

4
Fig 5. Flow chart of the Delft3D system
3 Numerical model
As stated above the numerical model was set up to simulate the flow and morphology in the physical model. The numerical model was set up on the basis of the Delft3D modelling software, using the Delft3D-FLOW-3DMOR module. This module is part of the hydrodynamic module Delft3D-FLOW and solves the transport of various fractions of sediment (sand or silt) within the flow calculation, in a manner similar to the transport of salinity and temperature. In this way, it can include the effect of sediment concentration on density and through this on turbulence damping and density currents. Effects of complex current patterns due to curvature, density effects, wave effects and complex geometry on transport and morphological changes can be taken into account simultaneously.
Model overview
The modelling system applied in the 3D Morphology module of the Delft3D system, is described in detail in Lesser et al. (2004). In Figure 5 the general flow chart of the system is shown. The main components are Delft3D-WAVE, which is based on the spectral wave model SWAN (Holthuijsen et al, 1997), and Delft3D-FLOW, which in the form is a non-stationary, 2DH or 3D, hydrostatic flow model with an in-built advection-diffusion solver that is used (among others) to transport suspended sediment. Bed load transport is computed separately and bottom changes due to the combined effect of the sediment entrainment and deposition and bed load transport gradients are computed every flow time step. To account for the difference in time-scales between the hydrodynamics and the morphology, bottom changes per time step are scaled up by a ‘morphological factor’, which for typical coastal problems may be in the order of 100. The numerical scheme applies a curvilinear, orthogonal, staggered grid, where water level points and depth-points are co-located in the cell centers and the u- and v- velocity points are located in the middle of the cell walls. For the simulations in this paper an Alternating Direction Implicit (ADI) method is used to solve the continuity and horizontal momentum equations (Leendertse, 1987). Stelling extended the ADI method of Leendertse with a special approach for the horizontal advection terms, namely the splitting of a third order upwind finite difference scheme for the first derivative into two second order consistent discretisations: a central discretisation and an upwind discretisation, which are successively used in both stages of the ADI-scheme. The scheme is denoted as a Cyclic Method (Stelling and Leendertse, 1991). This leads to a method which is computationally efficient, at least second order accurate, and stable at

5
Courant numbers of up to approximately 10. The applied scheme has been tested and applied in a wide range of conditions, varying from wave-dominated to tide-dominated, in 2DH and 3D mode, and has proven to be very stable. Wave effects are accounted for through additional driving terms near surface and bed, enhanced bed shear stress, mass flux and increased turbulence; see Walstra et al. (2000). The wave-current interaction is implemented by running the wave module every N flow time steps, where updated bottom, water level and velocity information is passed to the wave model and wave-induced forces, wave heights, periods and directions are passed back to the flow module. A recent development within Delft3D is domain decomposition, which enables the user to apply local grid refinement in both the horizontal and vertical direction. This allows for a nearly optimal distribution of grid points. The domain decomposition functionality increases the modelling flexibility, the accuracy, and also the efficiency when using parallel computers. Moreover, the subdivision of one (large) domain into several (much smaller) subdomains leads to a more efficient usage of the memory. Flexibility is, for example, illustrated by the possibility of using locally refined grids and/or of subdomains with different dimensions (e.g. 2DH and 3D).
Model setup
A curvilinear grid was generated for the 1:60 physical scale model. Grid cell dimensions varied from 0.17m x 0.17m (model scale) at the locations of the breakwater heads to 0.5 m x 1 m in deeper water and in the lagoon. On the basis of profile measurements of the physical model bathymetry the numerical scale model bathymetry was generated. By prescribing a water level condition at the seaward boundary and discharge conditions at each of the channels in the lagoon, the required stationary ebb and flood situations were simulated. The computational time step used was 0.3 s resulting in maximum Courant numbers of 11, on average the Courant number was 7. Bottom friction was included in the model using the Chézy formulation with a constant coefficient of 40 m0.5/s. All presented numerical results are obtained from three-dimensional simulations with 6 non-equidistant sigma-layers. The presence of large-scale horizontal vortices can considerably influence the hydrodynamics and scour hole development in the vicinity of coastal structures (Roelvink et al., 1999). These vortices were therefore taken into account in the numerical model simulations using a Horizontal Large Eddy Simulation (HLES) approach. This approach enables the simulation of hydrodynamics and sediment transport on time-scales smaller than the dominant turbulent motions. Sediment transports were calculated using the sediment transport formulation of van Rijn (1993). Important input data for the sediment transport calculations are the characteristics of the bed material. The average d50 of 0.213 mm derived from measurements was used in the numerical model. The numerical model has been calibrated for the hydrodynamics against measurements of water levels and currents.

6
Fig 6. Measured (red) and computed (black) bed levels at cross-section 2 (top) and 7 (lower). Blue line is the initial bed level
4 Model comparisons
The physical model tests were performed by stationary conditions for ebb or flood for about 1 day and then a transition from ebb to flood in a few hours and vice versa. These stationary conditions were also applied to the numerical model where the measured discharges through the different channels from the tests were applied to each of the model boundaries, which were schematised at the same locations as in the physical model. Where discharges were applied at the lagoon side, a water level rise or lowering was applied on the sea boundary, depending on a flood or ebb situation.
Test 1: Situation without offshore breakwater
The tests in the physical model without the offshore breakwater consist of one flood condition (see table 1). From a general comparison it was concluded that areas of erosion are well produced. Maximum scour depth at the southern breakwater head is generally well produced by the numerical model at several cross-sections (see figure 6). However, the erosion area is slightly overestimated. The comparison further indicates that the observed sedimentation in the form of a heap of sand in the inlet north of the southern breakwater is very well reproduced by the numerical model. A simulation in depth-averaged mode indicated an underestimation of the heap of sand. Besides this, the prediction of maximum scour depth at the southern breakwater head is less accurate than in the three-dimensional simulations. On the basis of the above it is concluded that the most relevant phenomenon, being the scour and sedimentation around the southern breakwater head, is well produced by the three-dimensional numerical scale model and reasonably well reproduced in the depth-averaged model.
Test 2: Situation with offshore breakwater
During this test series experiments were carried out for the future configuration of the Malamocco Inlet with the offshore breakwater in place. The experiments comprised a sequence of one ebb and three flood conditions with changing discharge volumes (see table 1). During the last flood condition the discharge through the inlet was more than 17.000 m3/s, which is comparable with a discharge during spring tide.

7
Fig 8. Measured (red) and computed (blue) bed levels at cross-sections 2 and 8; The black line is the initial bed level at the start of the experiment
E3
E1
E2
S1
S2
Fig 7. Measured (left) and computed (right) erosion and sedimentation patterns in m (model scale)
The various tests during this test series were carried out without intermediate repair of the bed. Figure 7 shows the scour development at the tips of the northern and offshore breakwater (location E1 and E2), which is reproduced very well by the numerical model. This is also the case for the sedimentation in area S1. Further into the inlet, some differences are found mainly in the erosion pattern. In general it can be concluded that the agreement between the numerical model results and the physical model results of this test series is good. Some differences are shown around E3 where erosion occurred in the numerical model which is only slightly measured in the physical model.
Figure 8 presents the measured and computed bed levels along two cross-sections. The deposition of sand at cross-section 2 is related to the computed sedimentation at S2 and differs from the measurements. Some explanations for the deviations between the physical model and numerical model can be related to the drying and filling of the physical model. During the filling period some local and temporary flows may have occurred which may have caused scouring. Besides this, the initial compaction rate of the sand was probably low, which can have influence on the erodibility of the sand bed. At last, the physical model was an open-air model exposed to the actual weather and wind conditions.

8
Fig. 9 Measured (red) and computed (blue) bed levels along cross-sections 18 and 20; black line is initial bed level.
Test 3: Situation with offshore breakwater including waves
The test in the physical model with the offshore breakwater consists of one ebb condition including waves as presented in Table 1. The wave condition that was applied on part of the physical model was characterised by a significant wave height of 0.07 m and a peak period of 1 s. The wave generator was constructed in such a way that the waves came from the east. From the measurements it could be concluded that the wave condition during the ebb condition resulted in only minor changes in the bed levels. This was also confirmed by the numerical simulations. Only a few measured cross-sections show changes in the bed levels during this test. Two cross-sections are presented in figure 9 with some minor changes in bed levels.
5 Conclusions
The comparison between the numerical scale model results and the physical model results indicates a good agreement for the three test series. It is therefore concluded that the numerical model is well capable of reproducing the physical model results including three-dimensional currents and waves. The numerical model has also proved to be capable of simulating prototype processes at the Venice Lagoon Inlets (not presented in this paper).
References
Holthuysen, L.H., N. Booij and R.C. Ris (1993). “A spectral wave model for the coastal zone” Proc. of the 2nd Int. Symp. on Ocean Wave Measurement and Analysis, New Orleans, 630-641. Leendertse, J.J. (1987). “A three-dimensional alternating direction implicit model with iterative fourth order dissipative non-linear advection terms” WD-333-NETH, Rijkswaterstaat. Lesser, G.R., J.A. Roelvink, J. van Kester and G.S. Stelling (2004). “Development and validation of a three-dimensional morphological model” Accepted for publication, Coastal Engineering. Rijn L.C. van (1993). “Principles of sediment transport in rivers, estuaries and coastal seas” Aqua publications, ISBN 90-800356-2-9 Stelling, G.S. and Leendertse, J.J. (1991). “Approximation of convective processes by cyclic ACI methods” Proc. 2nd ASCE Conference on Estuarine and Coastal Modelling, Tampa. Walstra, D.J.R., J.A. Roelvink and J. Groeneweg (2000). “Calculation of wave-driven currents in a 3D mean flow model” Coastal Engineering 2000, Vol. 2, ASCE, New York, pp. 1050-1063.