numerical and experimental studies of the rolling...
TRANSCRIPT

J. Fluid Mech. (2010), vol. 643, pp. 137–162. c© Cambridge University Press 2010
doi:10.1017/S0022112009992072
137
Numerical and experimental studies of therolling sphere wake
B. E. STEWART 1,2†, M. C. THOMPSON1, T. LEWEKE2
AND K. HOURIGAN1,3
1Fluids Laboratory for Aeronautical and Industrial Research (FLAIR), Department of Mechanicaland Aerospace Engineering, Monash University, Melbourne, Victoria 3800, Australia
2Institut de Recherche sur les Phenomenes Hors Equilibre, CNRS/Universites Aix-Marseille,49 rue Frederic Joliot-Curie, BP 146, F-13384 Marseille cedex 13, France
3Division of Biological Engineering, Monash University, Melbourne, Victoria 3800, Australia
(Received 1 March 2009; revised 5 September 2009; accepted 7 September 2009)
A numerical and experimental investigation is reported for the flow around a rollingsphere when moving adjacent to a plane wall. The dimensionless rotation rate of thesphere is varied from forward to reversed rolling and the resulting wake modes arefound to be strongly dependent on the value of this parameter. Results are reportedfor the Reynolds number range 100 < Re < 350, which has been shown to capture theunsteady transitions in the wake. Over this range of Reynolds number, both steadyand unsteady wake modes are observed. As the sphere undergoes forward rolling, thewake displays similarities to the flow behind an isolated sphere in a free stream. Asthe Reynolds number of the flow increases, hairpin vortices form and are shed overthe surface of the sphere. However, for cases with reversed rotation, the wake takesthe form of two distinct streamwise vortices that form around the sides of the body.These streamwise structures in the wake undergo a transition to a new unsteady modeas the Reynolds number increases. During the evolution of this unsteady mode, thestreamwise vortices form an out-of-phase spiral pair. Four primary wake modes areidentified and a very good qualitative agreement is observed between the numericaland experimental results. The numerical simulations also reveal the existence of anadditional unsteady mode that is found to be unstable to small perturbations in theflow.
1. IntroductionThis study reports the flows resulting from the combined effects of body rotation
and the presence of a nearby wall. It is relevant to the situation for which frictional orlubrication effects cause spherical particles to roll or slide along a bounding surface.Previously, only a limited number of studies have considered these combined effectson the flow dynamics. In this study, particular attention is given to the effect ofbody rotation and wall effects on the observed flow transitions and wake structures.There are various motivations for this work. One is to try to better understand andmodel particle–wall interactions for particle-laden flows, where there is some evidencethat spherical particles can roll forward or backwards near a wall depending on thefluid rheology (see references below), and the forces on particles are an important
† Email address for correspondence: [email protected]

138 B. E. Stewart, M. C. Thompson, T. Leweke and K. Hourigan
component of bulk multiphase models. Another is from biological fluid dynamics, inwhich rolling/tumbling mobile cells such as platelets and white blood cells interactwith surface endothelial cells to initiate a clotting or immune response (e.g. Woollardet al. 2008; Jackson 2007).
When a rotational motion is imposed on the sphere, the non-dimensional rotationrate may be defined as
α =Dω
2U, (1.1)
where ω is the angular velocity of the sphere and D is the sphere diameter. In theframe of reference attached to the sphere centre, U is the velocity of the free-streamfluid.
Previous studies have shown that at Reynolds number, Re =UD/ν = 210, whereν is the kinematic viscosity, the axisymmetric wake behind the fixed sphere in anunbounded flow undergoes a regular (steady–steady) transition to an asymmetricflow via a supercritical transition (Ghidersa & Dusek 2000). The regular transitionleads to the development of a two-tailed wake and studies by Johnson & Patel (1999),Ghidersa & Dusek (2000) and Thompson, Leweke & Provansal (2001) describe thedouble tail as being composed of a counter-rotating vortex pair. These two vorticesimpose an induced velocity on each other, which causes them to be convected awayfrom the streamwise centreline of the sphere. Johnson & Patel (1999) speculate thatthe transition to a non-axisymmetric flow is due to the low pressure core of theaxisymmetric toroidal vortex becoming unstable, resulting in an azimuthal pressuregradient that opens up the separation region behind the sphere and allows the flowof fluid to pass through.
Experiments have observed a periodic undulation in the asymmetric wake just priorto the onset of vortex shedding at 270 < Re < 280 (Taneda 1956; Magarvey & Bishop1961; Sakamoto & Haniu 1995; Ormieres & Provansal 1999). The stability analysesalso indicate that the unsteady flow emerges via a supercritical Hopf bifurcation inthis range of Reynolds number (Ghidersa & Dusek 2000; Thompson et al. 2001;Schouveiler & Provansal 2002). For Re > 280, fully formed vortex shedding takesplace via the formation of hairpin vortices over one side of the fixed sphere and thisflow retains a planar symmetry until Re > 350 (Mittal 1999). Throughout this study,the Reynolds number is restricted to the range over which the above transitions occur.However, the nature of the transitions is in some instances significantly altered by theintroduction of rotation and a nearby wall.
In general, for an unconstrained sphere moving adjacent to a plane wall in aNewtonian fluid, any observed rotation has been in the positive (normal) direction andof a relatively low magnitude (Cherukat & McLaughlin 1990; Zeng, Balachandar &Fischer 2005). However, in fluids with non-Newtonian properties and for spheres in astrong shear flow or between nearby walls, the accelerating fluid away from the wallcan bring about a reversed rotation of the sphere. This type of rotation results in thesphere translating down the wall but rotating as if rolling upwards (Humphrey &Murata 1992; Liu et al. 1993).
One of the investigations to examine the free rotation of a near-wall sphere athigher Re was that by Zeng et al. (2005). They carried out simulations for the flowaround a translating and rotating sphere for Re � 300. The sphere was positioned atdifferent distances to the wall. The smallest of these distances was equal to a gapof 0.25 diameters. At moderate Re they observed small rates of positive rotation,which aided the flow through the gap region. The small effect of rotation on the

Numerical and experimental studies of the rolling sphere wake 139
drag was consistent with the low Re findings of Cox & Hsu (1977) and Cherukat &McLaughlin (1994). Furthermore, the lift coefficients up to Re = 100 agree well withthose of Takemura & Magnaudet (2003).
Overall, Zeng et al. (2005) found the effect of free rotation on the lift and dragforces of the sphere to be small. However, near the wall, the drag coefficient isincreased above that occurring for an unbounded uniform flow. A limited numberof flow structures are also described, and the formation of a double-threaded wakeis reported. Prior to the formation of this double thread, the flow has an imposedasymmetry due to the presence of the nearby wall. Furthermore, the transition tothe double-threaded mode occurs at Re lower than that for the regular bifurcationbehind an isolated sphere, and the Re of transition is found to depend on the walldistance. Following this change in the wake structure, a dramatic increase in theoverall coefficient of the lift is observed, which is dominated by the pressure ratherthan the viscous component.
Zeng et al. (2009) extended this research to examine gap ratios down to 0.005sphere diameters, which is equal to the gap studied in this paper. Their main focuswas on the forces on a sphere in a shear flow in the steady regime, but they didexamine the forces on a particle moving at a uniform velocity near a wall, which isone of the cases examined here. Indeed, this provides a useful validation case for thecurrent study.
When unsteady flow commences, the shedding takes the form of hairpin vorticesand loops, as for the single-sided shedding observed behind an isolated sphere. Theasymmetry of the geometry fixes the plane of symmetry normal to the wall and theforce resulting from the shedding is also in the wall-normal direction.
Zeng et al. (2005) found that the proximity of the wall has two competing effectson the flow. The viscous effects act to delay the onset of unsteady flow, while theasymmetry produced in the wake can enhance it. This is reflected in the critical Re oftransition. As the sphere is located increasingly closer to the wall, the Re of transitionto unsteady flow decreases to values below that observed for the isolated sphere butalways remains above 250. However, as the sphere moves from a gap ratio of 0.5 to0.25, the critical Re rapidly increases to above 300.
An additional effect of the near-wall flow is the possibility for a thin lubricationlayer to appear in the fluid near the contact region. Furthermore, the low pressurethat forms in this contact region can drop below the vapour pressure of the fluid,leading to the development of cavitation bubbles in the flow. The presence of thesebubbles can affect the relative motion of the body and cause a slipping action thatprevents normal rolling (Prokunin 2007).
Having observed cavitation experimentally between the sphere and the wall,Prokunin (2004, 2007) developed a theoretical model to describe the motions ofa sphere with cavitation. It is found that when the cavitation force pushing the sphereaway from the wall is greater than the wall-normal particle weight, a contactlesssteady sphere motion may be observed. A rotation rate of α =0.2 is predicted for awide range of wall inclinations. This was less than 30 % of the value of α predictedwhen cavitation was not taken into account. Ashmore, del Pino & Mullin (2005)observed a similar trend in α when lubrication effects were present for a spheremoving along a wall at low Re. Although α does reach a value of unity (indicatingnormal rolling), the majority of results appear to asymptote to α ≈ 0.2 for increasingwall angles. Furthermore, results by Seddon & Mullin (2008) with a sphere placedinside a rotating drum also found α values to lie between 0.2 and 0.25 when cavitationwas present.

140 B. E. Stewart, M. C. Thompson, T. Leweke and K. Hourigan
y
U
ω
xD
Figure 1. Schematic of the problem under consideration.
This study aims to extend the knowledge on the flow structures that result when arotating sphere is adjacent to a wall. The rotation rates chosen vary from the normal‘no-slip’ motion to sliding and a combination of the two. Reversed rotation rates havebeen considered not only because they are of fundamental interest but also followingreports that this type of motion is observed in shear flows and non-Newtonian fluids.Furthermore, useful information may be gained on the effect of such reversed rotationon the drag force and the stability of the wake.
2. Problem definition and methodologyA schematic of the problem under consideration is shown in figure 1. The frame of
reference is attached to the centre of the sphere and the inlet flow and lower boundaryare moving from left to right at constant velocity, U . The x-axis is aligned to thestreamwise direction and the flow is defined in terms of the Reynolds number
Re =UD
ν, (2.1)
where ν is the kinematic viscosity of the fluid. The second key parameter usedthroughout this study is the rotation rate, as defined in (1.1). Positive α is in thedirection shown in figure 1, and the selected values of rotation rate range from no-slip rolling in the intuitive sense (α = 1) to reversed rolling (α = −1). The investigationfocuses on five discrete values of the rotation rate, being α = 1, 0.5, 0, −0.5 and −1,although some smaller intermediate values are also reported.
Values of the coefficient of drag, CD , and the Strouhal number, St , have also beenreported throughout this study. These have been defined according to
CD =8FD
ρU 2πD2, (2.2)
where FD is the drag force resulting from the pressure and viscous forces acting onthe sphere surface, and St = f D/U , where f is the wake frequency.
2.1. Numerical method and validation
This numerical scheme solves the viscous, incompressible Navier–Stokes equations.These comprise the equations governing momentum transfer:
∂u∂t
= −(u · ∇)u − 1
ρ∇P +
1
ρ∇ · μ∇u (2.3)
and continuity,
∇ · u = 0, (2.4)

Numerical and experimental studies of the rolling sphere wake 141
y
zx
(a) (b)
Figure 2. Orientation of the axisymmetric geometry with the mesh plane shown in grey (a)and a sample of the macro-element mesh in the region near the sphere (b).
in the fluid flow. Equations (2.3) and (2.4) are given in vector form, whereu(x, y, z, t)= (u, v, w) is the velocity vector, ρ is the fluid density, P is the scalarpressure field and μ is the dynamic viscosity.
The numerical scheme uses a spectral-element method with iterative time-splitting, and the scheme has previously been validated with flows around a varietyof geometries including cylinders and spheres (Sheard, Thompson & Hourigan2004; Ryan, Thompson & Hourigan 2005, 2007; Thompson et al. 2006; Leontini,Thompson & Hourigan 2007). The iterative time-stepping allows a relaxation ofthe time-step constraints that are associated with the present geometry (specificallythe small elements in the near-contact region between the sphere and the wall) andenhances the stability of the scheme. Results of the simulations are presented in thenon-dimensional form with the relevant variables normalized by the body diameterand the free-stream velocity. Likewise, the time is non-dimensionalized according toτ = tU/D.
A fractional-step method, first developed by Chorin (1968), is used for the temporaldiscretization. The approach adopted here follows closely that given by Karniadakis,Israeli & Orszag (1991). The method consists of separating the Navier–Stokesequations into convection, pressure and diffusion terms, and integrating these termsin separate sub-steps. Using this method, the errors typically associated with time-splitting techniques have been reduced and the method provides second-order timeaccuracy for the velocity field. The fractional-step method forms the inner loop of theiterative temporal integration scheme described in Thompson et al. (2006).
To construct the three-dimensional space, the two-dimensional mesh is expandedinto 128 Fourier planes around the symmetry axis located perpendicular to the wall,as indicated in figure 2, where the grey region indicates a sample plane correspondingto the two-dimensional mesh. A section of the mesh showing the increased resolutionof the macro-elements near the sphere surface is also shown in figure 2 and thisresolution was maintained for a distance of 30D downstream.
For the spatial discretization, Lagrange polynomials of order N − 1 are used torepresent the solution variables within each macro-element of the mesh, leading to aset of N × N internal node points. Dirichlet boundary conditions are used to specifythe velocity at all external boundaries and on the sphere surface. For α = 0, when thesphere has no rotation, a no-slip condition is defined, in which all velocity componentsreduce to zero at the body surface. Due to numerical constraints, i.e. the potentialcollapse of the macro-element immediately adjacent to the axis beneath the sphere,

142 B. E. Stewart, M. C. Thompson, T. Leweke and K. Hourigan
Re = 50, α = 1 Re = 50, α = −1 Re = 200, α = 1 Re = 300, α = −1
N CD St CD St CD St CD St
4 1.818 – 2.132 – 0.9168 0.1131 0.8806 0.16305 1.820 – 2.135 – 0.9232 0.1133 0.8847 0.16436 1.824 – 2.138 – 0.9267 0.1133 0.8845 0.1646
Table 1. Spatial resolution for the flow around the sphere with α = ±1.
it is necessary to impose a small displacement ( < 1 % of the diameter) between thesphere boundary and the wall. The width of this gap is fixed at 0.005D and the effectof variations in this small distance is discussed later.
The convergence of the drag coefficient and the Strouhal number was tested andresults are reported for the upper and lower limits of Reynolds numbers at the twoextremes of the rotation rate. These limits are Re =50 and 200 for α = 1 and Re = 50and 300 for α = −1. The high Re flow results in two different unsteady wake modes,while at the lower Re limit the flow remains steady.
The mesh used throughout this study consists of 320 macro-elements withdimensions of x = 100D from the sphere centre to the inlet/outlet boundary andy = 150D to the transverse boundary. Increasing these dimensions by a further 50Din each direction was found to result in a variation in CD of less than 1 % for Re = 50.Likewise, for the higher Reynolds number limits, the Strouhal number and the meandrag coefficient, CD , of the unsteady flow vary by less than 1 % in each case. The flowis therefore considered to be insensitive to the boundary placement in this case.
To check for the convergence of the simulations with respect to the spatialresolution, the order of the interpolating polynomials is varied from third to fifthorder. Values of the resulting drag and the Strouhal number are shown in table 1.Increasing the polynomial order from N = 4 shows a small monotonic increase inSt . However, for all values of N tested, the Strouhal number was within 1 % andthe spatial resolution was found to be sufficient. All future simulations are thereforerun with N � 4. Since N = 6 provides the highest resolution but does not lead toprohibitive run times, it is therefore used for the remainder of the simulations.The difference in St values for α = 1 and −1 in table 1 reflects the fact that twodifferent wake modes occur. The form of these modes are discussed in more detailin § 3.3.
As mentioned above, the gap distance between the sphere and the plane wall wasfixed at 0.005D. This was near the lower limit of what was required for successfulcomputations. A series of sensitivity studies for different values of α were carried outwith a gap ratio of 0.004D for the unsteady flow regimes at the upper Re limits. Inthose cases, the 20 % reduction in gap ratio resulted in a less than 0.2 % change in St .In addition, lubrication theory predicts that there is a weak logarithmic dependenceof the drag coefficient on gap ratio, even at finite Reynolds number. This was checkedat Re =50 for gap ratios of 0.004, 0.005 and 0.010 for the non-rotating sphere case.The logarithmic dependence was indeed observed, and all the drag values were within3% of the approximate fit supplied by Zeng et al. (2009). Note that while theremay be a weak drag singularity as the gap ratio approaches zero, both numericaland experimental observations suggest that the wake structure is not sensitive togap ratio. Hence, it is assumed that a gap ratio of G/D =0.005 gives an adequateapproximation for the flow around the sphere in contact with the wall.
Numerical and experimental studies of the rolling sphere wake 143
Boundary layersuction
∅ 9 mm sphere andsupporting rod
Moving floor
y
xz
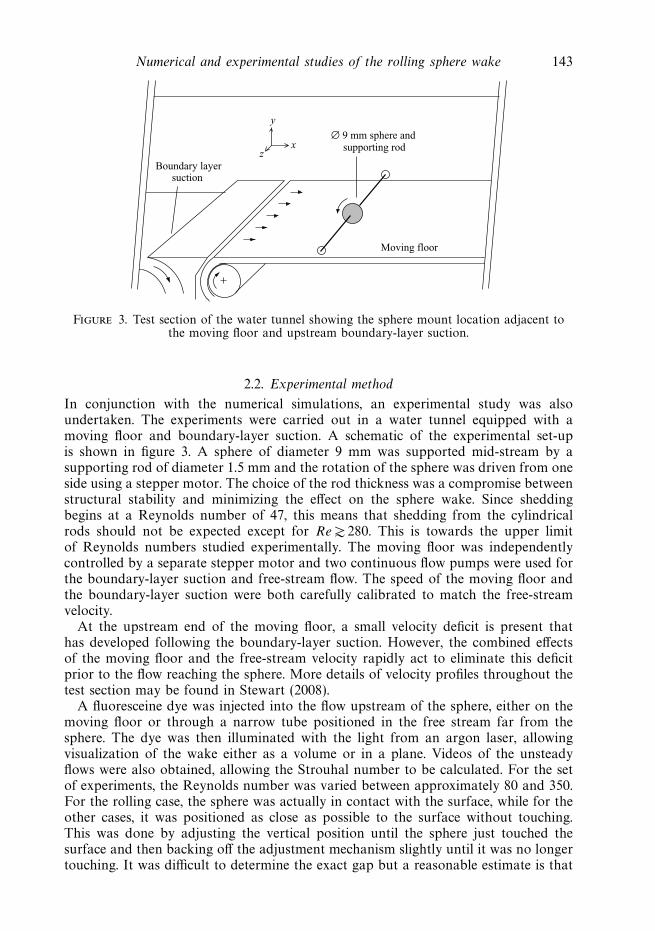
Figure 3. Test section of the water tunnel showing the sphere mount location adjacent tothe moving floor and upstream boundary-layer suction.
2.2. Experimental method
In conjunction with the numerical simulations, an experimental study was alsoundertaken. The experiments were carried out in a water tunnel equipped with amoving floor and boundary-layer suction. A schematic of the experimental set-upis shown in figure 3. A sphere of diameter 9 mm was supported mid-stream by asupporting rod of diameter 1.5 mm and the rotation of the sphere was driven from oneside using a stepper motor. The choice of the rod thickness was a compromise betweenstructural stability and minimizing the effect on the sphere wake. Since sheddingbegins at a Reynolds number of 47, this means that shedding from the cylindricalrods should not be expected except for Re � 280. This is towards the upper limitof Reynolds numbers studied experimentally. The moving floor was independentlycontrolled by a separate stepper motor and two continuous flow pumps were used forthe boundary-layer suction and free-stream flow. The speed of the moving floor andthe boundary-layer suction were both carefully calibrated to match the free-streamvelocity.
At the upstream end of the moving floor, a small velocity deficit is present thathas developed following the boundary-layer suction. However, the combined effectsof the moving floor and the free-stream velocity rapidly act to eliminate this deficitprior to the flow reaching the sphere. More details of velocity profiles throughout thetest section may be found in Stewart (2008).
A fluoresceine dye was injected into the flow upstream of the sphere, either on themoving floor or through a narrow tube positioned in the free stream far from thesphere. The dye was then illuminated with the light from an argon laser, allowingvisualization of the wake either as a volume or in a plane. Videos of the unsteadyflows were also obtained, allowing the Strouhal number to be calculated. For the setof experiments, the Reynolds number was varied between approximately 80 and 350.For the rolling case, the sphere was actually in contact with the surface, while for theother cases, it was positioned as close as possible to the surface without touching.This was done by adjusting the vertical position until the sphere just touched thesurface and then backing off the adjustment mechanism slightly until it was no longertouching. It was difficult to determine the exact gap but a reasonable estimate is that

144 B. E. Stewart, M. C. Thompson, T. Leweke and K. Hourigan
x
z
x
y
(a) Re = 50. (b) Re = 100. (c) Experimental results at Re = 100.
Figure 4. Structures in the wake of the forward-rolling sphere as determined by simulations(a) and experiments (b). Surface contours in (a) and (b) show the zero contour of λ2 (Jeong &Hussain 1995) and are shown from above (top) and from the side (bottom). (c) shows anexperimental volume dye visualization of the wake.
it was within 2 % of the diameter. More details of the experimental method can befound in Stewart et al. (2008).
3. Results and discussion3.1. Steady flow
For all rotation rates studied, the wake remains steady at the lower Reynolds numberlimit and the structure varies continuously with α. The wake of the forward-rollingsphere (α > 0) is characterized by a compact recirculation zone immediately behindthe body, and the resulting wake structures for α = 1 are shown in figure 4. Thevortical structures in the numerical simulations have been visualized by plottingthe zero-value isosurface of the λ2 field defined in Jeong & Hussain (1995). Thestructure of the wake is in good agreement with what is observed in experiments(figure 4c); however, the simulations reveal additional detail that is not apparent inthe experimental visualization. Figure 4(a) and (b) shows that the recirculation zonebehind the sphere forms into two streamwise vortices at a short distance downstream.These structures are quite weak at Re = 50 but increase in strength with increasing Re.When viewed from the side, the numerical results also show that the wake is displacedaway from the wall and towards the top of the sphere. The twin-tailed structure in thewake of figure 4(b) is similar to the asymmetric wake observed behind a sphere in anunbounded flow for 210 <Re < 270 (Johnson & Patel 1999; Ghidersa & Dusek 2000;Thompson et al. 2001). In this instance, the nearby wall acts to break the symmetryof the flow and fix the orientation of the wake.
The wake of the sphere undergoing reversed rolling (α = −1) has a different structureto that described above, although it may be the result of a continuous, rather thandiscontinuous, change in wake structure as the rotation rate is varied. When α < 0, themotion of the sphere assists the flow passing over the top of the body and two regionsof swirling flow are created at either side of the sphere. This forms a counter-rotatingstreamwise vortex pair that remains stable as it travels downstream. This structureis observed in both numerical simulations and experiments and differs significantlyfrom the wake reported above for α > 0. Examples of the numerical and experimentalresults are shown in figure 5. It can be seen that the compact recirculation zoneimmediately behind the sphere is absent and the streamwise centreline of the wake

Numerical and experimental studies of the rolling sphere wake 145
x
(a) (b)
z
x
y
Figure 5. Results for the steady sphere wake at Re = 100 and α = −1, showing the presence oftwo streamwise vortices that form around the sides of the sphere. The isosurfaces are the sameas defined for figure 4. Comparisons from the numerical simulations (a) with the experimentalflow visualization (b). The counter-rotating trailing pair is such that the self-advection istowards the wall.
x
(a) (b)
z
x
y
Figure 6. Numerical (a) and experimental (b) results for the steady wake behind thenon-rotating sphere at Re = 200. This wake has similarities to those occurring behind thesphere during both forward and reverse rolling. The counter-rotating trailing pair is such thatthe self-advection is towards the wall.
is characterized by a region of relatively undisturbed flow. Unlike for the forward-rolling sphere, the streamwise vortices in this instance remain adjacent to the walland separate slightly as they move downstream. This is primarily due to a reversalin the direction of rotation of the streamwise vortices that shall be discussed in moredetail later.
The wake of the non-rotating sphere is a combination of the two modes describedabove and is shown in figure 6 at Re = 200. When α = 0, the vorticity is generated overthe entire sphere surface, rather than being concentrated at the sides of the sphere,as is the case for non-zero rotation rates. A recirculation zone forms immediatelybehind the sphere (shown in figure 7) but the streamwise vortices are similar to thoseobserved in the wake when α is negative in that they remain adjacent to the wall anddo not merge as they travel downstream. Again, a good agreement is shown betweenthe numerical and experimental flow visualization.
Pressure contours have been plotted in the streamwise centreplane of the spherefor Re = 100 and results are shown in figure 8 for the two extremes of rotation rate(α =1 and −1) and for the non-rotating sphere with α = 0. In each case the spheredevelops a region of high pressure in the upstream gap region, with a negative pressuregradient directed clockwise around the sphere surface. In figure 8(a), the magnitudeof the centreplane pressure continues to decrease in the clockwise direction aroundthe sphere surface, until a minimum pressure is reached near the downstream wall.For the non-rotating and the reversed rolling spheres (figures 8b and 8c, respectively)a region of lower pressure develops near the top of the sphere that creates anacceleration of the fluid passing over the top of the sphere. The pressure contours

146 B. E. Stewart, M. C. Thompson, T. Leweke and K. Hourigan
y
z x
Figure 7. Particle traces and velocity vectors showing flow on the symmetry plane for thenon-rotating sphere at Re = 200.
y
x
(a) α = 1. (b) α = 0. (c) α = –1.
Figure 8. Pressure contours in the z = 0 symmetry plane at Re = 100 for three differentrotation rates.
given in figure 8(b) show a very good agreement with those reported by Zeng et al.(2005) for the translating sphere at larger distances from the wall.
Within the steady flow regime, the drag coefficient varies with both the rotationrate and the Reynolds number. The viscous and pressure components of the dragare shown in figure 9, along with the total drag coefficient in each case. The viscouscomponent of the drag varies proportionally to the rotation rate at a given Reynoldsnumber and decreases from a maximum at α = −1 to a minimum at α = 1. Thepressure component of the drag displays a more complex relationship with α, whereCDp is higher for α = 1 but decreases and approaches a constant value at a givenReynolds number for α � 0. This is a reflection of the fact that the minimum pressurecontours of figure 8 are located near the top, rather than at the back, of the sphere forα � 0, and therefore have only a relatively small impact on the value of the streamwisepressure drag.
At all Reynolds numbers considered in this study, the viscous component of thedrag force dominates for α > 0. However, the values of CDv and CDp are comparablefor α � 0. These two components of the drag force result in an overall drag coefficientthat decreases from a maximum at α = −1 to a minimum at α ≈ 0 and then increasesslightly as the rotation rate reaches positive values. For all rotation rates, the coefficient

Numerical and experimental studies of the rolling sphere wake 147
50 100 150 200 250 300 350Re
0.3
0.4
0.5
0.6
0.7
0.8
0.9
1.0
1.1
CDv
CD
p
α = 0α = 0.5α = 1.0
α = –1.0α = –0.5
α = 0α = 0.5α = 1.0
α = –1.0α = –0.5
α = 0α = 0.5α = 1.0
α = –1.0α = –0.5
(a) Viscous drag
50 100 150 200 250 300 350Re
0.4
0.6
0.8
1.0
1.2
1.4
1.6(b) Pressure drag
50 100 150 200 250 300Re
0.5
1.0
1.5
2.0
2.5
3.0
CD
Zeng et al. (2009)
(c) Total drag coefficient
Figure 9. Drag coefficient components for the steady flows at various rotation rates.
of drag shows a steady decrease with increasing Reynolds number. Zeng et al. (2009)provide an approximate fitting formula for the drag on spheres at various distancesfrom the wall for the non-rotating case. This fit is shown in figure 9. The currentpredictions lie within 3 % of this fit over the entire range. Zeng et al. (2009) indicatethat their approximate fit is accurate within 6 %; hence, this provides a usefulvalidation test for the force predictions.
Figure 10 shows the variation of the lift coefficient with Reynolds number forselected values of α in the steady wake regime. As for the drag, Zeng et al. (2009)provide an approximate fit for the lift for the non-rotating case. The lift predictionsare within their fitting accuracy. Of interest for α < 0.3 is that the lift is positive, whilefor greater values it is negative, and significantly so for α = 1. The transition value ofα � 0.3 corresponds approximately to the case at which the trailing vortex pair shownin figure 4 disappears.
3.2. The transition between modes
The steady flow wake structures shown above indicate several significant differencesbetween the forward-rolling sphere flows and those observed for α < 0. In Stewartet al. (2008), a conceptual regime boundary was defined for 0 < α < 0.5 to account forthe differences observed in the experimental flows at these rotation rates. Figures 4and 5 indicate that differences in the wake flows are closely linked to the rotation

148 B. E. Stewart, M. C. Thompson, T. Leweke and K. Hourigan
50 100 150 200 250 300Re
0
–0.5
–1.0
–1.5
–2.0
0.5
1.0
CL
α = 0
α = 0.2
α = 1
α = 0.5
α = –1
α = 0.3
Zeng et al. (2009)
Figure 10. Lift coefficient variation with Reynolds number at various rotation rates.
rate of the body. In particular, the numerical simulations indicate that the sphererotation affects the formation of a recirculation zone immediately behind the bodyand the development of the streamwise vortex pair. As described above, the wakeof the non-rotating sphere has similarities in its placement and the sign of vorticityto that observed when α < 0. Consequently, numerical simulations in the range of α
between 0 and 0.5 are now used to examine in more detail the apparent transitionbetween modes. These results are shown in figure 11 for the steady flows at Re = 150.
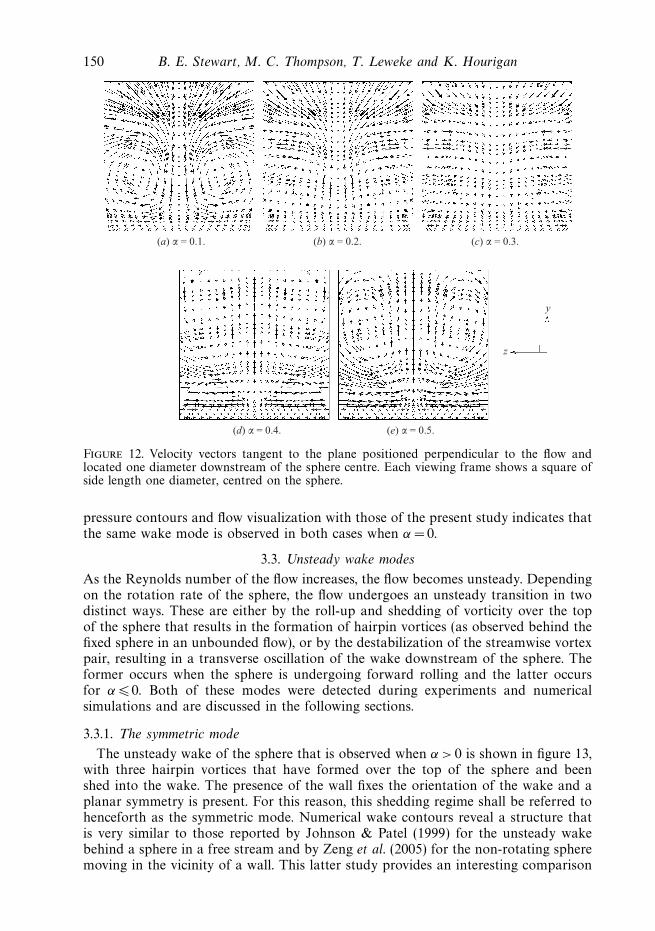
Figure 11 shows that as the rotation rate of the sphere is varied from α = 0.1to 0.5, the streamwise vortices that are observed at low and negative rotation ratesgradually decrease in strength until α = 0.4, when evidence of the streamwise vorticeshas almost disappeared. At the same time, the recirculation zone directly behind thesphere grows in size. Further increase in the rotation rate to α = 0.5 (figure 11e) showsa renewed growth in the streamwise vortices but this time the structure is similar tothat of figure 4; the wake lifts away from the wall and the sign of the streamwisevorticity changes. To show the change in the flow more clearly, the velocity vectorsin the x–y plane at a distance of one diameter downstream of the sphere centre areshown in figure 12.
The vector fields given in figure 12(a–e) correspond to successive wake visualizationsin figure 11. The view in figure 12 is looking upstream, towards the sphere, and thelength of the vectors reflects the magnitude of the in-plane velocity. Figure 12(a)shows a counter-rotating vortex pair with negative vorticity to the left (directed outof the plane) and positive vorticity to the right. This dipole has an induced motionthat causes it to migrate towards the wall. Upon reaching the wall, the vorticesseparate slightly, according to the manner described by Ersoy & Walker (1985),and this increased lateral displacement reduces the cross-diffusion of vorticity in thedownstream wake. This is representative of the flow structures observed for all α � 0.As the rotation rate of the sphere increases from 0.1 to 0.3, the in-plane velocityin figure 11 reduces and the swirling flow behind the sphere almost disappears forα = 0.3.
The centre of each vector field in figure 12 corresponds to the point directlydownstream of the sphere centre. Figure 12(b–c) shows that the velocity of the fluidimmediately behind the sphere is directed downward, towards the wall. Figure 12(c)is close to the transition case where the rotation rate of the sphere has increased

Numerical and experimental studies of the rolling sphere wake 149
(a) α = 0.1.
(b) α = 0.2.
(c) α = 0.3.
(d) α = 0.4.
(e) α = 0.5.
Figure 11. View from above of the wake at intermediate rotation rates and Re = 150. Theplotted isosurface is the same as in figure 4.
sufficiently to change the sign of the streamwise vorticity in the wake. As the rotationrate of the sphere increases to 0.4, the flow in the sphere wake changes direction tomatch the imposed motion of the sphere. At higher rotation rates, the flow movesaway from the wall and weak vortices form near the top of the sphere. These vorticeshave a sense of rotation opposite to that described previously, with the left-handvortex in figure 12(d ) being positive and the right-hand vortex being negative. Thisdipole now has an induced motion towards the free-stream and the weak vortex pairis maintained for only a short distance downstream.
The above results indicate that while the sphere is undergoing rotation rates between0 and 0.5, a continuous change occurs in the wake. The streamwise vortices eitherform a dipole that propels towards the wall, where they separate and stabilize, orthey form a dipole that moves away from the wall where they rapidly cross-diffuse.The sign of vorticity in these structures can therefore be used to classify the steadyflow regime. In the work of Zeng et al. (2005), a two-tailed wake is reported forthe non-rotating sphere at a fixed distance from the wall. Agreement between their
150 B. E. Stewart, M. C. Thompson, T. Leweke and K. Hourigan
(a) α = 0.1.
(d) α = 0.4. (e) α = 0.5.
(b) α = 0.2. (c) α = 0.3.
y
z
Figure 12. Velocity vectors tangent to the plane positioned perpendicular to the flow andlocated one diameter downstream of the sphere centre. Each viewing frame shows a square ofside length one diameter, centred on the sphere.
pressure contours and flow visualization with those of the present study indicates thatthe same wake mode is observed in both cases when α = 0.
3.3. Unsteady wake modes
As the Reynolds number of the flow increases, the flow becomes unsteady. Dependingon the rotation rate of the sphere, the flow undergoes an unsteady transition in twodistinct ways. These are either by the roll-up and shedding of vorticity over the topof the sphere that results in the formation of hairpin vortices (as observed behind thefixed sphere in an unbounded flow), or by the destabilization of the streamwise vortexpair, resulting in a transverse oscillation of the wake downstream of the sphere. Theformer occurs when the sphere is undergoing forward rolling and the latter occursfor α � 0. Both of these modes were detected during experiments and numericalsimulations and are discussed in the following sections.
3.3.1. The symmetric mode
The unsteady wake of the sphere that is observed when α > 0 is shown in figure 13,with three hairpin vortices that have formed over the top of the sphere and beenshed into the wake. The presence of the wall fixes the orientation of the wake and aplanar symmetry is present. For this reason, this shedding regime shall be referred tohenceforth as the symmetric mode. Numerical wake contours reveal a structure thatis very similar to those reported by Johnson & Patel (1999) for the unsteady wakebehind a sphere in a free stream and by Zeng et al. (2005) for the non-rotating spheremoving in the vicinity of a wall. This latter study provides an interesting comparison

Numerical and experimental studies of the rolling sphere wake 151
(a)
(b)
Figure 13. Unsteady wake at Re = 200 and α = 1 showing the shedding of hairpin vortices.Views are from above (a) and the side (b), with the isosurfaces as defined for figure 4.
with the present investigation as the unsteady symmetric mode is observed by themwhen α = 0 for the sphere in the proximity of a wall. In both the experimental resultsoutlined by Stewart et al. (2008) and the present numerical simulations, the wake atα = 0 remains steady until Re > 300; only in the experimental results is a slight cross-stream undulation of the wake observed. This unsteady flow is not characteristicof the onset of the symmetric mode described above, but rather is typical of theantisymmetric mode that shall be discussed in § 3.3.2.
Within the symmetric shedding regime, the presence of the wall prevents theformation of hairpin vortices on the lower (wall) side of the wake. Furthermore,an unsteady flow is observed at lower Reynolds numbers than that for the spherein unbounded flow, where the critical Reynolds number of transition is commonlyquoted at being just above 270 (Magarvey & Bishop 1961; Natarajan & Acrivos 1993;Schouveiler & Provansal 2002). In this way, the imposed rotation acts to enhancethe instabilities in the flow. The combined wall vicinity and sphere rotation also actsto vary the Strouhal number of the wake. The sphere in an unbounded flow has aStrouhal number of approximately 0.137 at Re = 300 (Johnson & Patel 1999), withZeng et al. (2005) finding values up to 15 % higher when the sphere is at a distanceof one diameter from the wall. Results of this study indicate St values in the range0.110–0.125 for the sphere moving with positive α for Reynolds numbers between 175and 225. The reduction in the Strouhal number may in part be due to the lower Re
at which the flows are recorded, with another possible explanation being the effect ofthe imposed sphere rotation. A 7 % decrease in St is recorded at Re = 200 when therotation is increased from α = 0.5 to 1.
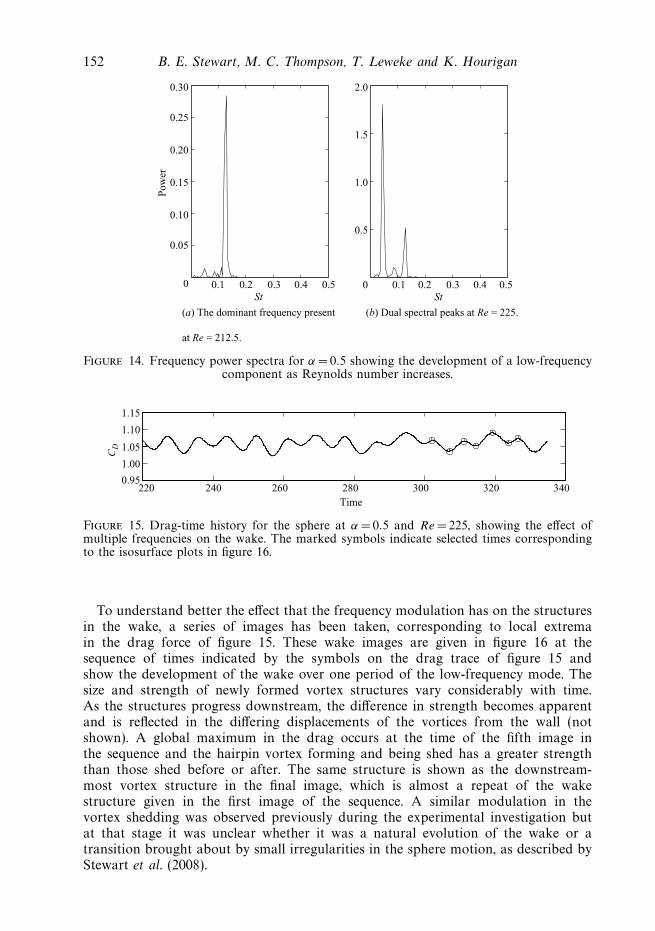
The unsteady wake observed for α = 1 remains perfectly periodic over the rangeof Re studied, with a single frequency present in the wake. This is not true for allrotation rates considered. When α = 0.5 and Re increases beyond 210 in the numericalsimulations, a second low-frequency component develops. This is illustrated by thetwo frequency spectra given in figure 14. At α = 0.5 and Re = 212.5 (figure 14a),the wake is ordered and periodic, with a Strouhal number of 0.120. Increasing theReynolds number causes a low-frequency mode to grow in the wake, with St ≈ 0.045.At Re = 225 (figure 14b), this mode has become the dominant frequency in the wake.
The two frequency components of figure 14(b) result in a low-frequency modulationin the wake that affects the strength of the hairpin vortices that are shed from thesphere. This is apparent in the time history of the wake-induced drag force on thesphere. Figure 15 gives the variation in CD for α = 0.5 over several periods of the low-frequency mode and the variation in the value of the local maximum drag indicatesthe shedding of hairpin vortices of varying strength.
152 B. E. Stewart, M. C. Thompson, T. Leweke and K. Hourigan
0.50.30.20.10
0.05
0.10
0.15
0.20
0.25
0.30
St0.4
Pow
er
(a) The dominant frequency present
at Re = 212.5.
St
1.5
1.0
0.5
0 0.1 0.2 0.3 0.4 0.5
2.0
(b) Dual spectral peaks at Re = 225.
Figure 14. Frequency power spectra for α = 0.5 showing the development of a low-frequencycomponent as Reynolds number increases.
220 240 260 280 300 320 340
Time
0.95
1.00
1.05
1.10
1.15
CD
Figure 15. Drag-time history for the sphere at α = 0.5 and Re = 225, showing the effect ofmultiple frequencies on the wake. The marked symbols indicate selected times correspondingto the isosurface plots in figure 16.
To understand better the effect that the frequency modulation has on the structuresin the wake, a series of images has been taken, corresponding to local extremain the drag force of figure 15. These wake images are given in figure 16 at thesequence of times indicated by the symbols on the drag trace of figure 15 andshow the development of the wake over one period of the low-frequency mode. Thesize and strength of newly formed vortex structures vary considerably with time.As the structures progress downstream, the difference in strength becomes apparentand is reflected in the differing displacements of the vortices from the wall (notshown). A global maximum in the drag occurs at the time of the fifth image inthe sequence and the hairpin vortex forming and being shed has a greater strengththan those shed before or after. The same structure is shown as the downstream-most vortex structure in the final image, which is almost a repeat of the wakestructure given in the first image of the sequence. A similar modulation in thevortex shedding was observed previously during the experimental investigation butat that stage it was unclear whether it was a natural evolution of the wake or atransition brought about by small irregularities in the sphere motion, as described byStewart et al. (2008).

Numerical and experimental studies of the rolling sphere wake 153
Figure 16. Irregular shedding as viewed from the side for α = 0.5 and Re = 225. Timescorrespond to those marked in figure 15. The plotted isosurface is the same as in figure 4.
3.3.2. The antisymmetric mode
In contrast to the shedding of hairpin vortices described above, a different unsteadymode develops when the sphere is rotating with α < 0. This mode manifests itself as a

154 B. E. Stewart, M. C. Thompson, T. Leweke and K. Hourigan
(a) Steady wake at Re = 200.
(b) Antisymmetric wake after a perturba-
tion has been introduced.
Figure 17. Planar-symmetric and sinuous wake modes observed at α = −1 and Re = 200.The plotted isosurface is as per figure 4.
periodic undulation of the streamwise vortices, with a preferred antisymmetric form.Henceforth, this mode shall be referred to as the antisymmetric mode. During thenumerical simulations at higher Re, the unsteady antisymmetric wake mode developsfollowing the introduction of random noise to the three-dimensional velocity field.At a lower Re, this perturbation to the flow has no overall effect and decays rapidlyto the steady solution. When this perturbation is added to a steady flow at a higherRe, the unsteady mode develops and converges to a regular periodic wake. Figure 17shows the two wake modes obtained during simulations at Re = 200, both with andwithout this perturbation to the flow.
Simulations that are allowed to develop from rest without any additional noiseexhibit flow that remains steady with a planar symmetry, at least for a considerabletime, as shown in figure 17(a). This represents an unstable solution, and the addition ofrandom noise accelerates the development of the unsteady mode given in figure 17(b).It is possible that the antisymmetric mode of figure 17(b) may develop naturallyin the simulations if enough time was allowed to elapse. However, the computingrequirements needed to test this theory are prohibitive. The flows obtained via theintroduction of random noise closely match those observed in experiments, wherea low level background turbulence is unavoidable. The positions of the vorticalstructures at the front and sides of the sphere do not change in figures 17(a) and17(b). It is only in the near wake that the disturbance of the vortices in the periodicwake becomes apparent.
Initially, the perturbation added to the flow of figure 17(a) appears as a transverseundulation in the wake, similar to that observed behind a freely falling sphere in anunbounded flow (Magarvey & Bishop 1961). While the wake of figure 17(b) has lostits symmetry, the deformation over time is still relatively small and the major motionof the streamwise vortices lies in a plane parallel to the wall. The resulting sinuousmotion of the wake creates a net transverse force on the sphere, the coefficient ofwhich is defined in a manner similar to the drag coefficient and is denoted by CZ .

Numerical and experimental studies of the rolling sphere wake 155
(a) Unstable symmetric wake mode at
Re = 300.
(b) Stable antisymmetric wake mode fol-
lowing a perturbation to the flow.
Figure 18. Wake modes for α = −1, Re = 300, showing the two possible unsteady modes thatexist prior to, and following, a white noise perturbation to the flow. The plotted isosurface isas per figure 4.
When the Reynolds number of the simulations increases further for α = −1, aninteresting discovery is made. The flow undergoes a bifurcation to an unstable solutionbranch that is not detected in the experiments. In the simulations, when allowed todevelop in the absence of any noise, the reversed rolling wake develops into anunsteady symmetric mode. This mode remains planar symmetric for many cycles;however, when this wake is fully developed, the introduction of a small perturbationis enough to cause the transition to the antisymmetric mode observed in experiments.Presumably, the symmetric wake state is weakly unstable and it would naturallyundergo transition to the sinuous state given sufficient time, even without the appliedperturbation. Figure 18 shows the structure of these two unsteady modes with theplanar symmetry clearly apparent in figure 18(a).
Figure 18(a) shows a distinctive symmetric kinking in the wake, while figure 18(b)displays the antisymmetric mode observed in experiments. It is interesting to note thatthe kinking of the wake similar to that in figure 18(a) has been repeatedly observedin the asymmetric wake behind a sphere in an unbounded flow (Sakamoto & Haniu1995; Ormieres & Provansal 1999; Schouveiler & Provansal 2002) and has beendescribed as the initial stages of the unsteady wake prior to the shedding of hairpinvortices. Compared with the sinuous wake at Re = 200 (figure 17b), the antisymmetricwake at Re = 300 develops a significant motion in the direction normal to the wall,with alternating sides of the wake lifting away from the boundary. In the simulationsof Zeng et al. (2005), a symmetry condition was imposed along the streamwisecentreplane of the sphere, thereby preventing the development of any antisymmetricwake modes. However, the symmetric kinking mode of figure 18(a) was also absent intheir simulations, and it is likely that this form only develops within a certain criticaldistance close to the wall and when α < 0.

156 B. E. Stewart, M. C. Thompson, T. Leweke and K. Hourigan
50 75 100 125 150 175 200 225 2501.00
1.05
1.10
1.15
1.20(a)
(b)
CD
CZ
50 75 100 125 150 175 200 225 250
Time
0
–0.5
–1.0
0.5
1.0
Figure 19. Section of the drag and transverse force–time histories for α = −1, Re = 300.
The development of the antisymmetric mode at Re = 300 is shown in the force–timehistories of figure 19, following the introduction of the perturbation to the flow atτ = 150. This leads to the development of an oscillatory cross-stream force. As theamplitude of CZ grows, the amplitude of the fluctuating drag rapidly decreases. Thefrequency of the unsteady drag force also alters until it is twice that of the transverseforce when the antisymmetric mode is fully developed.
When the sphere has no net rotation, the steady, streamwise vortex pair is observedin the wake. This wake structure lends itself to the antisymmetric type of instability,rather than the symmetric mode observed by Zeng et al. (2005) when the sphereis positioned farther from the wall. However, no unsteady flow was detected in thenumerical simulations at the upper Reynolds number limit of Re =300. Experimentalresults showed an unsteady undulation in the wake that is first apparent at Re ≈ 300,as reported by Stewart et al. (2008).
From potential flow theory, the two streamwise vortices near a wall can beconsidered as part of a four vortex system. The two visible vortices have an inducedmotion from each other, as well as from the effect of their image vortices locatedon the wall. Such systems have been analysed in the wake of aircraft and have beenfound to lead to a range of possible instabilities with various wavelengths (Crouch1997; Fabre, Jacquin & Loof 2002; Jacquin et al. 2003). Following observations of theantisymmetric mode in the direction perpendicular to the wall, it is concluded thatthe streamwise vortices do not remain oriented in a single, inclined plane. Rather, itis apparent that alternating sides of the wake lift away from the wall and the point ofmaximum lateral displacement is not the same as the location of maximum verticaldisplacement. This fact, in conjunction with the sinuous motion observed from above,leads to the conclusion that the wake is composed of two spiral vortices that wind inopposite directions and are out of phase by half a wavelength.
3.3.3. Experimental comparison of the unsteady wake
When compared with the experimental results, the simulations show a goodagreement as to the structures observed in the sphere wake. Numerical results areshown, along with dye visualizations from the experiments in figures 20 and 21 forthe unsteady flow regimes. Figure 20 shows the shedding of hairpin vortices behindthe forward-rolling sphere at Re = 200. The visualization method of Jeong & Hussain(1995) used in the simulations shows the vortical structures to be upright and almost

Numerical and experimental studies of the rolling sphere wake 157
(a)
(b)
Figure 20. Forward-rolling sphere at Re = 200.
(a) (b)
Figure 21. Reversed rolling sphere at Re =300 (a) and 200 (b).
perpendicular to the wall, in contrast to the experimental dye method, which doesnot capture as accurately the regions of vorticity downstream.
Of the two instabilities predicted in the numerical simulations for the reverserolling sphere wake, only the antisymmetric mode is observed in experiments. Theantisymmetric wake mode is shown in figure 21 behind the reverse rolling sphere withα = −1. The experimental results are shown at Re = 200, while the numerical flows areat Re = 300. During the numerical simulations, the onset of an unsteady flow appearsto be delayed compared with the experiments and at Re = 200 the simulations indicatea flow that is just above the critical Reynolds number of transition to the unsteadyflow. The spiral motion of the streamwise vortices is more clearly distinguished in theexperimental dye visualization of figure 21.
The Strouhal number obtained from the unsteady numerical simulations is plottedin figure 22. Experimental data taken from Stewart et al. (2008) are shown forcomparison and the dashed lines indicate the trend for each set of numericalresults. When α < 0 (figures 22a and 22b), the simulations show that decreasingthe magnitude of rotation decreases the wake frequency. This trend is also present inthe experimental results. However, the numerical data consistently overestimate theexperimental results. Numerical simulations indicate that this difference is unlikely tobe due to differences in the gap ratio during simulations and experiments. A seriesof simulations was run with a gap ratio equal to 5 % of the diameter. This value isthought to more accurately reflect the gap ratio present in experiments when α < 0.However, the simulations at this larger gap ratio reveal a decrease in St of lessthan 1 % for α = −1. A more likely explanation for the lower experimental Strouhalnumbers is therefore that the difference in Strouhal number is due to the effect ofthe supporting rod in the experiments, which has been shown to alter the Strouhalnumber for the wake of a sphere in an unbounded flow.
Both the numerically predicted and the observed values of St in figures 22(a)and 22(b) appear to be fairly independent of changes in Re. However, the criticalReynolds number of transition to unsteady flow differs, and at Re =225, the numericalsimulations provided a steady flow solution for α = −0.5, even following the addition

158 B. E. Stewart, M. C. Thompson, T. Leweke and K. Hourigan
0.20
0.15
0.10St
0.05
180 200 220 240 260
(a) α = –1.
280 300 320 220 240 260 280 300
(b) α = –0.5.
3200
0.20
0.15
0.10St
0.05
120 140 160 180 200
Re Re
220
(c) α = 0.5.
240 260 280 3000
0.20
0.15
0.10
0.05
0
100 150 200 250
(d) α = 1.
300
0.20
0.15
0.10
0.05
0
Figure 22. Comparisons of the experimental (+) and numerical (�) wake frequencies for thefour nonzero rotation rates. Dashed lines represent the trends of the numerical data.
of noise to the solution. The transition to unsteady flow in the simulations takes placeat higher Re than that in the experiments.
For α > 0, the magnitude of St from the numerical simulations shows a reasonableagreement with the experiments and the numerical data fall within the experimentalrange. However, the simulations indicate that the onset of unsteady flow againoccurs at higher Re than that in experiments. For α = 1, this onset occurs at125 <Re < 150 and for α = 0.5, the transition takes place when 175 <Re < 187.Unlike the experimental data, which show an increasing trend with Re, the numericalsimulations for the forward-rolling sphere provide St values that are nearly constantand lie in the region of St ≈ 0.12, independent of the rotation rate. This is somewhatlower than the values of 0.136 and 0.137 obtained by Tomboulides & Orszag (2000)and Johnson & Patel (1999) for the wake of a sphere in an unbounded flow atRe = 300.
Zeng et al. (2005) found an increase in St as the sphere approaches the wall;however, no gap ratios below 25 % of the diameter were considered in their studyand no conclusions were reached as to how St may vary in the region very close tothe wall. Although the investigation of Zeng et al. (2005) focuses on the non-rotatingsphere, they find that the unsteady wake involves the shedding of hairpin vorticesin the symmetric mode at a gap ratio of 0.5D. During this shedding process, theycalculate a Strouhal number of approximately 0.15 at Re = 270. This is in reasonableagreement with the St values plotted in figures 22(c) and 22(d ), but varies quitedifferently to those for α < 0, for which a different mode is observed.

Numerical and experimental studies of the rolling sphere wake 159
400
350Unsteady
Steady
300
Re
250
200
150
100
50
0–1.0 –0.5 0
α
0.5 1.0
Figure 23. Transition map of the four different wake modes predicted by the simulations.The dashed curves indicate the approximate regime boundaries as determined by experimentsand published in Stewart et al. (2008). Filled symbols indicate unsteady flow and open symbolsindicate steady flow. In addition, the circles indicate the trailing counter-rotating vortex pairself-advects towards the wall, and the diamond symbols indicate that the pair has swappedsign so that self-advection is away from the wall.
3.4. Regime diagram
The parameter space given in figure 23 indicates the regions in which the differentwake modes are observed in the numerical simulations. Steady modes are shownby open symbols and the transition to unsteady flow (closed symbols) occurs asRe increases. The dashed curves in figure 23 represent the mode limits determinedfrom experimental results, as published by Stewart et al. (2008), and the vertical lineindicates a generalized boundary between the wake modes as determined from thenumerical simulations at intermediate rotation rates. Figure 23 shows some differencesto the experimental parameter space identified by Stewart et al. (2008) and it appearsthat the Reynolds number threshold for instability decreases slightly due to thepresence of the supporting rod in the experiments. The same wake modes have beendetected in each case, although the numerical simulations show a delay in the onsetof unsteady flow to higher Reynolds numbers.
The two separate steady flow regimes are the result of the changing sign ofstreamwise vorticity in the wake. The mode observed when α > 0 is the least stable,with a transition to unsteady flow occurring at Re < 150 for α = 1. A change in thesteady wake mode occurs for α ≈ 0.35, and for negative values of α the steady wakemay develop into the unsteady antisymmetric mode at higher Reynolds numbers. Thesliding sphere with α = 0 displays the most stable configuration, and the transition tounsteady flow is not observed in the simulations. This is true for Reynolds numbersup to 350, even following the introduction of a perturbation to the flow. In contrast,
160 B. E. Stewart, M. C. Thompson, T. Leweke and K. Hourigan
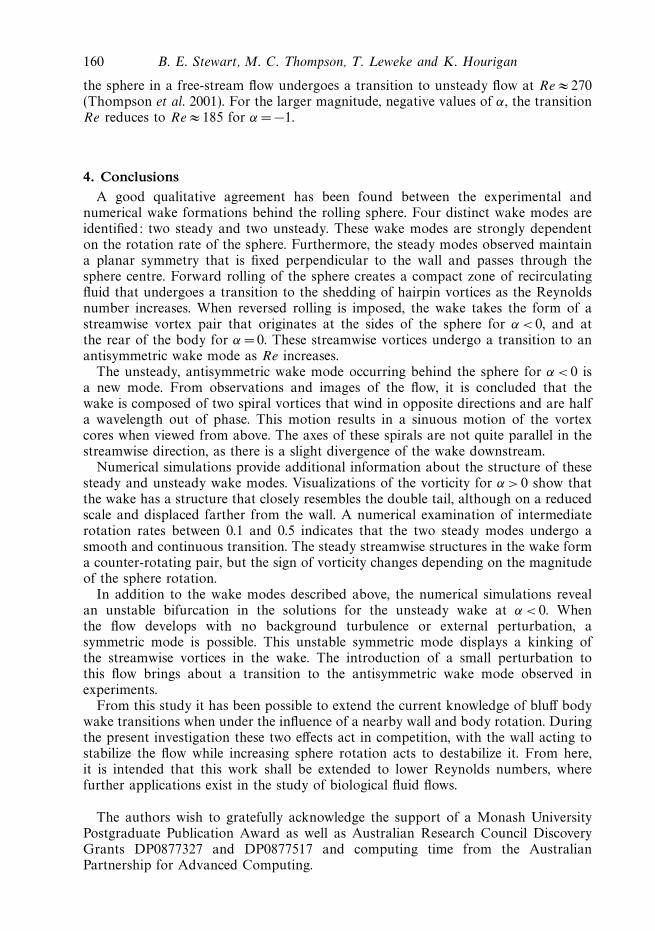
the sphere in a free-stream flow undergoes a transition to unsteady flow at Re ≈ 270(Thompson et al. 2001). For the larger magnitude, negative values of α, the transitionRe reduces to Re ≈ 185 for α = −1.
4. ConclusionsA good qualitative agreement has been found between the experimental and
numerical wake formations behind the rolling sphere. Four distinct wake modes areidentified: two steady and two unsteady. These wake modes are strongly dependenton the rotation rate of the sphere. Furthermore, the steady modes observed maintaina planar symmetry that is fixed perpendicular to the wall and passes through thesphere centre. Forward rolling of the sphere creates a compact zone of recirculatingfluid that undergoes a transition to the shedding of hairpin vortices as the Reynoldsnumber increases. When reversed rolling is imposed, the wake takes the form of astreamwise vortex pair that originates at the sides of the sphere for α < 0, and atthe rear of the body for α = 0. These streamwise vortices undergo a transition to anantisymmetric wake mode as Re increases.
The unsteady, antisymmetric wake mode occurring behind the sphere for α < 0 isa new mode. From observations and images of the flow, it is concluded that thewake is composed of two spiral vortices that wind in opposite directions and are halfa wavelength out of phase. This motion results in a sinuous motion of the vortexcores when viewed from above. The axes of these spirals are not quite parallel in thestreamwise direction, as there is a slight divergence of the wake downstream.
Numerical simulations provide additional information about the structure of thesesteady and unsteady wake modes. Visualizations of the vorticity for α > 0 show thatthe wake has a structure that closely resembles the double tail, although on a reducedscale and displaced farther from the wall. A numerical examination of intermediaterotation rates between 0.1 and 0.5 indicates that the two steady modes undergo asmooth and continuous transition. The steady streamwise structures in the wake forma counter-rotating pair, but the sign of vorticity changes depending on the magnitudeof the sphere rotation.
In addition to the wake modes described above, the numerical simulations revealan unstable bifurcation in the solutions for the unsteady wake at α < 0. Whenthe flow develops with no background turbulence or external perturbation, asymmetric mode is possible. This unstable symmetric mode displays a kinking ofthe streamwise vortices in the wake. The introduction of a small perturbation tothis flow brings about a transition to the antisymmetric wake mode observed inexperiments.
From this study it has been possible to extend the current knowledge of bluff bodywake transitions when under the influence of a nearby wall and body rotation. Duringthe present investigation these two effects act in competition, with the wall acting tostabilize the flow while increasing sphere rotation acts to destabilize it. From here,it is intended that this work shall be extended to lower Reynolds numbers, wherefurther applications exist in the study of biological fluid flows.
The authors wish to gratefully acknowledge the support of a Monash UniversityPostgraduate Publication Award as well as Australian Research Council DiscoveryGrants DP0877327 and DP0877517 and computing time from the AustralianPartnership for Advanced Computing.

Numerical and experimental studies of the rolling sphere wake 161
REFERENCES
Ashmore, J., del Pino, C. & Mullin, T. 2005 Cavitation in a lubrication flow between a movingsphere and a boundary. Phys. Rev. Lett. 94, 124501 (1–4).
Cherukat, P. & McLaughlin, J. B. 1990 Wall-induced lift on a sphere. Intl J. Multiphase Flow16 (5), 899–907.
Cherukat, P. & McLaughlin, J. B. 1994 The inertial lift on a rigid sphere in a linear shear flowfield near a flat wall. J. Fluid Mech. 263, 1–18.
Chorin, A. J. 1968 Numerical solution of the Navier–Stokes equations. Math. Comput. 22, 745–762.
Cox, R. G. & Hsu, S. K. 1977 The lateral migration of solid particles in a laminar flow near aplane. Intl J. Multiphase Flow 3, 201–222.
Crouch, J. D. 1997 Instability and transient growth for two trailing-vortex pairs. J. Fluid Mech 350,311–330.
Ersoy, S. & Walker, J. D. A. 1985 Viscous flow induced by counter-rotating vortices. Phys. Fluids28 (9), 2687–2698.
Fabre, D., Jacquin, L. & Loof, A. 2002 Optimal perturbations in a four-vortex aircraft wake incounter-rotating configuration. J. Fluid Mech. 451, 319–328.
Ghidersa, B. & Dusek, J. 2000 Breaking of axisymmetry and onset of unsteadiness in the wake ofa sphere. J. Fluid Mech. 423, 33–69.
Humphrey, J. A. C. & Murata, H. 1992 On the motion of solid spheres falling through viscousfluids in vertical and inclined tubes. Transactions ASME: J. Fluids Engng 114, 2–11.
Jackson, S. P. 2007 The growing complexity of platelet aggregation. Blood 109 (12), 5087–5095.
Jacquin, L., Fabre, D., Sipp, D., Theofilis, V. & Vollmers, H. 2003 Instability and unsteadinessof aircraft wake vortices. Aerosp. Sci. Technol. 7, 577–593.
Jeong, J. & Hussain, F. 1995 On the identification of a vortex. J. Fluid Mech. 285, 69–94.
Johnson, T. A. & Patel, V. C. 1999 Flow past a sphere up to a Reynolds number of 300. J. FluidMech. 378, 19–70.
Karniadakis, G. E., Israeli, M. & Orszag, S. A. 1991 High-order splitting methods for theincompressible Navier–Stokes equations. J. Comput. Phys. 97, 414–443.
Leontini, J. S., Thompson, M. C. & Hourigan, K. 2007 Three-dimensional transition in the wakeof a transversely oscillating cylinder. J. Fluid Mech. 577, 79–104.
Liu, Y. J., Nelson, J., Feng, J. & Joseph, D. D. 1993 Anomalous rolling of spheres down an inclinedplane. J. Non-Newtonian Fluid Mech. 50, 305–329.
Magarvey, R. H. & Bishop, R. L. 1961 Transition ranges for three-dimensional wakes. Can. J.Phys. 39, 1418–1422.
Mittal, R. 1999 Planar symmetry in the unsteady wake of a sphere. AIAA J. 37 (3), 388–390.
Natarajan, R. & Acrivos, A. 1993 The instability of the steady flow past spheres and disks.J. Fluid Mech. 254, 323–344.
Ormieres, D. & Provansal, M. 1999 Transition to turbulence in the wake of a sphere. Phys. Rev.Lett. 83 (1), 80–83.
Prokunin, A. N. 2004 Microcavitation in the slow motion of a solid spherical particle along a wallin a fluid. Fluid Dyn. 39 (5), 771–778.
Prokunin, A. N. 2007 The effects of atmospheric pressure, air concentration in the fluid, and thesurface roughness on the solid-sphere motion along a wall. Phys. Fluids 19, 113601 (1–10).
Ryan, K., Thompson, M. C. & Hourigan, K. 2005 Three-dimensional transition in the wake ofbluff elongated cylinders. J. Fluid Mech. 538, 1–29.
Ryan, K., Thompson, M. C. & Hourigan, K. 2007 The effect of mass ratio and tether length onthe flow around a tethered cylinder. J. Fluid Mech. 591, 117–144.
Sakamoto, H. & Haniu, H. 1995 The formation mechanism and shedding frequency of vorticesfrom a sphere in uniform shear flow. J. Fluid Mech. 287, 151–171.
Schouveiler, L. & Provansal, M. 2002 Self-sustained oscillations in the wake of a sphere. Phys.Fluids 14 (11), 3846–3854.
Seddon, J. R. T. & Mullin, T. 2008 Cavitation in anisotropic fluids. Phys. Fluids 20 (2), 023102(1–5).
Sheard, G. J., Thompson, M. C. & Hourigan, K. 2004 From spheres to circular cylinders:non-axisymmetric transitions in the flow past rings. J. Fluid Mech. 506, 45–78.

162 B. E. Stewart, M. C. Thompson, T. Leweke and K. Hourigan
Stewart, B. E. 2008 The dynamics and stability of flows around rolling bluff bodies. PhD thesis,Monash University.
Stewart, B. E., Leweke, T., Hourigan, K. & Thompson, M. C. 2008 Wake formation behind arolling sphere. Phys. Fluids 20, 071704 (1–4).
Takemura, F. & Magnaudet, J. 2003 The transverse force on clean and contaminated bubblesrising near a vertical wall at moderate Reynolds number. J. Fluid Mech. 495, 235–253.
Taneda, S. 1956 Experimental investigation of the wake behind a sphere at low Reynolds numbers.Phys. Soc. Japan 11 (10), 1104–1108.
Thompson, M. C., Hourigan, K., Cheung, A. & Leweke, T. 2006 Hydrodynamics of a particleimpact on a wall. Appl. Math. Model. 30, 1356–1369.
Thompson, M. C., Leweke, T. & Provansal, M. 2001 Kinematics and dynamics of sphere waketransition. J. Fluids Struct. 15, 575–585.
Tomboulides, A. G. & Orszag, S. A. 2000 Numerical investigation of transitional and weakturbulent flow past a sphere. J. Fluid Mech. 416, 45–73.
Woollard, K. J., Suhartoyo, A., Harris, E. E., Eisenhardt, S. U., Jackson, S. P., Peter, K.,
Dart, A. M., Hickey, M. J. & Chin-Dusting, J. P. F. 2008 Pathophysiological levels of solublep-selectin mediate adhesion of leukocytes to the endothelium through mac-1 activation.Circulat. Res . 103 (10), 1128–1138.
Zeng, L., Balachandar, S. & Fischer, P. 2005 Wall-induced forces on a rigid sphere at finiteReynolds number. J. Fluid Mech. 536, 1–25.
Zeng, L., Najjar, F., Balachandar, S. & Fischer, P. 2009 Forces on a finite-sized particle locatedclose to a wall in a linear shear flow. Phys. Fluids 21, 033302 (1–18).