numerical analysis of the failure process around a ... · numerical analysis of the failure process...
TRANSCRIPT

Computers and Geotechnics 39 (2012) 8–16
Contents lists available at SciVerse ScienceDirect
Computers and Geotechnics
journal homepage: www.elsevier .com/ locate/compgeo
Numerical analysis of the failure process around a circular opening in rock
S.Y. Wang a,⇑, S.W. Sloan a, D.C. Sheng a, C.A. Tang b
a Centre for Geotechnical and Materials Modelling, Civil, Surveying and Environmental Engineering, The University of Newcastle, Callaghan, NSW 2308, Australiab School of Civil & Hydraulic Engineering, Dalian University of Technology, Dalian 116024, PR China
a r t i c l e i n f o
Article history:Received 12 May 2011Received in revised form 24 July 2011Accepted 8 August 2011
Keywords:HeterogeneityAcoustic emissionUnderground openingFinite element methodFailure process
0266-352X/$ - see front matter Crown Copyright � 2doi:10.1016/j.compgeo.2011.08.004
⇑ Corresponding author.E-mail addresses: [email protected]
newcastle.edu.au (S.W. Sloan), Daichao.Sheng@[email protected] (C.A. Tang).
a b s t r a c t
Damage and fracture propagation around underground excavations are important issues in rock engi-neering. The analysis of quasi-brittle materials can be performed using constitutive laws based upondamage mechanics. The finite element code RFPA2D (Rock Failure Process Analysis) based on damagemechanics was used to simulate a loading-type failure process around an underground excavation(model tunnel) in brittle rock. One of the features of RFPA2D is the capability of modeling heterogeneousmaterials. In the current model, the effect of the homogeneous index (m) of rock on the failure modes of amodel tunnel in rock was studied. In addition, by recording the number of damaged elements and theassociated amount of energy released, RFPA2D is able to simulate acoustic activities around circularopenings in rock. The results of a numerical simulation of a model tunnel were in very good agreementwith the experimental test using the acoustic emission technique. Finally, the influence of the lateral con-fining pressure on the failure mechanism of the rock around the model tunnel was also investigated bynumerical simulations.
Crown Copyright � 2011 Published by Elsevier Ltd. All rights reserved.
1. Introduction
Damage and fracture propagation around undergroundexcavations are important issues in rock engineering. It is generallyrecognized that, for a circular opening in a brittle rock subjected todifferent stress fields, there exist three different fracture types:spalling fracture under a compressive stress field, the primary frac-ture under a tensile stress field, and remote fracture under a mix-ture of compressive and tensile stress fields [1]. Lajtai et al. [2,3]conducted biaxial compression tests at the laboratory scale to ob-serve the development of fracture patterns and reported the frac-ture phenomena. In addition, Fakhimi et al. [4] performed abiaxial compression test on a sandstone specimen with a circularopening to simulate the failure around an underground excavationin brittle rock. The axial force and displacements were monitoredthroughout the failure process, and micro-cracking was detectedby the acoustic emission technique.
In addition, to reflect the effect of cracks on the mechanicalproperties of a rock mass, many theoretical models [5,6] have beenproposed based on fracture mechanics. However, for fracturemechanics models, like other classical mathematical models, it isdifficult to characterize the entire fracture process, which involvesthe initiation, propagation, and coalescence of micro-cracks
011 Published by Elsevier Ltd. All
.au (S.Y. Wang), Scott. [email protected] (D.C. Sheng),
through to the formation of a full-scale macro-crack in the hostrock. Therefore, numerical modeling may be used to capture thedetail of the processes involved in progressive fracture. For exam-ple, the distinct element computer program, particle flow code(PFC2D) was used to simulate the damage zone around the circularopening observed in the laboratory test [4]. These numerically sim-ulated results showed that the crack pattern and the spalling of theopening matched the laboratory results well. Wang et al. [7] usedthe finite element method (FEM) to study the effect of heterogene-ity and anisotropy of rock in the excavation damaged zone aroundcircular excavations in granite. The micro-crack pattern in thenumerical model was consistent with the locations of acousticemission (AE) determined in the laboratory test.
The aim of the study reported here is to examine the progressivefailure leading to collapse around a circular opening in brittle heter-ogeneous rock, which is subjected to different confining pressures.For this purpose, a numerical tool, Rock Failure Process Analysiscode, RFPA (Rock Failure Process Analysis) [8], was used. The pro-gram is able to capture the heterogeneity of rock at the meso-levelusing a probabilistic variation of the mechanical properties of thematerials [9]. The variations of properties, such as the elastic modu-lus and the strength, were assigned in the finite element model toconform to a Weibull probability distribution. RFPA has been usedextensively to simulate the failure process of rocks [10–17]. The un-ique feature of this code is that no a priori assumptions need to bemade about where and how fracture and failure will occur: crackingcan occur spontaneously and can exhibit a variety of mechanismswhen certain local stress conditions are exceeded.
rights reserved.

S.Y. Wang et al. / Computers and Geotechnics 39 (2012) 8–16 9
2. Numerical model descriptions and setup
Briefly, the code RFPA2D [11] is a two-dimensional finite ele-ment code that can simulate the fracture and failure process ofquasi-brittle materials such as rock. To model the failure of rockmaterial (or rock mass), the rock medium is assumed to be com-posed of many meso-scopic rectangular elements of the same size.Their material properties differ and are specified according to aWeibull distribution [18,19]. These elements act as the four-nod-ded iso-parametric elements for finite element analysis. Elasticdamage mechanics is used to describe the constitutive law of themeso-scale elements, and the maximum tensile strain criterionand the Mohr–Coulomb criterion are utilized as damage thresholds[17,19].
2.1. Meso-scale modeling with elastic damage mechanics
In the proposed model, the elastic damage mechanics approachis employed to model the mechanical behavior of meso-scale ele-ments. For each element, the material is assumed to be linear elas-tic, isotropic and damage-free before loading, with its elasticproperties defined by the elastic modulus and Poisson’s ratio. Afterthe initiation of damage, based on elastic damage mechanics, thestrength and stiffness of the element is assumed to degrade grad-ually as damage progresses, with the elastic modulus of the dam-aged material given by [7,19]
E ¼ ð1�xÞE0 ð1Þ
where x represents the damage variable. The parameters E and E0
are elastic modulus of the damaged and the undamaged material,respectively.
The constitutive relationship of meso-scopic element underuniaxial tension is expressed as [17]
x ¼
0 e > et0
1� ftrE0e
etu < e 6 et0
1 e 6 etu
8>>><>>>:
ð2Þ
where ftr is the residual tensile strength, which is given asftr ¼ kft0 ¼ kE0et0. The parameters ft0 and k are uniaxial tensilestrength and residual strength coefficient, respectively, and et0 isthe strain at the elastic limit, which can be called the thresholdstrain. etu is the ultimate tensile strain of element, at which the ele-ment would be completely damaged. The ultimate tensile strain isdefined as etu = get0, where g is called the ultimate strain coefficient.Eq. (2) can be expressed as [19]
x ¼
0 e > et0
1� ket0e etu < e 6 et0
1 e 6 etu
8>>><>>>:
ð3Þ
It is noted that the sign convention used throughout this paperis that tensile stress and strain are positive. In addition, it is as-sumed that the damage to a meso-scopic element in multiaxialstress conditions is also isotropic and elastic [8]. Under multiaxialstress states, the element is still damaged in tensile mode when theequivalent major tensile strain �e reaches the threshold strain et0.The equivalent principal strain �e is defined as follows [17,19]:
�e ¼ �ffiffiffiffiffiffiffiffiffiffiffiffiffiffiffiffiffiffiffiffiffiffiffiffiffiffiffiffiffiffiffiffiffiffiffiffiffiffiffiffiffiffiffiffiffiffiffiffiffiffiffiffiffiffih�e1i2 þ h�e2i2 þ h�e3i2
qð4Þ
where e1, e2 and e3 are three principal strains, and h�i is a functiondefined as follows: [17]
hxi ¼x x P 00 x < 0
�ð5Þ
The constitutive law for an element subjected to multiaxialstresses can be easily obtained by substituting the strain e in Eqs.(2) and (3) with the equivalent strain �e. The damage variable is ex-pressed as [17,20]
x ¼
0 �e > et0
1� ket0�e etu < �e 6 et0
1 �e 6 etu
8>>><>>>:
ð6Þ
To study the damage to the element when it is under compres-sive and shear stress, the Mohr–Coulomb criterion, expressed asfollows, is chosen to be the second damage threshold [13–15].
F ¼ r1 �1þ sin u1� sin u
r3 P fc0 ð7Þ
where r1 and r3 are major and minor principal stresses, respec-tively. fc0 is the uniaxial compressive strength, and u is the internalfriction angle of the meso-scopic element. This kind of damage iscalled shear damage because the damage occurs when the stressconditions of the element meet the Mohr–Coulomb criterion. Simi-larly, when the element is under uniaxial compression and dam-aged according to the Mohr–Coulomb criterion, the expression forthe damage variable x can be described as follows [7,19].
x ¼0 e < ec0
1� kec0e e P ec0
8><>: ð8Þ
where k is also residual strength coefficient and k is equal to fcr/fc0 orftr/ft0 when the element is under uniaxial compression or tension.Previous work with the code [19] has shown that, provided theresidual strength coefficient k is in the range 0 < k 6 0:1, the effectof constitutive parameters on the failure evolution is minor. There-fore, when RFPA2D is used to study the brittle failure of rock, thesetwo parameters must be specified within their respective ranges.
When an element is under a multi-axial stress state and itsstrength satisfies the Mohr–Coulomb criterion, damage occurs,and the effect of other principal stresses in this model during thedamage evolution process should be considered. When theMohr–Coulomb criterion is met, the maximum principal strain(maximum compressive principal strain) ec0 is calculated at thepeak value of the maximum principal stress (maximum compres-sive principal stress) [19].
ec0 ¼1E0
fc0 þ1þ sin u1� sin u
r3 � lðr1 þ r2Þ� �
ð9Þ
where l is Poisson’s ratio. In this respect, the shear damage evolu-tion is only related to the maximum compressive principal strain e1.The maximum compressive principal strain e1 of the damaged ele-ment will substitute for the uniaxial compressive strain in Eq. (8).Thus, Eq. (8) can be extended to triaxial stress states for shear dam-age [7,19].
x ¼0 e1 < ec0
1� kec0e1
e1 P ec0
8><>: ð10Þ
In RFPA2D, the specified displacement (or load) is applied onthe specimen step by step. If some elements are damaged at thisstep, according to the derivation of the damage variable x andEq. (1), the damaged elastic modulus of the elements at each stressor strain level can be calculated when their stresses or strains meetone of the two damage thresholds. Then, the calculation must be

10 S.Y. Wang et al. / Computers and Geotechnics 39 (2012) 8–16
restarted under the current boundary and loading conditions tofind the stress redistribution in the specimen until no new damageoccurs. Finally, the applied load (or displacement) is increased andgoes into the analysis of the next step. By this means, the progres-sive failure process of rock subjected to gradually increasing staticloading can be simulated. A user-friendly pre- and post-processoris integrated into RFPA2D to prepare the input data and displaythe numerical results [8–10].
In addition, in RFPA2D, the failure (or damage) of every elementis assumed to be a source of acoustic events because the failed ele-ment must release its elastic energy stored during the deformation.Therefore, by recording the number of damaged elements andassociated amount of energy release, RFPA2D is capable of simulat-ing the AE activities [10]. According to Tang and Kaiser [8], thecumulative damage, D, can be calculated by the following Eq. (11).
D ¼ 1N
Xs
i¼1
ni ð11Þ
where s is the number of calculation steps, ni is the number of dam-aged elements in the ith step and N is the total number of elementsin the model. In addition, when the element fails, the energy re-leased is calculated by Eq. (12) [12].
Wi ¼1
2Er2
1 þ r23 � 2lr1r3
� �V ð12Þ
where i is the element number, Wi is the released elastic strain en-ergy, E is the elastic modulus, r1 and r3 are the major and minorprinciple stresses, respectively, l is the Poisson ratio, and V is theelement volume [12]. By recording the counts of all failed elementsand released energies when failure occurs, the AE phenomena asso-ciated with the progressive failure process can be simulated.
2.2. Model setup
In this paper, a plane strain (biaxial) test was performed on arectangular prism of Berea sandstone. The specimen was machinedwith a 14 mm diameter hole to simulate an underground opening(Fig. 1), although failure was achieved through loading rather thanexcavation of the circular opening [4]. The model had dimensions of 40 mm � 100 mm. The mesh for the model had 12 0� 300 = 36,000 elements. In RFPA2D, the rock is assumed to becomposed of many meso-scopic elements of the same size, and themechanical properties of these elements are assumed to conformto a given Weibull distribution [18].
y
x
100mm 40mm
100m
m
14mm
(a)Fig. 1. Model setup: (a) specimen geome
f ðuÞ ¼ mu0
uu0
� exp � u
u0
� m
ð13Þ
where u is the mechanical parameter (Young’s modulus or strength)of the elements and the parameter m defines the shape of the dis-tribution function. From the properties of the Weibull distribution,a larger value of m implies a more homogeneous material and viceversa. Therefore, the parameter m is called the homogeneity indexin RFPA2D. For higher values of the homogeneity index, the Young’smodulus and strengths of more of the elements are concentratedcloser to u0. In the current study, to investigate the effect of the het-erogeneity of rock on the failure mechanism of a model tunnel, dif-ferent homogeneity indexes of 1.1, 3, 5, 7 and 10 were selected. Inaddition, different confining pressures of 3, 5, 7, 9 and 11 were ap-plied to study the failure behavior of the circular opening in rock. Allof the input parameters in the numerical model are listed in Table 1.To calibrate the numerical model of RFPA, the boundary conditionsand input parameters of the rock were the same as those in the lab-oratory tests and the numerical model of PFC [4].
The failure approach is adopted in RFPA2D, where meso-scopicfracturing occurs when the stress of an element satisfies a strengthcriterion [8,9]. In confined conditions, the loading technique in-creased the vertical and horizontal loads simultaneously to the le-vel of the constant confining stress and then increased vertical load(displacement control) until the model collapsed. The stress anddeformation were computed in each element. The specified dis-placement is applied to the specimen step by step. At steps inwhich the stress in some elements satisfies the strength criterion,the element is damaged either in shear or in tension and becomesweak according to the rules specified in the literature [8–10]. Thestress and deformation distribution throughout the sample arethen adjusted instantaneously after each element rupture to reachthe equilibrium state. At positions with increased stress due tostress redistribution, the stress may exceed the critical value andfurther ruptures are caused. The process is repeated until no failureelements are present. Greater external displacement is then ap-plied. Energy is stored in the elements during the loading processand is released as acoustic emissions through the onset of elementfailures. Due to the stress redistribution and the deformation in-duced interactions, a single element failure may induce an ava-lanche of additional failures in neighboring elements, leading to achain reaction that releases more energy.
z
(b)
Vertical loading
Confining pressure
try [4] and (b) loading configuration.

Table 1Material properties of specimens [4].
Parameter Value
Homogeneity index (m) 1.1, 3, 5, 7, 10Mean compressive strength (r0) 40 MPaMean Young’s modulus (E0) 16,000 MPaTension cut-off 10%Friction angle (u) 30Confining pressure 3, 5, 7, 9, 11 MPaPoisson ratio (v) 0.28Density 2600 kg/m3
S.Y. Wang et al. / Computers and Geotechnics 39 (2012) 8–16 11
3. Numerical results and discussions
3.1. The evolution of cracks around a circular opening in rock
Fig. 2 shows the numerically simulated failure process around acircular opening in rock with m = 2.0 and a lateral confining pres-sure of 7.5 MPa. Fig. 3 shows the comparison of the laboratory testresults (a) [4], the numerically simulated results according to PFC(b) [4], and the numerically simulated results according to RFPA(c). The Stages A–H in Fig. 2 correspond to the Points A–H inFig. 4. Fig. 4 shows the numerically simulated result of normalizedload (force/area) versus normalized displacement (displacement/height) of the specimens together with the AE events.
In Fig. 2, by following the crack generation in the specimen dur-ing the failure process, it was observed that the cracks start to de-velop from the periphery of the circular opening (Stage A), wherethe compressive stresses is highlighted. Stage A corresponds tothe point A in Fig. 4, which indicates the yield point of the normal-ized load versus normalized displacement. With continued load-ing, more damage is developed (Stages B–E). During this period,some small cracks propagate and coalescence into larger cracks.In Fig. 4, the AE events increase in relation to the distinct stress
Stage A Stage B
Stage FStage E
Fig. 2. Numerically simulated failure process around a circular opening in rock with
drops in Stages A–E. With increased loading until Stage F, more mi-cro-cracks localize near the lateral boundaries of the circular open-ing and form notches. However, even during the evolution of thesenotches, some cracks are formed near the eventual rupture zone.
With continued loading (Stage G), more damage is developed,and further cracks are generated close to the rupture zone on bothsides of the specimen. Eventually, one of them prevails and contin-ues to propagate. Finally, the specimen shows a macroscopic dis-continuity along the rupture zone (Stage H). It is noted that, evenin Stage H, there is still the residual strength of the circular openingin Fig. 4. The damage zone and micro-crack patterns in Fig. 3c aresimilar to those observed from the laboratory test in Fig. 3a and thenumerically simulated results according to PFC in Fig. 3b [4]. Inaddition, the normalized load–displacement curve for this speci-men in Fig. 4 can be compared with the results of the actual lab testin Fig. 5 [4]. Although the RFPA simulated specimen shows aslightly stiffer response, both the peak loads and the accumulatedAE events match very well. In addition, by comparing the cracksevolution in the specimen during the failure process, it was ob-served that the cracks distribution is not symmetrical around thecircular opening. One possible reason is due to the heterogeneityof the rock. In the next subsection, the influence of the heterogene-ity of rock on crack patterns around a circular opening is reported.
3.2. Influence of the heterogeneity of rock on the failure mechanism ofa circular opening in rock
In this section, to study the effect of the heterogeneity of rockon the failure mechanism of a model tunnel, different homogeneityindexes of 1.1, 3, 5, 7 and 10 were selected. This mechanism can beexplained by examining the final stage of failure of the specimen(Fig. 6) and plots of the normalized load (force/area) versus nor-malized displacement (displacement/height) (Fig. 7) during thefailure process of circular opening specimens. The confining
Stage C Stage D
Stage G Stage H
m = 2.0 and a lateral confining pressure of 7.5 MPa (shear stress distribution).

(a) (b) (c)
Stage H
Fig. 3. (a) Comparison of laboratory test results [4]; (b) numerically simulated results by PFC [4]; and (c) numerically simulated results by RFPA2D.
0
5
10
15
20
25
30
35
40
45
50
0.00 0.06 0.11 0.17 0.22 0.28 0.33 0.39 0.44 0.50 0.56 0.61 0.67
Normalized Displacement (%)
Nor
mal
ized
Loa
d (M
Pa)
0
500
1000
1500
2000
2500
3000
Cum
ulat
ive
num
ber o
f AE
even
ts (n
)
Normalized loadAE enents
A B
D
E F
G
H
C
Fig. 4. Numerically simulated results of normalized load (force/area) versus normalized displacement (displacement/height) behavior of the specimen together with the AEevents (RFPA2D), with m = 2.0 and a lateral confining pressure of 7.5 MPa.
Normalized load
AE events
Fig. 5. Experimental results of normalized load (force/area) versus normalizeddisplacement (displacement/height) behavior of the specimen together with the AEevents [4].
12 S.Y. Wang et al. / Computers and Geotechnics 39 (2012) 8–16
pressure is 3 MPa. In Fig. 6, for the heterogeneous rock (e.g.,m = 1.1), the micro-cracks are distributed around the circular open-ing, and the final main crack forms and extends from the notches
on the periphery of circular opening in the vertical direction witha gradual incline toward the vertical boundaries. However, forthe relatively homogeneous rock (e.g., m = 3 and 5), the numberof micro-cracks decreases. Moreover, there is a main crack extend-ing from the notch with a gradual incline to the downward verticalboundary, and another final main crack is more concentrated onthe vertical direction. Furthermore, for the highly homogeneousrock (e.g., m = 7 and 10), the number of micro-cracks is much low-er, and the final main crack almost propagates in the vertical direc-tion (m = 10). The failure modes in Fig. 6 are different than those inFig. 2 because the confining pressure is different. The effect of theconfining pressure on the failure modes of a circular opening willbe investigated in Section 3.3.
The complete curves of the normalized load (force/area) versusnormalized displacement (displacement/height) simulated for thespecimens are shown in Fig. 7. Obviously, the normalized load–dis-placement relation depends strongly on the heterogeneity of thespecimens. It shows that the shape of the relatively heterogeneousrock (e.g., m = 1.1) has a gentler post-peak behavior under biaxialcompression. Correspondingly, for increasingly homogeneousrocks with higher m, the shape tends to become increasingly shar-per. In addition, the maximal normalized load (strength) of thespecimens is closely related to the homogeneity index m. The

m=1.1 m=3.0 m=5 m=7 m=10
Fig. 6. Numerically simulated effect of the homogeneous index (m) of 1.1, 3, 5, 7, 10 on the failure modes of a circular opening with the same confining pressure of 3 MPa.
0
10
20
30
40
50
60
70
80
90
Normalized Displacement (%)
Nor
mal
ized
Loa
d (M
Pa)
m=1.1m=3m=5m=7m=10
0.00 0.04 0.08 0.13 0.17 0.21 0.25 0.29 0.34 0.38 0.42 0.46 0.50 0.55 0.59 0.63 0.67
Fig. 7. Numerically simulated result of normalized load (force/area) versus normalized displacement (displacement/height) behavior of specimens with a homogeneousindex of 1.1, 3, 5, 7 and 10 and the same confining pressure of 3 MPa.
0
500
1000
1500
2000
2500
3000
3500
4000
Normalized Displacement (%)
Cum
ulat
ive
num
ber o
f AE
even
ts
m=1.1m=3m=5m=7m=10
0.00 0.04 0.08 0.13 0.17 0.21 0.25 0.29 0.34 0.38 0.42 0.46 0.50 0.55 0.59 0.63 0.67
Fig. 8. Numerically simulated result of the cumulative number of AE events versus normalized displacement (displacement/height) of specimens with a homogeneous indexof 1.1, 3, 5, 7 and 10 and the same confining pressure of 3 MPa.
S.Y. Wang et al. / Computers and Geotechnics 39 (2012) 8–16 13

0
0.02
0.04
0.06
0.08
0.1
0.12
0.14
0.16
0.18
0.00 0.04 0.08 0.13 0.17 0.21 0.25 0.29 0.34 0.38 0.42 0.46 0.50 0.55 0.59 0.63 0.67
Normalized Displacement (%)
Cum
ulat
ive
AE E
nerg
y (J
)
m=1.1m=3m=5m=7m=10
Fig. 9. Numerically simulated result of the cumulative AE energy versus normalized displacement (displacement/height) of specimens with a homogeneous index of 1.1, 3, 5,7 and 10 and the same confining pressure of 3 MPa.
Confining pressure=3 MPa
Confining pressure=5 MPa
Confining pressure=7 MPa
Confining pressure=9 MPa
Confining pressure=11 MPa
Fig. 10. Numerically simulated effect of a confining pressure of 3, 5, 7, 9, and 11 MPa on the failure modes of a circular opening (m = 2).
0
10
20
30
40
50
60
Normalised Displacement (%)
Nor
mal
ized
Loa
d (M
Pa)
Confining pressure=3MPaConfining pressure=5MPaConfining pressure=7MPaConfining pressure=9MPaConfining pressure=11MPa
0.00 0.04 0.08 0.12 0.15 0.19 0.23 0.27 0.31 0.35 0.39 0.43 0.46 0.50 0.54 0.58 0.62 0.66
Fig. 11. Numerically simulated result of the normalized load (force/area) versus normalized displacement (displacement/height) of specimens with of confining pressures of3, 5, 7, 9 and 11 MPa (m = 2.0).
14 S.Y. Wang et al. / Computers and Geotechnics 39 (2012) 8–16
0
500
1000
1500
2000
2500
3000
3500
4000
4500
5000
0.00 0.04 0.09 0.13 0.18 0.22 0.27 0.31 0.35 0.40 0.44 0.49 0.53 0.57 0.62 0.66
Normalized Displacement (%)
Cum
ulat
ive
num
ber o
f AE
enen
ts
Confining pressure=3MpaConfining pressure=5MpaConfining pressure=7MpaConfining pressure=9MpaConfining pressure=11Mpa
Fig. 12. Numerically simulated results of the cumulative number of AE events versus normalized displacement (displacement/height) of specimens with confining pressuresof 3, 5, 7, 9 and 11 MPa (m = 2.0).
0
0.02
0.04
0.06
0.08
0.1
0.12
0.00 0.04 0.08 0.12 0.15 0.19 0.23 0.27 0.31 0.35 0.39 0.43 0.46 0.50 0.54 0.58 0.62 0.66
Normalized Displacement (%)
Cum
ulat
ive
AE E
nerg
y (J
)
Confining pressure=3MPaConfining pressure=5MPaConfining pressure=7MPaConfining pressure=9MPaConfining pressure=11MPa
Fig. 13. Numerically simulated results of the cumulative AE energy versus normalized displacement (displacement/height) of specimens with confining pressures of 3, 5, 7, 9and 11 MPa (m = 2.0).
S.Y. Wang et al. / Computers and Geotechnics 39 (2012) 8–16 15
higher the value of the homogeneity index m, the higher thestrength of the specimen is. As a result, the curve becomes morelinear, and the strength loss is also more precipitous.
In addition, Figs. 8 and 9 shows the numerically simulated resultof the cumulative number of AE events and AE energy versus nor-malized displacement, respectively, when the homogeneous index(m) increases from 1.1 to 10. According to the Weibull distributionin Eq. (13), a larger value of m implies a more homogeneous materialand vice versa. Under the same loading and boundary conditions,less damaged elements will occur in the more homogeneous mate-rial. Fig. 8 shows that the cumulative number of AE events decreaseswith increasing m value. For instance, when m = 1.1, the final cumu-lative number of AE events is 3665. When m is 3, 5, 7 and 10, the finalcumulative number of AE events is 2633, 2137, 1723 and 1506,respectively.
However, with the increase of m, following the Weibull distribu-tion, for higher values of m, the Young’s modulus and strengths ofmore of the elements are concentrated closer to u0. Thus, more ele-ments with high Young’s modulus and strength will be distributed in
the rock mass with higher m, and the higher applied loads areneeded to cause the damage of such elements. Accordingly, the dam-aged elements will release more elastic energy. It is the reason forthe AE energy increase when m increases from 1.1 to 10 in Fig. 9.The above analysis also explains the increase of the normalized peakloads with the increase of m from 1.1 to 10 in Fig. 7.
3.3. Influence of confining pressures on the failure of a circular openingin rock
To study the effect of the confining pressure on the failuremodes of a circular opening, different confining pressures of 3, 5,7, 9 and 11 MPa were applied to the specimen. Fig. 10 shows thefinal failure stage of the specimen. In Fig. 10, for the low confiningpressure of 3 MPa, the tensile cracks dominate in the failure pro-cess. For the immediate high confining pressures of 5 and 7 MPa,few tensile cracks of elements appear in the shear failure of spec-imens because the confining pressure restrains the initiation andpropagation of tensile cracks. Moreover, for the high confining
16 S.Y. Wang et al. / Computers and Geotechnics 39 (2012) 8–16
pressures of 9 and 11 MPa, almost no tensile cracking occurs.Meanwhile, with increasing confining pressure, the micro-cracksconcentrate gradually on the horizontal direction (i.e., the directionof the confining pressure). The V-shaped notch zones form in theend. During the formation of V-shaped notch zones, shear cracksplays a significant role in the formation of the crack patterns, witha wedge of failed material attempting to move laterally into theopening.
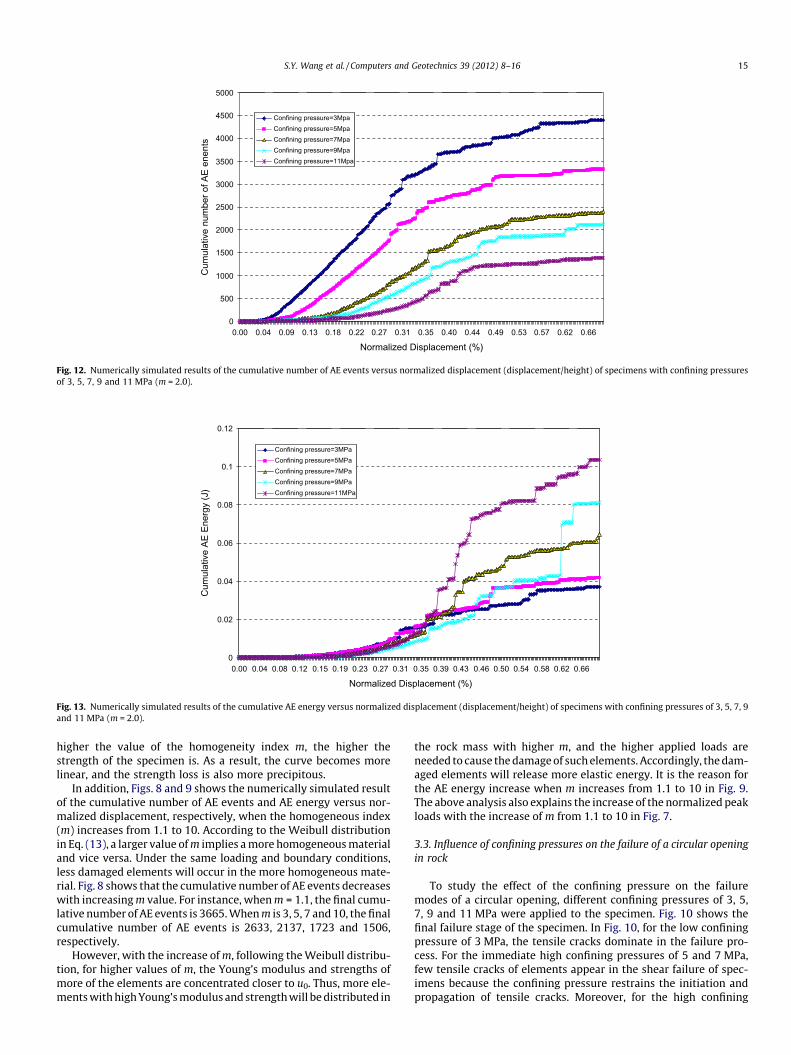
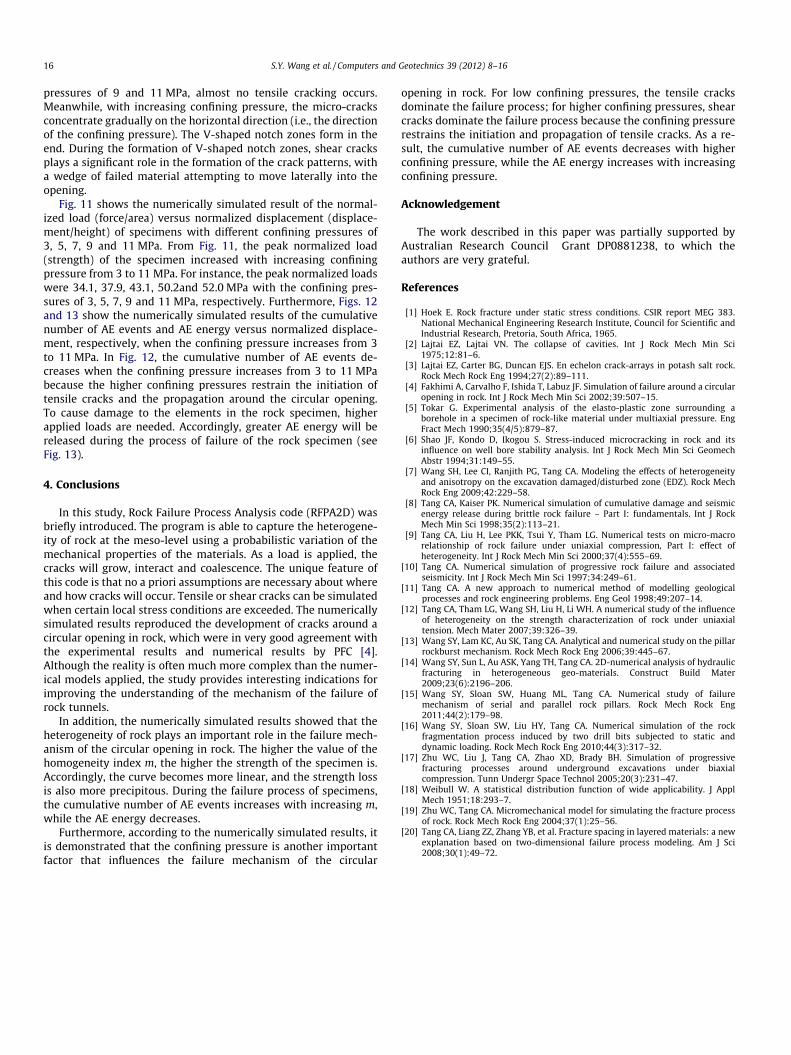
Fig. 11 shows the numerically simulated result of the normal-ized load (force/area) versus normalized displacement (displace-ment/height) of specimens with different confining pressures of3, 5, 7, 9 and 11 MPa. From Fig. 11, the peak normalized load(strength) of the specimen increased with increasing confiningpressure from 3 to 11 MPa. For instance, the peak normalized loadswere 34.1, 37.9, 43.1, 50.2and 52.0 MPa with the confining pres-sures of 3, 5, 7, 9 and 11 MPa, respectively. Furthermore, Figs. 12and 13 show the numerically simulated results of the cumulativenumber of AE events and AE energy versus normalized displace-ment, respectively, when the confining pressure increases from 3to 11 MPa. In Fig. 12, the cumulative number of AE events de-creases when the confining pressure increases from 3 to 11 MPabecause the higher confining pressures restrain the initiation oftensile cracks and the propagation around the circular opening.To cause damage to the elements in the rock specimen, higherapplied loads are needed. Accordingly, greater AE energy will bereleased during the process of failure of the rock specimen (seeFig. 13).
4. Conclusions
In this study, Rock Failure Process Analysis code (RFPA2D) wasbriefly introduced. The program is able to capture the heterogene-ity of rock at the meso-level using a probabilistic variation of themechanical properties of the materials. As a load is applied, thecracks will grow, interact and coalescence. The unique feature ofthis code is that no a priori assumptions are necessary about whereand how cracks will occur. Tensile or shear cracks can be simulatedwhen certain local stress conditions are exceeded. The numericallysimulated results reproduced the development of cracks around acircular opening in rock, which were in very good agreement withthe experimental results and numerical results by PFC [4].Although the reality is often much more complex than the numer-ical models applied, the study provides interesting indications forimproving the understanding of the mechanism of the failure ofrock tunnels.
In addition, the numerically simulated results showed that theheterogeneity of rock plays an important role in the failure mech-anism of the circular opening in rock. The higher the value of thehomogeneity index m, the higher the strength of the specimen is.Accordingly, the curve becomes more linear, and the strength lossis also more precipitous. During the failure process of specimens,the cumulative number of AE events increases with increasing m,while the AE energy decreases.
Furthermore, according to the numerically simulated results, itis demonstrated that the confining pressure is another importantfactor that influences the failure mechanism of the circular
opening in rock. For low confining pressures, the tensile cracksdominate the failure process; for higher confining pressures, shearcracks dominate the failure process because the confining pressurerestrains the initiation and propagation of tensile cracks. As a re-sult, the cumulative number of AE events decreases with higherconfining pressure, while the AE energy increases with increasingconfining pressure.
Acknowledgement
The work described in this paper was partially supported byAustralian Research Council Grant DP0881238, to which theauthors are very grateful.
References
[1] Hoek E. Rock fracture under static stress conditions. CSIR report MEG 383.National Mechanical Engineering Research Institute, Council for Scientific andIndustrial Research, Pretoria, South Africa, 1965.
[2] Lajtai EZ, Lajtai VN. The collapse of cavities. Int J Rock Mech Min Sci1975;12:81–6.
[3] Lajtai EZ, Carter BG, Duncan EJS. En echelon crack-arrays in potash salt rock.Rock Mech Rock Eng 1994;27(2):89–111.
[4] Fakhimi A, Carvalho F, Ishida T, Labuz JF. Simulation of failure around a circularopening in rock. Int J Rock Mech Min Sci 2002;39:507–15.
[5] Tokar G. Experimental analysis of the elasto-plastic zone surrounding aborehole in a specimen of rock-like material under multiaxial pressure. EngFract Mech 1990;35(4/5):879–87.
[6] Shao JF, Kondo D, Ikogou S. Stress-induced microcracking in rock and itsinfluence on well bore stability analysis. Int J Rock Mech Min Sci GeomechAbstr 1994;31:149–55.
[7] Wang SH, Lee CI, Ranjith PG, Tang CA. Modeling the effects of heterogeneityand anisotropy on the excavation damaged/disturbed zone (EDZ). Rock MechRock Eng 2009;42:229–58.
[8] Tang CA, Kaiser PK. Numerical simulation of cumulative damage and seismicenergy release during brittle rock failure – Part I: fundamentals. Int J RockMech Min Sci 1998;35(2):113–21.
[9] Tang CA, Liu H, Lee PKK, Tsui Y, Tham LG. Numerical tests on micro-macrorelationship of rock failure under uniaxial compression, Part I: effect ofheterogeneity. Int J Rock Mech Min Sci 2000;37(4):555–69.
[10] Tang CA. Numerical simulation of progressive rock failure and associatedseismicity. Int J Rock Mech Min Sci 1997;34:249–61.
[11] Tang CA. A new approach to numerical method of modelling geologicalprocesses and rock engineering problems. Eng Geol 1998;49:207–14.
[12] Tang CA, Tham LG, Wang SH, Liu H, Li WH. A numerical study of the influenceof heterogeneity on the strength characterization of rock under uniaxialtension. Mech Mater 2007;39:326–39.
[13] Wang SY, Lam KC, Au SK, Tang CA. Analytical and numerical study on the pillarrockburst mechanism. Rock Mech Rock Eng 2006;39:445–67.
[14] Wang SY, Sun L, Au ASK, Yang TH, Tang CA. 2D-numerical analysis of hydraulicfracturing in heterogeneous geo-materials. Construct Build Mater2009;23(6):2196–206.
[15] Wang SY, Sloan SW, Huang ML, Tang CA. Numerical study of failuremechanism of serial and parallel rock pillars. Rock Mech Rock Eng2011;44(2):179–98.
[16] Wang SY, Sloan SW, Liu HY, Tang CA. Numerical simulation of the rockfragmentation process induced by two drill bits subjected to static anddynamic loading. Rock Mech Rock Eng 2010;44(3):317–32.
[17] Zhu WC, Liu J, Tang CA, Zhao XD, Brady BH. Simulation of progressivefracturing processes around underground excavations under biaxialcompression. Tunn Undergr Space Technol 2005;20(3):231–47.
[18] Weibull W. A statistical distribution function of wide applicability. J ApplMech 1951;18:293–7.
[19] Zhu WC, Tang CA. Micromechanical model for simulating the fracture processof rock. Rock Mech Rock Eng 2004;37(1):25–56.
[20] Tang CA, Liang ZZ, Zhang YB, et al. Fracture spacing in layered materials: a newexplanation based on two-dimensional failure process modeling. Am J Sci2008;30(1):49–72.