numeracy for cost analysts - washington iceaawashingtoniceaa.com/files/presentations/24_numeracy for...
TRANSCRIPT

1
Numeracy for Cost Analysts Doing the Right Math, Getting the Math Right
Neal D. Hulkower, Ph.D.Vice President, Operations
MCR Federal, [email protected]
(703) 584-7001
© MCR, LLC

2
Acknowledgments
The author is grateful to the following for their review and
suggestions:Tim Anderson
Steve BookRay Covert
Nathan MentonJohn Neatrour
© MCR, LLC

3
Outline
• Motivation• Definitions• Why Numeracy is Critical to Cost Analysis• What Right Looks Like• Good Math, Bad Math• Limitations of Math• Summary• The Last Word• Acronyms
© MCR, LLC

Motivation
• No one does costing right and it may never be possible to do so
• For now we must settle for doing it less wrong• Proper mathematical and statistical techniques
are necessary (but admittedly not sufficient) for doing costing less incorrectly – The use of incorrect techniques has been a contributor
to chronic underestimation of cost and undermines confidence in the analysis
– Math is one of the very few ingredients in an estimate for which there are objective criteria for goodness so when it is used, it needs to be done right
© MCR, LLC 4

Obligatory Dilbert Cartoon
© MCR, LLC 5
6
“Numeracy”Source: Wikipedia
“Numeracy is a contraction (or portmanteau word)of 'numerical literacy', and refers to an ability toreason with numbers and other mathematicalconcepts. The word was coined in 1959 by the UKCommittee on Education, presided over by SirGeoffrey Crowther...
“In the United States, numeracy it is also known asQuantitative Literacy, and is familiar to matheducators and intellectuals. There is also substantialoverlap between conceptions of numeracy andconceptions of statistical literacy.”
© MCR, LLC

7
“Numeracy”Source: Merriam-Webster's Online Dictionary, 10th Edition
Main Entry: nu·mer·acy
Pronunciation: \'n(y)üm-rə-sē, 'n(y)ü-mə-\
Function: noun Etymology: Latin numerusnumber + English -acy (as in literacy)
Date: 1959 :
the capacity for quantitative thought and expression
— nu·mer·ate \'nüm-rət, 'nü-mə-; 'nyüm-, 'nyü-mə-\ adjective
© MCR, LLC
8
“Innumeracy”Source: Wikipedia
“Innumeracy is a portmanteau of ‘numerical illiteracy’; itrefers to a lack of ability to reason with numbers. Theterm innumeracy was coined by cognitive scientistDouglas Hofstadter and popularized by mathematicianJohn Allen Paulos in his 1989 book, Innumeracy:Mathematical Illiteracy and its Consequences. Possiblecauses of innumeracy are poor teaching methods andstandards and lack of value placed on mathematicalskills. Even prominent and successful people will attest,sometimes proudly, to low mathematical competence, insharp contrast to the stigma associated with illiteracy.”
© MCR, LLC
“The problem with remaining innumerate is that onecan be fooled not only by numerates but also byother innumerates.”.....NDH
Why Numeracy is Critical to Cost Analysis
9© MCR, LLC
10
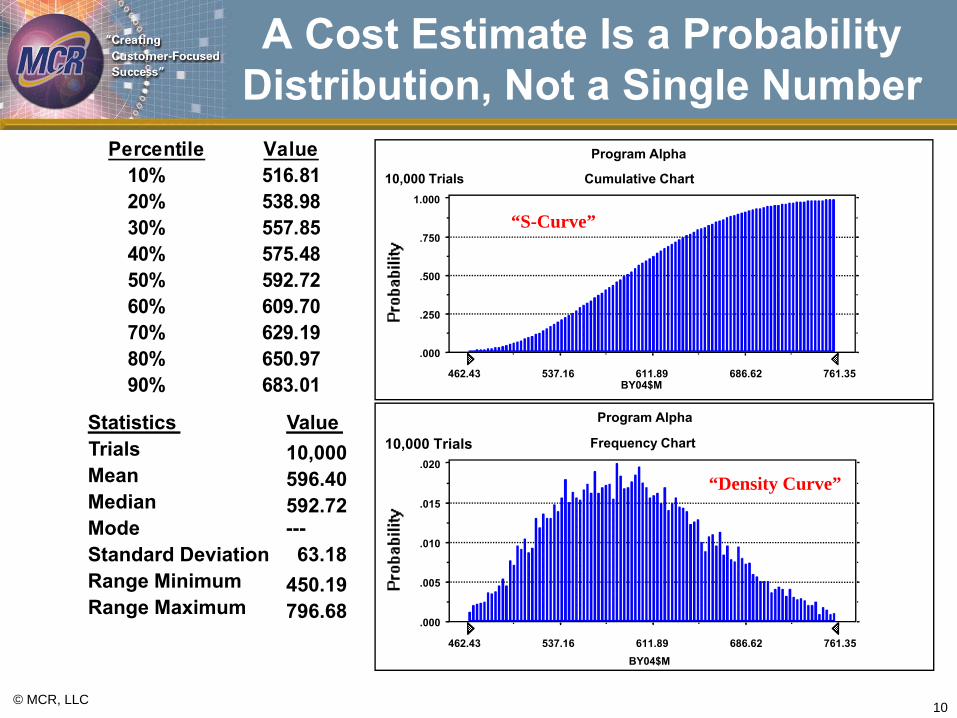
A Cost Estimate Is a Probability Distribution, Not a Single Number
Percentile Value10% 516.8120% 538.9830% 557.8540% 575.4850% 592.7260% 609.7070% 629.1980% 650.9790% 683.01
10,000596.40592.72
450.19
Statistics ValueTrialsMeanMedianMode ---Standard Deviation 63.18Range MinimumRange Maximum 796.68
“S-Curve”
“Density Curve”
Frequency Chart
.000
.005
.010
.015
.020
462.43 537.16 611.89 686.62 761.35
10,000 Trials
Program Alpha
Cumulative Chart
.000
.250
.500
.750
1.000
462.43 537.16 611.89 686.62 761.35
10,000 Trials
Program Alpha
BY04$M
BY04$M
© MCR, LLC
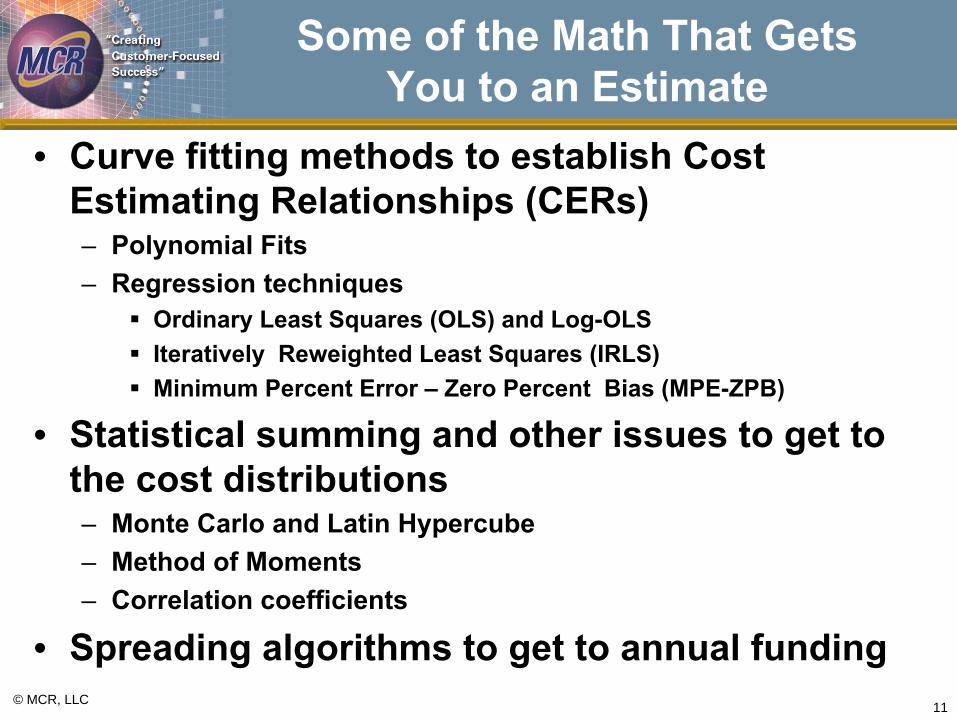
Some of the Math That Gets You to an Estimate
• Curve fitting methods to establish Cost Estimating Relationships (CERs)– Polynomial Fits– Regression techniques
Ordinary Least Squares (OLS) and Log-OLSIteratively Reweighted Least Squares (IRLS)Minimum Percent Error – Zero Percent Bias (MPE-ZPB)
• Statistical summing and other issues to get to the cost distributions– Monte Carlo and Latin Hypercube– Method of Moments– Correlation coefficients
• Spreading algorithms to get to annual funding11© MCR, LLC
© MCR, LLC 12
Math is the language of analysis and of cost analysis in
particular!

What Right Looks Like
13© MCR, LLC

If We Could Only Emulate the Sciences....
© MCR, LLC 14
1.
Choose Your Topic
2.
Identify a Problem 3.
Research the Problem
4.
Develop a Hypothesis
5.
Design the Experiments
6.
Test the Hypothesis
7.
Analyze the Results
8.
Formulate Conclusions

...to Develop the Best Math Model for Costing, it Would....
• Fit empirical data• Be shaved by Occam’s Razor• Be predictive across the broadest set of
inputs• Satisfy an appropriate theory and/or
philosophical consideration
© MCR, LLC 15
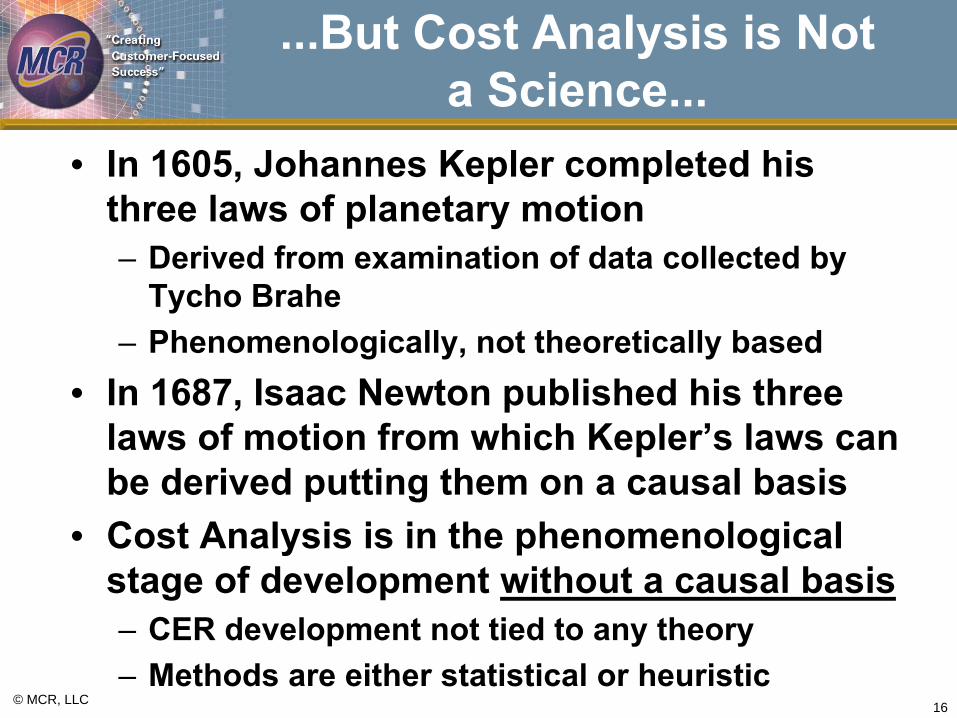
...But Cost Analysis is Not a Science...
• In 1605, Johannes Kepler completed his three laws of planetary motion– Derived from examination of data collected by
Tycho Brahe– Phenomenologically, not theoretically based
• In 1687, Isaac Newton published his three laws of motion from which Kepler’s laws can be derived putting them on a causal basis
• Cost Analysis is in the phenomenological stage of development without a causal basis– CER development not tied to any theory– Methods are either statistical or heuristic
© MCR, LLC 16
...So to the Greatest Extent Possible We Must
• Define terms clearly• Apply theorems properly
– Be sure to satisfy hypotheses before invoking the conclusions!
• Use appropriate mathematical formulations– The world is rarely linear– Let economics, engineering, and common sense be
guides• Do calculations correctly
– Statistical summing is not done arithmetically– No, you may never average percents, ratios, or
averages to create CERs, factors or models17© MCR, LLC
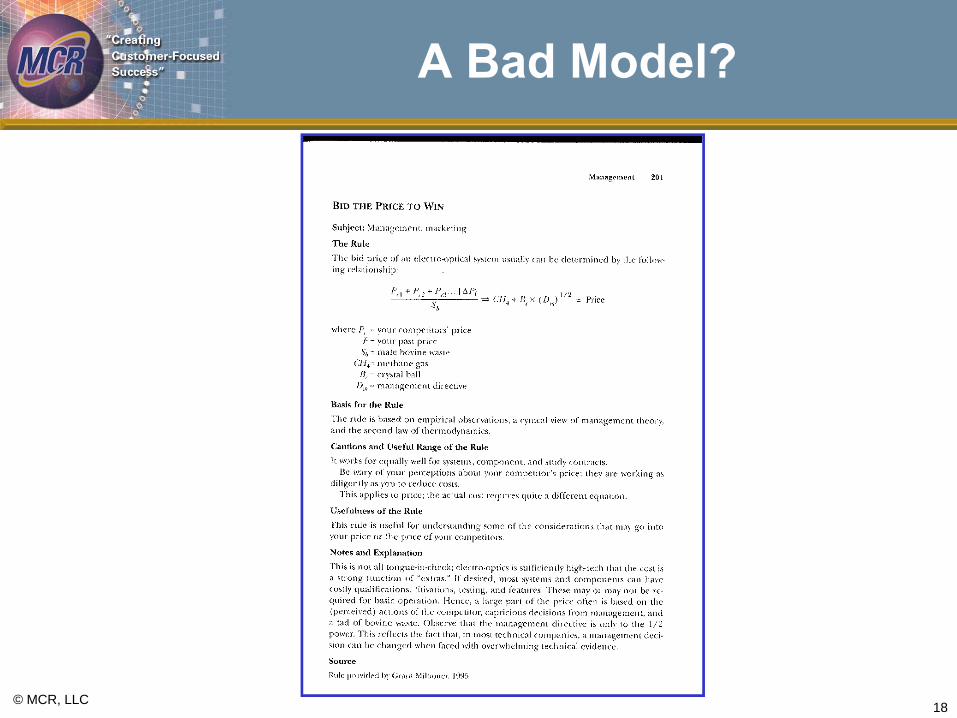
A Bad Model?
© MCR, LLC 18

Good Math, Bad Math
19© MCR, LLC

Telling Good from Bad
20
Appropriate Math Model
Inappropriate Math Model
Math Done Wrong Math Done Right
© MCR, LLC
Bad Math Good Math
Very Bad Math* Bad Math
* AKA Junk Mathematics
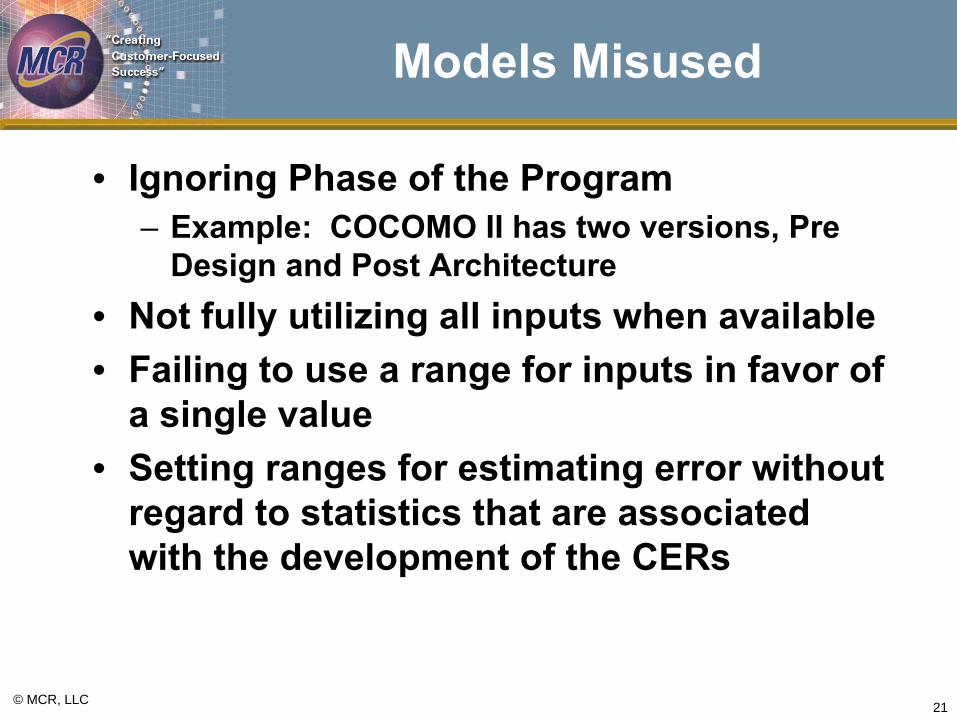
Models Misused
• Ignoring Phase of the Program– Example: COCOMO II has two versions, Pre
Design and Post Architecture• Not fully utilizing all inputs when available• Failing to use a range for inputs in favor of
a single value• Setting ranges for estimating error without
regard to statistics that are associated with the development of the CERs
© MCR, LLC 21

22
Very Bad Math:A Contrived Example
Number of Contractor O&S Staff
Total Number ofO&S Staff
Contractors as a Percent of Total
9 10 90%200 500 40%40 50 80%
So on average, contractors represent
%703
80%40%90%=
++of the total O&S Staff
© MCR, LLC
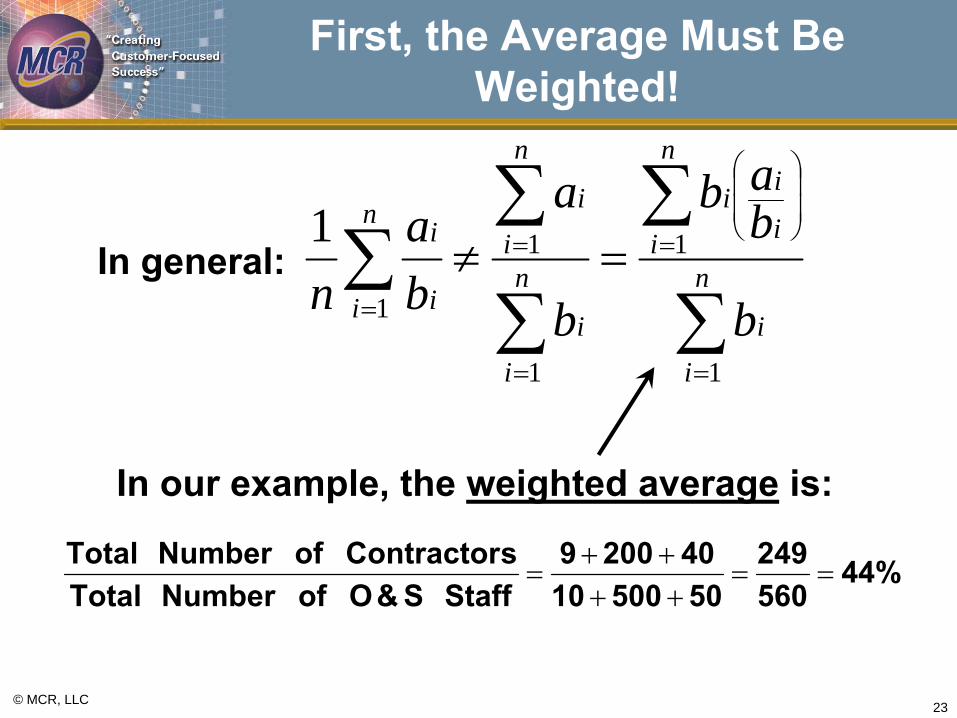
23
First, the Average Must Be Weighted!
∑
∑
∑
∑∑
=
=⎟⎟
⎠
⎞
⎜⎜
⎝
⎛
=
=
=
=≠ n
ii
n
i i
ii
n
ii
n
iin
i i
i
b
bab
b
a
ba
n1
1
1
1
1
1In general:
In our example, the weighted average is:
© MCR, LLC
44%560249
5050010402009
StaffS&OofNumberTotalsContractorofNumberTotal
==++++
=
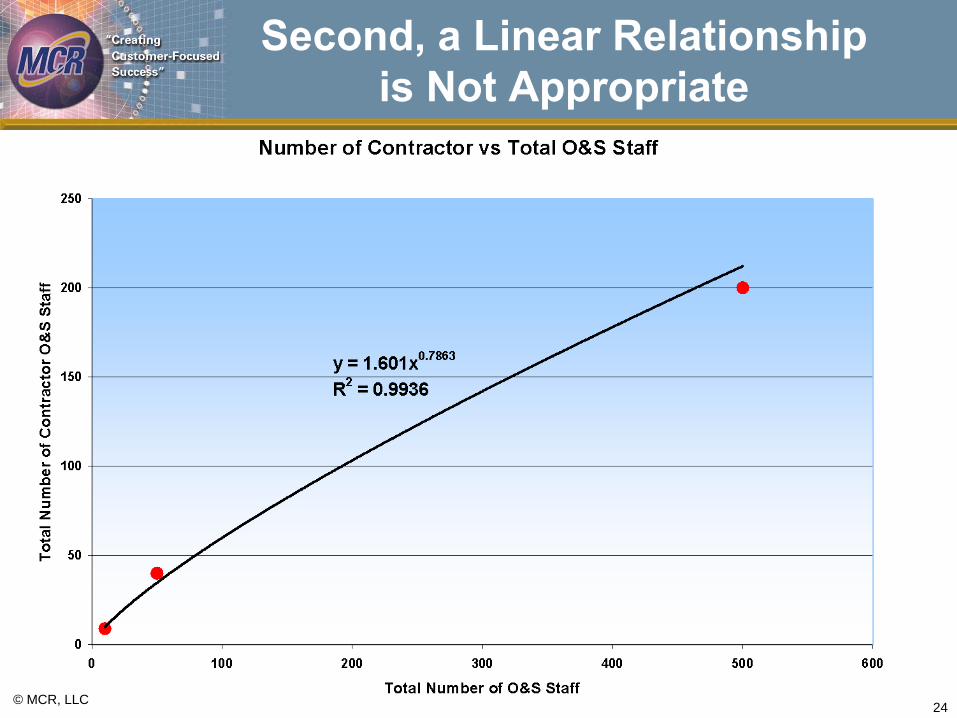
24
Second, a Linear Relationship is Not Appropriate
© MCR, LLC

25
Comparisons
© MCR, LLC
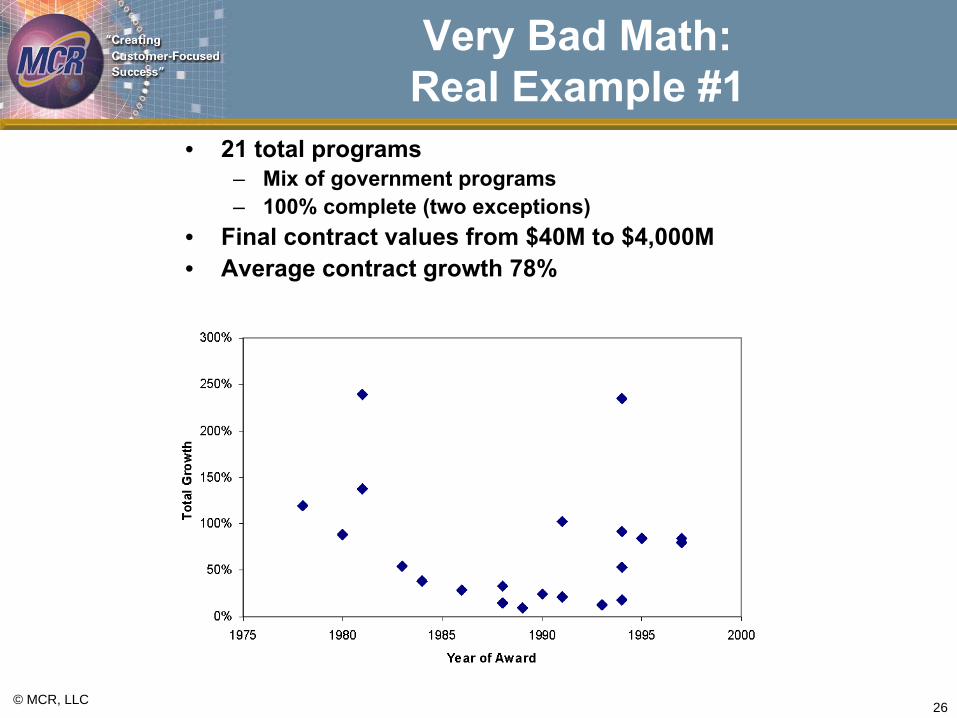
Very Bad Math:Real Example #1
• 21 total programs– Mix of government programs– 100% complete (two exceptions)
• Final contract values from $40M to $4,000M• Average contract growth 78%
26© MCR, LLC
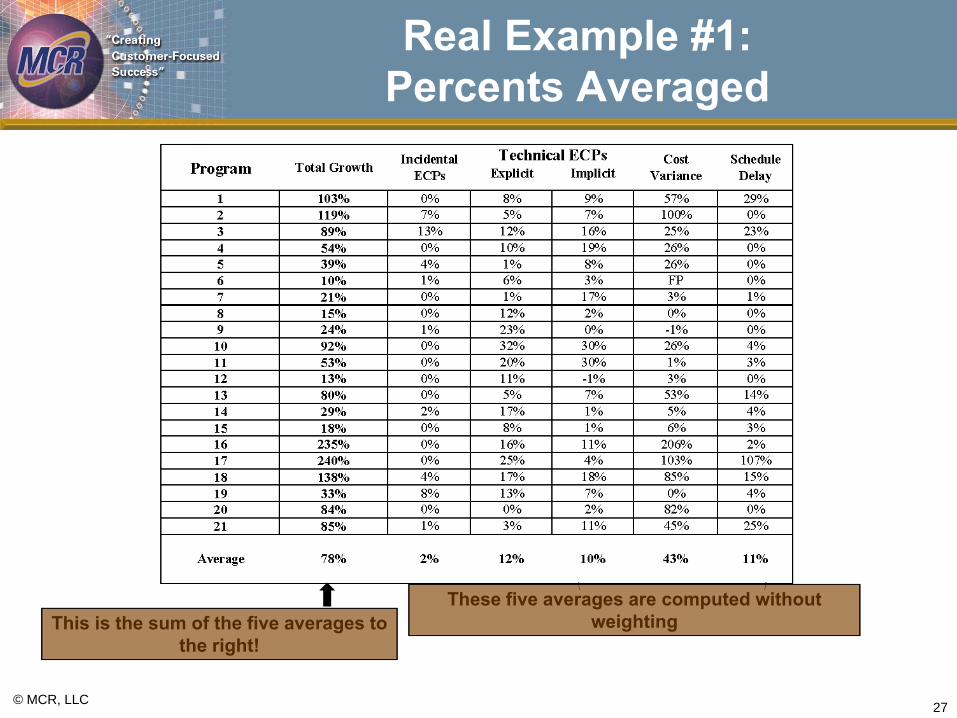
27
Real Example #1:Percents Averaged
© MCR, LLC
These five averages are computed without weightingThis is the sum of the five averages to
the right!

Very Bad Math:Real Example #2
- Use Weighted Average method to more heavily weight the larger systems
- Use the Simple Average method to weight each data point equally
- If Method 1 is used the NR Bus estimate would be reduced by $78M (BY03)
- Method 2 substantiated and recommended by our Statistician and Scientist
28© MCR, LLC

What’s Hot and What’s Not Among the Numerate
© MCR, LLC 29
Out In Comments“Point Estimate” Estimate with
associatedconfidence level
“Point Estimate” is an undefined term. A proper cost estimate must reflect its probabilistic nature.
Arithmetic Summing of Estimates
Statistical Summing of Estimates
Only means of distributions can be arithmetically summed and nothing else!
OLS and Log-OLS MPE-ZPB The world is rarely linear and the assumptions for OLS are even more rarely satisfied. Multiplicative error makes more sense for cost estimates.
IRLS = Minimum Unbiased Percentage Error (MUPE)
IRLS ≠ MUPE IRLS is biased in small samples (Goldberg and Sperling)
Learning Curves Quantity as an Independent Variable (QAIV)
Learning slope is a significant cost driver but its selection rarely has a solid justification. Let the data dictate adjustment.
Black Box Cost Models Transparent Cost Models
Should be obvious why.
Cost as an Independent Variable (CAIV)
Design to Cost (DTC)
Cost is a dependent random variable, not independent. The older terminology was better.
Innumeracy Numeracy ‘Nuff said

The Limitations of Math
30© MCR, LLC

Well for One Thing, Math Won’t Make You Any Friends Among the Innumerate
© MCR, LLC 31
Nealxxxxxx
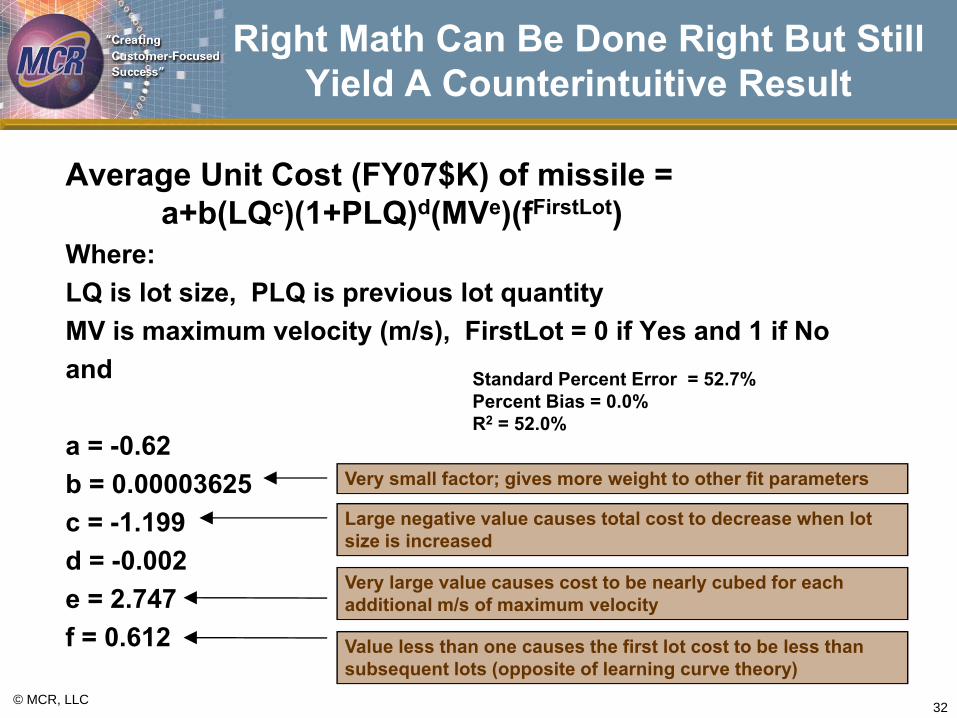
Right Math Can Be Done Right But Still Yield A Counterintuitive Result
Average Unit Cost (FY07$K) of missile = a+b(LQc)(1+PLQ)d(MVe)(fFirstLot)
Where:LQ is lot size, PLQ is previous lot quantityMV is maximum velocity (m/s), FirstLot = 0 if Yes and 1 if Noand
a = -0.62b = 0.00003625 c = -1.199d = -0.002e = 2.747f = 0.612
© MCR, LLC 32
Standard Percent Error = 52.7% Percent Bias = 0.0% R2 = 52.0%
Very small factor; gives more weight to other fit parameters
Large negative value causes total cost to decrease when lot size is increased
Very large value causes cost to be nearly cubed for each additional m/s of maximum velocity
Value less than one causes the first lot cost to be less than subsequent lots (opposite of learning curve theory)
Good Math Doesn’t Guarantee that
• Programs won’t overrun– Risk impacts may not be adequately
considered– Budgets may not include a reasonable reserve
• Analyses will be accepted– Clients glaze over when math is shown– Clients often are inadequately trained in math
and statistics– More attractive results (i.e., less scary) from
less numerate costers prevail
© MCR, LLC 33

The Inadequacy of Models
• Costs of programs are determined by more than just labor and material
• Drivers include management, political factors, and budgetary environment which don’t readily lend themselves to quantification
• We still lack an overarching theory that would yield better cost models– No guarantee that one exists– Investigation into similar disciplines such as
economics and finance is yielding some ideas that may point to a causal foundation for cost analysis
© MCR, LLC 34
Other Challenges
• Small data sets• Assessing estimating errors• Selection of figures of merit for models• Determining most appropriate
distributions for modeling impact of risk• Creating joint cost and schedule
probability distributions
© MCR, LLC 35

36
Summary
• In life and particularly in cost analysis, innumeracy isn’t cool
• As cost analysts introduce more mathematical models and methods, care must be taken to follow the rules– Define terms– Satisfy hypotheses of theorems before applying them– Adopt the most appropriate model formulations– Do the calculations correctly
• Failure to do the right math and to get the math right will continue to introduce unnecessary error into our estimates and erode confidence in our numerate clients who know what good is
© MCR, LLC

A Response to the Insistently Innumerate
© MCR, LLC 37
“You are entitled to your own opinion but not to your own mathematics”...NDH

38
AcronymsBY Base YearCAIV Cost as an Independent VariableCER Cost Estimating RelationshipCOCOMO Constructive Cost ModelDTC Design to CostECP Engineering Change ProposalICE Independent Cost EstimateIRLS Iteratively Reweighted Least Squares MPE Minimum Percent ErrorMUPE Minimum Unbiased Percentage Error NDH Neal David HulkowerNR NonrecurringNRO National Reconnaissance OfficeO&S Operations and SupportOLS Ordinary Least SquaresPh.D. Piled Higher and DeeperPOE Program Office EstimateQAIV Quantity as an Independent VariableT1 Theoretical First Unit CostWBS Work Breakdown StructureZPB Zero Percent Bias
© MCR, LLC