numbers, facts and trends shaping the world for...
TRANSCRIPT
FOR RELEASE OCTOBER 26, 2016
BY Gretchen Livingston
FOR MEDIA OR OTHER INQUIRIES:
Gretchen Livingston, Senior Researcher
Kim Parker, Director of Social Trends Research
Molly Rohal, Communications Manager
202.419.4372
www.pewresearch.org
RECOMMENDED CITATION: Pew Research Center, October, 2016, “Births outside of marriage decline for immigrant women”
NUMBERS, FACTS AND TRENDS SHAPING THE WORLD

1
PEW RESEARCH CENTER
www.pewresearch.org
About Pew Research Center
Pew Research Center is a nonpartisan fact tank that informs the public about the issues, attitudes
and trends shaping America and the world. It does not take policy positions. The center conducts
public opinion polling, demographic research, content analysis and other data-driven social
science research. It studies U.S. politics and policy; journalism and media; internet, science and
technology; religion and public life; Hispanic trends; global attitudes and trends; and U.S. social
and demographic trends. All of the center’s reports are available at www.pewresearch.org. Pew
Research Center is a subsidiary of The Pew Charitable Trusts, its primary funder.
© Pew Research Center 2016
2
PEW RESEARCH CENTER
www.pewresearch.org
Terminology
A “new mother” or “mother of a newborn” in this report includes anyone who gave birth in the
U.S. within the 12 months prior to being surveyed. New adoptive, foster and stepmothers are not
included in this analysis.1
“Births” refers to live births occurring in the calendar year in the U.S.
Except where noted, all variables, including race and ethnicity, are based on the characteristics of
the mother, not of the father or the baby.
Any births to mothers born in one of the 50 states or the District of Columbia are defined as births
to “U.S.-born” women in analyses based on National Center for Health Statistics (NCHS) data.
Births to women born elsewhere, including Puerto Rico and other U.S. territories, are counted as
births to “foreign-born” women.
For American Community Survey (ACS) and census analyses based on women who gave birth in
the preceding 12 months, “U.S. born” includes those who were born in one of the 50 states or the
District of Columbia, or who were born abroad to at least one American parent. All others are
classified as “foreign born,” including those born in Puerto Rico and other U.S. territories.
While individuals born in Puerto Rico and other U.S. territories are U.S. citizens by birth, the
convention of categorizing persons living in the U.S. who were born in U.S. territories as foreign-
born has been used by both the United Nations and by NCHS in its online VitalStats data
tabulator.2
The terms “foreign born” and “immigrant” are used interchangeably.
The foreign born in these analyses comprise both authorized and unauthorized immigrants.
A mother’s marital status is based on when she gives birth. Any mother who reports that she is
married is classified as such, regardless of whether she is married to a man or a woman.
1 Estimates suggest that about 3.5% of children are living with an adoptive, foster or stepmother. 2 Had women born in Puerto Rico been classified as “U.S. born” for this analysis, the share of all births to U.S.-born women would have risen
by 0.4 percentage points in 2014, and the share to foreign-born women would have declined by 0.4 percentage points. In addition, the share
of births to unmarried women would have risen by 0.1 percentage point for U.S.-born women and declined by 0.4 percentage points for
foreign-born women.

3
PEW RESEARCH CENTER
www.pewresearch.org
Racial references to whites, blacks and Asians include only those who are non-Hispanic. Hispanics
are of any race.
“Some college” includes those with a two-year degree or those who attended college but did not
obtain a degree. “High school” refers to those who have attained a high school diploma or its
equivalent, such as a General Education Development (GED) certificate. A mother’s educational
attainment is based on when she is interviewed for the ACS.
A mother’s age, employment status, income level, poverty status, English language skills and years
in the U.S. are all based on her characteristics at the time she is interviewed for the ACS.
4
PEW RESEARCH CENTER
www.pewresearch.org
Table of Contents
About Pew Research Center 0
Terminology 2
Overview 6
Foreign-born mothers driving long-term growth in U.S. births 8
Foreign-born mothers, most of whom are long-term U.S. residents, lag behind U.S.-born mothers in
economic well-being 9
Road map to the report 12
1. Growth in annual U.S. births since 1970 driven entirely by immigrant moms 13
2. Births outside of marriage on the decline for immigrant women 16
Compositional factors that contribute to the nativity gap in births outside of marriage 18
3. Foreign-born moms have a different demographic profile than U.S.-born moms, and among the
foreign born there are sharp differences tied to region of birth 19
Births to foreign-born moms still dominated by those from Latin America, though these shares have
been on the decline in recent years 20
Foreign-born moms are older than U.S.-born moms 22
Foreign-born moms far more likely than U.S.-born moms to be Hispanic or Asian 24
New foreign-born mothers twice as likely as U.S.-born moms to lack a high school diploma 25
New foreign-born mothers are less financially well-off than new U.S.-born mothers 28
Half of new foreign-born mothers have been in the U.S. for more than a decade 30
Seven-in-ten new foreign-born moms speak English well 32
4. Among foreign-born new moms from top sending locations, big differences in demographic
characteristics 33
More than half of births to foreign-born women are to those from nine countries and Puerto Rico 33
Marriage rates vary widely among mothers by birthplace 35
Almost half of new mothers from Vietnam are ages 35 or older 36
New moms from India are, by far, the most likely to have bachelor’s degree and to be financially well-
off 37
About four-in-ten new moms from Guatemala are English-proficient 40
Acknowledgments 41

5
PEW RESEARCH CENTER
www.pewresearch.org
Methodology 42
Datasets 42
Birth rates 43
Definitions 44
6
PEW RESEARCH CENTER
www.pewresearch.org
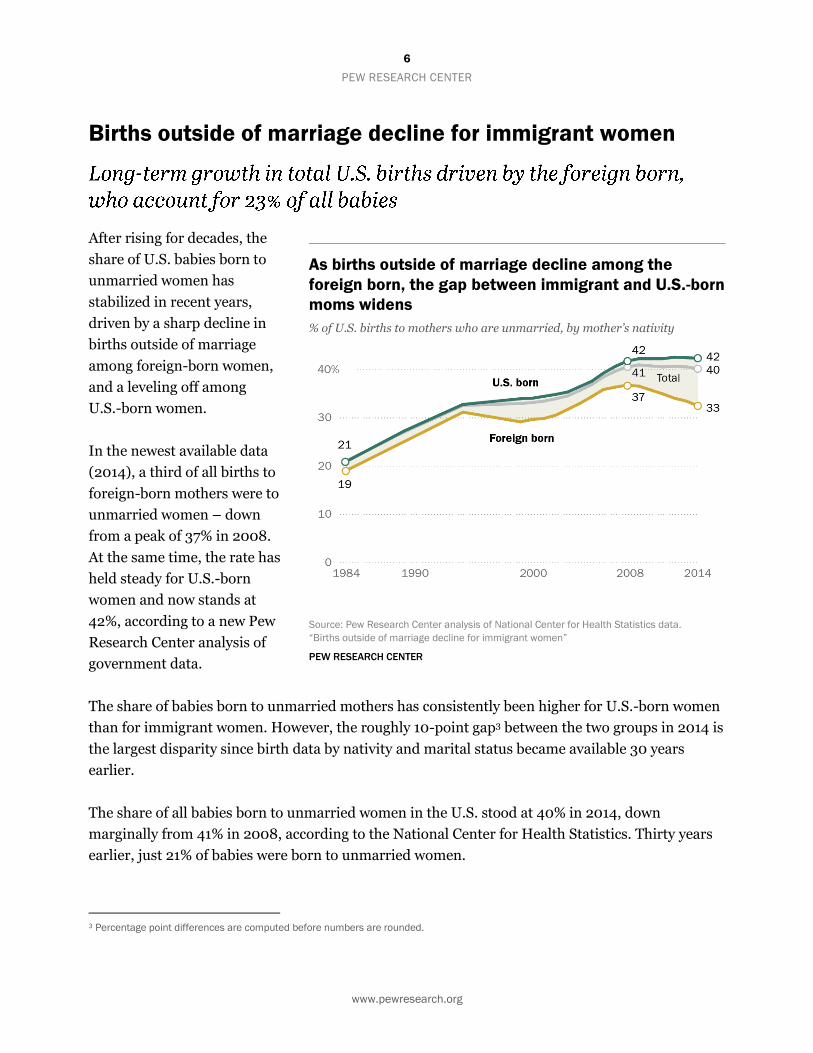
Births outside of marriage decline for immigrant women
After rising for decades, the
share of U.S. babies born to
unmarried women has
stabilized in recent years,
driven by a sharp decline in
births outside of marriage
among foreign-born women,
and a leveling off among
U.S.-born women.
In the newest available data
(2014), a third of all births to
foreign-born mothers were to
unmarried women – down
from a peak of 37% in 2008.
At the same time, the rate has
held steady for U.S.-born
women and now stands at
42%, according to a new Pew
Research Center analysis of
government data.
The share of babies born to unmarried mothers has consistently been higher for U.S.-born women
than for immigrant women. However, the roughly 10-point gap3 between the two groups in 2014 is
the largest disparity since birth data by nativity and marital status became available 30 years
earlier.
The share of all babies born to unmarried women in the U.S. stood at 40% in 2014, down
marginally from 41% in 2008, according to the National Center for Health Statistics. Thirty years
earlier, just 21% of babies were born to unmarried women.
3 Percentage point differences are computed before numbers are rounded.
As births outside of marriage decline among the
foreign born, the gap between immigrant and U.S.-born
moms widens
% of U.S. births to mothers who are unmarried, by mother’s nativity
Source: Pew Research Center analysis of National Center for Health Statistics data.
“Births outside of marriage decline for immigrant women”
PEW RESEARCH CENTER

7
PEW RESEARCH CENTER
www.pewresearch.org
The decline in births outside of marriage among the foreign born is being driven, in part, by the
changing regions of birth of new foreign-born mothers. The share of babies born to moms from
Latin America has declined, while the share of babies born to moms from regions such as Asia has
increased. New foreign-born mothers from Latin America were roughly four times as likely as
moms from Asia to be unmarried in 2014.
The shifting origins of new immigrant mothers are due in part
to the decline in the number of recent U.S. immigrants from
Latin America, which has been driven largely by post-recession
declines in Mexican immigrants, and to dramatic birth rate
declines among Hispanic immigrants in the wake of the Great
Recession.
Plummeting fertility rates among unmarried foreign-born
women are further contributing to the declining share of babies
born outside of marriage for this group. In 2014 the birth rate
(the annual number of births per 1,000 women of childbearing
age)4 for unmarried immigrants was 60.4. This is down from
90.0 in 2008 – a drop of 33% in just six years. Fertility among
married foreign-born women also declined during this period
marked by the onset of the Great Recession, but by a relatively
modest 10%, from 115.1 to 104.0.
In 2014, U.S. births to foreign-born women from Latin America
were more likely to occur outside of marriage than those to
U.S.-born women (48% vs. 42%). However, U.S. births to
foreign-born women from most other regions of the world were
less likely to occur outside of marriage than those to U.S.-born
women.
4 This is also known as the “general fertility rate.” Childbearing age means ages 15 to 44.
For foreign-born women,
big drop in fertility
outside of marriage
% change in birth rates, by mother’s
marital status and nativity, 2008-
2014
Source: Pew Research Center analysis of
National Center for Health Statistics data
and American Community Survey data
(IPUMS).
“Births outside of marriage decline for
immigrant women”
PEW RESEARCH CENTER
5
-9 -10
-33
Married Unmarried
U.S. born Foreign born
8
PEW RESEARCH CENTER
www.pewresearch.org
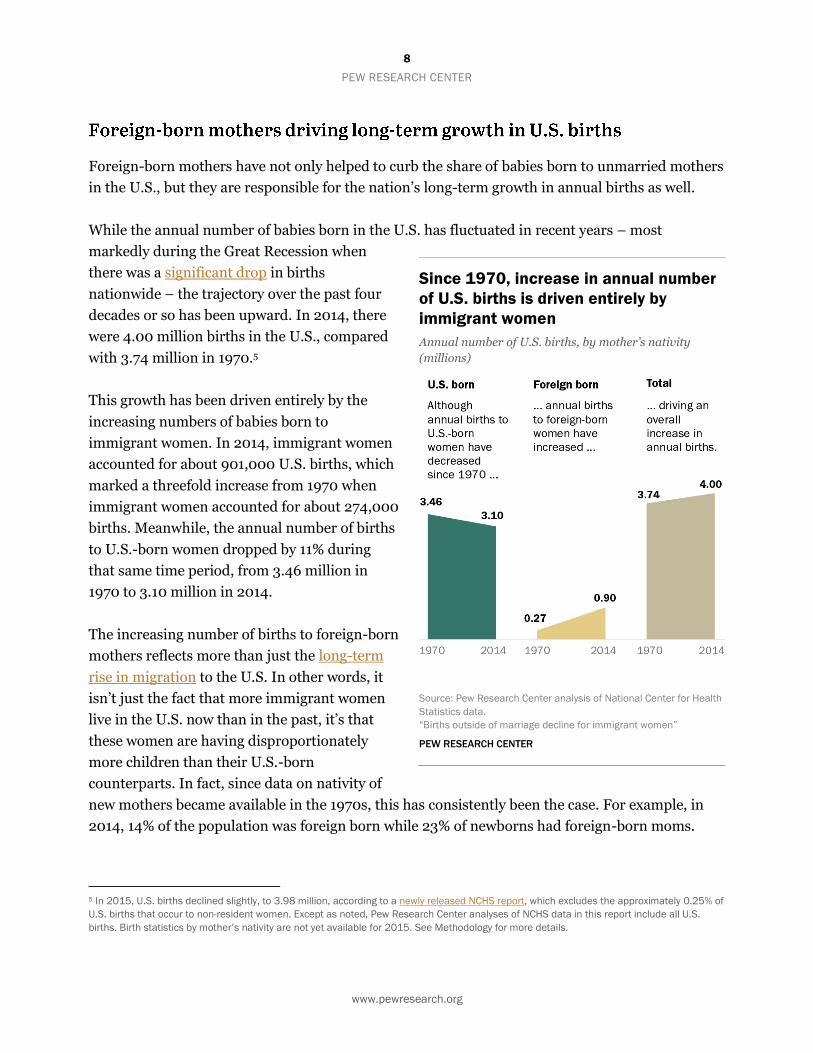
Foreign-born mothers have not only helped to curb the share of babies born to unmarried mothers
in the U.S., but they are responsible for the nation’s long-term growth in annual births as well.
While the annual number of babies born in the U.S. has fluctuated in recent years – most
markedly during the Great Recession when
there was a significant drop in births
nationwide – the trajectory over the past four
decades or so has been upward. In 2014, there
were 4.00 million births in the U.S., compared
with 3.74 million in 1970.5
This growth has been driven entirely by the
increasing numbers of babies born to
immigrant women. In 2014, immigrant women
accounted for about 901,000 U.S. births, which
marked a threefold increase from 1970 when
immigrant women accounted for about 274,000
births. Meanwhile, the annual number of births
to U.S.-born women dropped by 11% during
that same time period, from 3.46 million in
1970 to 3.10 million in 2014.
The increasing number of births to foreign-born
mothers reflects more than just the long-term
rise in migration to the U.S. In other words, it
isn’t just the fact that more immigrant women
live in the U.S. now than in the past, it’s that
these women are having disproportionately
more children than their U.S.-born
counterparts. In fact, since data on nativity of
new mothers became available in the 1970s, this has consistently been the case. For example, in
2014, 14% of the population was foreign born while 23% of newborns had foreign-born moms.
5 In 2015, U.S. births declined slightly, to 3.98 million, according to a newly released NCHS report, which excludes the approximately 0.25% of
U.S. births that occur to non-resident women. Except as noted, Pew Research Center analyses of NCHS data in this report include all U.S.
births. Birth statistics by mother’s nativity are not yet available for 2015. See Methodology for more details.
Since 1970, increase in annual number
of U.S. births is driven entirely by
immigrant women
Annual number of U.S. births, by mother’s nativity
(millions)
Source: Pew Research Center analysis of National Center for Health
Statistics data.
“Births outside of marriage decline for immigrant women”
PEW RESEARCH CENTER
9
PEW RESEARCH CENTER
www.pewresearch.org
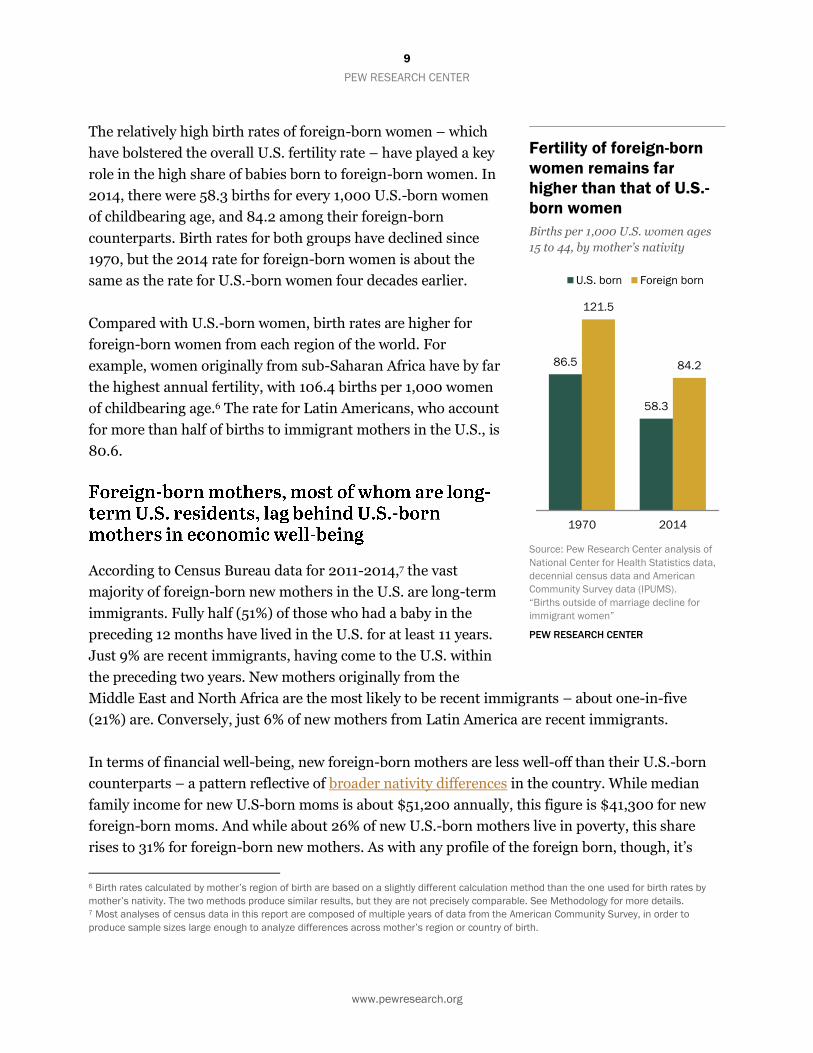
The relatively high birth rates of foreign-born women – which
have bolstered the overall U.S. fertility rate – have played a key
role in the high share of babies born to foreign-born women. In
2014, there were 58.3 births for every 1,000 U.S.-born women
of childbearing age, and 84.2 among their foreign-born
counterparts. Birth rates for both groups have declined since
1970, but the 2014 rate for foreign-born women is about the
same as the rate for U.S.-born women four decades earlier.
Compared with U.S.-born women, birth rates are higher for
foreign-born women from each region of the world. For
example, women originally from sub-Saharan Africa have by far
the highest annual fertility, with 106.4 births per 1,000 women
of childbearing age.6 The rate for Latin Americans, who account
for more than half of births to immigrant mothers in the U.S., is
80.6.
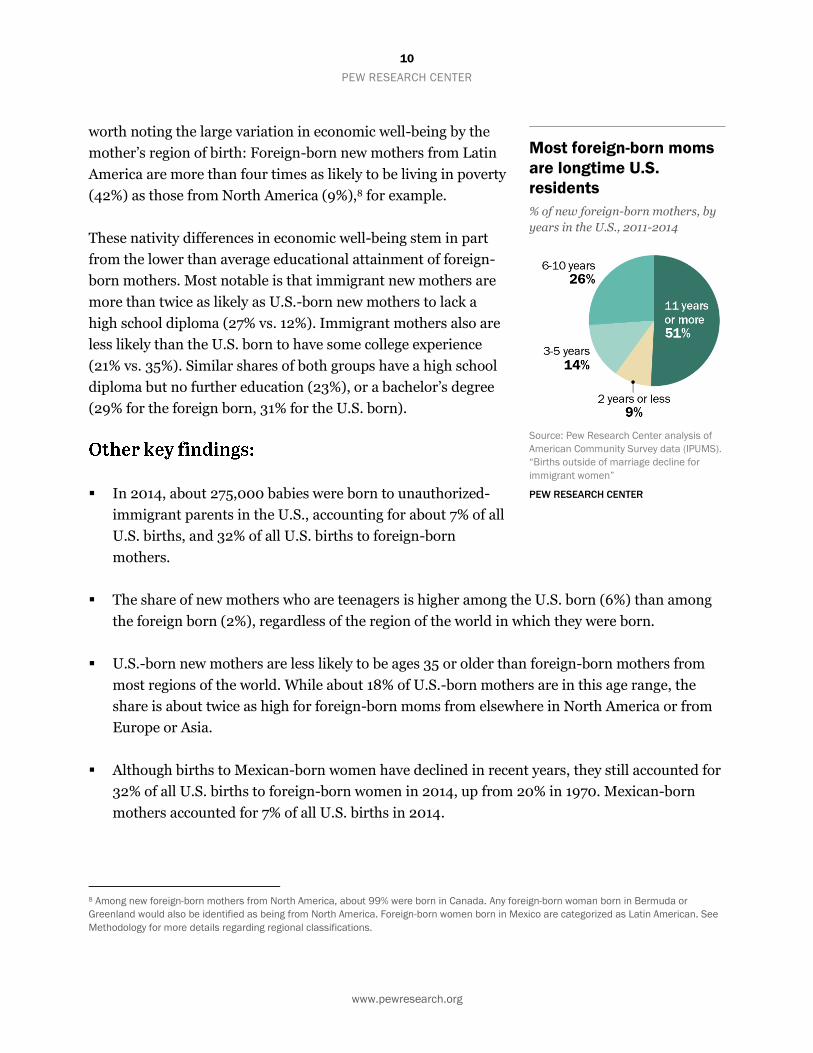
According to Census Bureau data for 2011-2014,7 the vast
majority of foreign-born new mothers in the U.S. are long-term
immigrants. Fully half (51%) of those who had a baby in the
preceding 12 months have lived in the U.S. for at least 11 years.
Just 9% are recent immigrants, having come to the U.S. within
the preceding two years. New mothers originally from the
Middle East and North Africa are the most likely to be recent immigrants – about one-in-five
(21%) are. Conversely, just 6% of new mothers from Latin America are recent immigrants.
In terms of financial well-being, new foreign-born mothers are less well-off than their U.S.-born
counterparts – a pattern reflective of broader nativity differences in the country. While median
family income for new U.S-born moms is about $51,200 annually, this figure is $41,300 for new
foreign-born moms. And while about 26% of new U.S.-born mothers live in poverty, this share
rises to 31% for foreign-born new mothers. As with any profile of the foreign born, though, it’s
6 Birth rates calculated by mother’s region of birth are based on a slightly different calculation method than the one used for birth rates by
mother’s nativity. The two methods produce similar results, but they are not precisely comparable. See Methodology for more details. 7 Most analyses of census data in this report are composed of multiple years of data from the American Community Survey, in order to
produce sample sizes large enough to analyze differences across mother’s region or country of birth.
Fertility of foreign-born
women remains far
higher than that of U.S.-
born women
Births per 1,000 U.S. women ages
15 to 44, by mother’s nativity
Source: Pew Research Center analysis of
National Center for Health Statistics data,
decennial census data and American
Community Survey data (IPUMS).
“Births outside of marriage decline for
immigrant women”
PEW RESEARCH CENTER
86.5
58.3
121.5
84.2
1970 2014
U.S. born Foreign born
10
PEW RESEARCH CENTER
www.pewresearch.org
worth noting the large variation in economic well-being by the
mother’s region of birth: Foreign-born new mothers from Latin
America are more than four times as likely to be living in poverty
(42%) as those from North America (9%),8 for example.
These nativity differences in economic well-being stem in part
from the lower than average educational attainment of foreign-
born mothers. Most notable is that immigrant new mothers are
more than twice as likely as U.S.-born new mothers to lack a
high school diploma (27% vs. 12%). Immigrant mothers also are
less likely than the U.S. born to have some college experience
(21% vs. 35%). Similar shares of both groups have a high school
diploma but no further education (23%), or a bachelor’s degree
(29% for the foreign born, 31% for the U.S. born).
In 2014, about 275,000 babies were born to unauthorized-
immigrant parents in the U.S., accounting for about 7% of all
U.S. births, and 32% of all U.S. births to foreign-born
mothers.
The share of new mothers who are teenagers is higher among the U.S. born (6%) than among
the foreign born (2%), regardless of the region of the world in which they were born.
U.S.-born new mothers are less likely to be ages 35 or older than foreign-born mothers from
most regions of the world. While about 18% of U.S.-born mothers are in this age range, the
share is about twice as high for foreign-born moms from elsewhere in North America or from
Europe or Asia.
Although births to Mexican-born women have declined in recent years, they still accounted for
32% of all U.S. births to foreign-born women in 2014, up from 20% in 1970. Mexican-born
mothers accounted for 7% of all U.S. births in 2014.
8 Among new foreign-born mothers from North America, about 99% were born in Canada. Any foreign-born woman born in Bermuda or
Greenland would also be identified as being from North America. Foreign-born women born in Mexico are categorized as Latin American. See
Methodology for more details regarding regional classifications.
Most foreign-born moms
are longtime U.S.
residents
% of new foreign-born mothers, by
years in the U.S., 2011-2014
Source: Pew Research Center analysis of
American Community Survey data (IPUMS).
“Births outside of marriage decline for
immigrant women”
PEW RESEARCH CENTER
11
PEW RESEARCH CENTER
www.pewresearch.org
More than half of all babies born to foreign-born women in the U.S. are to those from nine
countries and one U.S. territory:9 Mexico, China, India, El Salvador, Guatemala, the
Philippines, Honduras, Vietnam, Dominican Republic and Puerto Rico.
Among new foreign-born U.S. mothers from the top 10 sending locations, those from India
stand out for their low share of births outside marriage (1%), high rates of college degree
attainment (87%), and high annual family incomes ($104,500). At the opposite end of the
spectrum, new mothers from Honduras stand out for the high share who are unmarried (66%),
lack a high school diploma (51%) and are living in poverty (49%).
9 Puerto Rico is a U.S. territory. Women born in Puerto Rico are U.S. citizens, but are classified as “foreign born” in this report. See
Terminology for more details.
About the data
This report is based primarily on two data sources:
National Center for Health Statistics (NCHS) data derived from U.S. birth certificates.
American Community Survey (ACS) data based on all women ages 15 to 49 who have given birth in
the U.S. in the 12 months prior to the survey.
Both are valuable sources of fertility information, and each offers particular advantages:
The NCHS data allow for trend analysis back to 1970 but include only a handful of relevant
maternal characteristics based on the time of the birth. Analyses of mother’s nativity, country of
birth and marital status are derived from the NCHS data.
The ACS data do not offer a long time horizon but do include data on many maternal
characteristics not available through NCHS data such as educational attainment, financial well-
being and years spent in the U.S. All analyses other than those focused on mothers’ nativity,
country of birth and marital status are derived from the ACS data.
For more details on each dataset, please see the Methodology Region definitions.
12
PEW RESEARCH CENTER
www.pewresearch.org
This report is organized as follows. The first chapter provides an overview of trends since 1970 in
U.S. births and birth rates among U.S.-born women and foreign-born women. The following
chapter zeroes in on the trend since 1984 in births outside of marriage, and what factors may be
contributing to the growing gap in births outside marriage between U.S.-born and foreign-born
women. The third chapter examines differences by mother’s nativity and region of birth on a
number of other demographic and economic characteristics, including age, race, education,
employment, financial well-being, years in the U.S. and English language skills. The last chapter
examines the economic and demographic profiles of new mothers who were born in one of the
nine countries and one U.S. territory accounting for the largest share of new U.S. foreign-born
mothers.
13
PEW RESEARCH CENTER
www.pewresearch.org
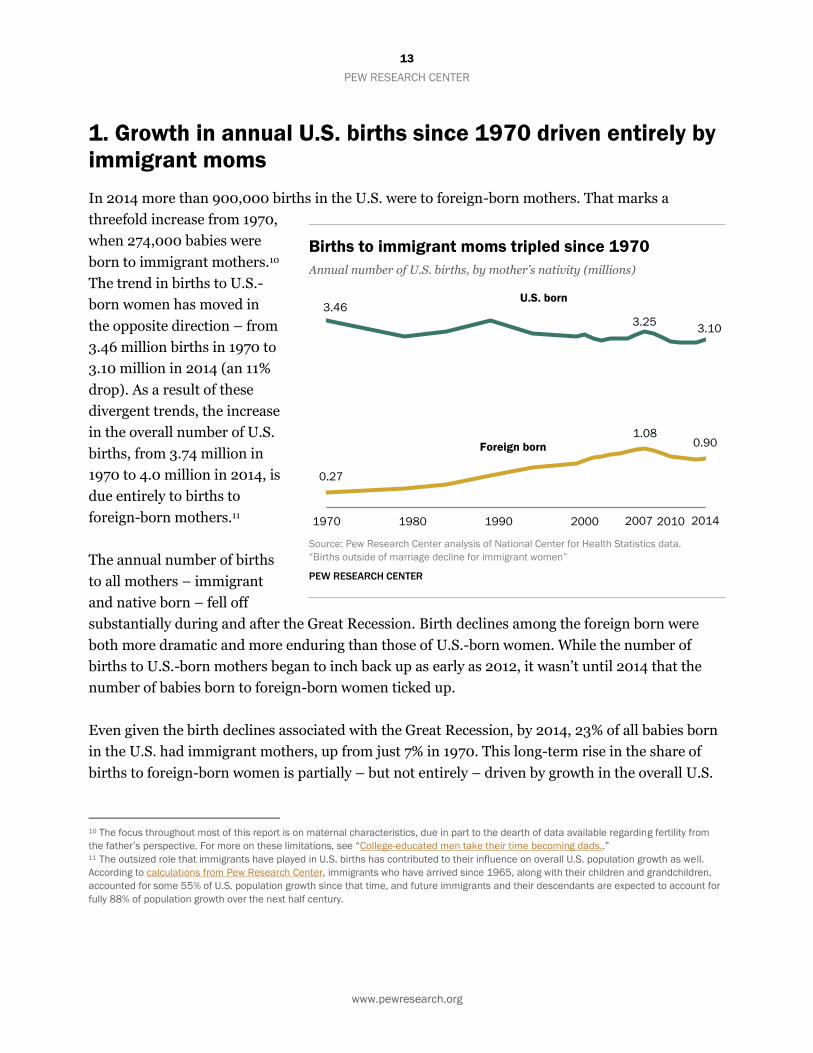
1. Growth in annual U.S. births since 1970 driven entirely by
immigrant moms
In 2014 more than 900,000 births in the U.S. were to foreign-born mothers. That marks a
threefold increase from 1970,
when 274,000 babies were
born to immigrant mothers.10
The trend in births to U.S.-
born women has moved in
the opposite direction – from
3.46 million births in 1970 to
3.10 million in 2014 (an 11%
drop). As a result of these
divergent trends, the increase
in the overall number of U.S.
births, from 3.74 million in
1970 to 4.0 million in 2014, is
due entirely to births to
foreign-born mothers.11
The annual number of births
to all mothers – immigrant
and native born – fell off
substantially during and after the Great Recession. Birth declines among the foreign born were
both more dramatic and more enduring than those of U.S.-born women. While the number of
births to U.S.-born mothers began to inch back up as early as 2012, it wasn’t until 2014 that the
number of babies born to foreign-born women ticked up.
Even given the birth declines associated with the Great Recession, by 2014, 23% of all babies born
in the U.S. had immigrant mothers, up from just 7% in 1970. This long-term rise in the share of
births to foreign-born women is partially – but not entirely – driven by growth in the overall U.S.
10 The focus throughout most of this report is on maternal characteristics, due in part to the dearth of data available regarding fertility from
the father’s perspective. For more on these limitations, see “College-educated men take their time becoming dads..” 11 The outsized role that immigrants have played in U.S. births has contributed to their influence on overall U.S. population growth as well.
According to calculations from Pew Research Center, immigrants who have arrived since 1965, along with their children and grandchildren,
accounted for some 55% of U.S. population growth since that time, and future immigrants and their descendants are expected to account for
fully 88% of population growth over the next half century.
Births to immigrant moms tripled since 1970
Annual number of U.S. births, by mother’s nativity (millions)
Source: Pew Research Center analysis of National Center for Health Statistics data.
“Births outside of marriage decline for immigrant women”
PEW RESEARCH CENTER
0.27
1.08 0.90
3.46
3.25 3.10
1970 1980 1990 2000 2010
Foreign born
U.S. born
2007 2014
14
PEW RESEARCH CENTER
www.pewresearch.org
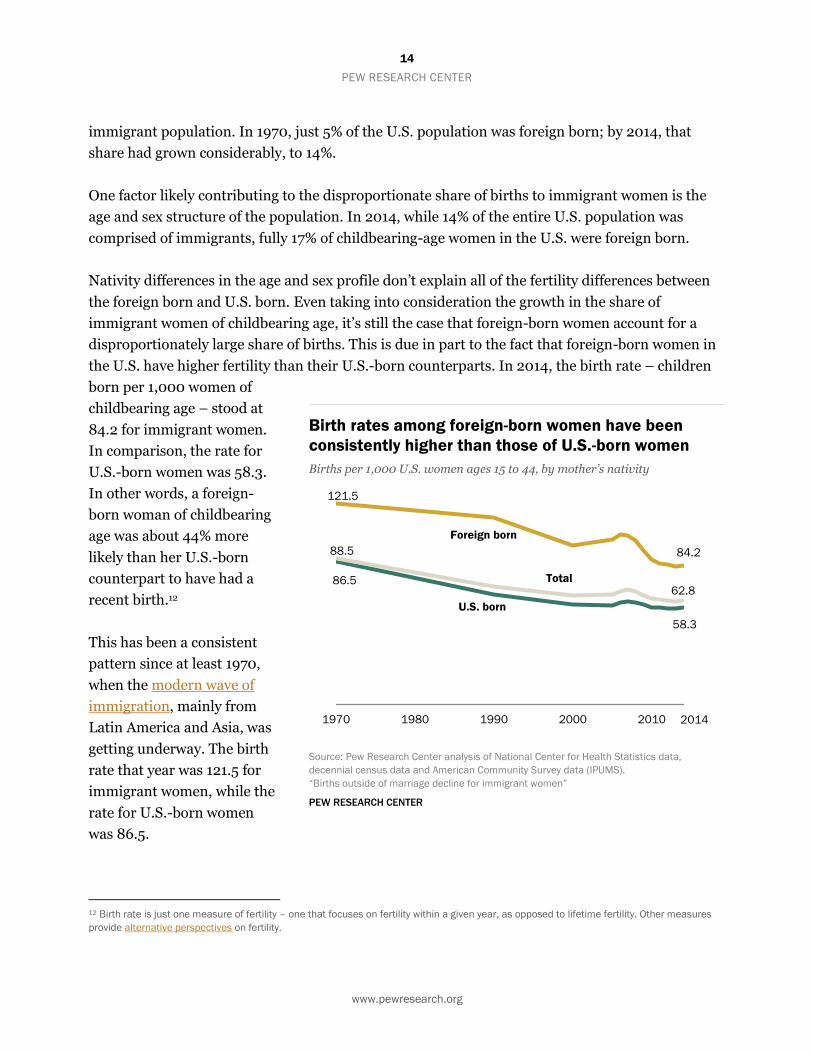
immigrant population. In 1970, just 5% of the U.S. population was foreign born; by 2014, that
share had grown considerably, to 14%.
One factor likely contributing to the disproportionate share of births to immigrant women is the
age and sex structure of the population. In 2014, while 14% of the entire U.S. population was
comprised of immigrants, fully 17% of childbearing-age women in the U.S. were foreign born.
Nativity differences in the age and sex profile don’t explain all of the fertility differences between
the foreign born and U.S. born. Even taking into consideration the growth in the share of
immigrant women of childbearing age, it’s still the case that foreign-born women account for a
disproportionately large share of births. This is due in part to the fact that foreign-born women in
the U.S. have higher fertility than their U.S.-born counterparts. In 2014, the birth rate – children
born per 1,000 women of
childbearing age – stood at
84.2 for immigrant women.
In comparison, the rate for
U.S.-born women was 58.3.
In other words, a foreign-
born woman of childbearing
age was about 44% more
likely than her U.S.-born
counterpart to have had a
recent birth.12
This has been a consistent
pattern since at least 1970,
when the modern wave of
immigration, mainly from
Latin America and Asia, was
getting underway. The birth
rate that year was 121.5 for
immigrant women, while the
rate for U.S.-born women
was 86.5.
12 Birth rate is just one measure of fertility – one that focuses on fertility within a given year, as opposed to lifetime fertility. Other measures
provide alternative perspectives on fertility.
Birth rates among foreign-born women have been
consistently higher than those of U.S.-born women
Births per 1,000 U.S. women ages 15 to 44, by mother’s nativity
Source: Pew Research Center analysis of National Center for Health Statistics data,
decennial census data and American Community Survey data (IPUMS).
“Births outside of marriage decline for immigrant women”
PEW RESEARCH CENTER
121.5
84.2
86.5
58.3
88.5
62.8
1970 1980 1990 2000 2010
Foreign born
U.S. born
Total
2014
15
PEW RESEARCH CENTER
www.pewresearch.org
In 2006, just before the start of the recession, birth rates of foreign-born women were almost 70%
higher than those of U.S.-born women (103.0 vs. 61.5). These differences have diminished
somewhat since then, as immigrant birth rates have declined more rapidly than the birth rates of
U.S.-born women in the wake of the Great Recession.
Though overall U.S. birth rates ticked up just prior to the recession, in the long term, they have
declined noticeably. In 1970 the rate was 88.5 births per 1,000 women of childbearing age, and
after hitting a historical low of 62.3 in 2013, rates inched up for the first time since the recession in
2014, to 62.8.13 The 2014 U.S. birth rate is about 29% lower than it was in 1970.14 For both the
foreign born and U.S. born, long-term declines in fertility have been more dramatic – by 2014 the
rate among the foreign born had dropped 31% since 1970 and among the U.S. born, there was a
33% decline.15
13 The birth rates used in this report differ slightly from published NCHS figures. See Methodology for more details. 14 The birth rate ticked back down to 62.5 in 2015, according to a newly released NCHS report. Data regarding 2015 birth rates by nativity are
not yet available. 15 It may seem counterintuitive that the birth rates for both foreign-born and U.S.-born women have declined more dramatically since 1970
than the overall U.S. birth rate. This phenomenon results from the fact that the share of childbearing-age women who are foreign born (who
have markedly higher birth rates than U.S.-born women) has increased substantially since that time. Given their relatively high fertility, the
growing size of this group has buoyed the overall U.S. fertility rate and kept it from falling more precipitously.
U.S. births to unauthorized immigrant parents
About 275,000 babies were born to unauthorized-immigrant parents in 2014, or about 7% of all births in
the U.S. that year, according to new Pew Research Center estimates based on government data. This
represented a decline from 330,000 in 2009, at the end of the Great Recession.
Births to unauthorized immigrants accounted for about one-in-three (32%) births to foreign-born mothers in
2014, according to the estimates.
The 2014 estimates of births to unauthorized immigrants are based on data from the Census Bureau’s
American Community Survey, using the widely accepted residual methodology employed by Pew Research
Center for many years. By comparison, the findings in this report about the number of U.S. births to foreign-
born mothers are based on data from the National Center for Health Statistics. Both data sources produce
very similar results in terms of the number of U.S. births to immigrant mothers and their share of all U.S.
births.

16
PEW RESEARCH CENTER
www.pewresearch.org
2. Births outside of marriage on the decline for immigrant
women
Births to unmarried mothers have been more common among the U.S. born than the foreign born
for at least 30 years, but the gap between these two groups has grown markedly in the past decade,
from 2004 to 2014.
In 1984, the first year for which data are available by mother’s nativity and marital status, there
was only a 2 percentage point difference between the share of babies born to unmarried foreign-
born women (19%) and the share to unmarried U.S.-born women (21%), according to data from
the National Center for Health Statistics.
Since 2000, the share of births outside of
marriage rose then leveled off for U.S.-born
women. In contrast, this share has been on the
decline for foreign-born mothers since peaking
in 2008. In 2014, 33% of births to foreign-born
moms occurred outside marriage (the lowest
level since 2004), compared with 42% among
U.S.-born women. The relatively low share of
babies born to unmarried mothers among the
foreign born has helped to suppress the overall
share of these births in the U.S., which stood at
40% in 2014.16
16 Preliminary data for 2015 indicate that the overall share of births to unmarried mothers held steady at 40%.
The growing nativity gap in births
outside of marriage
% of U.S. births to mothers who are unmarried, by
mother’s nativity
Source: Pew Research Center analysis of National Center for Health
Statistics data.
“Births outside of marriage decline for immigrant women”
PEW RESEARCH CENTER

17
PEW RESEARCH CENTER
www.pewresearch.org
These patterns largely mirror nativity
differences in the marital status of all women
of childbearing age. Foreign-born women ages
15 to 44 are much more likely to be married
than their U.S.-born counterparts, 55% vs.
34%, according to ACS data.
The share of births by unmarried immigrant
women varies widely by their region of birth.
Almost half (48%) of U.S. births to women
from Latin America happen outside of
marriage, according to NCHS data – a share
higher than the share among U.S.-born
women (42%). Among foreign-born women
from most other regions of the world,
however, births outside of marriage are less
common than among U.S.-born women. For
example, 26% of babies born to women from
sub-Saharan Africa were born outside of
marriage in 2014. And just 5% of U.S. births to
women from the Middle East and North Africa
are to unmarried women, as are about one-in-
ten births to immigrant women from elsewhere in North America (11%) and Asia (10%). The 38%
of births outside of marriage to women from Oceania is similar to the share among U.S.-born
women.
The recent decline in the share of babies born outside of marriage among the foreign born is
driven in part by the dramatic decline in fertility for unmarried immigrant women. The birth rate
for these women has declined by one-third since 2008, from 90.0 births per 1,000 women to 60.4
in 2014. In comparison, the birth rate for unmarried U.S.-born women during that same time
dropped by about 9%, to 37.4. Among married women, birth rates dropped 10% for the foreign
born and rose 5% for the U.S. born.
Births outside of marriage most
common among moms from Latin
America
% of U.S. births to mothers who are unmarried, by
mother’s nativity and region of birth, 2014
Source: Pew Research Center analysis of National Center for Health
Statistics data.
“Births outside of marriage decline for immigrant women”
PEW RESEARCH CENTER
5
10
11
17
26
33
38
42
48
Middle East-North Africa
Asia
Other North America
Europe
Sub-Saharan Africa
All foreign born
Oceania
U.S. born
Latin America

18
PEW RESEARCH CENTER
www.pewresearch.org
The recent downturn in births to unmarried
foreign-born women is also due, in part, to the
changing origins of foreign-born mothers in
the U.S. In just six years, the share of births to
mothers from Latin America – who are more
likely than foreign-born mothers from any
other region to be unmarried – dropped by 10
percentage points, from 64% in 2008 to 54%
in 2014, according to data from the National
Center for Health Statistics. At the same time,
the share of new immigrant mothers from Asia
– a group that is far less likely to be unmarried
– rose by a similar amount.
Changes in the racial and ethnic composition
of U.S.-born new moms have helped to sustain
the relatively high share of births outside of
marriage for that group. Since 2008, the share
of U.S.-born new mothers who are white – and
more likely to have births within marriage –
has declined by 3 percentage points, while the
share who are Hispanic – and more likely to
have births outside of marriage – has risen by
a similar amount.
The gap in births outside of marriage between
U.S.-born and foreign-born women is a
consequence not only of recent compositional changes, but also of enduring demographic
differences. For instance, the share of births to teenagers has consistently been higher among the
U.S. born than the foreign born. Since births outside of marriage are more common for teens than
older women, this contributes to the nativity gap in this measure. And at the other end of the age
spectrum, new mothers ages 35 and older are more common among the foreign born than the
native born, and these women are less likely to give birth outside of marriage.
For foreign-born women, rapid decline in
childbearing outside of marriage
Births per 1,000 U.S. women ages 15 to 44, by mother’s
marital status and nativity
Source: Pew Research Center analysis of National Center for Health
Statistics data and American Community Survey data (IPUMS).
“Births outside of marriage decline for immigrant women”
PEW RESEARCH CENTER
94.4
99.4
41.3 37.4
115.1
104.0
90.0
60.4
2008 2014
U.S. born married
Foreign born married
U.S. born unmarried
Foreign born unmarried
19
PEW RESEARCH CENTER
www.pewresearch.org
3. Foreign-born moms have a different demographic profile
than U.S.-born moms, and among the foreign born there are
sharp differences tied to region of birth
The differences between foreign-born new mothers and U.S.-born new mothers extend well
beyond marital status. In addition to being older than their U.S.-born counterparts, foreign-born
mothers have relatively low levels of educational attainment and labor force participation, which
may contribute to their lower annual family incomes, and higher rates of poverty. In recent years,
while the share of U.S.-born and foreign-born new moms who are Hispanic has converged
somewhat, foreign-born new moms are still more than three times as likely to be Hispanic as are
U.S.-born new moms (53% vs. 15%).
And among foreign-born new mothers, there are significant demographic differences depending
on the region of the world where they were born. Those born in Latin America have a very distinct
profile: They are younger, less educated, and less well-off financially than their counterparts from
most other regions of the world. At the same time, new mothers from Latin America have lived in
the U.S. longer, on average, than other foreign-born new mothers. In contrast, the small share of
immigrant new mothers who hail from other parts of North America are about six times as likely
as those from Latin America to have a bachelor’s degree, and they are around twice as likely to
have recently immigrated to the U.S. Annual median family incomes among new immigrant
mothers from North America (most of whom are from Canada) are about three times those of new
moms from Latin America.
20
PEW RESEARCH CENTER
www.pewresearch.org
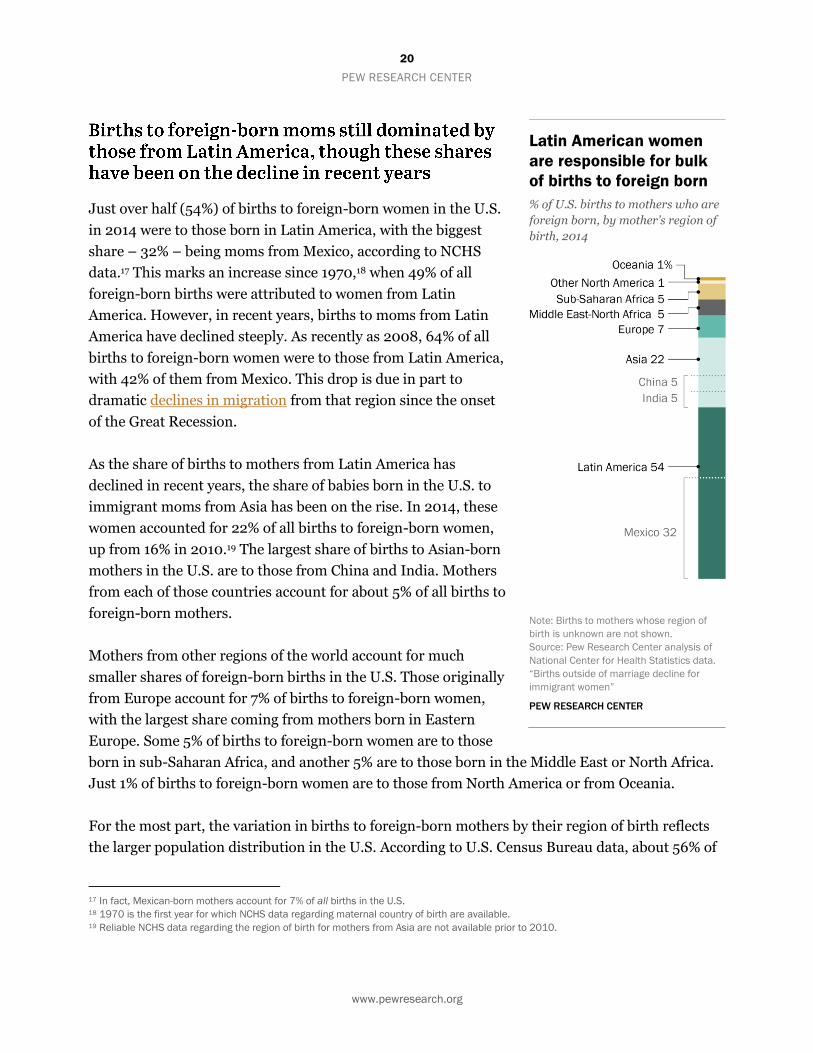
Just over half (54%) of births to foreign-born women in the U.S.
in 2014 were to those born in Latin America, with the biggest
share – 32% – being moms from Mexico, according to NCHS
data.17 This marks an increase since 1970,18 when 49% of all
foreign-born births were attributed to women from Latin
America. However, in recent years, births to moms from Latin
America have declined steeply. As recently as 2008, 64% of all
births to foreign-born women were to those from Latin America,
with 42% of them from Mexico. This drop is due in part to
dramatic declines in migration from that region since the onset
of the Great Recession.
As the share of births to mothers from Latin America has
declined in recent years, the share of babies born in the U.S. to
immigrant moms from Asia has been on the rise. In 2014, these
women accounted for 22% of all births to foreign-born women,
up from 16% in 2010.19 The largest share of births to Asian-born
mothers in the U.S. are to those from China and India. Mothers
from each of those countries account for about 5% of all births to
foreign-born mothers.
Mothers from other regions of the world account for much
smaller shares of foreign-born births in the U.S. Those originally
from Europe account for 7% of births to foreign-born women,
with the largest share coming from mothers born in Eastern
Europe. Some 5% of births to foreign-born women are to those
born in sub-Saharan Africa, and another 5% are to those born in the Middle East or North Africa.
Just 1% of births to foreign-born women are to those from North America or from Oceania.
For the most part, the variation in births to foreign-born mothers by their region of birth reflects
the larger population distribution in the U.S. According to U.S. Census Bureau data, about 56% of
17 In fact, Mexican-born mothers account for 7% of all births in the U.S. 18 1970 is the first year for which NCHS data regarding maternal country of birth are available. 19 Reliable NCHS data regarding the region of birth for mothers from Asia are not available prior to 2010.
Latin American women
are responsible for bulk
of births to foreign born
% of U.S. births to mothers who are
foreign born, by mother’s region of
birth, 2014
Note: Births to mothers whose region of
birth is unknown are not shown.
Source: Pew Research Center analysis of
National Center for Health Statistics data.
“Births outside of marriage decline for
immigrant women”
PEW RESEARCH CENTER
21
PEW RESEARCH CENTER
www.pewresearch.org
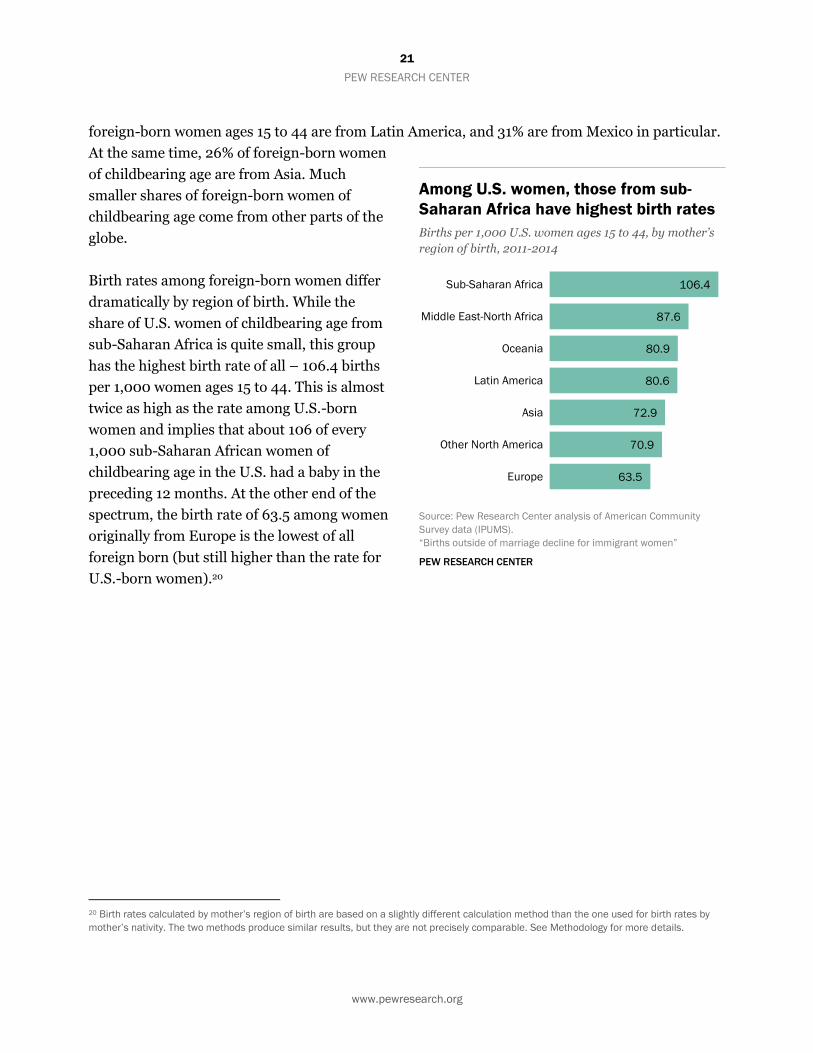
foreign-born women ages 15 to 44 are from Latin America, and 31% are from Mexico in particular.
At the same time, 26% of foreign-born women
of childbearing age are from Asia. Much
smaller shares of foreign-born women of
childbearing age come from other parts of the
globe.
Birth rates among foreign-born women differ
dramatically by region of birth. While the
share of U.S. women of childbearing age from
sub-Saharan Africa is quite small, this group
has the highest birth rate of all – 106.4 births
per 1,000 women ages 15 to 44. This is almost
twice as high as the rate among U.S.-born
women and implies that about 106 of every
1,000 sub-Saharan African women of
childbearing age in the U.S. had a baby in the
preceding 12 months. At the other end of the
spectrum, the birth rate of 63.5 among women
originally from Europe is the lowest of all
foreign born (but still higher than the rate for
U.S.-born women).20
20 Birth rates calculated by mother’s region of birth are based on a slightly different calculation method than the one used for birth rates by
mother’s nativity. The two methods produce similar results, but they are not precisely comparable. See Methodology for more details.
Among U.S. women, those from sub-
Saharan Africa have highest birth rates
Births per 1,000 U.S. women ages 15 to 44, by mother’s
region of birth, 2011-2014
Source: Pew Research Center analysis of American Community
Survey data (IPUMS).
“Births outside of marriage decline for immigrant women”
PEW RESEARCH CENTER
106.4
87.6
80.9
80.6
72.9
70.9
63.5
Sub-Saharan Africa
Middle East-North Africa
Oceania
Latin America
Asia
Other North America
Europe
22
PEW RESEARCH CENTER
www.pewresearch.org
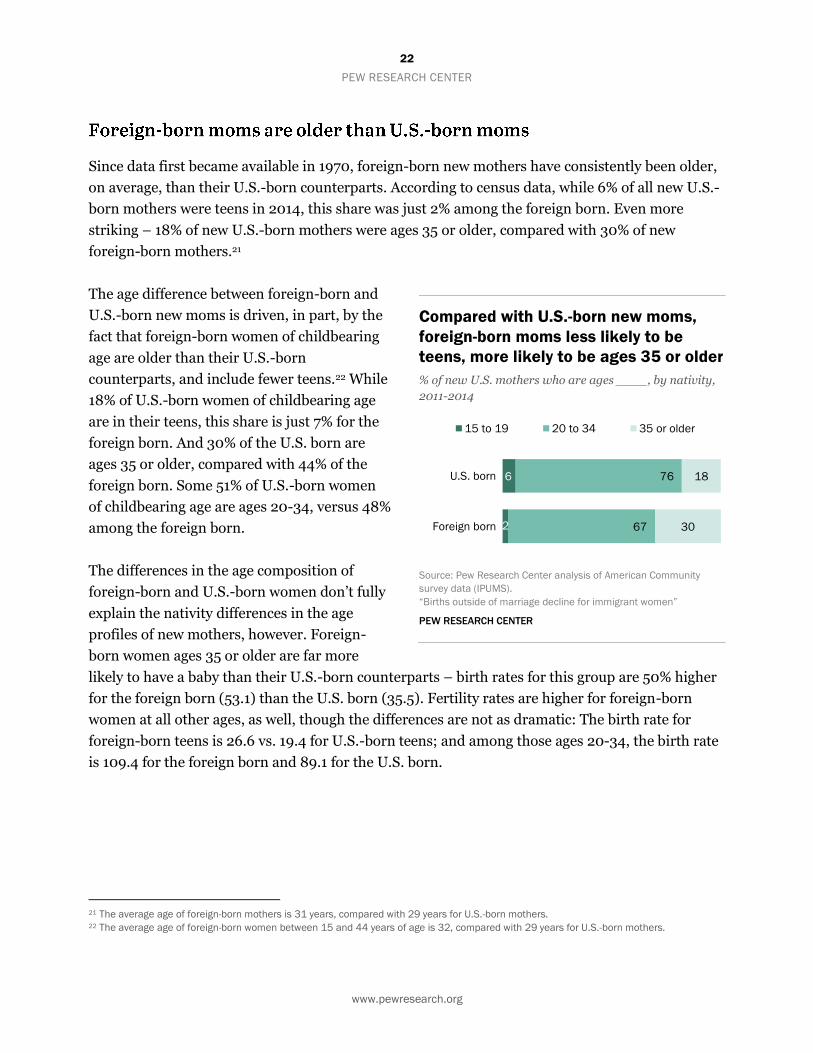
Since data first became available in 1970, foreign-born new mothers have consistently been older,
on average, than their U.S.-born counterparts. According to census data, while 6% of all new U.S.-
born mothers were teens in 2014, this share was just 2% among the foreign born. Even more
striking – 18% of new U.S.-born mothers were ages 35 or older, compared with 30% of new
foreign-born mothers.21
The age difference between foreign-born and
U.S.-born new moms is driven, in part, by the
fact that foreign-born women of childbearing
age are older than their U.S.-born
counterparts, and include fewer teens.22 While
18% of U.S.-born women of childbearing age
are in their teens, this share is just 7% for the
foreign born. And 30% of the U.S. born are
ages 35 or older, compared with 44% of the
foreign born. Some 51% of U.S.-born women
of childbearing age are ages 20-34, versus 48%
among the foreign born.
The differences in the age composition of
foreign-born and U.S.-born women don’t fully
explain the nativity differences in the age
profiles of new mothers, however. Foreign-
born women ages 35 or older are far more
likely to have a baby than their U.S.-born counterparts – birth rates for this group are 50% higher
for the foreign born (53.1) than the U.S. born (35.5). Fertility rates are higher for foreign-born
women at all other ages, as well, though the differences are not as dramatic: The birth rate for
foreign-born teens is 26.6 vs. 19.4 for U.S.-born teens; and among those ages 20-34, the birth rate
is 109.4 for the foreign born and 89.1 for the U.S. born.
21 The average age of foreign-born mothers is 31 years, compared with 29 years for U.S.-born mothers. 22 The average age of foreign-born women between 15 and 44 years of age is 32, compared with 29 years for U.S.-born mothers.
Compared with U.S.-born new moms,
foreign-born moms less likely to be
teens, more likely to be ages 35 or older
% of new U.S. mothers who are ages ____, by nativity,
2011-2014
Source: Pew Research Center analysis of American Community
survey data (IPUMS).
“Births outside of marriage decline for immigrant women”
PEW RESEARCH CENTER
6
2
76
67
18
30
U.S. born
Foreign born
15 to 19 20 to 34 35 or older

23
PEW RESEARCH CENTER
www.pewresearch.org
Among all foreign-born new mothers, those
from Latin America are the most likely to be
teens – about 4% are. This is slightly lower
than the 6% share among U.S.-born mothers.
Some 2% of new mothers from sub-Saharan
Africa are teens, while the share is 1% or less
for mothers from other regions of the world.
At the same time, new mothers from North
America are the most likely to be 35 or older –
fully 41% are. Some 37% of new mothers from
Europe fall into this category. Older mothers
are far less common among new immigrant
moms from Oceania – just one-in-five (21%)
are ages 35 or older. Among new mothers from
Latin America, this share is just 27%.
New foreign-born moms from North
America, Europe twice as likely as new
U.S.-born moms to be ages 35 or older
% of new U.S. mothers who are ages 35 or older, by
nativity and region of birth, 2011-2014
Source: Pew Research Center analysis of American Community
Survey data (IPUMS).
“Births outside of marriage decline for immigrant women”
PEW RESEARCH CENTER
41
37
35
34
33
30
27
21
18
Other North America
Europe
Asia
Sub-Saharan Africa
Middle East-North Africa
All foreign born
Latin America
Oceania
U.S. born
24
PEW RESEARCH CENTER
www.pewresearch.org
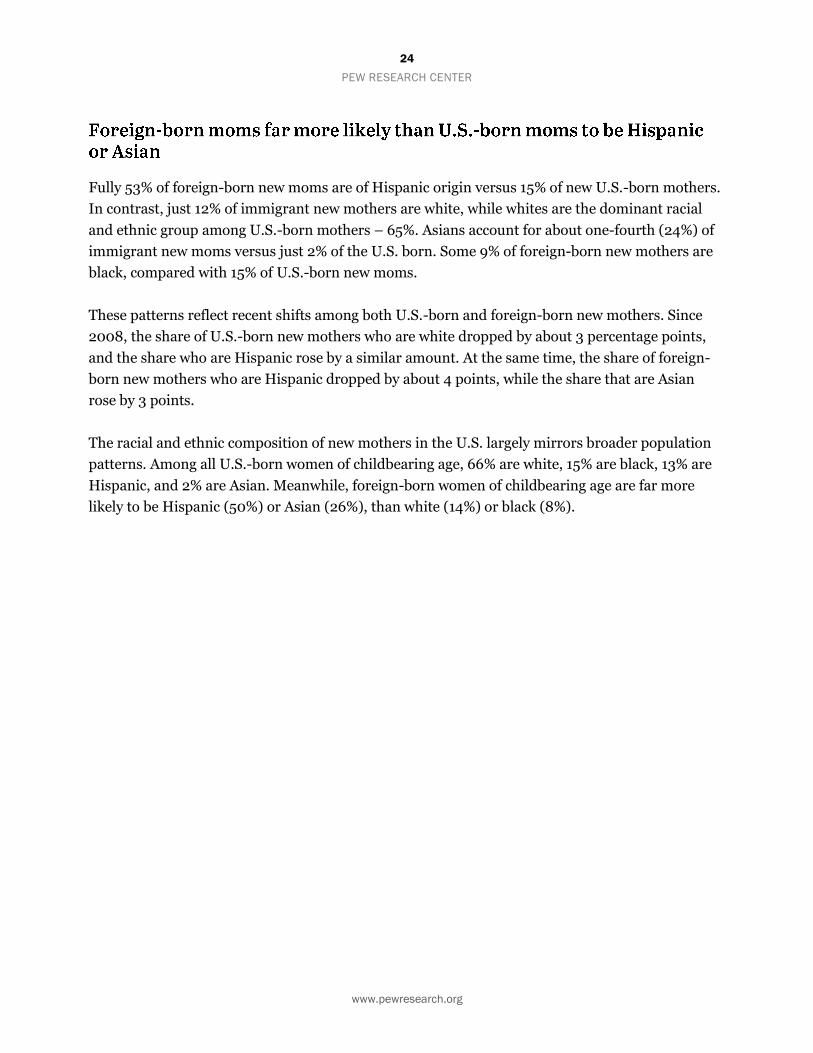
Fully 53% of foreign-born new moms are of Hispanic origin versus 15% of new U.S.-born mothers.
In contrast, just 12% of immigrant new mothers are white, while whites are the dominant racial
and ethnic group among U.S.-born mothers – 65%. Asians account for about one-fourth (24%) of
immigrant new moms versus just 2% of the U.S. born. Some 9% of foreign-born new mothers are
black, compared with 15% of U.S.-born new moms.
These patterns reflect recent shifts among both U.S.-born and foreign-born new mothers. Since
2008, the share of U.S.-born new mothers who are white dropped by about 3 percentage points,
and the share who are Hispanic rose by a similar amount. At the same time, the share of foreign-
born new mothers who are Hispanic dropped by about 4 points, while the share that are Asian
rose by 3 points.
The racial and ethnic composition of new mothers in the U.S. largely mirrors broader population
patterns. Among all U.S.-born women of childbearing age, 66% are white, 15% are black, 13% are
Hispanic, and 2% are Asian. Meanwhile, foreign-born women of childbearing age are far more
likely to be Hispanic (50%) or Asian (26%), than white (14%) or black (8%).
25
PEW RESEARCH CENTER
www.pewresearch.org
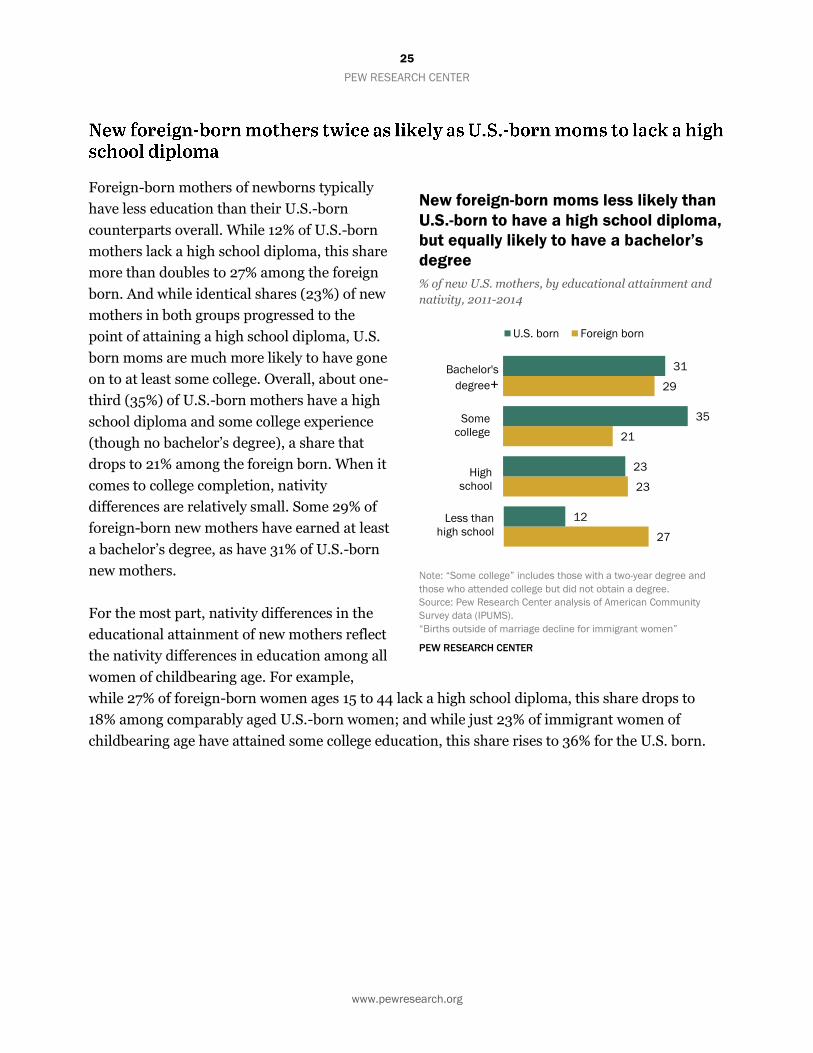
Foreign-born mothers of newborns typically
have less education than their U.S.-born
counterparts overall. While 12% of U.S.-born
mothers lack a high school diploma, this share
more than doubles to 27% among the foreign
born. And while identical shares (23%) of new
mothers in both groups progressed to the
point of attaining a high school diploma, U.S.
born moms are much more likely to have gone
on to at least some college. Overall, about one-
third (35%) of U.S.-born mothers have a high
school diploma and some college experience
(though no bachelor’s degree), a share that
drops to 21% among the foreign born. When it
comes to college completion, nativity
differences are relatively small. Some 29% of
foreign-born new mothers have earned at least
a bachelor’s degree, as have 31% of U.S.-born
new mothers.
For the most part, nativity differences in the
educational attainment of new mothers reflect
the nativity differences in education among all
women of childbearing age. For example,
while 27% of foreign-born women ages 15 to 44 lack a high school diploma, this share drops to
18% among comparably aged U.S.-born women; and while just 23% of immigrant women of
childbearing age have attained some college education, this share rises to 36% for the U.S. born.
New foreign-born moms less likely than
U.S.-born to have a high school diploma,
but equally likely to have a bachelor’s
degree
% of new U.S. mothers, by educational attainment and
nativity, 2011-2014
Note: “Some college” includes those with a two-year degree and
those who attended college but did not obtain a degree.
Source: Pew Research Center analysis of American Community
Survey data (IPUMS).
“Births outside of marriage decline for immigrant women”
PEW RESEARCH CENTER
27
23
21
29
12
23
35
31
U.S. born Foreign born
Bachelor's
degree+
Less than
high school
Some
college
High
school

26
PEW RESEARCH CENTER
www.pewresearch.org
New mothers originally from
Latin America have the
lowest level of educational
attainment of all immigrant
moms. They are by far the
most likely to lack a high
school diploma (40%), while
at the other end of the
spectrum just 11% have a
bachelor’s degree.
Conversely, the majority of
new mothers originally from
North America (63%), Asia
(60%) and Europe (52%)
have at least a bachelor’s
degree, and about 10% or less
lack a high school diploma.
Among new mothers from
the Middle East and North
Africa, almost half (47%)
have a bachelor’s degree, and
13% lack a high school
diploma.
Educational attainment among new foreign-born
moms differs widely by region of birth
% of new foreign-born U.S. mothers, by educational attainment and region of
birth, 2011-2014
Note: Categories with 2% or less are shown but not labeled. Values may not add to 100%
due to rounding. “Some college” includes those with a two-year degree and those who
attended college but did not obtain a degree.
Source: Pew Research Center analysis of American Community Survey data (IPUMS).
“Births outside of marriage decline for immigrant women”
PEW RESEARCH CENTER
9
5
13
18
16
40
10
13
15
18
23
33
29
25
18
28
23
32
32
20
63
60
52
47
27
19
11
Other North America
Asia
Europe
Middle East-North Africa
Sub-Saharan Africa
Oceania
Latin America
Less than high school High school Some college Bachelor's degree+

27
PEW RESEARCH CENTER
www.pewresearch.org
At all levels of educational attainment, birth
rates are higher for immigrants than the U.S.
born, and this difference is particularly
pronounced among women who lack a high
school diploma. While the birth rate for U.S.-
born women who don’t have a diploma is 40.0
births per 1,000 women ages 15 to 44, among
comparable immigrant women, the rate
virtually doubles to 79.1 births per 1,000.
Among U.S.-born women, those with the least
education have by far the lowest fertility levels,
but this pattern does not hold for immigrants.
The birth rate of the least educated immigrant
women is about equal to that of foreign-born
women with a bachelor’s degree (79.6) and is
higher than the rate for immigrant women
with some college experience (69.8).
Among the less educated, birth rate
almost twice as high for foreign born as
for U.S. born
Births per 1,000 U.S. women ages 15 to 44, by mother’s
educational attainment and nativity, 2011-2014
Note: “Some college” includes those with a two-year degree and
those who attended college but did not obtain a degree.
Source: Pew Research Center analysis of American Community
Survey data (IPUMS).
“Births outside of marriage decline for immigrant women”
PEW RESEARCH CENTER
40.0
67.5
58.5
69.8
79.1 85.0
69.8
79.6
Less than
high school
High school Some college Bachelor's
degree+
U.S. born Foreign born

28
PEW RESEARCH CENTER
www.pewresearch.org
Foreign-born mothers of newborns are far more likely to have low family incomes and to be living
in poverty than their U.S.-born counterparts. This may relate, in part, to the fact that foreign-born
new mothers are less likely to be employed than their U.S.-born counterparts. There are striking
differences in financial well-being among foreign-born new mothers. For example, those from
Latin America are more than four times as likely to be living in poverty as those from North
America.
Foreign-born new moms less likely to be employed, more likely to be out of the labor force
than U.S.-born moms
Fully 56% of U.S.-born women who gave birth in the preceding 12 months have a job, versus 44%
of comparable foreign-born mothers. Most of the difference in these numbers is driven by the
likelihood of being in the labor market. Fully
half (50%) of new foreign-born mothers report
that they are out of the labor market –
meaning they are neither working nor seeking
employment – versus 35% of their U.S.-born
counterparts.23
New mothers from the Middle East and North
Africa are the least likely to be employed – just
32% are. Among new mothers from Latin
America, the employment rate is 39%, and it is
44% for those originally from Oceania. At least
half of mothers from Asia (51%), Europe
(54%), North America (55%) and sub-Saharan
Africa (56%) report that they are employed.
As with the nativity differences, much of the variation in employment by region of birth is driven
by differences in labor force participation. However, there are some variations in unemployment
by mother’s region of birth. It rises to 10% for those from Oceania, 9% for those from sub-Saharan
23 Given that this analysis is based on women who gave birth in the preceding 12 months, these numbers should be reviewed somewhat
cautiously. Some new mothers may still be employed even if they are on maternity leave, while others may be outside of the labor force for
just a short period around the time of their birth, for instance. It’s also worth noting that some immigrants may be out of the labor force
because they are unable to work legally in the U.S.
Half of new foreign-born moms are out
of the labor force
% of new U.S. mothers, by employment status and
nativity, 2011-2014
Source: Pew Research Center analysis of American Community
Survey data (IPUMS).
“Births outside of marriage decline for immigrant women”
PEW RESEARCH CENTER
56
44
9
6
35
50
U.S. born
Foreign born
Employed Unemployed Not in labor force
29
PEW RESEARCH CENTER
www.pewresearch.org
$30,000
35,600
41,270
52,000
50,000
51,200
77,900
73,200
89,000
Annual median family income
Africa, and 7% for those from Latin America, while it’s about 5% or lower among mothers from
other regions.
Annual incomes of new foreign-born moms from North America three times those of moms
from Latin America
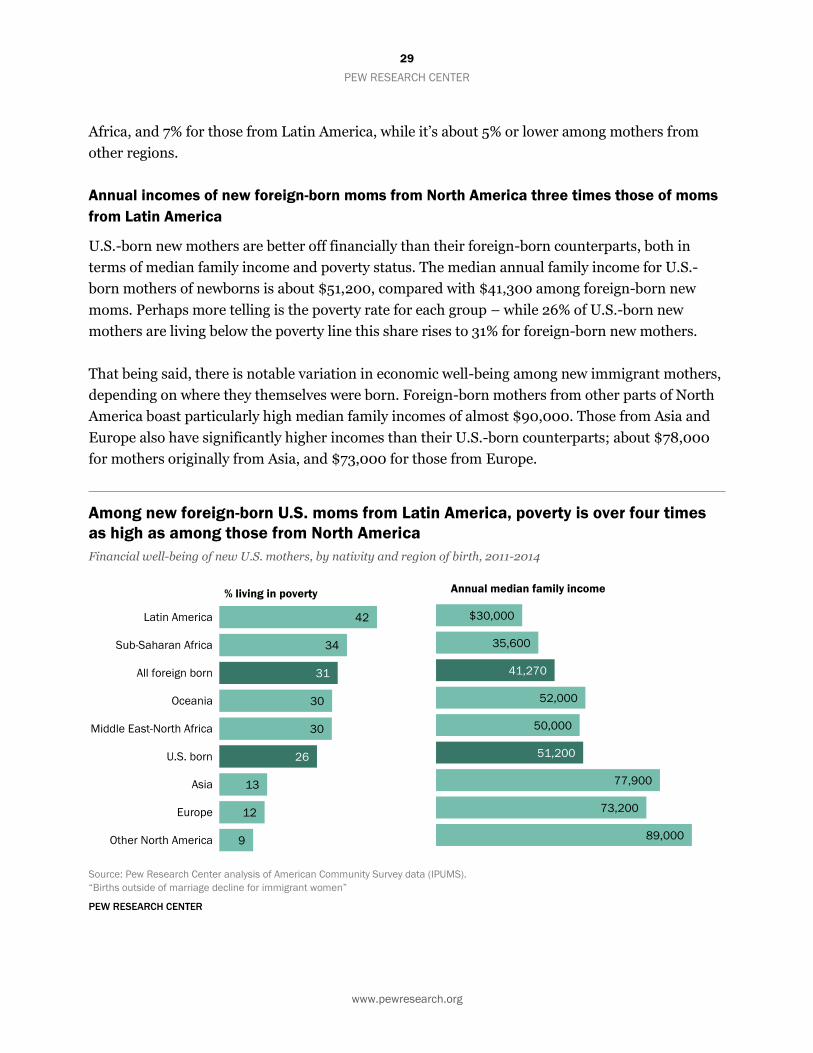
U.S.-born new mothers are better off financially than their foreign-born counterparts, both in
terms of median family income and poverty status. The median annual family income for U.S.-
born mothers of newborns is about $51,200, compared with $41,300 among foreign-born new
moms. Perhaps more telling is the poverty rate for each group – while 26% of U.S.-born new
mothers are living below the poverty line this share rises to 31% for foreign-born new mothers.
That being said, there is notable variation in economic well-being among new immigrant mothers,
depending on where they themselves were born. Foreign-born mothers from other parts of North
America boast particularly high median family incomes of almost $90,000. Those from Asia and
Europe also have significantly higher incomes than their U.S.-born counterparts; about $78,000
for mothers originally from Asia, and $73,000 for those from Europe.
Among new foreign-born U.S. moms from Latin America, poverty is over four times
as high as among those from North America
Financial well-being of new U.S. mothers, by nativity and region of birth, 2011-2014
Source: Pew Research Center analysis of American Community Survey data (IPUMS).
“Births outside of marriage decline for immigrant women”
PEW RESEARCH CENTER
42
34
31
30
30
26
13
12
9
Latin America
Sub-Saharan Africa
All foreign born
Oceania
Middle East-North Africa
U.S. born
Asia
Europe
Other North America
% living in poverty

30
PEW RESEARCH CENTER
www.pewresearch.org
However, new mothers from sub-Saharan Africa have annual incomes of about $36,000, and
those from Latin America have annual incomes of about $30,000 – about one-third of the
incomes of their foreign-born counterparts from North America.
An analysis of poverty among new mothers reveals a similar pattern. Among foreign-born new
mothers, the prevalence of poverty varies dramatically – just 9% of foreign-born new mothers
from North America are living below the poverty line, while new mothers from Latin America and
sub-Saharan Africa are about four times as likely to be living in poverty (42% and 34% are,
respectively).
The vast majority of new foreign-born mothers have lived in the U.S. for many years. About three-
quarters (77%) of these women have been in the U.S. for six
years or more, and fully half (51%) have been in the U.S. for 11
years or more. Some 14% of new foreign-born mothers have been
in the U.S. for three to five years, and 9% immigrated within the
preceding two years.
To some extent, this pattern reflects the characteristics of all
foreign-born women of childbearing age. The majority (60%)
have been in the U.S. for 11 or more years, while a much smaller
share (9%) are recent arrivals within the preceding two years.
Some 10% of foreign-born women of childbearing age have been
in the U.S. for three to five years, as have 20% of those who have
been in the U.S. for six to 10 years.
Fertility rates are particularly high for foreign-born women who
have been in the U.S. for at least three years, but fewer than 11
years.24 Among women ages 15 to 44 who have been in the U.S.
for three to five years, the birth rate is 106.5 births per 1,000,
and among those women who have been in the U.S. for six to 10
years it is 100.1 births per 1,000. The birth rate for women who
were in the U.S. for two years or less is relatively low – 76.2 births per 1,000. Immigrants who
have been in the U.S. for 11 years or more have an even lower birth rate (66.5), which may be due
in part to the fact that these women are less likely than more recent immigrants to be in the prime
24 This jibes with research on Hispanic immigrants that indicates their fertility rates typically peak about five years after arrival.
Most foreign-born moms
are longtime U.S.
residents
% of new foreign-born mothers, by
years in the U.S., 2011-2014
Source: Pew Research Center analysis of
American Community Survey data (IPUMS).
“Births outside of marriage decline for
immigrant women”
PEW RESEARCH CENTER
31
PEW RESEARCH CENTER
www.pewresearch.org
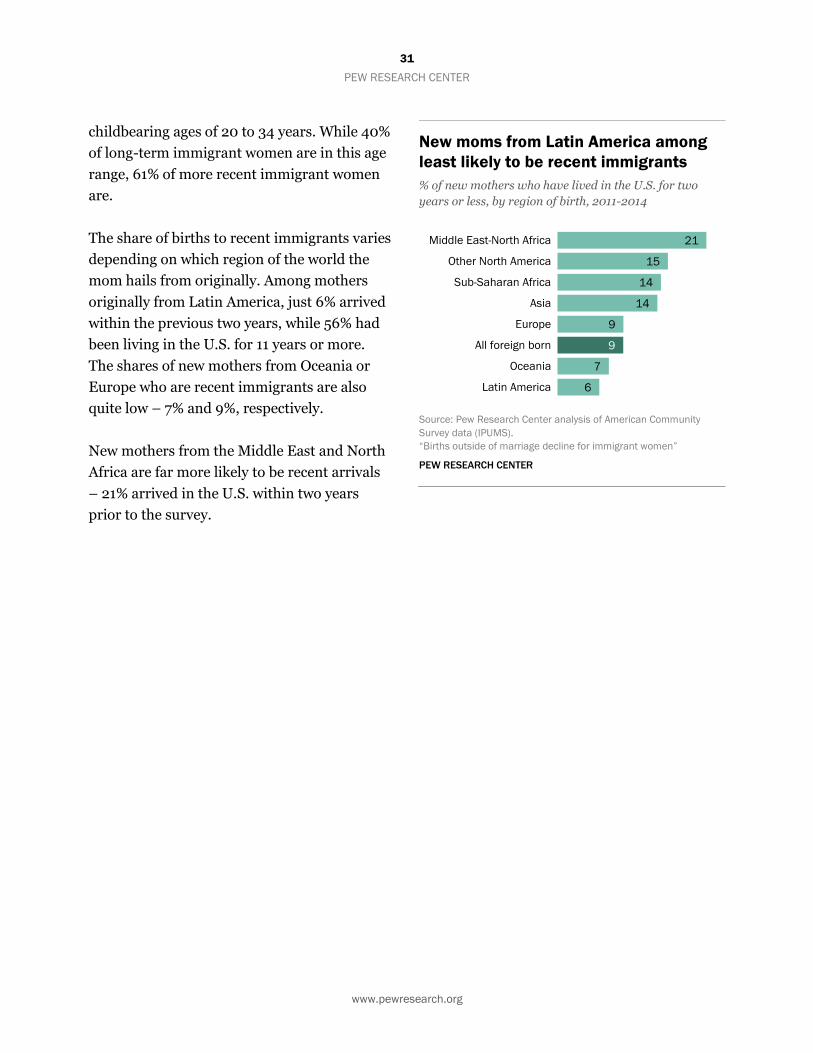
childbearing ages of 20 to 34 years. While 40%
of long-term immigrant women are in this age
range, 61% of more recent immigrant women
are.
The share of births to recent immigrants varies
depending on which region of the world the
mom hails from originally. Among mothers
originally from Latin America, just 6% arrived
within the previous two years, while 56% had
been living in the U.S. for 11 years or more.
The shares of new mothers from Oceania or
Europe who are recent immigrants are also
quite low – 7% and 9%, respectively.
New mothers from the Middle East and North
Africa are far more likely to be recent arrivals
– 21% arrived in the U.S. within two years
prior to the survey.
New moms from Latin America among
least likely to be recent immigrants
% of new mothers who have lived in the U.S. for two
years or less, by region of birth, 2011-2014
Source: Pew Research Center analysis of American Community
Survey data (IPUMS).
“Births outside of marriage decline for immigrant women”
PEW RESEARCH CENTER
21
15
14
14
9
9
7
6
Middle East-North Africa
Other North America
Sub-Saharan Africa
Asia
Europe
All foreign born
Oceania
Latin America

32
PEW RESEARCH CENTER
www.pewresearch.org
Some 70% of new foreign-born mothers either
speak only English in the home or say that
they speak English very well or well. Not
surprisingly, those foreign-born new mothers
who hail from predominantly English-
speaking regions of the world – North America
and Oceania – boast almost universal English
proficiency. Even among new mothers
originally from Europe, more than nine-in-ten
speak English at least well. The share of moms
of newborns who speak English well is
considerably lower for those from Latin
America, though the majority – 59% – report
that they do.
While most foreign-born new mothers are able
to communicate at least well in English, many
of those who cannot are living in what some
researchers term “linguistically isolated”
households in which no person ages 14 or
older speaks English at least “very well,” or
speaks English at home all the time. All told,
30% of foreign-born mothers are living in this
type of arrangement, which is particularly common among moms of newborns from Latin America
(37%). Among new mothers from the Middle East and North Africa, 28% are in linguistically
isolated households, as are 22% of those from Asia and 21% of those from sub-Saharan Africa.
Rates of linguistic isolation are far lower for new moms from other regions – 13% for those from
Europe; 10% for those from Oceania; and 1% for those from the remainder of North America.
Majority of new foreign-born mothers
speak English well
% of new U.S. mothers who say they speak only English
at home or say they speak English “well” or “very well,”
by nativity and region of birth, 2011-2014
Source: Pew Research Center analysis of American Community
Survey data (IPUMS).
“Births outside of marriage decline for immigrant women”
PEW RESEARCH CENTER
100
100
98
93
86
84
78
70
59
U.S. born
Other North America
Oceania
Europe
Sub-Saharan Africa
Asia
Middle East-North Africa
All foreign born
Latin America

33
PEW RESEARCH CENTER
www.pewresearch.org
4. Among foreign-born new moms from top sending
locations, big differences in demographic characteristics
While the profile of new mothers varies by the region of the world in which they were born, even
more dramatic differences emerge when comparing mothers from the top 10 countries,25 all of
which are located in Latin America and Asia. Generally, new mothers from the top Asian countries
are more likely to be married, highly educated and well-off financially than their counterparts
from Latin America – for instance, marriage is
virtually universal among new mothers from
India, while fewer than half of those from the
Dominican Republic or Puerto Rico are
married. That being said, there are differences
among new mothers from countries within the
same region. Among new mothers from Asia,
for example, those from India are more than
twice as likely as those from Vietnam to have a
bachelor’s degree.
Women hailing from just nine countries and
one U.S. territory, all of which are located in
Latin America and Asia, accounted for more
than half (58%) of all births to immigrant
mothers in the U.S. in 2014.
Mexico remains by far the dominant country of
birth for new foreign-born mothers; about a
third (32%) of all babies born to foreign-born
mothers are to those who were born in
Mexico.26 To put that in perspective, the
287,000 births to Mexican-born women in
2014 outnumbered all births to women from Asia, Europe, North America and Oceania combined.
China and India are the next most common origin countries – babies with mothers from these
25 Nine of these places are countries, and Puerto Rico is a U.S. territory. See Terminology for more details. 26 And in fact, 7% of all U.S. births are to women who were born in Mexico.
Births to moms from top 10 locations
account for most births to foreign-born
new moms
Number of U.S. births to foreign-born mothers, by
mother’s birthplace, 2014
*Puerto Rico is a U.S. territory. Women born in Puerto Rico are U.S.
citizens, but are classified as “foreign born” in this report. See
Terminology for more details.
Source: Pew Research Center analysis of National Center for Health
Statistics data.
“Births outside of marriage decline for immigrant women”
PEW RESEARCH CENTER
34
PEW RESEARCH CENTER
www.pewresearch.org
countries each account for 5% of births to the
foreign born. Babies born to mothers
originally from El Salvador, Guatemala and
the Philippines account for 3% each; and those
from Honduras, Vietnam, the Dominican
Republic and Puerto Rico each account for
about 2% of births to foreign-born mothers.
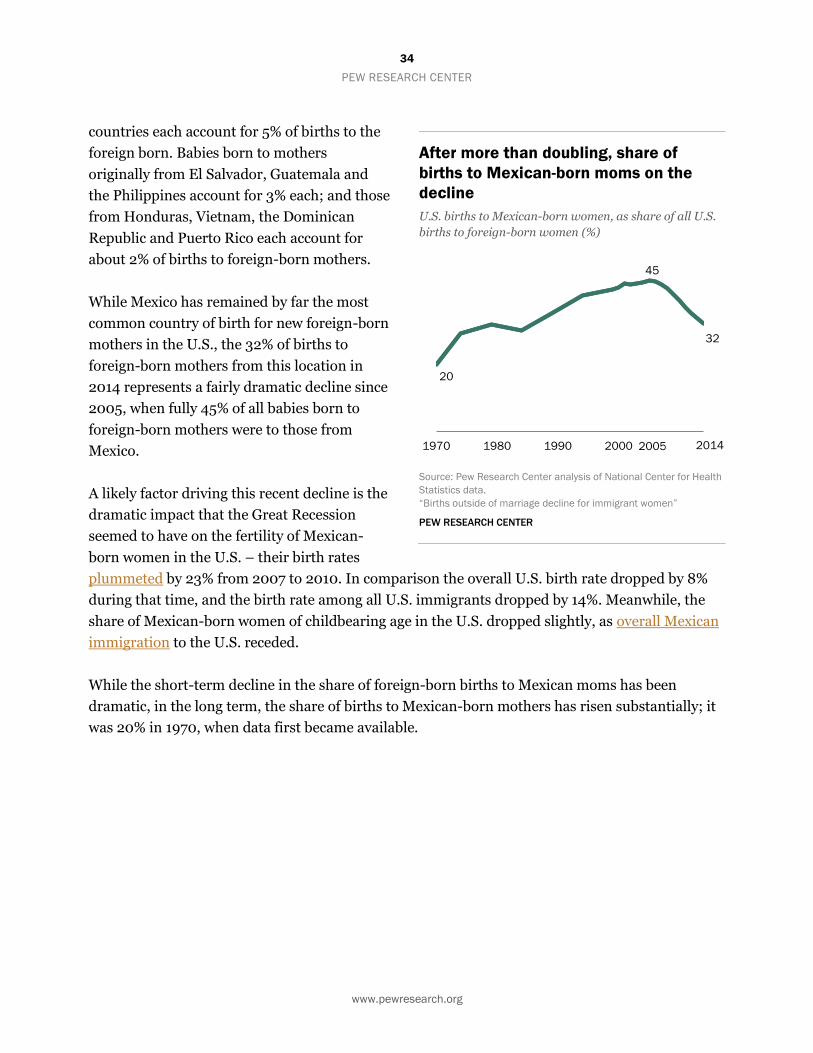
While Mexico has remained by far the most
common country of birth for new foreign-born
mothers in the U.S., the 32% of births to
foreign-born mothers from this location in
2014 represents a fairly dramatic decline since
2005, when fully 45% of all babies born to
foreign-born mothers were to those from
Mexico.
A likely factor driving this recent decline is the
dramatic impact that the Great Recession
seemed to have on the fertility of Mexican-
born women in the U.S. – their birth rates
plummeted by 23% from 2007 to 2010. In comparison the overall U.S. birth rate dropped by 8%
during that time, and the birth rate among all U.S. immigrants dropped by 14%. Meanwhile, the
share of Mexican-born women of childbearing age in the U.S. dropped slightly, as overall Mexican
immigration to the U.S. receded.
While the short-term decline in the share of foreign-born births to Mexican moms has been
dramatic, in the long term, the share of births to Mexican-born mothers has risen substantially; it
was 20% in 1970, when data first became available.
After more than doubling, share of
births to Mexican-born moms on the
decline
U.S. births to Mexican-born women, as share of all U.S.
births to foreign-born women (%)
Source: Pew Research Center analysis of National Center for Health
Statistics data.
“Births outside of marriage decline for immigrant women”
PEW RESEARCH CENTER
20
45
32
1970 1980 1990 2000 20102005 2014
35
PEW RESEARCH CENTER
www.pewresearch.org
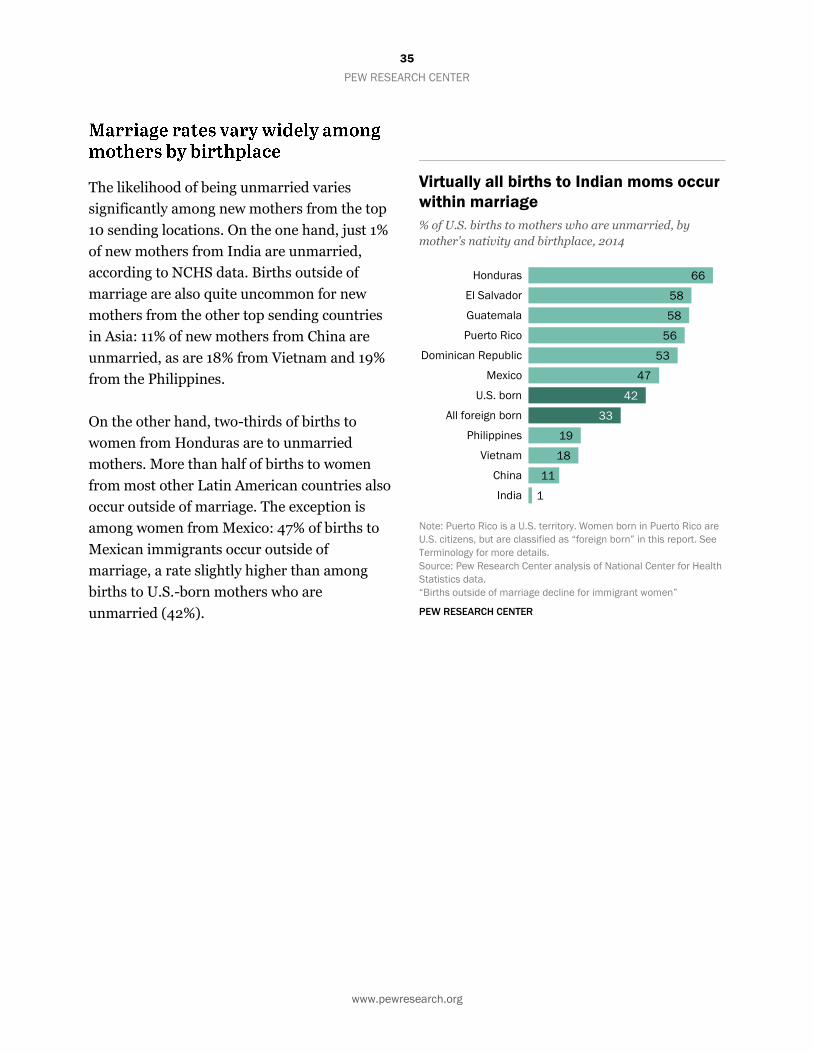
The likelihood of being unmarried varies
significantly among new mothers from the top
10 sending locations. On the one hand, just 1%
of new mothers from India are unmarried,
according to NCHS data. Births outside of
marriage are also quite uncommon for new
mothers from the other top sending countries
in Asia: 11% of new mothers from China are
unmarried, as are 18% from Vietnam and 19%
from the Philippines.
On the other hand, two-thirds of births to
women from Honduras are to unmarried
mothers. More than half of births to women
from most other Latin American countries also
occur outside of marriage. The exception is
among women from Mexico: 47% of births to
Mexican immigrants occur outside of
marriage, a rate slightly higher than among
births to U.S.-born mothers who are
unmarried (42%).
Virtually all births to Indian moms occur
within marriage
% of U.S. births to mothers who are unmarried, by
mother’s nativity and birthplace, 2014
Note: Puerto Rico is a U.S. territory. Women born in Puerto Rico are
U.S. citizens, but are classified as “foreign born” in this report. See
Terminology for more details.
Source: Pew Research Center analysis of National Center for Health
Statistics data.
“Births outside of marriage decline for immigrant women”
PEW RESEARCH CENTER
66
58
58
56
53
47
42
33
19
18
11
1
Honduras
El Salvador
Guatemala
Puerto Rico
Dominican Republic
Mexico
U.S. born
All foreign born
Philippines
Vietnam
China
India
36
PEW RESEARCH CENTER
www.pewresearch.org
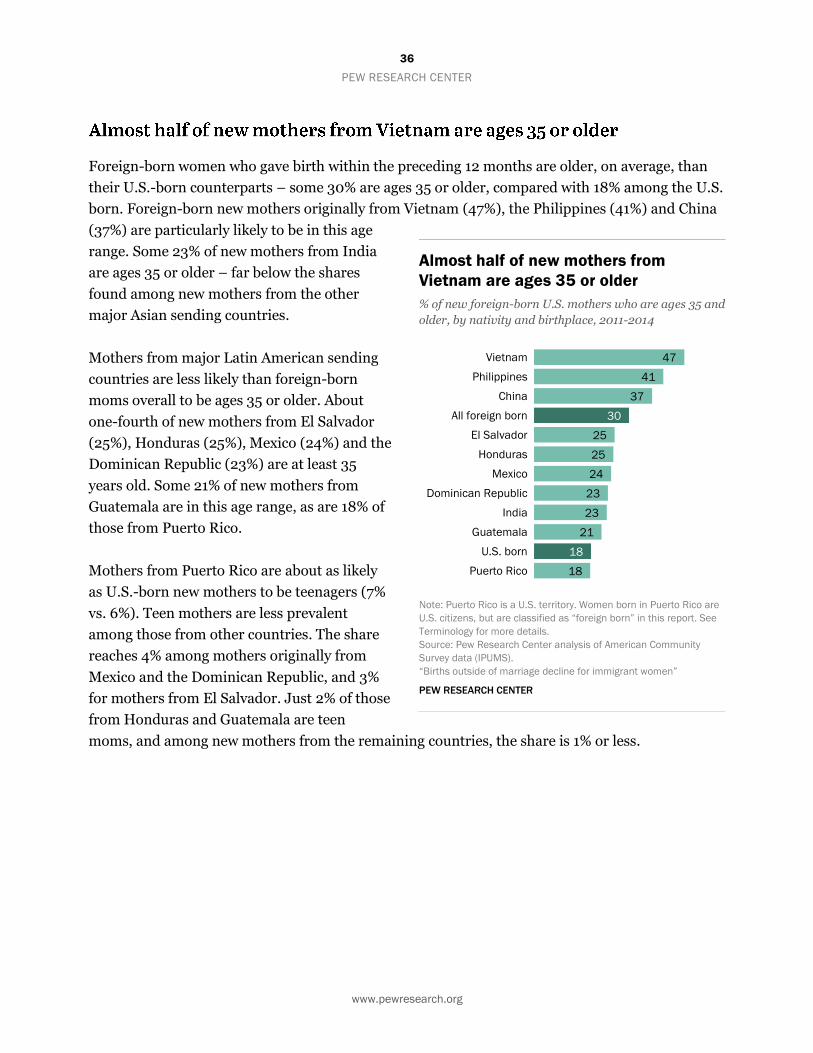
Foreign-born women who gave birth within the preceding 12 months are older, on average, than
their U.S.-born counterparts – some 30% are ages 35 or older, compared with 18% among the U.S.
born. Foreign-born new mothers originally from Vietnam (47%), the Philippines (41%) and China
(37%) are particularly likely to be in this age
range. Some 23% of new mothers from India
are ages 35 or older – far below the shares
found among new mothers from the other
major Asian sending countries.
Mothers from major Latin American sending
countries are less likely than foreign-born
moms overall to be ages 35 or older. About
one-fourth of new mothers from El Salvador
(25%), Honduras (25%), Mexico (24%) and the
Dominican Republic (23%) are at least 35
years old. Some 21% of new mothers from
Guatemala are in this age range, as are 18% of
those from Puerto Rico.
Mothers from Puerto Rico are about as likely
as U.S.-born new mothers to be teenagers (7%
vs. 6%). Teen mothers are less prevalent
among those from other countries. The share
reaches 4% among mothers originally from
Mexico and the Dominican Republic, and 3%
for mothers from El Salvador. Just 2% of those
from Honduras and Guatemala are teen
moms, and among new mothers from the remaining countries, the share is 1% or less.
Almost half of new mothers from
Vietnam are ages 35 or older
% of new foreign-born U.S. mothers who are ages 35 and
older, by nativity and birthplace, 2011-2014
Note: Puerto Rico is a U.S. territory. Women born in Puerto Rico are
U.S. citizens, but are classified as “foreign born” in this report. See
Terminology for more details.
Source: Pew Research Center analysis of American Community
Survey data (IPUMS).
“Births outside of marriage decline for immigrant women”
PEW RESEARCH CENTER
47
41
37
30
25
25
24
23
23
21
18
18
Vietnam
Philippines
China
All foreign born
El Salvador
Honduras
Mexico
Dominican Republic
India
Guatemala
U.S. born
Puerto Rico
37
PEW RESEARCH CENTER
www.pewresearch.org
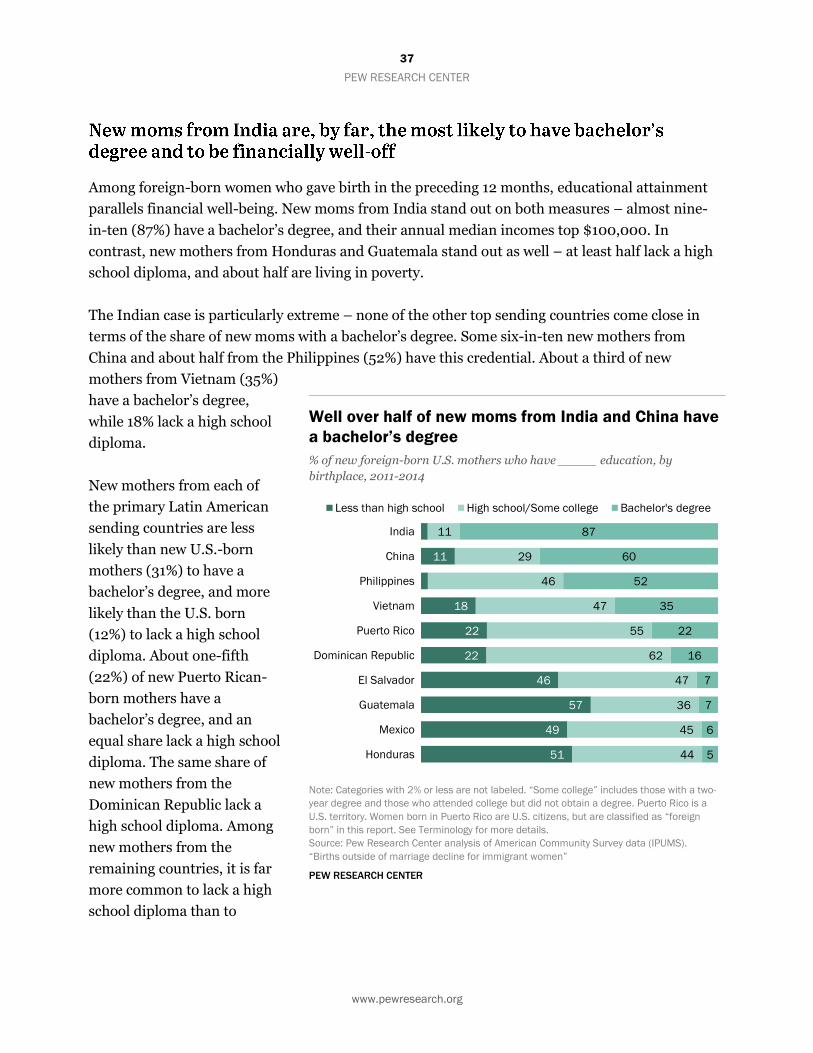
Among foreign-born women who gave birth in the preceding 12 months, educational attainment
parallels financial well-being. New moms from India stand out on both measures – almost nine-
in-ten (87%) have a bachelor’s degree, and their annual median incomes top $100,000. In
contrast, new mothers from Honduras and Guatemala stand out as well – at least half lack a high
school diploma, and about half are living in poverty.
The Indian case is particularly extreme – none of the other top sending countries come close in
terms of the share of new moms with a bachelor’s degree. Some six-in-ten new mothers from
China and about half from the Philippines (52%) have this credential. About a third of new
mothers from Vietnam (35%)
have a bachelor’s degree,
while 18% lack a high school
diploma.
New mothers from each of
the primary Latin American
sending countries are less
likely than new U.S.-born
mothers (31%) to have a
bachelor’s degree, and more
likely than the U.S. born
(12%) to lack a high school
diploma. About one-fifth
(22%) of new Puerto Rican-
born mothers have a
bachelor’s degree, and an
equal share lack a high school
diploma. The same share of
new mothers from the
Dominican Republic lack a
high school diploma. Among
new mothers from the
remaining countries, it is far
more common to lack a high
school diploma than to
Well over half of new moms from India and China have
a bachelor’s degree
% of new foreign-born U.S. mothers who have _____ education, by
birthplace, 2011-2014
Note: Categories with 2% or less are not labeled. “Some college” includes those with a two-
year degree and those who attended college but did not obtain a degree. Puerto Rico is a
U.S. territory. Women born in Puerto Rico are U.S. citizens, but are classified as “foreign
born” in this report. See Terminology for more details.
Source: Pew Research Center analysis of American Community Survey data (IPUMS).
“Births outside of marriage decline for immigrant women”
PEW RESEARCH CENTER
11
18
22
22
46
57
49
51
11
29
46
47
55
62
47
36
45
44
87
60
52
35
22
16
7
7
6
5
India
China
Philippines
Vietnam
Puerto Rico
Dominican Republic
El Salvador
Guatemala
Mexico
Honduras
Less than high school High school/Some college Bachelor's degree

38
PEW RESEARCH CENTER
www.pewresearch.org
possess a bachelor’s degree.
In terms of financial well-being, Indian-born new mothers have annual median family incomes
more than twice as high ($104,500) as new U.S.-born mothers ($51,200). At the other end of the
financial spectrum, just 4% of Indian-born new mothers are in poverty, compared with 26% of
U.S.-born mothers.
New mothers from the Philippines, Vietnam and China are also relatively well-off. Those from the
Philippines have annual incomes of about $75,000, those from Vietnam have incomes of about
$70,000, and those from China have incomes of about $67,000. Poverty rates for new mothers
from these countries range from 9% to 14%.
Among new U.S. moms from Honduras, poverty is 12 times as high as that of new
U.S. moms from India
Financial well-being of new U.S. mothers, by nativity and birthplace, 2011-2014
Note: Puerto Rico is a U.S. territory. Women born in Puerto Rico are U.S. citizens, but are classified as “foreign born” in this report. See
Terminology for more details.
Source: Pew Research Center analysis of American Community Survey data (IPUMS).
“Births outside of marriage decline for immigrant women”
PEW RESEARCH CENTER
49
48
48
42
37
36
31
26
14
14
9
4
Honduras
Guatemala
Mexico
Puerto Rico
El Salvador
Dominican Republic
All foreign born
U.S. born
Vietnam
China
Philippines
India
% living in poverty
104,500
75,000
67,000
69,600
51,200
41,270
33,500
32,600
26,700
27,500
26,000
$24,000
Annual median family income
39
PEW RESEARCH CENTER
www.pewresearch.org
New mothers from the remaining countries, all located in Latin America, are less well-off than new
U.S.-born mothers and new foreign-born mothers overall. Those from the Dominican Republic
have incomes of about $33,500 a year, and those from El Salvador have incomes of about
$32,600. Some 36% of those from the Dominican Republic are living in poverty, as are 37% of
those from El Salvador. Incomes dip below $30,000 among new mothers from the remaining
locations, and poverty is relatively high. Some 42% of new moms from Puerto Rico are living in
poverty, while about half of those from Mexico (48%), Guatemala (48%) and Honduras (49%) are.
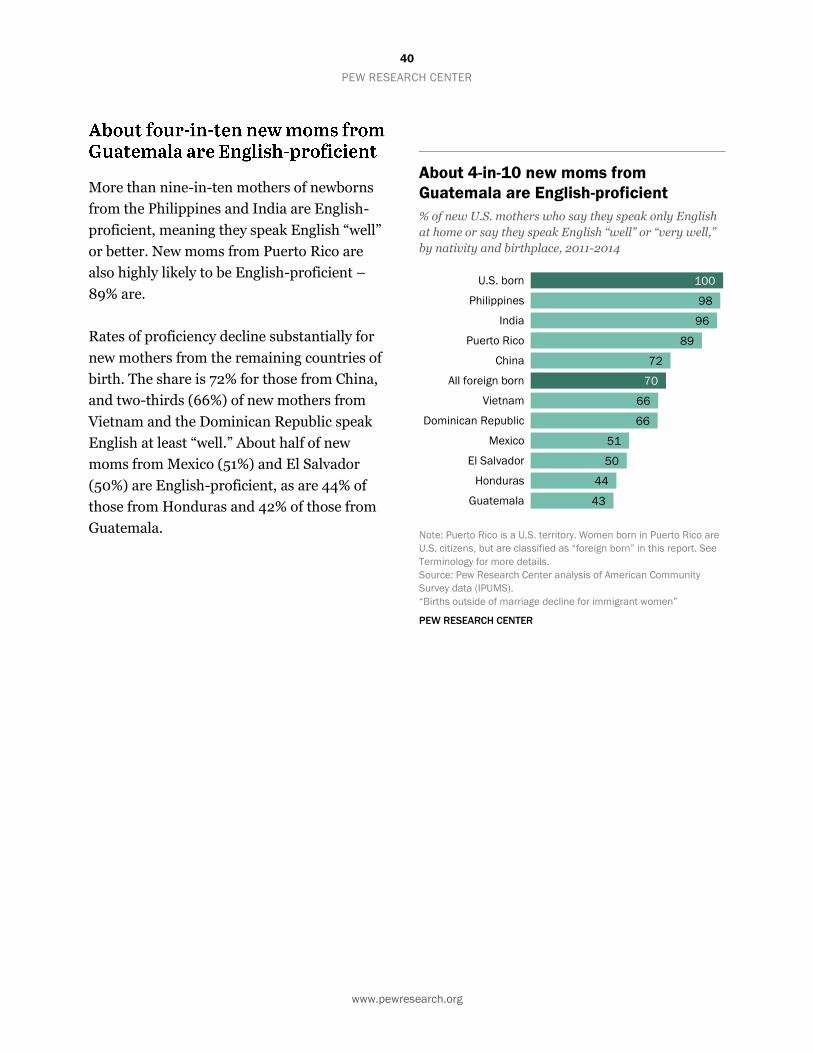
40
PEW RESEARCH CENTER
www.pewresearch.org
More than nine-in-ten mothers of newborns
from the Philippines and India are English-
proficient, meaning they speak English “well”
or better. New moms from Puerto Rico are
also highly likely to be English-proficient –
89% are.
Rates of proficiency decline substantially for
new mothers from the remaining countries of
birth. The share is 72% for those from China,
and two-thirds (66%) of new mothers from
Vietnam and the Dominican Republic speak
English at least “well.” About half of new
moms from Mexico (51%) and El Salvador
(50%) are English-proficient, as are 44% of
those from Honduras and 42% of those from
Guatemala.
About 4-in-10 new moms from
Guatemala are English-proficient
% of new U.S. mothers who say they speak only English
at home or say they speak English “well” or “very well,”
by nativity and birthplace, 2011-2014
Note: Puerto Rico is a U.S. territory. Women born in Puerto Rico are
U.S. citizens, but are classified as “foreign born” in this report. See
Terminology for more details.
Source: Pew Research Center analysis of American Community
Survey data (IPUMS).
“Births outside of marriage decline for immigrant women”
PEW RESEARCH CENTER
100
98
96
89
72
70
66
66
51
50
44
43
U.S. born
Philippines
India
Puerto Rico
China
All foreign born
Vietnam
Dominican Republic
Mexico
El Salvador
Honduras
Guatemala
41
PEW RESEARCH CENTER
www.pewresearch.org
Acknowledgments
This report is a collaborative effort based on the contributions and analysis of the following
individuals:
Gretchen Livingston, Senior Researcher
Kim Parker, Director, Social Trends Research
Claudia Deane, Vice President of Research
D’Vera Cohn, Senior Writer
Anna Brown, Research Analyst
Molly Rohal, Communications Manager
Michael Keegan, Information Graphics Designer
Shannon Greenwood, Associate Digital Producer
Marcia Kramer, Kramer Editing Services
Find related reports online at pewresearch.org/socialtrends.

42
PEW RESEARCH CENTER
www.pewresearch.org
Methodology
Analyses in this report are primarily based on two sources: vital statistics data regarding births in
the U.S., available from the National Center for Health Statistics (NCHS), and data regarding
women ages 15 to 49 who gave birth in the U.S. in the preceding 12 months, available from the
U.S. Census Bureau’s American Community Survey (ACS). Data from the decennial census and the
American Community Survey are also used to estimate characteristics of all women of childbearing
age.
The NCHS data regarding mother’s nativity extend back to 1970 and reflect information extracted
from completed birth certificates for live births, which include the mother’s characteristics at the
time of the birth. The bulk of these tabulations are based on all births occurring in the 50 states
and the District of Columbia within a calendar year. The exception is for rate calculations, which
use NCHS data only for births to women who report that they are residents of the U.S. It is
necessary to add this constraint to rate calculations, so that the NCHS data will more closely match
up with the ACS and census data used for the denominator.27
Most of the NCHS data used in the report is available at:
http://www.cdc.gov/nchs/data_access/vitalstatsonline.htm. The report also used restricted NCHS
data files. Details on obtaining those restricted data are available at:
http://www.cdc.gov/nchs/nvss/dvs_data_release.htm.
The ACS, which is an annual, nationally representative survey, began collecting data on the entire
residential population of the U.S. in 2006. It includes a question identifying women who gave
birth in the preceding 12 months, which is used to identify new mothers for this analysis. Most
ACS-based analyses in this report use a file that combines 2011, 2012, 2013 and 2014 data, in
order to produce sample sizes big enough to allow for analyses by nativity and location of birth for
foreign-born recent mothers. However, ACS-based analyses focusing on change over time use
single-year files.
While analyses suggest that the ACS and NCHS produce generally similar results in terms of
mother’s nativity and marital status, there are some additional differences between the two data
sources worth noting:
27 In 2014, some 0.25% of all births recorded in the NCHS data were to women who said they were not U.S. residents.

43
PEW RESEARCH CENTER
www.pewresearch.org
While the NCHS data are based on mother’s characteristics at the time of the birth, the
ACS data are based on the mother’s characteristics at the time of the survey, which could
be up to 12 months after the birth.
The ACS asks about births since the same month in the prior year – for instance, someone
completing the survey in August 2015 would be asked if she had given birth at any time
during the period August 2014 through August 2015. As a result, ACS fertility results are
based on slightly more than 12 months of data, while the NCHS is reporting on exactly 12
months of data.
Information regarding the composition of the female population of childbearing age (15 to 44) is
derived from the decennial census for 1970, 1980, 1990 and 2000, and from the American
Community Survey for all subsequent years.
All ACS and decennial census data were obtained from IPUMS-USA, University of Minnesota,
ipums.org.
In analyses based on the NCHS, the ACS and the decennial census, individuals who were born in
U.S. territories, including Puerto Rico, are classified as “foreign born.” While individuals born in
Puerto Rico and other U.S. territories are U.S. citizens by birth, the convention of categorizing
persons living in the U.S. who were born in U.S. territories as foreign-born has been used by both
the United Nations and by NCHS in its online VitalStats data tabulator.
The measure of birth rate used in this report is the general fertility rate (GFR), which is the
number of births divided by the number of women of childbearing age in a given year. For all birth
rate measurements in this report, the denominator includes a count of women ages 15 to 44,
derived from the decennial census and ACS.28 For birth rates based on marital status, the small
share of women who are classified as “separated” in census and American Community Survey data
are grouped with unmarried mothers.29 The birth rate numerators vary somewhat: overall rates by
nativity and rates by nativity and marital status use NCHS data regarding births to resident
women in a given year.30 NCHS data are necessary for these trend analyses, since they are the only
source of birth data that extends back several decades. The numerators for other rates are
28 In 2014, 99.7% of births were to females ages 15 to 44. 29 Some 2% of new mothers in the 2014 American Community Survey were separated when they were surveyed. 30 These rate calculations may differ somewhat from those in NCHS publications, because NCHS typically uses a denominator based on
census population estimates, as opposed to one based on decennial census or ACS data.
44
PEW RESEARCH CENTER
www.pewresearch.org
calculated based on all women ages 15 to 49 who had a birth in the prior year, according to ACS
data.
Mexico is included in the Latin America region. China includes Macau, but not Taiwan or Hong
Kong. In the 2014 National Center for Health Statistics data, mother’s country of birth could not
be determined in 5% of the cases.
Region definitions
Other North America Middle East-North Africa Asia
Canada United Arab Emirates Bhutan
Bermuda Bahrain Sri Lanka
Greenland Cyprus India
Iran Afghanistan
Latin America Israel Maldives
Mexico Iraq Turkmenistan
Central America Jordan Pakistan
South America Kuwait Bangladesh
Cuba Lebanon Kyrgyzstan
Dominican Republic Oman Kazakhstan
Haiti Qatar Nepal
Jamaica Saudi Arabia Tajikistan
Puerto Rico Syria Uzbekistan
Bahamas Turkey Philippines
West Indies, other Yemen Indonesia
Caribbean, other Azerbaijan Southeast Asia, other
Armenia East Asia, other
Europe Georgia
Northern Europe Algeria Oceania
United Kingdom & Ireland Egypt Australia
Western Europe Libya New Zealand
Central/Eastern Europe Morocco Guam
Southern Europe Sudan Samoa
Tunisia Papua New Guinea
Western Sahara Pacific islands, other
Sub-Saharan Africa
All African nations except those in North Africa
PEW RESEARCH CENTER