numbers, facts and trends shaping the...
TRANSCRIPT

FOR RELEASE JUNE 23, 2016
FOR MEDIA OR OTHER INQUIRIES:
Alan Cooperman, Director of Religion Research
Peter Henne, Research Associate
Katayoun Kishi, Research Associate
Anna Schiller, Communications Manager
Stefan S. Cornibert, Communications Associate
202.419.4372
www.pewresearch.org
RECOMMENDED CITATION: Pew Research Center, June 23, 2016, “Trends in Global Restrictions on Religion”
NUMBERS, FACTS AND TRENDS SHAPING THE WORLD
1
TRENDS IN GLOBAL RESTRICTIONS ON RELIGION
www.pewresearch.org
About Pew Research Center
Pew Research Center is a nonpartisan fact tank that informs the public about the issues, attitudes
and trends shaping America and the world. It does not take policy positions. The Center conducts
public opinion polling, demographic research, content analysis and other data-driven social
science research. It studies U.S. politics and policy; journalism and media; internet, science and
technology; religion and public life; Hispanic trends; global attitudes and trends; and U.S. social
and demographic trends. All of the Center’s reports are available at www.pewresearch.org. Pew
Research Center is a subsidiary of The Pew Charitable Trusts, its primary funder.
© Pew Research Center 2016
2
PEW RESEARCH CENTER
www.pewresearch.org
Acknowledgments
This report was produced by Pew Research Center as part of the Pew-Templeton Global Religious
Futures project, which analyzes religious change and its impact on societies around the world.
Pew Research Center is a subsidiary of The Pew Charitable Trusts, its primary funder. This report
was made possible by The Pew Charitable Trusts, which received support for the project from the
John Templeton Foundation. This project/publication does not necessarily reflect the views of the
John Templeton Foundation.
This report is a collaborative effort based on the input and analysis of the following individuals:
Primary Researcher
Peter Henne, Research Associate
Research Team
Alan Cooperman, Director of Religion Research Juan Carlos Esparza Ochoa, Data Manager
Katayoun Kishi, Research Associate Dennis R. Quinn, Research Assistant
Claire Gecewicz, Research Assistant Angelina E. Theodorou, Research Analyst
Coders
Kady Arthur, Elizabeth Dean, Brittni Fine, Sarah Kelly, Brandan Martini, Aryeh Mellman,
Piyusha Mittal, Faraz Salahuddin and Andrew Small
Editorial and Graphic Design
Sandra Stencel, Associate Director, Editorial Michael Lipka, Editor
Aleksandra Sandstrom, Copy Editor Bill Webster, Information Graphics Designer
Diana Yoo, Art Director
Communications and Web Publishing
Stacy Rosenberg, Digital Project Manager Travis Mitchell, Digital Producer
Anna Schiller, Communications Manager Stefan S. Cornibert, Communications Associate

3
TRENDS IN GLOBAL RESTRICTIONS ON RELIGION
www.pewresearch.org
Table of Contents
Overview 4
1. Number of countries with very high restrictions and hostilities went down in 2014 13
2. Harassment of specific religious groups: Christians and Muslims were harassed in the most
countries in 2014 20
3. Middle East-North Africa was region with highest restrictions and hostilities in 2014 21
4. Among the world’s 25 most populous countries, the highest overall restrictions on religion in
2014 were in Egypt, Indonesia, Pakistan, Russia and Turkey 27
About this report 29
Methodology 31
Appendix A: Government Restrictions Index 45
Appendix B: Social Hostilities Index 48
Appendix C: Religious restrictions index scores by region 51
Appendix D: Summary of results 58
4
PEW RESEARCH CENTER
www.pewresearch.org
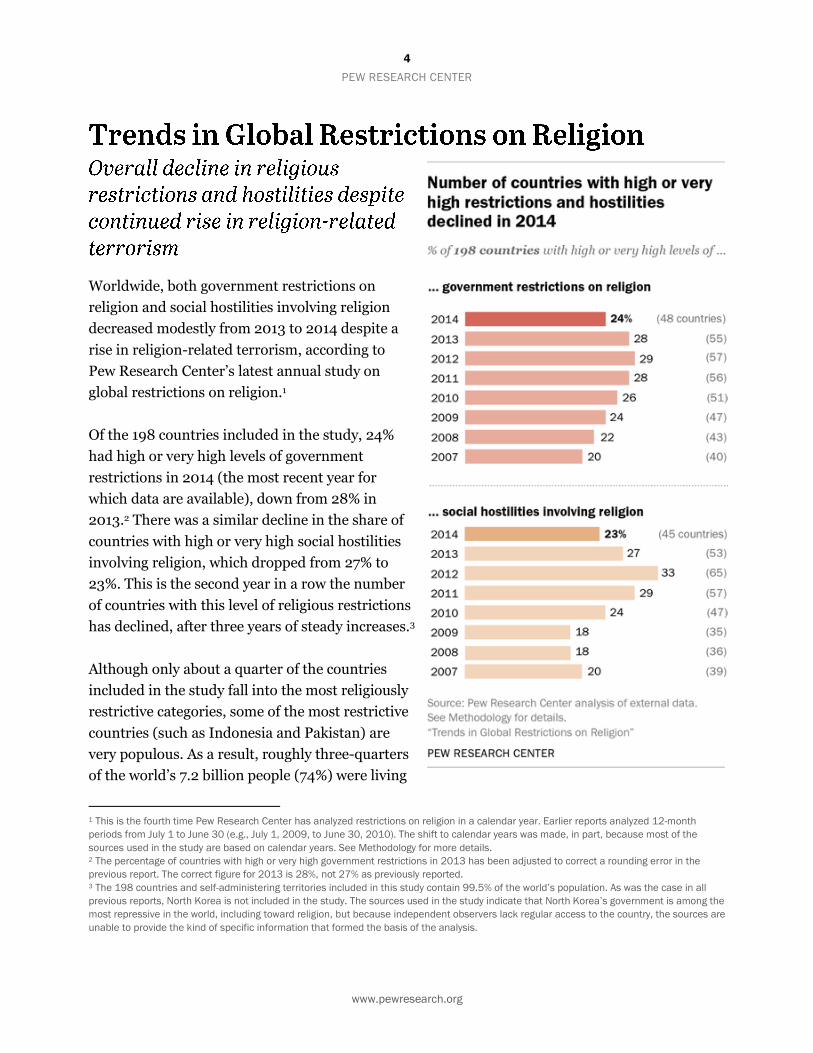
Worldwide, both government restrictions on
religion and social hostilities involving religion
decreased modestly from 2013 to 2014 despite a
rise in religion-related terrorism, according to
Pew Research Center’s latest annual study on
global restrictions on religion.1
Of the 198 countries included in the study, 24%
had high or very high levels of government
restrictions in 2014 (the most recent year for
which data are available), down from 28% in
2013.2 There was a similar decline in the share of
countries with high or very high social hostilities
involving religion, which dropped from 27% to
23%. This is the second year in a row the number
of countries with this level of religious restrictions
has declined, after three years of steady increases.3
Although only about a quarter of the countries
included in the study fall into the most religiously
restrictive categories, some of the most restrictive
countries (such as Indonesia and Pakistan) are
very populous. As a result, roughly three-quarters
of the world’s 7.2 billion people (74%) were living
1 This is the fourth time Pew Research Center has analyzed restrictions on religion in a calendar year. Earlier reports analyzed 12-month
periods from July 1 to June 30 (e.g., July 1, 2009, to June 30, 2010). The shift to calendar years was made, in part, because most of the
sources used in the study are based on calendar years. See Methodology for more details. 2 The percentage of countries with high or very high government restrictions in 2013 has been adjusted to correct a rounding error in the
previous report. The correct figure for 2013 is 28%, not 27% as previously reported. 3 The 198 countries and self-administering territories included in this study contain 99.5% of the world’s population. As was the case in all
previous reports, North Korea is not included in the study. The sources used in the study indicate that North Korea’s government is among the
most repressive in the world, including toward religion, but because independent observers lack regular access to the country, the sources are
unable to provide the kind of specific information that formed the basis of the analysis.

5
TRENDS IN GLOBAL RESTRICTIONS ON RELIGION
www.pewresearch.org
in countries with high or very high restrictions or hostilities in 2014, down slightly from 77% in
2013.
The modest declines in countries with high restrictions or
hostilities took place despite a marked increase in the number
of countries that experienced religion-related terrorist
activities, including acts carried out by such groups as Boko
Haram, al-Qaida and the Islamic State (also known as ISIS or
ISIL). Of the nearly 200 countries and territories included in the
study, 82 (41%) had religion-related terrorist activities in 2014, up
from 73 (37%) in 2013. In some countries, the terrorist activities
were limited to recruitment or fundraising. But in 60 countries,
religion-related terrorism led to injuries or deaths, including at
least 50 casualties in each of 28 countries. Casualties from
religion-related terrorist activities have been rising in recent
years. (See below for more details.)
The increase in the number of countries with religion-related
terrorist activity – which is counted as a social hostility in this
study – was offset by decreases in the number of countries
that experienced other types of social hostilities
involving religion.4 For example, there was a decline in the
number of countries in which individuals were assaulted or
displaced from their homes in retaliation for religious activities
considered offensive or threatening to the majority faith in their
country, state or province. There also was a decline in the number
of countries where threats of violence were used to enforce religious norms and a global decline in
the incidence of mob violence related to religion.
Several factors contributed to the overall decline in government restrictions on religion.
For instance, there was a decrease in the number of countries where some level of the government
– national, provincial or local – interfered with worship practices. There also was a sizable drop in
the number of countries where governments used force against religious groups that resulted in
individuals being killed, physically abused, imprisoned, detained or displaced from their homes.
4 War and terrorism are sufficiently complex that it is not always possible to determine the degree to which they are religiously motivated or
state sponsored. Out of an abundance of caution, this study does not include acts of terrorism as government restrictions on religion. They are
analyzed instead as a social hostility involving religion. See Methodology for more details.

6
PEW RESEARCH CENTER
www.pewresearch.org
Looking at the overall level of restrictions in 2014 – whether resulting from government
policies and actions or from hostile acts by private individuals, organizations or social groups – the
new study finds that restrictions were high or very high in 34% of countries, down from 39% in
2013 and 43% in 2012.
This is the seventh in a series of reports by the Center analyzing the extent to which governments
and societies around the world impinge on religious beliefs and practices. The studies are part of
the Pew-Templeton Global Religious Futures project, which analyzes religious change and its
impact on societies around the world. The project is jointly funded by The Pew Charitable Trusts
and the John Templeton Foundation.
To measure global restrictions on religion in 2014, the study ranks 198 countries and territories by
their levels of government restrictions on religion and social hostilities involving religion. The new
study is based on the same 10-point indexes used in the previous studies.
• The Government Restrictions Index measures government laws, policies and actions that restrict
religious beliefs and practices. The GRI is comprised of 20 measures of restrictions, including
efforts by government to ban particular faiths, prohibit conversion, limit preaching or give
preferential treatment to one or more religious groups.
• The Social Hostilities Index measures acts of religious hostility by private individuals,
organizations or groups in society. This includes religion-related armed conflict or terrorism, mob
or sectarian violence, harassment over attire for religious reasons or other religion-related
intimidation or abuse. The SHI includes 13 measures of social hostilities.
To track these indicators of government restrictions and social hostilities, researchers comb
through more than a dozen publicly available, widely cited sources of information, including the
U.S. State Department’s annual reports on international religious freedom and annual reports
from the U.S. Commission on International Religious Freedom, as well as reports from a variety of
European and U.N. bodies and several independent, nongovernmental organizations. (See
Methodology for more details on the sources used in the study.)

7
TRENDS IN GLOBAL RESTRICTIONS ON RELIGION
www.pewresearch.org
The new study looks at the prevalence of
restrictions and hostilities by region and by
country. The Middle East and North Africa
region continued to have the highest median
level of government restrictions on religion,
although the region’s score on the GRI dropped
slightly from 2013 to 2014. Median scores on the
Government Restrictions Index also decreased
modestly in Asia and the Pacific and in sub-
Saharan Africa; scores stayed about the same in
the Americas and Europe.

8
PEW RESEARCH CENTER
www.pewresearch.org
The Middle East and North Africa continued to
have the highest median level of social hostilities
involving religion, although the region’s median
score on the Social Hostilities Index stayed
roughly the same from 2013 to 2014. The median
level of social hostilities also stayed about the
same in the Americas and in the Asia-Pacific
region. The median level of social hostilities
decreased somewhat in sub-Saharan Africa and
Europe. (See Chapter 3 for more regional
details.)
Among the world’s 25 most populous countries,
the highest overall restrictions on religion were
in Egypt, Indonesia, Pakistan, Russia and
Turkey, where both the government and society
at large imposed numerous limits on religious
beliefs and practices. China had the highest level
of government restrictions in 2014, while
Pakistan had the highest level of social hostilities
involving religion. (See Chapter 4 for more
details.)
As in previous years, Christians and Muslims –
who together make up more than half of the global population – faced harassment in the largest
number of countries. The study also finds that harassment of Jews continued to increase in 2014.
(See Chapter 2 for more details on harassment of specific religious groups.)

9
TRENDS IN GLOBAL RESTRICTIONS ON RELIGION
www.pewresearch.org
Rise in religion-related terrorist activity
Of the 198 countries included in the study, 82 (41%) had religion-related terrorist activities in
2014, up from 73 (37%) in both 2012 and 2013. In 22 of the 82 countries, the terrorist activities
were limited to recruitment or fundraising. But in 60 countries, religion-related terrorism led to
injuries or deaths, up from 51 countries in 2013 and 40 countries in 2012.5
For the purposes of this study, religion-related terrorism includes acts carried out by subnational
groups that use religion as a justification or motivation for their actions, such as the Nigeria-based
Islamist group Boko Haram; al-Qaida in the Islamic Maghreb (AQIM); and the Islamic State, the
militant group also known as ISIS or ISIL. Religion-related terrorism also includes terrorist acts
carried out by individuals or groups with a nonreligious identity that deliberately target religious
groups or individuals, such as clergy. (See Methodology for more details.)
5 The analysis of religion-related terrorism is based on results for one of the 13 questions on the Social Hostilities Index. The question looks at
both the presence and severity of religion-related terrorism in the 198 countries and territories included in the study. Countries are grouped
into the following categories: They had no religion-related terrorism; the terrorist activities were limited to fundraising, recruitment or other
nonviolent actions; the terrorism led to one to nine casualties (injuries or deaths); the terrorism led to 10 to 50 casualties; or the terrorism led
to more than 50 casualties.

10
PEW RESEARCH CENTER
www.pewresearch.org
In 2014, religion-related terrorism went up in all
regions except sub-Saharan Africa, where the
number and share of countries with this type of
religious hostility stayed the same in 2013 and
2014 (17 of 48 countries, or 35%, in both years).
The biggest increase was in Asia and the Pacific,
where the number of countries with religion-
related terrorist activities went from 18 in 2013
(36% of the region’s 50 countries) to 22 (44%) in
2014. The Middle East-North Africa region
continued to have the highest share of countries
with religion-related terrorism; such hostilities
occurred in 18 of the region’s 20 countries in
2014 (90%), up from 17 in 2013 (85%). In
Europe, 18 of the 45 countries (40%) had
religion-related terrorism in 2014, up from 16
(36%) in 2013. Seven of the 35 countries in the
Americas had this type of religious hostility
(20%), up from five countries in 2013 (14%).

11
TRENDS IN GLOBAL RESTRICTIONS ON RELIGION
www.pewresearch.org
Looking at the severity of
religion-related terrorism (as
measured by the number of
injuries or deaths), the biggest
increase from 2013 to 2014 was
in the category with one-to-nine
casualties; the number of
countries in this category rose
from 14 in 2013 to 22 in 2014.
By contrast, there was only one
more country in the second-
highest category (10 to 50
casualties) in 2014 than in 2013.
And the number of countries
with more than 50 injuries or
deaths stayed the same (28 in
each year).
While the number of countries
with more than 50 casualties
remained the same from 2013 to
2014, it has risen dramatically in
recent years. In 2007, the first year for which Pew Research Center has data, only eight countries
had this level of casualties. In 2014, 28 did. Readers should note that some of the increase in
casualties from religion-related terrorism, especially from 2007 to 2009, could reflect the use of
new sources that provide greater detail on terrorist activities than the sources used in the early
years of the study. (See Methodology for more details.) Nevertheless, the number of countries
experiencing more than 50 casualties as a result of religion-related terrorism was significantly
higher in 2014 than it was in earlier years.
For the first time, several of the incidents of religion-related terrorism captured by the study
involved actions reportedly inspired by the Islamic State in regions outside the Middle East and
North Africa (or in the nearby country of Turkey).6 In October 2014, for example, a man stormed
the Canadian Parliament after shooting and killing a soldier who was guarding Canada’s National
War Memorial. According to Ottawa police, the man was planning to travel to Syria after
6 Turkey is included in the Asia-Pacific region in Pew Research Center’s religious restrictions reports.

12
PEW RESEARCH CENTER
www.pewresearch.org
undergoing a “radicalization process.”7 The gunman was shot and killed inside the Parliament
building. A few days earlier, a different man – described by Canadian authorities as “an ISIL-
inspired terrorist” – struck and killed a Canadian soldier with his car in Quebec.8
On Dec. 15, 2014, an Iranian-born Muslim living in Australia took 18 people hostage in a cafe in
Sydney; two of the hostages were killed and several others were wounded when police stormed the
cafe nearly 17 hours later. The man had had numerous run-ins with the police and immigration
officials, but he was not known to have any direct ties to the Islamic State. 9 However, he pledged
allegiance to the “caliph of the Muslims” on his website days before the attack; he displayed a flag
similar to the one used by the Islamic State from the cafe window during the siege; and he was
posthumously embraced by the Islamic State in its English-language propaganda magazine,
Dabiq.10
Religion-related terrorism by the Nigerian-based Islamist group Boko Haram also intensified in
2014. This included the April 2014 kidnapping of more than 200 schoolgirls from the Government
Girls Secondary School in the largely Christian town of Chibok, located in Nigeria’s northern state
of Borno.11 The kidnapping captured media attention around the world and sparked a global social
media campaign under the hashtag #BringBackOurGirls; the campaign was supported by U.S. first
lady Michelle Obama and many other celebrities.12
7 Palmer, Randall, David Ljunggren and Leah Schnurr. Oct. 24, 2014. “Canada Parliament gunman had planned to travel to Syria – police,”
Reuters. Also see National Consortium for the Study of Terrorism and Responses to Terrorism (START). Incident 201410220044. 2014.
Global Terrorism Database. 8 CBC News. Oct. 22, 2014. “Ottawa Shooting: Harper, Mulcair, Trudeau Speak About Attack.” Also see Austen, Ian. Oct. 22, 2014. “Hit-and-
Run That Killed Canadian Soldier is Called Terrorist Attack.” The New York Times. Also see National Consortium for the Study of Terrorism and
Responses to Terrorism (START). Incident 201307010016. 2013. Global Terrorism Database. 9 Australian Government Department of the Prime Minister and Cabinet. January 2015. “Martin Place Siege: Joint Commonwealth – New
South Wales Review.” Also see Doherty, Ben, Bridie Jabour, Brigid Delaney, Calla Wahlquist, Helen Davidson, Michael Safi, Oliver Milman and
Paul Farrell. Dec. 19, 2014. “Sydney siege: how a day and night of terror unfolded at the Lindt cafe.” The Guardian. Also see Tucker, Eric, and
Kristen Gelineau. May 19, 2016. “Sydney Siege Gunman Man Haron Monis Attracted Attention of SBI in 2009.” Sydney Morning Herald. Also
see National Consortium for the Study of Terrorism and Responses to Terrorism (START). Incident 201412150032. 2013. Global Terrorism
Database. 10 Some media reports initially said the banner displayed in the cafe was the flag of the Islamic State, but it was later shown to be a black flag
with white Arabic lettering spelling out the Islamic statement of faith: “There is no God but Allah, and Muhammad is the messenger of God.”
See Safi, Michael. Dec. 29, 2014. “Sydney siege gunman Man Haron Monis praised in ISIS publication.” Also see Doherty, Ben, Bridie Jabour,
Brigid Delaney, Calla Wahlquist, Helen Davidson, Michael Safi, Oliver Milman and Paul Farrell. Dec. 19, 2014. “Sydney siege: how a day and
night of terror unfolded at the Lindt cafe.” The Guardian. 11 See U.S. Department of State. Oct. 14, 2015. “Nigeria.” 2014 Report on International Religious Freedom. For context, also see April 21,
2014. “Chibok abductions in Nigeria: 'More than 230 seized.'” BBC News, and May 5, 2014. “Boko Haram 'to sell' Nigeria girls abducted from
Chibok.” BBC News. 12 See, for example, Taylor, Adam. May 6, 2014. “Is #BringBackOurGirls helping?” The Washington Post. Also see Gibson, Megan. May 7,
2014. “Can A Social Media Campaign Really #BringBackOurGirls?” Time. Also see McKelvey, Tara. April 14, 2016. “Michelle Obama’s
Hashtag Question to Rescue Nigerian Girls.” BBC News.

13
TRENDS IN GLOBAL RESTRICTIONS ON RELIGION
www.pewresearch.org
1. Number of countries with
very high restrictions and
hostilities went down in 2014
Most countries in the world have some form of
government restrictions on religion, but each
year a few countries stand out as having
particularly extensive restrictions.
In 2014, 16 of the 198 countries included in the
study had a “very high” level of government
restrictions, down from 18 countries in 2013.13
Most of the countries in this category – including
China, Egypt, Uzbekistan, Turkey and Indonesia
– already had very high restrictions. However,
four countries – Kazakhstan, Laos, Maldives and
Turkmenistan – had very high government
restrictions in 2014 but not in 2013. Six
countries that had very high government
restrictions in 2013 did not in 2014: Afghanistan,
Burma (Myanmar), Sudan, Brunei, Eritrea and
Singapore.
The number of countries with high government
restrictions went down slightly between 2013
and 2014 (from 37 to 32). By contrast, the
number of countries with moderate restrictions
went up, from 45 to 57. Meanwhile, 93 countries (47%) had low levels of government restrictions
in 2014, slightly less than in 2013 (98 countries, or 49%). For a complete list of all countries in
each category, see the Government Restrictions Index table in Appendix A.14
13 Countries with a “very high” level of government restrictions had positive scores on at least 13 of the 20 questions that make up the
Government Restrictions Index. 14 To see index-score thresholds for the very high, high, moderate and low categories, see Methodology.

14
PEW RESEARCH CENTER
www.pewresearch.org
As is the case with government restrictions,
some countries stand out for having very
extensive social hostilities involving religion.
The number of countries and territories with a
“very high” level of social hostilities involving
religion fell from 17 in 2013 to 11 in 2014.15 Many
of the countries and territories in this category –
including India, Israel, Pakistan, the Palestinian
territories and Nigeria – already had very high
social hostilities. Two countries – Lebanon and
Yemen – had very high social hostilities in 2014
but not in 2013. Eight countries that had very
high social hostilities in 2013 did not in 2014:
Bangladesh, Central African Republic, Egypt,
Indonesia, Kenya, Russia, Somalia and Tanzania.
The number of countries with a high level of
social hostilities fell from 36 (18%) in 2013 to 34
(17%) in 2014. The number of countries with a
moderate level of social hostilities stayed the
same (55). Meanwhile, 98 countries (49%) had
low levels of social hostilities in 2014, compared
with 90 countries (45%) in 2013. For a complete
list of all countries in each category, see the
Social Hostilities Index table in Appendix B.16
15 Countries with “very high” social hostilities had positive scores on at least nine of the 13 questions that make up the Social Hostilities
Index. 16 To see index-score thresholds for the very high, high, moderate and low categories, see Methodology.

15
TRENDS IN GLOBAL RESTRICTIONS ON RELIGION
www.pewresearch.org
Each year, some countries experience
significant changes in their scores on the
Government Restrictions Index without
necessarily rising into – or falling out of –
the “very high restrictions” category.
Looking only at countries with very high
government restrictions would overlook
these important dynamics. For this
reason, Pew Research Center analyzes
changes in government restrictions
among all countries – not just those with
a very high level of government
restrictions – in order to provide greater
insight into the nature of government
restrictions on religion around the world.
Just one country – Angola – had a large
change (2.0 points or more) on the
Government Restrictions Index in 2014,
and it was in the direction of lower restrictions. There was more government intervention in cases
of discrimination or abuse against religious groups and less government violence toward minority
religious groups.
Among the 26 countries with modest changes in their GRI scores (1.0 to 1.9 points), six had
increases and 20 had decreases. Kazakhstan and the Czech Republic were among the six countries
with modest increases; among other things, both countries experienced an increase in government
regulation of religious dress.17 In western Kazakhstan, a court held that a preschool was within its
rights when it prohibited a young girl from wearing a head-covering hijab because it violated the
school’s dress code. The girl’s parents later removed her from the school.18 In the Czech Republic,
women were banned from wearing hijabs in some circumstances. For instance, a school of nursing
in Prague banned women from wearing headscarves in class. At least two women left the school as
a result of the ban. One of them later filed a complaint with the Ministry of Education, whose
17 The six countries that had increases of 1.0 to 1.9 points were: the Czech Republic, Equatorial Guinea, Guinea, Kazakhstan, Mexico and
Uganda. 18 See U.S. Department of State. Oct. 14, 2015. “Kazakhstan.” 2014 Report on International Religious Freedom.
16
PEW RESEARCH CENTER
www.pewresearch.org
ombudsman termed the ban discriminatory. The school did not abandon the policy, however, and,
as recently as 2016, at least one lawsuit related to the ban was ongoing.19
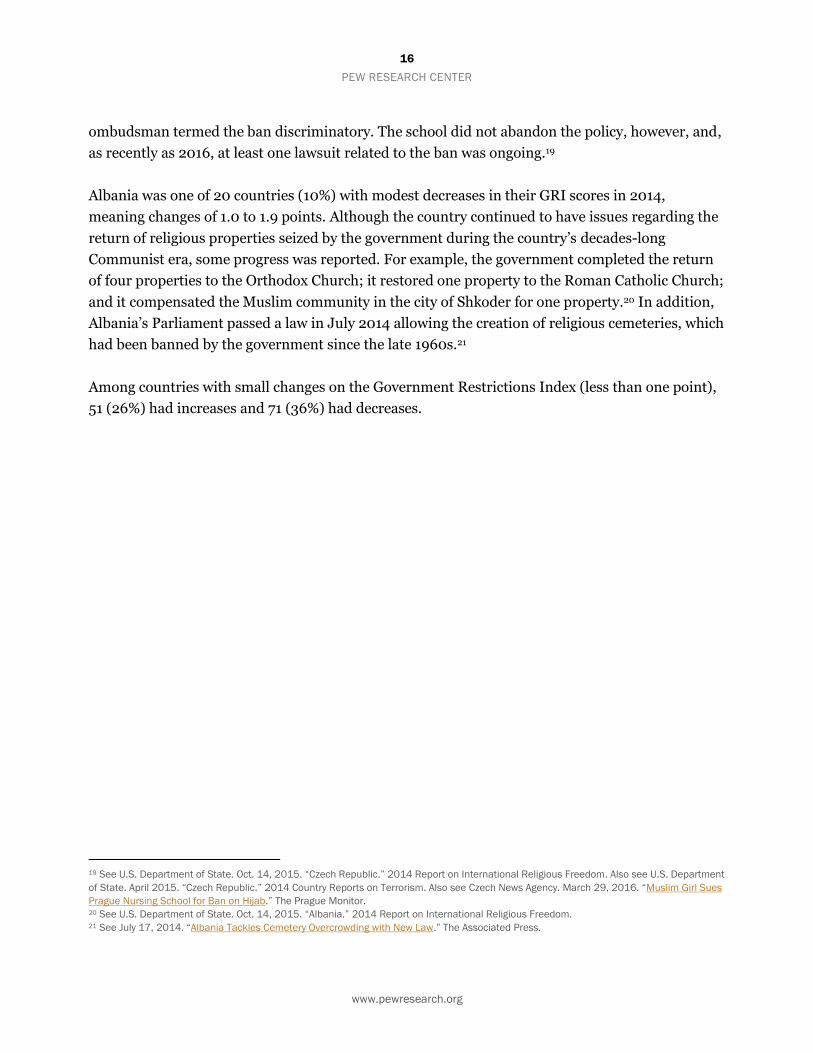
Albania was one of 20 countries (10%) with modest decreases in their GRI scores in 2014,
meaning changes of 1.0 to 1.9 points. Although the country continued to have issues regarding the
return of religious properties seized by the government during the country’s decades-long
Communist era, some progress was reported. For example, the government completed the return
of four properties to the Orthodox Church; it restored one property to the Roman Catholic Church;
and it compensated the Muslim community in the city of Shkoder for one property.20 In addition,
Albania’s Parliament passed a law in July 2014 allowing the creation of religious cemeteries, which
had been banned by the government since the late 1960s.21
Among countries with small changes on the Government Restrictions Index (less than one point),
51 (26%) had increases and 71 (36%) had decreases.
19 See U.S. Department of State. Oct. 14, 2015. “Czech Republic.” 2014 Report on International Religious Freedom. Also see U.S. Department
of State. April 2015. “Czech Republic.” 2014 Country Reports on Terrorism. Also see Czech News Agency. March 29, 2016. “Muslim Girl Sues
Prague Nursing School for Ban on Hijab.” The Prague Monitor. 20 See U.S. Department of State. Oct. 14, 2015. “Albania.” 2014 Report on International Religious Freedom. 21 See July 17, 2014. “Albania Tackles Cemetery Overcrowding with New Law.” The Associated Press.

17
TRENDS IN GLOBAL RESTRICTIONS ON RELIGION
www.pewresearch.org
Some countries may experience
significant changes in their scores on the
Social Hostilities Index irrespective of
whether they have “very high” levels of
social hostilities. This section looks at the
extent and direction of those changes
from 2013 to 2014.
Among the seven countries with large
changes (2.o points or more) in their
scores on the 10-point Social Hostilities
Index between 2013 and 2014, three had
increases and four had decreases. The
three countries with large increases were
Jordan, Malaysia and the United States.22
In Jordan, tensions over religious
conversions sometimes led to violent
clashes. In May 2014, for example, a man
from the northern city of Ajloun confessed to killing his daughter after she converted from
Christianity to Islam. The murder, and subsequent disputes over whether the woman should be
buried in a Muslim or Christian cemetery, set off two days of protests and violent encounters in
which protestors burned several houses. Clashes subsided only after tribal leaders intervened and
the government dispatched security forces.23 In several other instances, people who had converted
reported being ostracized, threatened or physically abused by their families or religious leaders.24
Among the factors that contributed to the increase in social hostilities in the United States was an
uptick in anti-Semitic activities. For example, the Anti-Defamation League reported that members
of the Ku Klux Klan increased their distribution of racist and anti-Semitic fliers.25 There also were
reports of Jewish establishments being vandalized in several parts of the country, including several
incidents in February 2014 involving a Jewish delicatessen and bakery in Albuquerque, New
22 The four countries with decreases of 2.0 or more points were Tanzania, Nepal, Bangladesh and Romania. 23 See U.S. Department of State . Oct. 14, 2015. “Jordan.” 2014 Report on International Religious Freedom. 24 See U.S. Department of State. Oct. 14, 2015. “Jordan.” 2014 Report on International Religious Freedom. 25 Anti-Defamation League. Nov. 11, 2014. “Declining in Stature and Influence, Ku Klux Klan Groups Flood Neighborhoods with Racist Fliers
to Grab Attention.”

18
PEW RESEARCH CENTER
www.pewresearch.org
Mexico.26 More than half of the incidents of anti-religious hate crimes in the U.S. in 2014 (58%)
were motivated, in whole or in part, by anti-Jewish bias, according to the FBI; 16% of the incidents
were motivated by anti-Muslim bias.27
The four countries where social hostilities declined by two points or more from 2013 to 2014 were
Bangladesh, Nepal, Romania and Tanzania. In Bangladesh, for instance, incidents of sectarian
violence, religion-related mob violence and harassment of women for religious dress all declined.
Of the 40 countries (20%) that had modest changes (1.0 to 1.9 points) in their scores in 2014, 12
had increases and 28 had decreases. One of the countries that had a modest increase was Laos,
where the growth of Christian congregations, coupled with scarce resources in rural communities,
led to increasing tensions with the country’s Buddhist majority. In March 2014, for instance, six
families that had converted to Christianity were forced to leave the southern village of Natahall
after their religious practices caused friction with village elders.28
In the 97 countries (49%) that had small changes in their scores (less than one point), 48 (24%)
had increases and 49 (25%) had decreases.
26 Department of Justice Civil Rights Division. May 2014. “Three Anti-Jewish Hate Crimes Prosecuted in April in Texas, Utah and New Mexico.”
Religious Freedom in Focus. Also see Burkhart, Gabrielle. March 9, 2014. “Arrest made in anti-Semitic vandalism case.” KRQE News 13. 27 See the FBI’s 2014 Hate Crime Statistics. Hate crimes that have been brought to the attention of law enforcement agencies are then
reported to the FBI. The reporting is done either through state uniform crime reporting programs or directly. 28 See U.S. Department of State. Oct. 14, 2015. “Laos.” 2014 Report on International Religious Freedom. Also see Vandenbrink, Rachel.
March 27, 2014. “Lao Christians Leave Buddhist-Majority Village Amid Tensions.” Radio Free Asia.

19
TRENDS IN GLOBAL RESTRICTIONS ON RELIGION
www.pewresearch.org
In addition to analyzing government restrictions and social hostilities separately, Pew Research
Center also considers government restrictions and social hostilities together. This provides insight
into the overall extent of religious restrictions in a country.
Looking at changes in overall restrictions,
more countries experienced decreases
than increases between 2013 and 2014.
Among the six countries whose scores
changed by 2.0 points or more on either
of the indexes, one had an increase and
five had decreases. And among countries
whose scores changed by 1.0 to 1.9 points,
16 had increases and 34 had decreases.
Overall, restrictions increased at least
somewhat in 71 countries (36%) and
decreased in 101 (51%).
20
PEW RESEARCH CENTER
www.pewresearch.org
2. Harassment of specific religious groups: Christians and
Muslims were harassed in the most countries in 2014
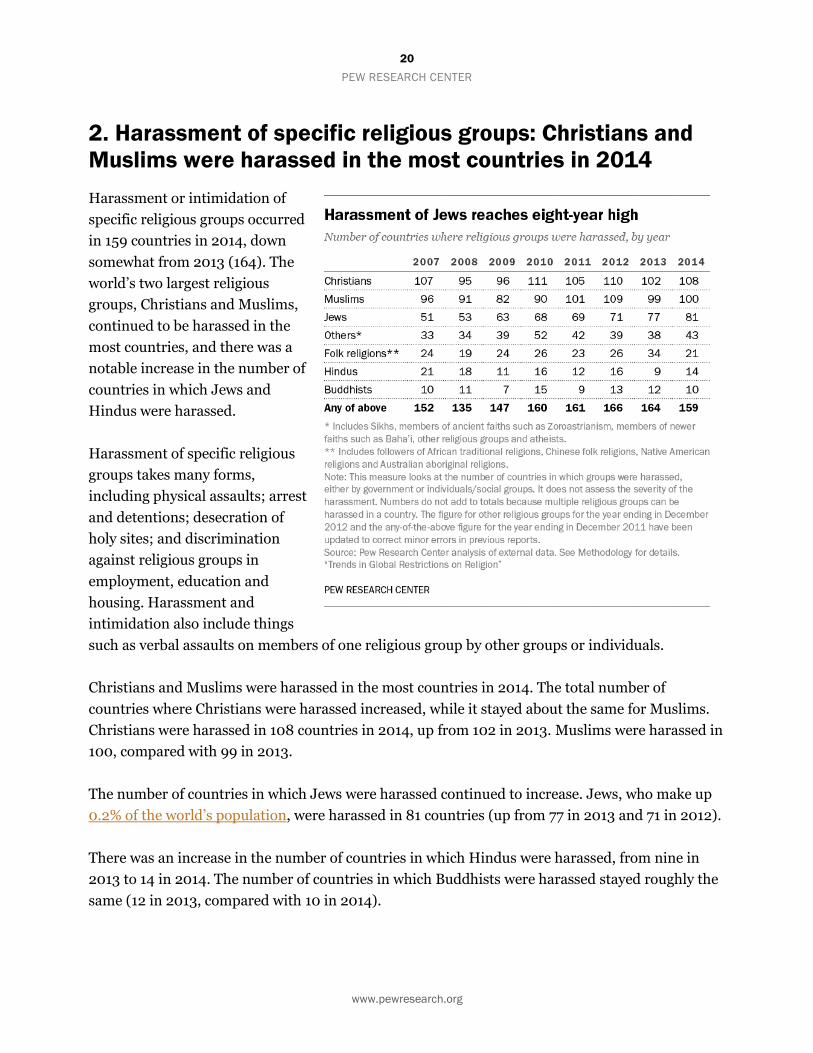
Harassment or intimidation of
specific religious groups occurred
in 159 countries in 2014, down
somewhat from 2013 (164). The
world’s two largest religious
groups, Christians and Muslims,
continued to be harassed in the
most countries, and there was a
notable increase in the number of
countries in which Jews and
Hindus were harassed.
Harassment of specific religious
groups takes many forms,
including physical assaults; arrest
and detentions; desecration of
holy sites; and discrimination
against religious groups in
employment, education and
housing. Harassment and
intimidation also include things
such as verbal assaults on members of one religious group by other groups or individuals.
Christians and Muslims were harassed in the most countries in 2014. The total number of
countries where Christians were harassed increased, while it stayed about the same for Muslims.
Christians were harassed in 108 countries in 2014, up from 102 in 2013. Muslims were harassed in
100, compared with 99 in 2013.
The number of countries in which Jews were harassed continued to increase. Jews, who make up
0.2% of the world’s population, were harassed in 81 countries (up from 77 in 2013 and 71 in 2012).
There was an increase in the number of countries in which Hindus were harassed, from nine in
2013 to 14 in 2014. The number of countries in which Buddhists were harassed stayed roughly the
same (12 in 2013, compared with 10 in 2014).

21
TRENDS IN GLOBAL RESTRICTIONS ON RELIGION
www.pewresearch.org
Some religious groups are more likely to be harassed by governments, while others are more likely
to be harassed by individuals or groups in society (see table below). Jews, for example, were
harassed by individuals or groups in society in many more countries (80) than they were by
governments (31) in 2014. The number of countries with social harassment of Jews was up sharply
from 2013. There was a big increase in the number of countries where Muslims were harassed by
some level of government (80 countries in 2014, up from 73 in 2013). There also was a big increase
in the number of countries where Christians were harassed by individuals or groups in society (85
countries in 2014, up from 71 in 2013).

22
PEW RESEARCH CENTER
www.pewresearch.org
3. Middle East-North Africa was region with highest
restrictions and hostilities in 2014
The median level of government restrictions on
religion decreased in three of the five regions
(Asia and the Pacific, the Middle East and North
Africa, and sub-Saharan Africa) and stayed
roughly the same in two regions (the Americas
and Europe).
In the latest year studied, the Middle East and
North Africa continued to have the highest
median level of government restrictions. The
median score on the Government Restrictions
Index for the 20 countries in the region
decreased modestly, from 6.0 in 2013 to 5.4 in
2014, but it remained much higher than the
global median (2.5). Many government
restrictions that were present in the region in
2013 continued to occur in 2014. For example,
government limits on public preaching were
reported in 16 of the region’s 20 countries, about
the same as in 2013 (17 countries). Similarly,
government interference with worship practices
occurred in 18 of the 20 countries, compared
with 19 in 2013.
In the Asia-Pacific region, the median score on the GRI decreased from 4.2 in 2013 to 3.7 in 2014.
Government harassment of religious groups was reported in 33 of the region’s 50 countries, down
from 36 in 2013. In the Philippines, for instance, the government signed a peace accord with a
militant separatist group known as the Moro Islamic Liberation Front. Violent conflicts between
the Christian-dominated government and Muslim separatist groups in the southern part of the

23
TRENDS IN GLOBAL RESTRICTIONS ON RELIGION
www.pewresearch.org
island nation have claimed more than 100,000 lives in recent decades. The peace agreement
created an autonomous Muslim-dominated area in the southern island of Mindanao.29
Sub-Saharan Africa’s median GRI score declined from 1.9 in 2013 to 1.6 in 2014, below the global
median. Among the factors contributing to the decline were a decrease in government interference
with religious worship practices and declines in deaths, physical abuse, detentions, displacements
and property damage resulting from government actions.
The Americas’ median score on the GRI stayed about the same in 2014 (1.6), considerably below
the global median (2.5). Europe’s median GRI score (2.5) also held steady in 2014.
29 See U.S. Department of State. Oct. 14, 2015. “Philippines.” 2014 Report on International Religious Freedom. Also see Whaley, Floyd. Jan
25, 2014. “Philippines and Rebels Agree on Peace Accord to End Insurgency.” The New York Times.

24
PEW RESEARCH CENTER
www.pewresearch.org
The median level of social hostilities involving
religion decreased somewhat in two of the five
regions in 2014 (Europe and sub-Saharan
Africa) and stayed roughly the same in three
(the Americas, Asia and the Pacific, and the
Middle East and North Africa).
As in previous years, social hostilities involving
religion remained the highest in the Middle East
and North Africa. The median score for the
region’s 20 countries stayed roughly the same
(6.0 in 2014 vs. 5.8 in 2013), but it was well
above the global median (1.5). Religious
hostilities decreased in seven countries in the
region and increased in 10.
Iraq was one of the 10 countries in the region
where social hostilities increased. Violent acts
by both Sunni- and Shia-dominated groups and
militias – including the Islamic State in Iraq and
the Levant (ISIL) – led to killings, suicide
bombings, kidnappings, robberies, harassment,
intimidation and the displacement of people
from their homes.30
Europe’s median score on the SHI fell from 2.4 in 2013 to 1.9 in 2014. In nine of the 45 countries
in the region, individuals were assaulted or displaced from their homes in retaliation for religious
activities considered offensive or threatening to the majority faith – a noticeable decrease from 19
countries in 2013. The number of European countries where women were harassed for violating
local customs or societal norms concerning religious dress also decreased, from 20 to 17. This
includes cases in which women were harassed for not wearing religious dress (such as a Muslim
woman being harassed for not wearing a hijab) as well as cases in which women were harassed for
wearing religious attire (such as a woman being harassed for wearing a hijab).31
30 See U.S. Department of State. Oct. 14, 2015. “Iraq.” 2014 Report on International Religious Freedom. 31 For background, see Pew Research Center’s April 2016 report “Restrictions on Women’s Religious Attire.”
25
TRENDS IN GLOBAL RESTRICTIONS ON RELIGION
www.pewresearch.org
Sub-Saharan Africa’s median SHI score fell from 1.3 in 2013 to 1.0 in 2014, continuing a trend
from 2012-2013. For instance, the number of countries in the region where individuals or social
groups used violence or the threat of violence to enforce religious norms dropped from 15 in 2013
to nine in 2014. And the number of countries where individuals were assaulted or displaced from
their homes for religious activities considered offensive to the majority faith dropped from 18 to
nine.
In the Asia-Pacific region, the median SHI score stayed at 2.2. While the region’s overall score
remained unchanged, there was a sizable decrease in the number of countries where women were
harassed for violating religious dress norms (from 16 in 2013 to 11 in 2014). At the same time, the
number of countries in the region with active terrorist groups increased from 18 to 22. In
Australia, for instance, an Iranian-born Muslim, Man Haron Monis, took 18 people hostage in a
Lindt Chocolate Cafe in Sydney in December 2014. The siege ended when police stormed the
building, resulting in the deaths of two hostages.32 (See the Overview of this report for more
details.)
The median level of social hostilities involving religion in the Americas remained low (0.3 in 2014
compared with 0.1 in 2013).
32 See Innis, Michelle. Dec. 15, 2014. “Sydney Hostage Siege Ends With Gunman and 2 Captives Dead as Police Storm Cafe.” The New York
Times. Also see National Consortium for the Study of Terrorism and Responses to Terrorism (START). Incident 201412150032. 2014. Global
Terrorism Database.

26
PEW RESEARCH CENTER
www.pewresearch.org

27
TRENDS IN GLOBAL RESTRICTIONS ON RELIGION
www.pewresearch.org
4. Among the world’s 25 most populous countries, the
highest overall restrictions on religion in 2014 were in
Egypt, Indonesia, Pakistan, Russia and Turkey
Among the world’s 25 most populous countries (which contain 74% of the world’s population),
Egypt, Indonesia, Pakistan, Russia and Turkey stand out as having the highest levels restrictions
on religion (as of the end of 2014) when both government restrictions and social hostilities are
taken into account.33 Brazil, the Democratic Republic of the Congo, Japan, the Philippines and
South Africa have the lowest levels of restrictions and hostilities.
Seven of the most populous countries had low government restrictions in 2014: Brazil, the
Democratic Republic of the Congo, Italy, Japan, South Africa, the Philippines and the United
Kingdom. The Democratic Republic of the Congo and Japan were the only countries to have low
social hostilities. They also were the only countries that had both low social hostilities and low
government restrictions.
Among the 25 most populous countries, Mexico was the only one with a score on the Government
Restrictions Index that increased by one point or more from 2013 to 2014. Ethiopia, Germany and
Burma (Myanmar) were the only ones with a GRI score that decreased by one point or more in
that span (although Burma still had high government restrictions on religion). In the United
States, Italy and South Africa, scores on the Social Hostility Index increased by one point or more
over the previous year. The SHI score decreased by one point or more in Bangladesh, China, the
Democratic Republic of the Congo, Ethiopia, Germany, India, Japan, Nigeria, Philippines, Russia
and the United Kingdom.
33 As noted earlier in the report, North Korea is excluded from the study for methodological reasons. See Methodology for more details.

28
PEW RESEARCH CENTER
www.pewresearch.org

29
TRENDS IN GLOBAL RESTRICTIONS ON RELIGION
www.pewresearch.org
About this report
This is the seventh in a series of reports by Pew Research Center analyzing the extent to which
governments and societies around the world impinge on religious beliefs and practices. As part of
the original study, published in 2009, the Center developed two indexes – a Government
Restrictions Index and a Social Hostilities Index – that were used to gauge government
restrictions on religion and social hostilities involving religion in nearly 200 countries and
territories.
The initial report, published in 2009, established a baseline for each country and five major
geographic regions. Follow-up reports looked at changes in the level of restrictions and hostilities
in these countries and territories.
The new report focuses on countries and regions that had the most extensive restrictions and
hostilities in 2014, as well as countries and regions that had large changes in their scores on the
Government Restrictions Index and Social Hostilities Index from 2013 to 2014. Where
appropriate, it also looks at changes since the baseline year of the study.
Readers should note that the categories of very high, high, moderate and low restrictions or
hostilities are relative – not absolute – rankings based on the overall distribution of index scores
in the initial year of this study. (See Methodology for more details.) As such, they provide a guide
for comparing country scores and evaluating their direction over time. However, Pew Research
Center has not attached numerical rankings to the countries because there are many tie scores and
the differences between the scores of the countries that are close to each other are not necessarily
as meaningful as they might appear.
As we have noted in previous reports, it is important to keep in mind some limitations of this
study. The indexes of government restrictions and social hostilities that serve as the basis of the
study are designed to measure obstacles to religious expression and practice. As a result, the
report focuses on the constraints on religion in each country and does not look at the other side of
the coin: the amount of free or unhindered religious activity that takes place in particular
countries. The study also does not attempt to determine whether restrictions are justified or
unjustified, nor does it attempt to analyze the many factors – historical, demographic, cultural,
religious, economic and political – that might explain why restrictions have arisen. It simple seeks
to measure the restrictions that exist in a quantifiable, transparent and reproducible way, based on
published reports from numerous governmental and nongovernmental organizations.

30
PEW RESEARCH CENTER
www.pewresearch.org
As was the case in all previous reports, North Korea is not included in this study. The primary
sources used in this study indicate that North Korea’s government is among the most repressive in
the world, including toward religion. But because independent observers lack regular access to the
country, the sources are unable to provide the kind of specific information that formed the basis of
the analysis.

31
TRENDS IN GLOBAL RESTRICTIONS ON RELIGION
www.pewresearch.org
Methodology
This is the seventh time Pew Research Center has measured restrictions on religion around the
globe.34 This report, which includes data for the year ending Dec. 31, 2014, generally follows the
same methodology as previous reports.
Pew Research Center uses two 10-point indexes – the Government Restrictions Index (GRI) and
the Social Hostilities Index (SHI) – to rate 198 countries and self-governing territories on their
levels of restrictions.35 This report analyzes changes in restrictions on an annual basis, focusing on
the period from 2013 to 2014.
The study categorizes the amount of change in each country’s
scores in two ways, numerically and by percentile. First,
countries are grouped into categories depending on the size of
the numeric change in their scores from year to year on the two
indexes: changes of two points or more in either direction;
changes of at least one point but less than two points; changes of
less than one point; or no change at all. (See chart at right.)
Changes in overall levels of restrictions are calculated for each
country by comparing its scores on both indexes (the GRI and
the SHI) from year to year. When a country’s scores on the GRI
and the SHI changed in the same direction (both increased or
both decreased), the greater amount of change determined the
category. For instance, if the country’s GRI score increased by 0.8 and its SHI score increased by
1.5, the country was put into the overall “1.0-1.9 increase” category. When a country’s score
increased on one index but decreased on the other, the difference between the amounts of change
determined the grouping. For example, if the country’s GRI score increased by 2.0 and its SHI
score decreased by 1.5, the country went into the overall “0.1-0.9 increase” category. When a
country’s score on one index stayed the same, the amount of change on the other index was used
to assign the category.
34 See Methodology of the Pew Research Center’s 2009 report “Global Restrictions on Religion” for a discussion of the conceptual basis for
measuring restrictions on religion. 35 Some earlier reports provided scores for 197 countries and territories. This report includes South Sudan (which separated from Sudan in
July 2011), bringing the total to 198 countries and territories.
Index point change
Categories for assessing index score
changes between years
2.0 or more increase
1.0 to 1.9 increase
0.1 to 0.9 increase
No change
0.1 to 0.9 decrease
1.0 to 1.9 decrease
2.0 or more decrease
“Trends in Global Restrictions on Religion”
PEW RESEARCH CENTER

32
PEW RESEARCH CENTER
www.pewresearch.org
Second, this report categorizes the levels of
government restrictions and social hostilities in
each country by percentiles. As the benchmark,
it uses the results from the baseline year of the
study (the year ending in mid-2007). Scores in
the top 5% on each index in mid-2007 were
categorized as “very high.” The next highest
15% of scores were categorized as “high,” and
the following 20% were categorized as
“moderate.” The bottom 60% of scores were
categorized as “low.” See the table to the right
for the index score thresholds as determined
from the mid-2007 data. These thresholds are applied to all subsequent years of data.
The methodology used by Pew Research Center to assess and compare restrictions on religion was
developed by former Pew Research Center senior researcher and director of cross-national data
Brian J. Grim in consultation with other members of the Pew Research Center staff, building on a
methodology that Grim and Professor Roger Finke developed while at Penn State University’s
Association of Religion Data Archives.36 The goal was to devise quantifiable, objective and
transparent measures of the extent to which governments and societal groups impinge on the
practice of religion. The findings were used to rate countries and self-governing territories on two
indexes that are reproducible and can be periodically updated.
This research goes beyond previous efforts to assess restrictions on religion in several ways. First,
Pew Research Center coded (categorized and counted) data from more than a dozen published
cross-national sources, providing a high degree of confidence in the findings. The coders looked to
the sources for only specific, well-documented facts, not opinions or commentary.
Second, Pew Research Center staff used extensive data-verification checks that reflect generally
accepted best practices for such studies, such as double-blind coding (coders do not see each
other’s ratings), inter-rater reliability assessments (checking for consistency among coders) and
carefully monitored protocols to reconcile discrepancies among coders.
36 See Grim, Brian J. and Roger Finke. 2006. “International Religion Indexes: Government Regulation, Government Favoritism, and Social
Regulation of Religion.” Interdisciplinary Journal of Research on Religion.
Levels of restrictions on religion
Government
Restrictions Index Social Hostilities
Index
Very high 6.6 to 10.0 7.2 to 10.0
High 4.5 to 6.5 3.6 to 7.1
Moderate 2.4 to 4.4 1.5 to 3.5
Low 0.0 to 2.3 0.0 to 1.4
Based on distribution of index scores in the baseline year, ending
mid-2007.
“Trends in Global Restrictions on Religion”
PEW RESEARCH CENTER

33
TRENDS IN GLOBAL RESTRICTIONS ON RELIGION
www.pewresearch.org
Third, the Pew Research Center coding took into account whether the perpetrators of religion-
related violence were government or private actors. The coding also identified how widespread
and intensive the restrictions were in each country.
Fourth, one of the most valuable contributions of the indexes and the questions used to construct
them (see the section on “The Coding Instrument” on page 36) is their ability to chart change over
time.
The 198 countries and self-administering territories covered by the study contain more than 99.5%
of the world’s population. They include 192 of the 193 member states of the United Nations as of
2014 plus six self-administering territories – Kosovo, Hong Kong, Macau, the Palestinian
territories, Taiwan and Western Sahara.37 Reporting on these territories does not imply any
position on what their international political status should be, only recognition that the de facto
situations in these territories require separate analysis.
Although the 198 countries and territories vary widely in size, population, wealth, ethnic diversity,
religious makeup and form of government, the study does not attempt to adjust for such
differences. Poor countries are not scored differently on the indexes than wealthy ones. Countries
with diverse ethnic and religious populations are not “expected” to have more social hostilities
than countries with more homogeneous populations. And democracies are not assessed more
leniently or harshly than authoritarian regimes.
In the latest year of the study, Pew Research Center identified 17 widely available, frequently cited
sources of information on government restrictions and social hostilities involving religion around
the world. This study includes four sources that were not used in the baseline report on religious
restrictions. (See page 35 for more details on the new information sources.)
The primary sources, which are listed below, include reports from U.S. government agencies,
several independent, nongovernmental organizations and a variety of European and United
Nations bodies. Although most of these organizations are based in Western countries, many of
37 The one United Nations member state not included in the study is North Korea. The sources clearly indicate that North Korea’s government
is among the most repressive in the world with respect to religion as well as other civil and political liberties. (The U.S. State Department’s
2013 Report on International Religious Freedom, for example, says, “Genuine freedom of religion does not exist” in North Korea.) But
because North Korean society is effectively closed to outsiders and independent observers lack regular access to the country, the sources
were unable to provide the kind of specific, timely information that Pew Research Center categorized and counted (or “coded,” in social
science parlance) for this quantitative study. Therefore, the report does not include scores for North Korea.

34
PEW RESEARCH CENTER
www.pewresearch.org
them depend on local staff to collect information across the globe. As previously noted, Pew
Research Center did not use the commentaries, opinions or normative judgments of the sources;
the sources were combed only for factual information on specific policies and actions.
1. Country constitutions
2. U.S. State Department annual reports on International Religious Freedom
3. U.S. Commission on International Religious Freedom annual reports
4. U.N. Special Rapporteur on Freedom of Religion or Belief reports
5. Human Rights First reports in first and second years of coding; Freedom House reports in
subsequent years of coding
6. Human Rights Watch topical reports
7. International Crisis Group country reports
8. United Kingdom Foreign & Commonwealth Office annual report on human rights
9. Council of the European Union annual report on human rights
10. Global Terrorism Database
11. European Network Against Racism Shadow Reports
12. United Nations High Commissioner for Refugees reports
13. U.S. State Department annual Country Reports on Terrorism
14. Anti-Defamation League reports
15. U.S. State Department Country Reports on Human Rights Practices
16. Uppsala University’s Uppsala Conflict Data Program, Armed Conflict Database

35
TRENDS IN GLOBAL RESTRICTIONS ON RELIGION
www.pewresearch.org
17. Human Rights Without Frontiers “Freedom of Religion or Belief” newsletters
U.S. government reports with information on the situation in the United States
U.S. Department of Justice “Religious Freedom in Focus” newsletters and reports
FBI Hate Crime Reports
As noted, this study includes four sources that were not included in the Pew Research Center’s first
report on global restrictions on religion: Freedom House reports; Uppsala University’s Armed
Conflict Database; the “Freedom of Religion or Belief” newsletters of Human Rights Without
Frontiers; and the Global Terrorism Database.
The Freedom House reports have replaced Human Rights First reports, which have not been
updated since mid-2008. The Uppsala Armed Conflict Database provides information on the
number of people affected by religion-related armed conflicts, supplementing other sources. The
Human Rights Without Frontiers “Freedom of Religion or Belief” newsletters have replaced the
Hudson Institute publication “Religious Freedom in the World” (by Paul Marshall), which has not
been updated since its release in 2008. Human Rights Without Frontiers is a nongovernmental
organization based in Brussels that has affiliated offices throughout the world.
Since 2013, the Pew Research Center has used data from the Global Terrorism Database,
maintained by the University of Maryland’s National Consortium for Terrorism and Responses to
Terrorism (START), along with the International Crisis Group’s country reports, Uppsala
University’s Armed Conflict Database and the State Department’s annual Country Reports on
Terrorism, for information on religion-related terrorism. (One source used in earlier reports, the
U.S. government’s Worldwide Incident Tracking System (WITS), is no longer available online.)
Prior to 2013, the report relied only on the International Crisis Group reports, the Uppsala
database and the State Department reports for information on religion-related terrorism. The
Global Terrorism Database is one of the most comprehensive sources on terrorism around the
world and is the source for the U.S. State Department’s Country Reports on Terrorism. The
addition of this source thus provides greater context and information on terrorism without biasing
the reporting through the addition of information that was not previously available.
While some of the increases in religious restrictions noted in this study could reflect the use of
more up-to-date and/or better information sources, Pew Research Center staff monitor the impact
of source information variability each year and have found no evidence of overall informational

36
PEW RESEARCH CENTER
www.pewresearch.org
bias. (For additional discussion, see the “Potential Biases” section in the 2014 report “Religious
Hostilities Reach Six-Year High.”)
As explained in more detail below, Pew Research Center staff developed a battery of questions
similar to a survey questionnaire. Coders consulted the primary sources in order to answer the
questions separately for each country. While the State Department’s annual reports on
International Religious Freedom generally contained the most comprehensive information, the
other sources provided additional factual detail that was used to settle ambiguities, resolve
contradictions and help in the proper scoring of each question.
The questionnaire, or coding instrument, generated a set of numerical measures on restrictions in
each country. It also made it possible to see how government restrictions intersect with broader
social tensions and incidents of violence or intimidation by private actors. The coding instrument
with the list of questions used for this report is shown in the Summary of Results in Appendix D.
The coding process required the coders to check all the sources for each country. Coders
determined whether each source provided information critical to assigning a score; had supporting
information but did not result in new facts; or had no available information on that particular
country. Multiple sources of information were available for all countries and self-administering
territories with populations greater than 1 million. Most of the countries and territories analyzed
by Pew Research Center were multi-sourced; only small, predominantly island, countries had a
single source, namely, the State Department reports.
Coding the United States presented a special problem since it is not included in the State
Department’s annual reports on International Religious Freedom. Accordingly, Pew Research
Center coders also looked at reports from the U.S. Department of Justice and the FBI on violations
of religious freedom in the United States, in addition to consulting all the primary sources,
including reports by the United Nations, Human Rights Watch, Freedom House, the International
Crisis Group and the U.K. Foreign & Commonwealth Office, many of which contain data on the
United States.
The Pew Research Center employed strict training and rigorous coding protocols to make its
coding as objective and reproducible as possible. Coders worked directly under an experienced
researcher’s supervision, with additional direction and support provided by other Pew Research

37
TRENDS IN GLOBAL RESTRICTIONS ON RELIGION
www.pewresearch.org
Center researchers. The coders underwent an intensive training period that included a thorough
overview of the research objectives, information sources and Methodology.
Countries were double-blind coded by two coders (coders did not see each other’s ratings), and the
initial ratings were entered into an electronic document (coding instrument) including details on
each incident. The coders began by filling out the coding instrument for each country using the
information source that had the most comprehensive information. The protocol for each coder was
to answer every question on which information was available in the initial source. Once a coder
had completed that process, he or she then turned to the other sources. As new information was
found, this was also coded and the source duly noted. Whenever ambiguities or contradictions
arose, the source providing the most detailed, clearly documented evidence was used.
After two coders had separately completed the coding instrument for a particular country, their
scores were compared by a research associate. Areas of discrepancy were discussed at length with
the coders and were reconciled in order to arrive at a single score on each question for each
country. The data for each country were then combined into a master file, and the answers and
substantiating evidence were entered into a database.
After data collection for all countries was completed, Pew Research Center coders and researchers
compared the scores from calendar year 2014 with those from the previous year, ending Dec. 31,
2013. They identified scores that had changed and analyzed the substantiating evidence for each
year to make sure the change was substantive and not the result of coder error. Throughout this
process, the coding instrument itself was continually monitored for possible defects. The questions
were designed to be precise, comprehensive and objective so that, based on the same data and
definitions, the coding could be reliably reproduced by others with the same results. At the same
time, the Pew Research Center has attempted to minimize changes to the coding instrument as
much as is possible to ensure all changes between years are the result of actual changes in
restrictions and hostilities, not changes in methodology.
Pew Research Center staff generally found few cases in which one source contradicted another.
When contradictions did arise – such as when sources provided differing estimates of the number
of people displaced due to religion-related violence – the source that cited the most specific
documentation was used. The coders were instructed to disregard broad, unsubstantiated
generalizations regarding abuses and to focus on reports that contained clear, precise
documentation and factual details, such as names, dates and places where incidents occurred.
Pew Research Center staff compared coders’ scores for all questions for each of the 198 countries
and territories included in the study, computing the degree to which the scores matched. The

38
PEW RESEARCH CENTER
www.pewresearch.org
inter-rater reliability score across all variables was 0.66, slightly lower than in previous years.
(Scores above 0.7 are generally considered good, while scores above 0.6 are acceptable.) The lower
score could be due, in part, to the need to conduct multiple waves of coding during this cycle. (See
page 44 for more on a change in data collection procedure.)
The data-verification procedures went beyond the inter-rater reliability statistics. They also
involved comparing the answers on the main measures for each country with other closely related
questions in the data set. This provided a practical way to test the internal reliability of the data.
In previous years, Pew Research Center staff also checked the reliability of the coded data by
comparing them with similar, though more limited, religious restrictions data sets. In particular,
published government and social regulation of religion index scores are available from the
Association of Religion Data Archives (for three years of data) and the Hudson Institute (for one
year of data), which makes them ideal measures for cross-validation. The review process found
very few significant discrepancies in the coded data; changes were made only if warranted by a
further review of the primary sources.
The Government Restrictions Index is based on 20 indicators of ways that national and local
governments restrict religion, including through coercion and force. The Social Hostilities Index is
based on 13 indicators of ways in which private individuals and social groups infringe on religious
beliefs and practices, including religiously biased crimes, mob violence and efforts to stop
particular religious groups from growing or operating. The study also counted the number and
types of documented incidents of religion-related violence, including terrorism and armed conflict.
Government Restrictions Index
Coding multiple indicators makes it possible to construct a Government Restrictions Index of
sufficient gradation to allow for meaningful cross-national comparisons. An additional advantage
of using multiple indicators is that it helps mitigate the effects of measurement error in any one
variable, providing greater confidence in the overall measure.
The Pew Research Center coded 20 indicators of government restrictions on religion (see the
Summary of Results). These 20 items were added together to create the GRI. In two cases, these
items represent an aggregation of several closely related questions: Measures of five types of
physical abuses are combined into a single variable (GRI Q.19), and seven questions measuring
aspects of government favoritism are combined into an overall favoritism scale (GRI Q.20 is a

39
TRENDS IN GLOBAL RESTRICTIONS ON RELIGION
www.pewresearch.org
summary variable showing whether a country received the maximum score on one or more of the
seven questions).
The GRI is a fine-grained measure created by adding the 20 items on a 0-to-10 metric, with zero
indicating very low levels of government restrictions on religion and 10 indicating very high levels
of restrictions. The 20 questions that form the GRI are coded in a standard scale from zero to one
point, while gradations among the answers allowed for partial points to be given for lesser degrees
of the particular government restriction being measured. The overall value of the index was
calculated and proportionally adjusted – so that it had a maximum value of 10 and a possible
range of zero to 10 – by dividing the sum of the variables by two.
A test of whether the 20 items were statistically reliable as a single index produced a scale
reliability coefficient of 0.9 for calendar year 2014. Since coefficients of 0.7 or higher are generally
considered acceptable, it was statistically appropriate to combine these 20 items into a single
index.
Social Hostilities Index
In addition to government restrictions, violence and intimidation in societies also can limit
religious beliefs and practices. Accordingly, Pew Research Center staff tracked more than a dozen
indicators of social impediments on religion. Once again, coding multiple indicators made it
possible to construct an index that shows gradations of severity or intensity and allows for
comparisons among countries. The Summary of Results contains the 13 items used by Pew
Research Center staff to create the Social Hostilities Index.
The SHI was constructed by adding together the 13 indicators based on a 0-to-10 metric, with zero
indicating very low impediments to religious beliefs and practices and 10 indicating very high
impediments. The various questions that form the index are coded in a standard scale from zero to
one point, while gradations among the answers allow for partial points to be given for lesser
degrees of the particular hostilities being measured. The indicators were added together and set to
have a possible range of zero to 10 by dividing the sum of the variables by 1.3.
As with the Government Restrictions Index, various types of violence and intimidation were
combined. A test of whether these 13 items were statistically reliable as a single index produced a
scale reliability coefficient of 0.89. Since coefficients of 0.7 or higher are generally considered
acceptable, it was statistically appropriate to combine these items into a single index.

40
PEW RESEARCH CENTER
www.pewresearch.org
How examples are coded
Examples of each type of government restriction or social hostility are generally counted in a
single measure on the GRI or SHI. For instance, a restriction on proselytizing (sharing one’s faith
with the intent of persuading another to join the faith) is not also counted as a restriction on
conversion (an individual changing his/her religion). In some situations, however, an individual
restriction or hostility may be part of a broader set of restrictions or hostilities. For instance, a
mob attack by members of one religious group on an individual of another religion may be an
isolated event and counted just under question SHI Q.2: Was there mob violence related to
religion? (See the Summary of Results.) However, if such an attack triggers repeated attacks
between religious groups, it also might be an indication of sectarian or communal violence, which
by definition involves two or more religious groups facing off in repeated clashes. In such a case,
the mob attack also would be counted under question SHI Q.3: Were there acts of sectarian or
communal violence between religious groups? (See the Summary of Results.)
Effects of consolidating to a new database
For the first few years of this study, information on the number, types and locations of incidents of
government force and social violence toward religious groups as well as deference to religious
authorities in matters of law were coded at the province level. (See example of data coding on
pages 45-48 of the December 2009 baseline report.) Each year, the province numbers were
summed and put into separate country-level files. Following the publication of the August 2011
report, Pew Research Center staff created a database that integrated all province- and country-
level data on religious restrictions. During this process, Pew Research Center staff reviewed any
discrepancies between province files and the sums that had been transferred to the country files
and made appropriate corrections. The adjustments made were relatively minor and had small
effects on index scores for countries, on average less than 0.005 points on the 10-point indexes.
Consolidating the data into a database also entailed a review of the data on harassment of religious
groups. In particular, instances of harassment from the year ending in mid-2007 were stored as
open-ended questions, and in a few cases they were recoded to match the categories used in
subsequent years.
Beginning with data covering 2012, Pew Research Center stopped collecting data at the province-
level; all data is coded at the country level.
Changing time period of analysis
This is the fourth time Pew Research Center has analyzed restrictions on religion in a calendar
year. Previous reports analyzed 12-month periods from July 1-June 30 (e.g., July 1, 2009-June 30,

41
TRENDS IN GLOBAL RESTRICTIONS ON RELIGION
www.pewresearch.org
2010). The shift to calendar years was made, in part, because most of the primary sources used in
this study are based on calendar years.
Because of the shift in time frame, previous studies did not report directly on incidents that
occurred during the period from July 1-Dec. 31, 2010. While this misses some incidents that
occurred during the second half of 2010, events that had an ongoing impact – such as a change to
a country’s constitution or the outbreak of a religion-related war – were captured by the coding.
Researchers for the study carefully reviewed the situation in each country and territory during this
six-month period and made sure that restrictions with an ongoing impact were not overlooked.
Religion-related terrorism and armed conflict
Terrorism and war can have huge direct and indirect effects on religious groups, including
destroying religious sites, displacing whole communities and inflaming sectarian passions.
Accordingly, Pew Research Center tallied the number, location and consequences of religion-
related terrorism and armed conflict around the world, as reported in the same primary sources
used to document other forms of intimidation and violence. However, war and terrorism are
sufficiently complex that it is not always possible to determine the degree to which they are
religiously motivated or state sponsored. Out of an abundance of caution, this study does not
include them in the Government Restrictions Index. They are factored instead into the index of
social hostilities involving religion, which includes one question specifically about religion-related
terrorism and one question specifically about religion-related war or armed conflict. In addition,
other measures in both indexes are likely to pick up spillover effects of war and terrorism on the
level of religious tensions in society. For example, hate crimes, mob violence and sectarian fighting
that occur in the aftermath of a terrorist attack or in the context of a religion-related war would be
counted in the Social Hostilities Index, and laws or policies that clearly discriminate against a
particular religious group would be registered on the Government Restrictions Index.
For the purposes of this study, the term “religion-related terrorism” is defined as premeditated,
politically motivated violence perpetrated against noncombatants by subnational groups or
clandestine agents that have some identifiable religious ideology or religious motivation. It also
includes acts carried out by groups that have a nonreligious identity but affect religious personnel,
such as clergy. Readers should note that it is the political character and motivation of the groups,
not the type of violence, that is at issue here. For instance, a bombing would not be classified as
religion-related terrorism if there was no clearly discernible religious ideology or bias behind it
unless it was directed at religious personnel. Religion-related war or armed conflict is defined as
armed conflict (a conflict that involves sustained casualties over time or more than 1,000 battle

42
PEW RESEARCH CENTER
www.pewresearch.org
deaths) in which religious rhetoric is commonly used to justify the use of force, or in which one or
more of the combatants primarily identifies itself or the opposing side by religion.
Changes to Somalia’s coding
Starting with data covering 2013, researchers changed the way they coded government restrictions
in Somalia. In previous years of the study, researchers had coded actions by the al-Shabaab rebel
group as government restrictions, largely because the group effectively controlled large swathes of
Somali territory. The extent of al-Shabaab control over Somali territory decreased in calendar year
2013, so researchers did not code their actions as government restrictions but rather as social
hostilities. Researchers continued to follow this policy when coding data for 2014.
As noted earlier, the primary sources indicate that the North Korean government is among the
most repressive in the world, including toward religion. But because independent observers lack
regular access to North Korea, the sources are unable to provide the kind of specific, timely
information that forms the basis of this report. Therefore, North Korea is not included on either
index.
This raises two important issues concerning potential information bias in the sources. The first is
whether other countries that limit outsiders’ access and that may seek to obscure or distort their
record on religious restrictions were adequately covered by the sources. Countries with relatively
limited access have multiple primary sources of information that the Pew Research Center used for
its coding. Each is also covered by other secondary quantitative data sets on religious restrictions
that have used a similar coding scheme, including earlier years of coded State Department report
data produced by Grim at Penn State’s Association of Religion Data Archives (ARDA) project (four
data sets); independent coding by experts at the Hudson Institute’s Center for Religious Liberty
using indexes also available from ARDA (one data set); and content analysis of country
constitutions conducted by the Becket Fund for Religious Liberty (one data set). Pew Research
Center staff used these for cross-validation. Thus, contrary to what one might expect, even most
countries that limit access to information tend to receive fairly extensive coverage by groups that
monitor religious restrictions.
The second key question – the flipside of the first – is whether countries that provide freer access
to information receive worse scores simply because more information is available on them. As
described more fully in the methodology in the baseline report, Pew Research Center staff
compared the length of State Department reports on freer-access countries with those of less-free-
access countries. The comparison found that the median number of words was approximately

43
TRENDS IN GLOBAL RESTRICTIONS ON RELIGION
www.pewresearch.org
three times as large for the limited-access countries as for the open-access countries. This suggests
that problems in freer-access countries are generally not overreported in the State Department
reports.
Only when it comes to religion-related violence and intimidation in society do the sources report
more problems in the freer-access countries than in the limited-access ones. However, the Social
Hostilities Index includes several measures – such as SHI Q.8 (“Did religious groups themselves
attempt to prevent other religious groups from being able to operate?”) and SHI Q.11 (“Were
women harassed for violating religious dress codes?”) – that are less susceptible to such reporting
bias because they capture general social trends or attitudes as well as specific incidents. With these
limitations in mind, it appears that the coded information on social hostilities is a fair gauge of the
situation in the vast majority of countries and a valuable complement to the information on
government restrictions.
Data on social impediments to religious practice can more confidently be used to make
comparisons among countries with sufficient openness, which includes more than nine-in-ten
countries covered in the coding. An analysis by Grim and Richard Wike, the Pew Research Center’s
director of global attitudes research, tested the reliability of the State Department reports on social
impediments to religious practice by comparing public opinion data with data coded from the
reports in previous years by Grim and experts at Penn State. They concluded that “the
understanding of social religious intolerance embodied in the State Department reports is
comparable with the results of population surveys and individual expert opinion.”38
As in previous reports, this study provides a summary of the number of countries where specific
religious groups faced government or social harassment. This is essentially a cross-tabulation of
GRI.Q.11 (“Was there harassment or intimidation of religious groups by any level of
government?”) and the first type of religious hatred or bias measured in SHI.Q.1.a. (“Did
individuals face harassment or intimidation motivated by religious hatred or bias?”). For purposes
of this study, the definition of harassment includes any mention in the primary sources of an
offense against an individual or group based on religious identity. Such offenses may range from
physical attacks and direct coercion to more subtle forms of discrimination. But prejudicial
opinions or attitudes, in and of themselves, do not constitute harassment unless they are acted
upon in a palpable way.
38 See Grim, Brian J. and Richard Wike. 2010. “Cross-Validating Measures of Global Religious Intolerance: Comparing Coded State
Department Reports with Survey Data and Expert Opinion.” Politics and Religion.

44
PEW RESEARCH CENTER
www.pewresearch.org
As noted above, this study provides data on the number of countries in which different religious
groups are harassed or intimidated. But the study does not assess either the severity or the
frequency of the harassment in each country. Therefore, the results should not be interpreted as
gauging which religious group faces the most harassment or persecution around the world.
The data collection period for the latest religious restrictions study had to be altered slightly.
Normally, all sources used in the study are released by the time data coding begins in the summer.
However, the U.S. State Department reports for 2014 (including the agency’s 2014 International
Religious Freedom Report) were released much later than usual. As a result, data coding took
place in three waves: summer 2015, fall 2015 and winter 2016. Pew Research Center staff
compared the data collected in each wave with data collected in the other two waves, and with data
collected for 2013, to make sure no systematic problems arose as a result of the extended data
collection period, and to ensure consistency across all data collected.

TRENDS IN GLOBAL RESTRICTIONS ON RELIGION
www.pewresearch.org
45
ModerateSCORES 2.4 TO 4.4
Greece
Thailand
France
Bangladesh
Nigeria
Palestinian territories
United Arab Emirates
Djibouti
Ukraine
Kenya
Serbia
Lebanon
Georgia
Ethiopia
Comoros
Bahamas
Rwanda
Moldova
Denmark
Belgium
Guinea
Slovakia
Austria
Germany
Zimbabwe
Zambia
Republic of Macedonia
Equatorial Guinea
Nepal
Madagascar
HighSCORES 4.5 TO 6.5
Burma (Myanmar)
Eritrea
Pakistan
Afghanistan
Singapore
Iraq
Sudan
Western Sahara
Bahrain
Very HighSCORES 6.6 AND HIGHER
China
Egypt
Uzbekistan
Turkey
Indonesia
Iran
Syria
Saudi Arabia
Kazakhstan
Azerbaijan
Turkmenistan
Laos
Malaysia
Maldives
Russia
Tajikistan
Vietnam
Kyrgyzstan
Belarus
Algeria
Brunei
Mauritania
Israel
Jordan
Bulgaria
Kuwait
Morocco
Sri Lanka
Qatar
Uganda
Libya
Tunisia
Yemen
Oman
Bhutan
India
Mexico
Armenia
Cuba
Denotes an increase of one point or more from 2013 to 2014. Denotes a decrease of one point or more from 2013 to 2014.
Appendix A: Government Restrictions IndexThe following table shows all 198 countries and territories in descending order of their scores on the Pew Research Center’s index of government restrictions on religion as of the end of 2014. The Center has not attached numerical rankings to the countries because there are numerous tie scores and the differences between the scores of countries that are close to each other on this table are not necessarily meaningful.
* See page 47 for notes on North Korea, Somalia and the Palestinian territories.

PEW RESEARCH CENTER
www.pewresearch.org
46
Republic of the Congo
Senegal
Trinidad and Tobago
Albania
Malta
Solomon Islands
Gabon
Australia
Slovenia
Portugal
Andorra
Kiribati
Ecuador
Uruguay
Grenada
Samoa
Ireland
Macau
Sierra Leone
Botswana
South Africa
Ghana
Nauru
Namibia
Philippines
Lesotho
Japan
Taiwan
Brazil
Cameroon
Mali
Benin
Guinea-Bissau
Burkina Faso
Cape Verde
San Marino
Marshall Islands
Palau
Federated States of Micronesia
Suriname
Sao Tome and Principe
New Zealand
South Korea
Bosnia-Herzegovina
Antigua and Barbuda
Bolivia
Haiti
Togo
Tonga
Panama
St. Lucia
Gambia
St. Vincent and the Grenadines
Mozambique
United Kingdom
Chad
Colombia
Jamaica
Dominican Republic
Monaco
Luxembourg
Barbados
Montenegro
Timor-Leste
Seychelles
Dominica
Netherlands
El Salvador
Croatia
Estonia
Niger
Liberia
Chile
Paraguay
Finland
Ivory Coast
Guyana
Vanuatu
Belize
Canada
Democratic Republic of the Congo
Papua New Guinea
Mauritius
Malawi
LowSCORES 0.0 TO 2.3
Italy
Costa Rica
Central African Republic
Hong Kong
Guatemala
Swaziland
Lithuania
Liechtenstein
St. Kitts and Nevis
Tuvalu
Tanzania
Spain
Somalia
Venezuela
Burundi
Peru
Poland
Latvia
Hungary
Romania
Angola
United States
Kosovo
Norway
Fiji
Nicaragua
Honduras
Cyprus
Iceland
Argentina
Mongolia
Czech Republic
Cambodia
Switzerland
Sweden
South Sudan
Government Restrictions Index (cont.)

TRENDS IN GLOBAL RESTRICTIONS ON RELIGION
www.pewresearch.org
47
NORTH KOREA: The sources used for this study clearly indicate that the government of North Korea is among the most repressive in the world with respect to religion as well as other civil liberties. But because North Korean society is effectively closed to outsiders, the sources are unable to provide the kind of specific and timely information that Pew Research coded in this quantitative study. Therefore, the report does not include a score for North Korea on either index.
SOMALIA: Starting with data covering 2013, researchers changed the way they coded government restrictions in Somalia. See the Methodology for more details.
PALESTINIAN TERRITORIES: The Palestinian territories’ score on government restrictions reflects the policies of the Palestinian Authority government (headed by Mahmoud Abbas and headquartered in the West Bank) rather than the actions of Hamas in Gaza (which is not recognized by most of the sources for this report as a legitimate government).
Note: The current report corrects for a minor error in rounding procedures in the previous report; the new procedure was applied to data for both 2014 and 2013 to ensure consistency. The updating resulted in a change to one country’s score on the Government Restrictions Index for 2013: The Palestinian territories, which was reported as having moderate government restrictions on religion in 2013, should have been categorized as having high government restrictions. Users of the data should note this update when comparing results to those printed in the February 2015 report “Latest Trends in Religious Restrictions and Hostilities.”

PEW RESEARCH CENTER
www.pewresearch.org
48
Bahrain
Bosnia-Herzegovina
Djibouti
Denmark
Netherlands
Bulgaria
Nepal
Romania
Cyprus
Vietnam
Zambia
Niger
Tuvalu
Bhutan
Burkina Faso
Papua New Guinea
Germany
Montenegro
Norway
South Africa
Zimbabwe
Comoros
Ireland
Brunei
Timor-Leste
South Sudan
Australia
Colombia
Croatia
Hungary
Samoa
Czech Republic
France
United States
Italy
Turkey
Kosovo
Jordan
Georgia
Ukraine
Sweden
Iran
Azerbaijan
Maldives
United Kingdom
Mexico
Uganda
Greece
Armenia
Moldova
Mali
Saudi Arabia
HighSCORES 3.6 TO 7.1
Libya
Indonesia
Kenya
Somalia
Central African Republic
Egypt
Algeria
Russia
Sudan
Burma (Myanmar)
Malaysia
Thailand
Bangladesh
Tunisia
ModerateSCORES 1.5 TO 3.5
Kuwait
Brazil
Tanzania
China
Guinea
Ethiopia
Laos
Very HighSCORES 7.2 AND HIGHER
Israel
Iraq
Syria
Yemen
Pakistan
Sri Lanka
India
Afghanistan
Lebanon
Palestinian territories
Nigeria
Denotes an increase of one point or more from 2013 to 2014. Denotes a decrease of one point or more from 2013 to 2014.
Appendix B: Social Hostilities IndexThe following table shows all 198 countries and territories in descending order of their scores on the Pew Research Center’s index of social hostilities involving religion as of the end of 2014. The Center has not attached numerical rankings to the countries because there are numerous tie scores and the differences between the scores of countries that are close to each other on this table are not necessarily meaningful.
See page 50 for a note on North Korea.
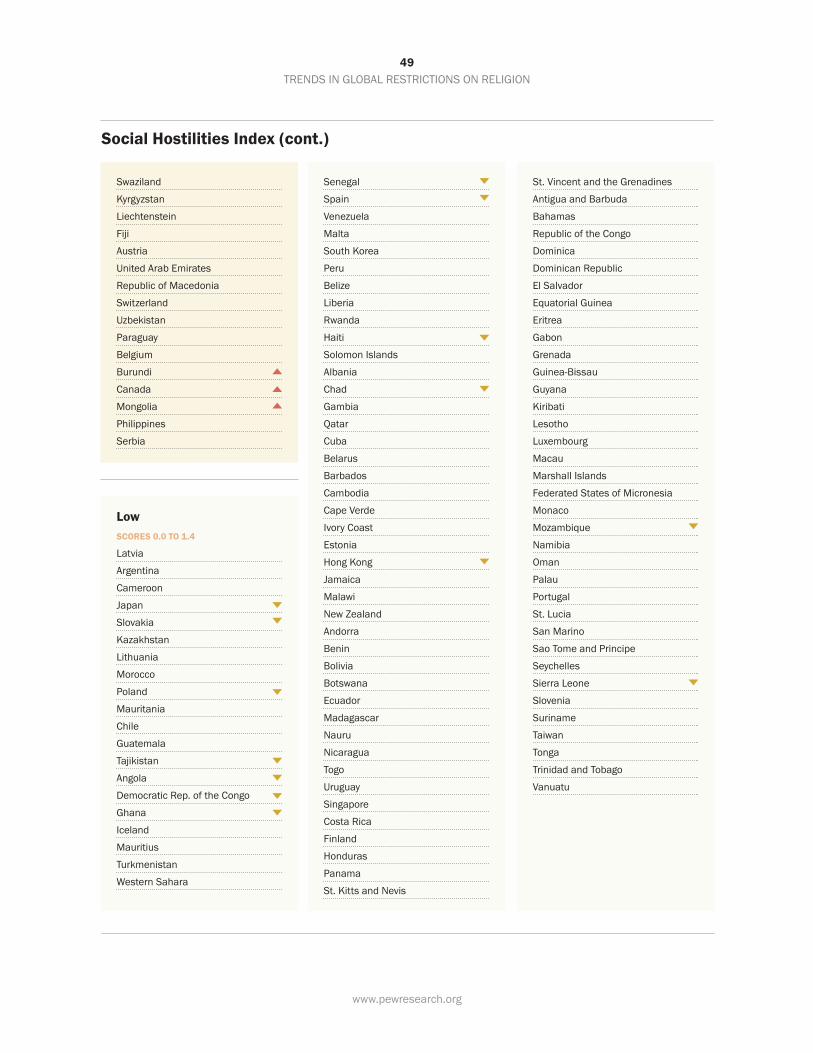
TRENDS IN GLOBAL RESTRICTIONS ON RELIGION
www.pewresearch.org
49
LowSCORES 0.0 TO 1.4
Latvia
Argentina
Cameroon
Japan
Slovakia
Kazakhstan
Lithuania
Morocco
Poland
Mauritania
Chile
Guatemala
Tajikistan
Angola
Democratic Rep. of the Congo
Ghana
Iceland
Mauritius
Turkmenistan
Western Sahara
Senegal
Spain
Venezuela
Malta
South Korea
Peru
Belize
Liberia
Rwanda
Haiti
Solomon Islands
Albania
Chad
Gambia
Qatar
Cuba
Belarus
Barbados
Cambodia
Cape Verde
Ivory Coast
Estonia
Hong Kong
Jamaica
Malawi
New Zealand
Andorra
Benin
Bolivia
Botswana
Ecuador
Madagascar
Nauru
Nicaragua
Togo
Uruguay
Singapore
Costa Rica
Finland
Honduras
Panama
St. Kitts and Nevis
St. Vincent and the Grenadines
Antigua and Barbuda
Bahamas
Republic of the Congo
Dominica
Dominican Republic
El Salvador
Equatorial Guinea
Eritrea
Gabon
Grenada
Guinea-Bissau
Guyana
Kiribati
Lesotho
Luxembourg
Macau
Marshall Islands
Federated States of Micronesia
Monaco
Mozambique
Namibia
Oman
Palau
Portugal
St. Lucia
San Marino
Sao Tome and Principe
Seychelles
Sierra Leone
Slovenia
Suriname
Taiwan
Tonga
Trinidad and Tobago
Vanuatu
Swaziland
Kyrgyzstan
Liechtenstein
Fiji
Austria
United Arab Emirates
Republic of Macedonia
Switzerland
Uzbekistan
Paraguay
Belgium
Burundi
Canada
Mongolia
Philippines
Serbia
Social Hostilities Index (cont.)

PEW RESEARCH CENTER
www.pewresearch.org
50
NORTH KOREA: The sources used for this study clearly indicate that the government of North Korea is among the most repressive in the world with respect to religion as well as other civil liberties. But because North Korean society is effectively closed to outsiders, the sources are unable to provide the kind of specific and timely information that Pew Research coded in this quantitative study. Therefore, the report does not include a score for North Korea on either index.

TRENDS IN GLOBAL RESTRICTIONS ON RELIGION
www.pewresearch.org
51
Appendix C: Religious restrictions index scores by regionScores in the table below express the levels of religious restrictions according to Pew Research Center’s Government Restrictions Index (GRI) and Social Hostilities Index (SHI).
Americas 35 countriesbaseline
year, ending JUN 2007
previous year, ending
DEC 2013
latest year, ending
DEC 2014
COUNTRY GRI SHI GRI SHI GRI SHI
Antigua and Barbuda 1.1 0.3 2.3 0.1 1.9 0.0
Argentina 1.7 0.6 2.0 1.4 2.5 1.4
Bahamas 1.4 0.5 3.0 0.0 3.6 0.0
Barbados 0.8 0.3 1.5 0.1 1.5 0.4
Belize 1.3 0.0 1.1 0.0 1.2 0.8
Bolivia 1.0 0.0 1.5 0.0 1.9 0.3
Brazil 0.4 0.8 0.2 3.7 0.7 3.5
Canada 1.0 1.2 1.2 1.2 1.2 1.5
Chile 1.2 0.4 1.6 1.2 1.3 1.2
Colombia 1.8 3.3 1.6 2.1 1.6 2.2
Costa Rica 1.0 0.0 2.8 0.1 2.3 0.1
Cuba 4.5 0.0 5.2 0.0 4.5 0.5
Dominica 0.8 0.3 1.3 0.0 1.5 0.0
Dominican Republic 0.6 0.0 1.5 0.0 1.5 0.0
Ecuador 1.1 0.6 0.7 0.1 0.8 0.3
El Salvador 0.6 0.4 1.5 0.0 1.4 0.0
Grenada 0.5 0.0 0.8 0.0 0.8 0.0
Guatemala 1.2 1.0 1.9 1.2 2.1 1.2
Guyana 0.7 0.0 1.2 0.0 1.2 0.0
Haiti 1.8 0.6 1.5 2.2 1.9 0.6
Honduras 1.3 0.3 2.0 0.3 2.6 0.1
Jamaica 1.0 0.0 1.5 0.4 1.6 0.4
Mexico 4.7 5.5 3.4 3.7 4.5 4.2
Nicaragua 2.1 0.5 2.4 0.0 2.6 0.3
Panama 0.7 0.0 1.3 0.0 1.8 0.1
Paraguay 0.6 0.7 1.1 1.6 1.3 1.6
Peru 1.8 0.0 2.9 0.6 2.9 0.8
St. Kitts and Nevis 0.6 0.3 2.0 0.1 2.0 0.1
St. Lucia 0.6 0.3 1.8 0.0 1.8 0.0
St. Vincent and the Grenadines 0.6 0.3 1.6 0.1 1.6 0.1
Suriname 0.0 0.0 0.2 0.6 0.2 0.0
latest year, ending
DEC 2014
GRI SHI
1.9 0.0
2.5 1.4
3.6 0.0
1.5 0.4
1.2 0.8
1.9 0.3
0.7 3.5
1.2 1.5
1.3 1.2
1.6 2.2
2.3 0.1
4.5 0.5
1.5 0.0
1.5 0.0
0.8 0.3
1.4 0.0
0.8 0.0
2.1 1.2
1.2 0.0
1.9 0.6
2.6 0.1
1.6 0.4
4.5 4.2
2.6 0.3
1.8 0.1
1.3 1.6
2.9 0.8
2.0 0.1
1.8 0.0
1.6 0.1
0.2 0.0

PEW RESEARCH CENTER
www.pewresearch.org
52
Religious restrictions index scores by region (cont.)
Trinidad and Tobago 0.3 0.6 1.1 0.0 1.1 0.0
United States 1.6 1.9 3.0 3.1 2.7 5.2
Uruguay 0.3 0.6 0.8 0.3 0.8 0.3
Venezuela 3.6 0.8 2.9 0.7 2.9 1.0
Asia-Pacifi c 50 countriesbaseline
year, ending JUN 2007
previous year, ending
DEC 2013
latest year, ending
DEC 2014
COUNTRY GRI SHI GRI SHI GRI SHI
Afghanistan 5.3 8.5 8.0 7.8 6.5 7.7
Armenia 3.4 2.7 5.2 5.3 4.5 4.0
Australia 1.3 1.8 1.4 1.4 1.0 2.2
Azerbaijan 5.0 2.9 7.3 3.4 7.5 4.4
Bangladesh 4.0 8.3 5.2 8.7 4.3 5.8
Bhutan 4.4 1.9 5.0 1.8 4.5 2.6
Brunei 7.2 4.2 6.9 3.1 5.6 2.3
Burma (Myanmar) 7.9 4.9 7.7 6.6 6.5 6.2
Cambodia 2.9 0.8 2.2 0.4 2.4 0.4
China 7.8 0.9 9.1 4.4 8.6 3.3
Cyprus 1.2 0.9 2.5 3.2 2.6 2.8
Federated States of Micronesia 0.2 0.0 0.2 0.0 0.2 0.0
Fiji 0.9 2.6 1.7 1.9 2.6 1.9
Hong Kong 1.0 0.8 2.9 2.2 2.3 0.4
India 4.8 8.8 5.0 9.0 4.5 7.9
Indonesia 6.2 8.3 8.5 7.8 7.9 7.1
Iran 7.9 6.0 8.3 5.2 7.7 4.5
Japan 0.2 0.4 1.1 2.4 0.7 1.4
Kazakhstan 5.6 3.1 6.0 1.0 7.5 1.3
Kiribati 0.3 0.8 0.9 0.5 0.9 0.0
Kyrgyzstan 3.9 5.5 5.7 1.9 6.0 2.0
Laos 6.3 1.0 6.1 1.5 7.0 3.2
latest year, ending
DEC 2014
GRI SHI
6.5 7.7
4.5 4.0
1.0 2.2
7.5 4.4
4.3 5.8
4.5 2.6
5.6 2.3
6.5 6.2
2.4 0.4
8.6 3.3
2.6 2.8
0.2 0.0
2.6 1.9
2.3 0.4
4.5 7.9
7.9 7.1
7.7 4.5
0.7 1.4
7.5 1.3
0.9 0.0
6.0 2.0
7.0 3.2
Americas 35 countries (cont.)baseline
year, ending JUN 2007
previous year, ending
DEC 2013
latest year, ending
DEC 2014
COUNTRY GRI SHI GRI SHI GRI SHI
1.1 0.0
2.7 5.2
0.8 0.3
2.9 1.0
latest year, ending
DEC 2014
GRI SHI

TRENDS IN GLOBAL RESTRICTIONS ON RELIGION
www.pewresearch.org
53
Religious restrictions index scores by region (cont.)
Macau 1.3 0.3 0.8 0.0 0.8 0.0
Malaysia 6.4 1.0 7.9 2.9 7.0 6.0
Maldives 6.5 2.6 6.5 3.9 6.8 4.4
Marshall Islands 0.2 0.0 0.2 0.0 0.2 0.0
Mongolia 1.9 0.6 2.8 0.8 2.5 1.5
Nauru 2.0 0.3 1.3 0.3 0.8 0.3
Nepal 3.4 4.2 3.9 5.8 3.1 2.8
New Zealand 0.3 0.4 0.8 0.9 0.0 0.4
Pakistan 5.8 8.9 6.4 8.8 6.5 8.1
Palau 0.6 0.3 0.2 0.0 0.2 0.0
Papua New Guinea 0.8 0.0 1.0 2.3 1.2 2.6
Philippines 1.6 3.7 1.0 3.2 0.7 1.5
Samoa 0.8 0.4 0.8 2.2 0.8 2.2
Singapore 4.6 0.2 6.6 1.0 6.4 0.2
Solomon Islands 0.6 0.4 1.0 0.6 1.0 0.6
South Korea 1.6 0.0 2.0 0.3 2.0 0.9
Sri Lanka 4.0 7.8 5.3 8.3 5.0 8.0
Taiwan 0.5 0.0 0.9 0.0 0.7 0.0
Tajikistan 4.5 2.2 6.8 2.2 6.6 1.1
Thailand 2.6 2.6 4.4 6.2 4.4 5.9
Timor-Leste 0.9 4.2 1.4 3.1 1.5 2.3
Tonga 2.0 0.0 1.8 0.0 1.8 0.0
Turkey 6.6 4.7 7.4 4.5 8.1 5.1
Turkmenistan 5.6 1.5 6.4 0.4 7.1 1.0
Tuvalu 1.8 2.1 3.3 3.7 3.1 2.6
Uzbekistan 7.7 3.3 8.3 1.5 8.2 1.6
Vanuatu 1.0 1.0 1.2 0.0 1.2 0.0
Vietnam 6.6 1.2 6.1 3.6 6.1 2.7
Asia-Pacifi c 50 countries (cont.)baseline
year, ending JUN 2007
previous year, ending
DEC 2013
latest year, ending
DEC 2014
COUNTRY GRI SHI GRI SHI GRI SHI
0.8 0.0
7.0 6.0
6.8 4.4
0.2 0.0
2.5 1.5
0.8 0.3
3.1 2.8
0.0 0.4
6.5 8.1
0.2 0.0
1.2 2.6
0.7 1.5
0.8 2.2
6.4 0.2
1.0 0.6
2.0 0.9
5.0 8.0
0.7 0.0
6.6 1.1
4.4 5.9
1.5 2.3
1.8 0.0
8.1 5.1
7.1 1.0
3.1 2.6
8.2 1.6
1.2 0.0
6.1 2.7
latest year, ending
DEC 2014
GRI SHI

PEW RESEARCH CENTER
www.pewresearch.org
54
Religious restrictions index scores by region (cont.)
Europe 45 countriesbaseline
year, ending JUN 2007
previous year, ending
DEC 2013
latest year, ending
DEC 2014
COUNTRY GRI SHI GRI SHI GRI SHI
Albania 0.8 0.2 2.2 0.3 1.0 0.6
Andorra 0.9 0.0 1.2 0.0 0.9 0.3
Austria 2.6 1.1 3.1 1.9 3.4 1.9
Belarus 5.9 1.4 6.3 1.2 5.8 0.5
Belgium 4.0 0.9 3.8 1.6 3.5 1.5
Bosnia-Herzegovina 1.5 2.4 2.3 4.2 2.0 3.0
Bulgaria 4.0 2.2 5.4 3.6 5.5 2.8
Croatia 0.7 2.0 1.5 2.7 1.4 2.2
Czech Republic 1.0 1.2 1.1 2.7 2.5 2.0
Denmark 2.5 1.2 3.2 1.6 3.5 2.9
Estonia 1.1 0.8 1.4 0.0 1.4 0.4
Finland 0.6 0.8 2.3 0.1 1.3 0.1
France 3.3 3.4 4.2 5.1 4.4 5.4
Georgia 2.2 4.7 3.1 4.5 3.6 4.7
Germany 3.1 2.1 4.5 4.3 3.4 2.5
Greece 5.2 4.4 4.4 5.3 4.4 4.1
Hungary 0.3 1.0 2.9 2.4 2.8 2.2
Iceland 2.6 0.4 3.4 0.6 2.6 1.0
Ireland 0.6 0.4 1.5 1.8 0.8 2.4
Italy 2.0 1.9 2.0 3.7 2.3 5.1
Kosovo 1.9 2.4 2.5 5.3 2.6 5.1
Latvia 2.3 1.4 2.9 1.2 2.8 1.4
Liechtenstein 1.3 0.1 1.9 1.9 2.1 1.9
Lithuania 1.7 0.8 2.3 0.8 2.1 1.3
Luxembourg 0.8 0.0 1.5 0.0 1.5 0.0
Malta 1.2 0.4 1.1 0.9 1.0 0.9
Moldova 4.2 3.8 4.4 3.8 3.5 3.8
Monaco 2.5 0.0 2.0 0.0 1.5 0.0
Montenegro 0.9 2.4 1.9 2.5 1.5 2.5
Netherlands 0.4 1.0 1.9 2.1 1.4 2.9
Norway 1.5 1.0 2.5 2.4 2.6 2.5
Poland 1.0 0.9 2.2 2.8 2.8 1.3
Portugal 0.3 0.0 1.1 0.0 0.9 0.0
latest year, ending
DEC 2014
GRI SHI
1.0 0.6
0.9 0.3
3.4 1.9
5.8 0.5
3.5 1.5
2.0 3.0
5.5 2.8
1.4 2.2
2.5 2.0
3.5 2.9
1.4 0.4
1.3 0.1
4.4 5.4
3.6 4.7
3.4 2.5
4.4 4.1
2.8 2.2
2.6 1.0
0.8 2.4
2.3 5.1
2.6 5.1
2.8 1.4
2.1 1.9
2.1 1.3
1.5 0.0
1.0 0.9
3.5 3.8
1.5 0.0
1.5 2.5
1.4 2.9
2.6 2.5
2.8 1.3
0.9 0.0

TRENDS IN GLOBAL RESTRICTIONS ON RELIGION
www.pewresearch.org
55
Republic of Macedonia 2.2 1.5 2.5 2.4 3.2 1.7
Romania 4.8 5.5 4.5 5.3 2.8 2.8
Russia 5.8 3.7 7.4 8.1 6.7 6.6
San Marino 0.1 0.0 0.3 0.0 0.3 0.0
Serbia 3.1 1.5 3.4 2.3 3.8 1.5
Slovakia 2.8 1.9 3.0 1.5 3.4 1.4
Slovenia 0.6 1.0 0.7 0.9 1.0 0.0
Spain 2.0 1.6 3.0 2.4 3.0 1.0
Sweden 1.2 0.7 3.6 4.2 2.4 4.6
Switzerland 1.2 1.7 2.6 1.9 2.4 1.7
Ukraine 2.6 1.9 4.1 2.9 4.0 4.7
United Kingdom 1.6 1.6 1.7 5.4 1.6 4.4
Religious restrictions index scores by region (cont.)
Middle East-North Africa20 countries
baseline year, ending
JUN 2007
previous year, ending
DEC 2013
latest year, ending
DEC 2014
COUNTRY GRI SHI GRI SHI GRI SHI
Algeria 5.6 3.6 6.1 5.9 5.8 6.6
Bahrain 4.3 3.0 6.5 3.5 6.2 3.0
Egypt 7.2 6.1 8.2 7.7 8.3 6.8
Iraq 5.1 10.0 6.4 7.4 6.4 8.5
Israel 3.9 7.8 5.7 9.0 5.5 9.1
Jordan 4.6 3.5 6.2 2.9 5.5 5.0
Kuwait 4.8 1.9 5.4 3.6 5.4 3.5
Lebanon 1.4 5.1 4.0 6.1 3.7 7.6
Libya 5.1 1.4 4.7 6.9 4.7 7.1
Morocco 4.9 3.7 6.3 1.2 5.3 1.3
Oman 3.9 0.3 5.2 0.1 4.7 0.0
Palestinian territories 3.3 6.4 4.5 8.8 4.2 7.6
Qatar 3.3 0.3 6.0 0.6 4.9 0.6
Saudi Arabia 8.0 7.2 7.8 3.6 7.6 3.6
latest year, ending
DEC 2014
GRI SHI
5.8 6.6
6.2 3.0
8.3 6.8
6.4 8.5
5.5 9.1
5.5 5.0
5.4 3.5
3.7 7.6
4.7 7.1
5.3 1.3
4.7 0.0
4.2 7.6
4.9 0.6
7.6 3.6
Europe 45 countries (cont.)baseline
year, ending JUN 2007
previous year, ending
DEC 2013
latest year, ending
DEC 2014
COUNTRY GRI SHI GRI SHI GRI SHI
3.2 1.7
2.8 2.8
6.7 6.6
0.3 0.0
3.8 1.5
3.4 1.4
1.0 0.0
3.0 1.0
2.4 4.6
2.4 1.7
4.0 4.7
1.6 4.4
latest year, ending
DEC 2014
GRI SHI

PEW RESEARCH CENTER
www.pewresearch.org
56
Sudan 5.7 6.5 7.0 6.5 6.4 6.4
Syria 4.5 5.3 7.4 7.8 7.6 8.3
Tunisia 4.8 3.8 4.9 5.8 4.7 5.5
United Arab Emirates 3.9 0.1 4.6 1.5 4.2 1.9
Western Sahara 4.8 3.3 6.2 0.0 6.2 1.0
Yemen 4.3 6.2 5.8 7.1 4.7 8.1
Religious restrictions index scores by region (cont.)
Sub-Saharan Africa 48 countriesbaseline
year, ending JUN 2007
previous year, ending
DEC 2013
latest year, ending
DEC 2014
COUNTRY GRI SHI GRI SHI GRI SHI
Angola 3.3 3.7 5.0 2.9 2.7 1.0
Benin 0.3 0.0 0.3 0.4 0.4 0.3
Botswana 0.9 0.1 0.7 0.0 0.8 0.3
Burkina Faso 0.3 1.5 1.3 3.1 0.4 2.6
Burundi 0.4 0.9 2.3 1.0 2.9 1.5
Cameroon 1.1 1.4 1.8 0.6 0.6 1.4
Cape Verde 0.3 0.1 0.3 0.4 0.4 0.4
Central African Republic 3.7 3.3 4.2 7.6 2.3 6.9
Chad 4.2 3.3 3.0 2.2 1.6 0.6
Comoros 5.4 6.2 4.0 2.9 3.6 2.4
Democratic Republic of the Congo 1.3 2.6 1.1 2.3 1.2 1.0
Djibouti 2.4 1.8 5.1 1.2 4.0 3.0
Equatorial Guinea 2.6 0.0 2.1 0.0 3.1 0.0
Eritrea 7.0 0.4 6.9 0.2 6.5 0.0
Ethiopia 2.6 5.3 4.6 4.8 3.6 3.2
Gabon 1.7 0.1 0.5 1.0 1.0 0.0
Gambia 0.5 0.8 1.8 0.3 1.8 0.6
Ghana 1.2 4.9 1.3 2.7 0.8 1.0
Guinea 1.5 1.7 2.1 1.7 3.4 3.3
latest year, ending
DEC 2014
GRI SHI
2.7 1.0
0.4 0.3
0.8 0.3
0.4 2.6
2.9 1.5
0.6 1.4
0.4 0.4
2.3 6.9
1.6 0.6
3.6 2.4
1.2 1.0
4.0 3.0
3.1 0.0
6.5 0.0
3.6 3.2
1.0 0.0
1.8 0.6
0.8 1.0
3.4 3.3
Middle East-North Africa 20 countries (cont.)
baseline year, ending
JUN 2007
previous year, ending
DEC 2013
latest year, ending
DEC 2014
COUNTRY GRI SHI GRI SHI GRI SHI
6.4 6.4
7.6 8.3
4.7 5.5
4.2 1.9
6.2 1.0
4.7 8.1
latest year, ending
DEC 2014
GRI SHI

TRENDS IN GLOBAL RESTRICTIONS ON RELIGION
www.pewresearch.org
57
Guinea-Bissau 1.6 0.0 0.8 0.0 0.4 0.0
Ivory Coast 1.9 3.1 0.7 0.8 1.3 0.4
Kenya 2.9 2.4 3.7 7.3 3.9 7.1
Lesotho 0.4 0.0 0.5 0.0 0.7 0.0
Liberia 1.7 3.8 1.4 1.0 1.4 0.8
Madagascar 1.8 0.0 3.4 0.4 3.1 0.3
Malawi 0.4 0.3 0.8 1.3 1.1 0.4
Mali 0.9 0.3 1.8 3.6 0.5 3.7
Mauritania 6.5 0.9 5.9 1.3 5.5 1.2
Mauritius 1.4 0.3 1.4 1.0 1.2 1.0
Mozambique 1.1 0.3 1.9 1.7 1.6 0.0
Namibia 0.3 0.0 0.4 0.0 0.7 0.0
Niger 1.7 1.5 1.7 4.0 1.4 2.6
Nigeria 3.7 4.4 4.1 8.7 4.3 7.4
Republic of the Congo 0.7 0.4 0.7 0.0 1.1 0.0
Rwanda 2.0 0.0 4.8 0.0 3.5 0.8
Sao Tome and Principe 0.2 0.0 0.3 0.0 0.2 0.0
Senegal 0.5 0.0 1.2 1.7 1.1 1.0
Seychelles 1.3 0.0 2.3 0.0 1.5 0.0
Sierra Leone 0.0 0.0 1.4 1.9 0.8 0.0
Somalia 4.4 7.4 4.0 7.8 2.9 7.1
South Africa 0.6 2.2 0.7 1.0 0.8 2.4
South Sudan* 0 0 3.4 2.4 2.4 2.3
Swaziland 1.5 0.0 2.1 3.1 2.1 2.0
Tanzania 2.1 3.5 3.3 7.8 3.1 3.4
Togo 2.8 0.0 1.5 0.0 1.9 0.3
Uganda 2.4 0.4 3.7 4.1 4.8 4.2
Zambia 2.0 0.0 2.9 1.5 3.2 2.7
Zimbabwe 2.9 1.2 2.8 1.5 3.4 2.4
Religious restrictions index scores by region (cont.)
* South Sudan was coded for the fi rst time in 2011.
Sub-Saharan Africa 48 countries (cont.)
baseline year, ending
JUN 2007
previous year, ending
DEC 2013
latest year, ending
DEC 2014
COUNTRY GRI SHI GRI SHI GRI SHI
0.4 0.0
1.3 0.4
3.9 7.1
0.7 0.0
1.4 0.8
3.1 0.3
1.1 0.4
0.5 3.7
5.5 1.2
1.2 1.0
1.6 0.0
0.7 0.0
1.4 2.6
4.3 7.4
1.1 0.0
3.5 0.8
0.2 0.0
1.1 1.0
1.5 0.0
0.8 0.0
2.9 7.1
0.8 2.4
2.4 2.3
2.1 2.0
3.1 3.4
1.9 0.3
4.8 4.2
3.2 2.7
3.4 2.4
latest year, ending
DEC 2014
GRI SHI

PEW RESEARCH CENTER
www.pewresearch.org
58
Appendix D: Summary of results
Government Restrictions on Religion
To assess the level of restrictions on religion by governments around the world, the Pew Research Center selected the following 20 questions for the Government Restrictions Index (GRI). Pew Research staff then combed through 17 published sources of information, including reports by the U.S. State Department, the United Nations and various nongovernmental organizations, to answer the questions on a country-by-country basis. (For more details, see the Methodology.)
This summary shows the questions, followed by various possible answers and the number and percentage of countries that fell into each category, according to the multiple sources analyzed by Pew Research. For example, on Question No. 5 – “Is public preaching by religious groups limited by any level of government?” – the study found that for the latest year, ending on Dec. 31, 2014, 133 countries (67%) had no reported limits on preaching, 38 countries (19%) had limits on preaching for some religious groups and 27 countries (14%) had limits on preaching for all religious groups.
Additionally, the summary shows whether particular religious restrictions occurred during the previous year, ending Dec. 31, 2013, or in the study’s baseline year, ending in mid-2007. A total of 197 countries are shown for the baseline year; South Sudan was coded for the first time in 2011, bringing the previous and latest years’ totals to 198 countries. To see how each country scored on each question, see the Results by Country online.
When comparing these results with the Pew Research Center’s previous reports, readers should keep in mind that reports before 2011 showed the number of countries in which particular religious restrictions occurred at any time during two overlapping periods: July 1, 2006, through June 30, 2008, and July 1, 2007, through June 30, 2009. Because this report presents data on an annual basis, the incidents for a single year may be less than when two years were taken into account.
Some differences from year to year might not be as significant as they appear due to minor changes in coding procedures and changes in the amount of information available between years. For example, sources for the most recent period studied sometimes had less information on incidents in a country than sources previously had reported. Such additional information may reflect either an actual decrease in restrictions in a country, streamlined reporting for that country or both. (For more details, see the Methodology.)
Percentages may not add to 100 due to rounding.

TRENDS IN GLOBAL RESTRICTIONS ON RELIGION
www.pewresearch.org
59
1
1 Article 18 states: “Everyone has the right to freedom of thought, conscience and religion; this right includes freedom to change his religion or belief, and freedom, either alone or in community with others and in public or private, to manifest his religion or belief in teaching, practice, worship and observance.”
GRI.Q.1Does the constitution, or law that functions in the place of a constitution (basic law), specifically provide for “freedom of religion” or include language used in Article 18 of the United Nations Universal Declaration of Human Rights?
baseline year, ending JUN 2007
previous year, ending DEC 2013
latest year, ending DEC 2014
NUMBER OF COUNTRIES
% OF COUNTRIES
NUMBER OF COUNTRIES
% OF COUNTRIES
NUMBER OF COUNTRIES
% OF COUNTRIES
Yes 143 73% 145 73% 144 73%
The constitution or basic law does not specifically provide for freedom of re-ligion but does protect some religious practices
47 24 47 24 47 24
No 7 4 6 3 7 4
197 100 198 100 198 100
GRI.Q.2Does the constitution or basic law include stipulations that appear to qualify or substantially contradict the concept of “religious freedom”?
baseline year, ending JUN 2007
previous year, ending DEC 2013
latest year, ending DEC 2014
NUMBER OF COUNTRIES
% OF COUNTRIES
NUMBER OF COUNTRIES
% OF COUNTRIES
NUMBER OF COUNTRIES
% OF COUNTRIES
No 41 21% 38 19% 38 19%
Yes, there is a qualification 39 20 39 20 39 20
Yes, there is a substantial contradic-tion and only some religious practices are protected
110 56 115 58 114 58
Religious freedom is not provided in the first place
7 4 6 3 7 4
197 100 198 100 198 100

PEW RESEARCH CENTER
www.pewresearch.org
60
GRI.Q.3Taken together, how do the constitution/basic law and other national laws and policies affect religious freedom?
baseline year, ending JUN 2007
previous year, ending DEC 2013
latest year, ending DEC 2014
NUMBER OF COUNTRIES
% OF COUNTRIES
NUMBER OF COUNTRIES
% OF COUNTRIES
NUMBER OF COUNTRIES
% OF COUNTRIES
National laws and policies provide for religious freedom, and the national government respects religious free-dom in practice
63 32% 71 36% 69 35%
National laws and policies provide for religious freedom, and the national government generally respects reli-gious freedom in practice; but there are some instances (e.g., in certain localities) where religious freedom is not respected in practice
94 48 67 34 71 36
There are limited national legal protections for religious freedom, but the national government does not generally respect religious freedom in practice
38 19 48 24 46 23
National laws and policies do not provide for religious freedom and the national government does not respect religious freedom in practice
2 1 12 6 12 6
197 100 198 100 198 100

TRENDS IN GLOBAL RESTRICTIONS ON RELIGION
www.pewresearch.org
61
GRI.Q.4Does any level of government interfere with worship or other religious practices?
baseline year, ending JUN 2007
previous year, ending DEC 2013
latest year, ending DEC 2014
NUMBER OF COUNTRIES
% OF COUNTRIES
NUMBER OF COUNTRIES
% OF COUNTRIES
NUMBER OF COUNTRIES
% OF COUNTRIES
No 85 43% 63 32% 71 36%
Yes, in a few cases 44 22 21 11 20 10
Yes, in many cases 32 16 48 24 49 25
Government prohibits worship or religious practices of one or more religious groups as a general policy
36 18 66 33 58 29
197 100 198 100 198 100
GRI.Q.5Is public preaching by religious groups limited by any level of government?
baseline year, ending JUN 2007
previous year, ending DEC 2013
latest year, ending DEC 2014
NUMBER OF COUNTRIES
% OF COUNTRIES
NUMBER OF COUNTRIES
% OF COUNTRIES
NUMBER OF COUNTRIES
% OF COUNTRIES
No 141 72% 131 66% 133 67%
Yes, for some religious groups 32 16 37 19 38 19
Yes, for all religious groups 24 12 30 15 27 14
197 100 198 100 198 100
GRI.Q.6Is proselytizing limited by any level of government?
baseline year, ending JUN 2007
previous year, ending DEC 2013
latest year, ending DEC 2014
NUMBER OF COUNTRIES
% OF COUNTRIES
NUMBER OF COUNTRIES
% OF COUNTRIES
NUMBER OF COUNTRIES
% OF COUNTRIES
No 132 67% 132 67% 134 68%
Yes, for some religious groups 39 20 42 21 39 20
Yes, for all religious groups 26 13 24 12 25 13
197 100 198 100 198 100

PEW RESEARCH CENTER
www.pewresearch.org
62
GRI.Q.7Is converting from one religion to another limited by any level of government?
baseline year, ending JUN 2007
previous year, ending DEC 2013
latest year, ending DEC 2014
NUMBER OF COUNTRIES
% OF COUNTRIES
NUMBER OF COUNTRIES
% OF COUNTRIES
NUMBER OF COUNTRIES
% OF COUNTRIES
No 166 84% 159 80% 160 81%
Yes 31 16 39 20 38 19
197 100 198 100 198 100
GRI.Q.8
Is religious literature or broadcasting limited by any level of government?
baseline year, ending JUN 2007
previous year, ending DEC 2013
latest year, ending DEC 2014
NUMBER OF COUNTRIES
% OF COUNTRIES
NUMBER OF COUNTRIES
% OF COUNTRIES
NUMBER OF COUNTRIES
% OF COUNTRIES
No 130 66% 105 53% 107 54%
Yes 67 34 93 47 91 46
197 100 198 100 198 100
GRI.Q.9Are foreign missionaries allowed to operate?
baseline year, ending JUN 2007
previous year, ending DEC 2013
latest year, ending DEC 2014
NUMBER OF COUNTRIES
% OF COUNTRIES
NUMBER OF COUNTRIES
% OF COUNTRIES
NUMBER OF COUNTRIES
% OF COUNTRIES
Yes 117 59% 114 58% 115 58%
Yes, but with restrictions 72 37 77 39 75 38
No 8 4 7 4 8 4
197 100 198 100 198 100

TRENDS IN GLOBAL RESTRICTIONS ON RELIGION
www.pewresearch.org
63
GRI.Q.10Is the wearing of religious symbols, such as head coverings for women and facial hair for men, regulated by law or by any level of government?
baseline year, ending JUN 2007
previous year, ending DEC 2013
latest year, ending DEC 2014
NUMBER OF COUNTRIES
% OF COUNTRIES
NUMBER OF COUNTRIES
% OF COUNTRIES
NUMBER OF COUNTRIES
% OF COUNTRIES
No 176 89% 150 76% 150 76%
Yes 21 11 48 24 48 24
197 100 198 100 198 100
GRI.Q.11Was there harassment or intimidation of religious groups by any level of government?
baseline year, ending JUN 2007
previous year, ending DEC 2013
latest year, ending DEC 2014
NUMBER OF COUNTRIES
% OF COUNTRIES
NUMBER OF COUNTRIES
% OF COUNTRIES
NUMBER OF COUNTRIES
% OF COUNTRIES
No 79 40% 65 33% 70 35%
Yes, there was limited intimidation 82 42 37 19 44 22
Yes, there was widespread intimidation
36 18 96 48 84 42
197 100 198 100 198 100
GRI.Q.12Did the national government display hostility involving physical violence toward minority or nonapproved religious groups?
baseline year, ending JUN 2007
previous year, ending DEC 2013
latest year, ending DEC 2014
NUMBER OF COUNTRIES
% OF COUNTRIES
NUMBER OF COUNTRIES
% OF COUNTRIES
NUMBER OF COUNTRIES
% OF COUNTRIES
No 152 77% 151 76% 157 79%
Yes 45 23 47 24 41 21
197 100 198 100 198 100

PEW RESEARCH CENTER
www.pewresearch.org
64
GRI.Q.13Were there instances when the national government did not intervene in cases of discrimination or abuses against religious groups?
baseline year, ending JUN 2007
previous year, ending DEC 2013
latest year, ending DEC 2014
NUMBER OF COUNTRIES
% OF COUNTRIES
NUMBER OF COUNTRIES
% OF COUNTRIES
NUMBER OF COUNTRIES
% OF COUNTRIES
No 157 80% 146 74% 153 77%
Yes 40 20 52 26 45 23
197 100 198 100 198 100
GRI.Q.14Does the national government have an established organization to regulate or manage religious affairs?
baseline year, ending JUN 2007
previous year, ending DEC 2013
latest year, ending DEC 2014
NUMBER OF COUNTRIES
% OF COUNTRIES
NUMBER OF COUNTRIES
% OF COUNTRIES
NUMBER OF COUNTRIES
% OF COUNTRIES
No 106 54% 76 38% 89 45%
No, but the government consults a nongovernmental advisory board
12 6 14 7 13 7
Yes, but the organization is non- coercive toward religious groups
54 27 58 29 51 26
Yes, and the organization is coercive toward religious groups
25 13 50 25 45 23
197 100 198 100 198 100
GRI.Q.15Did the national government denounce one or more religious groups by characterizing them as dangerous “cults” or “sects”?
baseline year, ending JUN 2007
previous year, ending DEC 2013
latest year, ending DEC 2014
NUMBER OF COUNTRIES
% OF COUNTRIES
NUMBER OF COUNTRIES
% OF COUNTRIES
NUMBER OF COUNTRIES
% OF COUNTRIES
No 180 91% 175 88% 182 92%
Yes 17 9 23 12 16 8
197 100 198 100 198 100

TRENDS IN GLOBAL RESTRICTIONS ON RELIGION
www.pewresearch.org
65
GRI.Q.16Does any level of government formally ban any religious group?
baseline year, ending JUN 2007
previous year, ending DEC 2013
latest year, ending DEC 2014
NUMBER OF COUNTRIES
% OF COUNTRIES
NUMBER OF COUNTRIES
% OF COUNTRIES
NUMBER OF COUNTRIES
% OF COUNTRIES
No 162 82% 161 81% 165 83%
Yes 35 18 37 19 33 17
Security reasons stated as rationale
11 6 4 2 7 4
Nonsecurity reasons stated as rationale
18 9 22 11 17 9
Both security and nonsecurity reasons stated as rationale
6 3 11 6 9 5
197 100 198 100 198 100
GRI.Q.17Were there instances when the national government attempted to eliminate an entire religious group’s presence in the country?
baseline year, ending JUN 2007
previous year, ending DEC 2013
latest year, ending DEC 2014
NUMBER OF COUNTRIES
% OF COUNTRIES
NUMBER OF COUNTRIES
% OF COUNTRIES
NUMBER OF COUNTRIES
% OF COUNTRIES
No 181 92% 174 88% 176 89%
Yes 16 8 24 12 22 11
197 100 198 100 198 100

PEW RESEARCH CENTER
www.pewresearch.org
66
GRI.Q.18Does any level of government ask religious groups to register for any reason, including to be eligible for benefits such as tax exemption?
baseline year, ending JUN 2007
previous year, ending DEC 2013
latest year, ending DEC 2014
NUMBER OF COUNTRIES
% OF COUNTRIES
NUMBER OF COUNTRIES
% OF COUNTRIES
NUMBER OF COUNTRIES
% OF COUNTRIES
No 38 19% 22 11% 22 11%
Yes, but in a nondiscriminatory way 71 36 71 36 71 36
Yes, and the process adversely af-fects the ability of some religious groups to operate
34 17 21 11 24 12
Yes, and the process clearly discriminates against some religious groups
54 27 84 42 81 41
197 100 198 100 198 100
GRI.Q.19Did any level of government use force toward religious groups that resulted in individuals being killed, physically abused, imprisoned, detained or displaced from their homes, or having their personal or religious properties dam-aged or destroyed?
baseline year, ending JUN 2007
previous year, ending DEC 2013
latest year, ending DEC 2014
NUMBER OF COUNTRIES
% OF COUNTRIES
NUMBER OF COUNTRIES
% OF COUNTRIES
NUMBER OF COUNTRIES
% OF COUNTRIES
No 136 69% 102 52% 117 59%
Yes 61 31 96 48 81 41
1-9 cases of government force 18 9 38 19 24 12
10-200 cases of government force 35 18 34 17 36 18
201-1,000 cases of government force
4 2 10 5 11 6
1,001-9,999 cases of government force
2 1 9 5 6 3
10,000+ cases of government force2 1 5 3 4 2
197 100 198 100 198 100

TRENDS IN GLOBAL RESTRICTIONS ON RELIGION
www.pewresearch.org
67
GRI.Q.19bDid any level of government use force toward religious groups that resulted in individuals being killed, physically abused, imprisoned, detained or displaced from their homes, or having their personal or religious properties damaged or destroyed?
baseline year, ending JUN 2007
previous year, ending DEC 2013
latest year, ending DEC 2014
NUMBER OF COUNTRIES
% OF COUNTRIES
NUMBER OF COUNTRIES
% OF COUNTRIES
NUMBER OF COUNTRIES
% OF COUNTRIES
No 136 69% 102 52% 117 59%
Yes ^ 61 31 96 48 81 41
Property damage 7 4 57 29 61 31
Detentions/abductions 47 24 66 33 64 32
Displacement from homes 20 10 22 11 19 10
Physical assaults 25 13 33 17 32 16
Deaths 15 8 21 11 21 11
197 100 198 100 198 100
Nested categories add to more than total because countries can have multiple types of cases of government force.^ This line represents the number or percentage of countries in which at least one of the following types of government force occurred. The number of countries with detentions/abductions in 2013 has been updated to correct a minor error in the previous report.
GRI.Q.20Do some religious groups receive government support or favors, such as funding, official recognition or special access?
baseline year, ending JUN 2007
previous year, ending DEC 2013
latest year, ending DEC 2014
NUMBER OF COUNTRIES
% OF COUNTRIES
NUMBER OF COUNTRIES
% OF COUNTRIES
NUMBER OF COUNTRIES
% OF COUNTRIES
No 17 9% 7 4% 7 4%
Yes, the government provides support to religious groups, but it does so on a more-or-less fair and equal basis
37 19 37 19 44 22
Yes, the government gives preferential support or favors to some religious group(s) and clearly discrimi-nates against others
143 73 154 78 147 74
197 100 198 100 198 100
This is a summary table that puts the restrictions identified in Questions 20.1, 20.2, 20.3.a-c, 20.4 and 20.5 into a single measure indicating the level to which a government supports religious groups in the country. Government support of a religion or religions is considered restrictive only when preferential treatment of one or more religious groups puts other religious groups at a disadvantage.

PEW RESEARCH CENTER
www.pewresearch.org
68
GRI.Q.20.1Does the country’s constitution or basic law recognize a favored religion or religions?
baseline year, ending JUN 2007
previous year, ending DEC 2013
latest year, ending DEC 2014
NUMBER OF COUNTRIES
% OF COUNTRIES
NUMBER OF COUNTRIES
% OF COUNTRIES
NUMBER OF COUNTRIES
% OF COUNTRIES
No 141 72% 121 61% 114 58%
Yes 56 28 77 39 84 42
197 100 198 100 198 100
This question is a component of GRI.Q.20. For GRI.Q.20.1, the differences between the coding periods may not be as significant as they appear due to minor changes in coding procedures.
GRI.Q.20.2Do all religious groups receive the same level of government access and privileges?
baseline year, ending JUN 2007
previous year, ending DEC 2013
latest year, ending DEC 2014
NUMBER OF COUNTRIES
% OF COUNTRIES
NUMBER OF COUNTRIES
% OF COUNTRIES
NUMBER OF COUNTRIES
% OF COUNTRIES
All religious groups are generally treated the same
39 20% 41 21% 45 23%
Some religious groups have minimal privileges unavailable to other religious groups, limited to things such as inheriting buildings or properties
7 4 23 12 15 8
Some religious groups have general privileges or government access unavailable to other religious groups
62 31 40 20 48 24
One religious group has privileges or government access unavailable to other religious groups, but it is not recognized as the country’s official religion
48 24 49 25 46 23
One religious group has privileges or government access unavailable to other religious groups, and it is recog-nized by the national government as the official religion
41 21 45 23 44 22
197 100 198 100 198 100
This question is a component of GRI.Q.20.
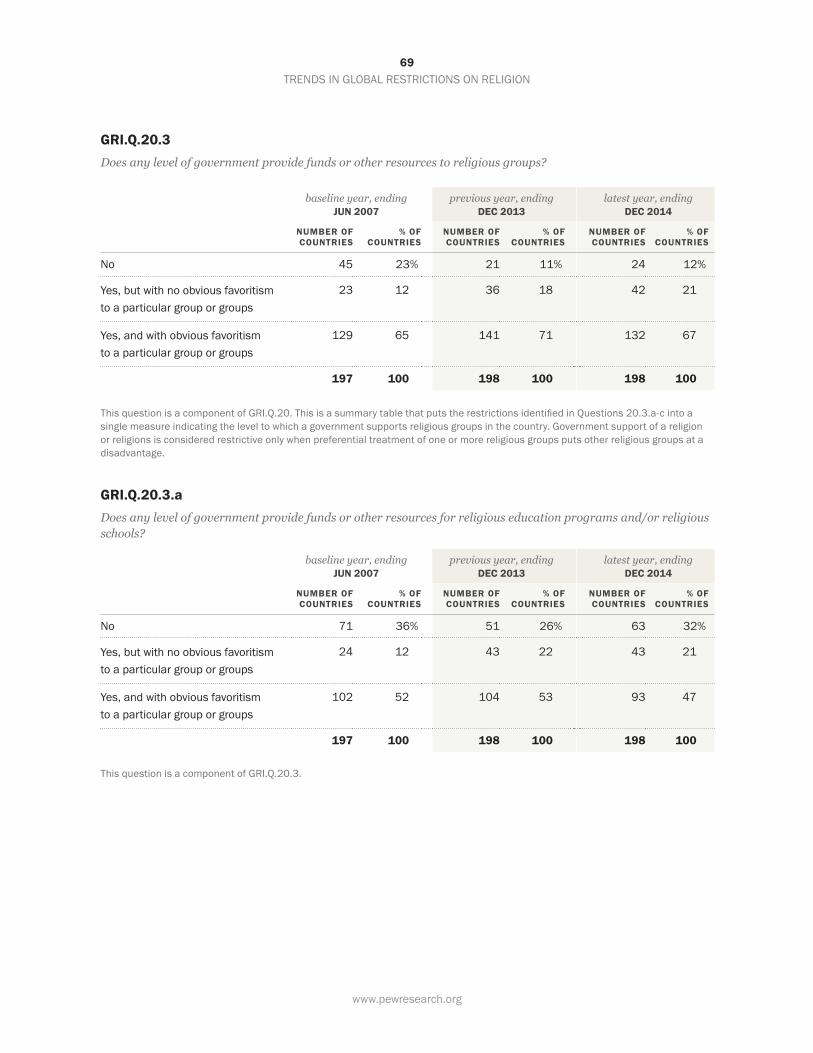
TRENDS IN GLOBAL RESTRICTIONS ON RELIGION
www.pewresearch.org
69
GRI.Q.20.3Does any level of government provide funds or other resources to religious groups?
baseline year, ending JUN 2007
previous year, ending DEC 2013
latest year, ending DEC 2014
NUMBER OF COUNTRIES
% OF COUNTRIES
NUMBER OF COUNTRIES
% OF COUNTRIES
NUMBER OF COUNTRIES
% OF COUNTRIES
No 45 23% 21 11% 24 12%
Yes, but with no obvious favoritism to a particular group or groups
23 12 36 18 42 21
Yes, and with obvious favoritism to a particular group or groups
129 65 141 71 132 67
197 100 198 100 198 100
This question is a component of GRI.Q.20. This is a summary table that puts the restrictions identified in Questions 20.3.a-c into a single measure indicating the level to which a government supports religious groups in the country. Government support of a religion or religions is considered restrictive only when preferential treatment of one or more religious groups puts other religious groups at a disadvantage.
GRI.Q.20.3.aDoes any level of government provide funds or other resources for religious education programs and/or religious schools?
baseline year, ending JUN 2007
previous year, ending DEC 2013
latest year, ending DEC 2014
NUMBER OF COUNTRIES
% OF COUNTRIES
NUMBER OF COUNTRIES
% OF COUNTRIES
NUMBER OF COUNTRIES
% OF COUNTRIES
No 71 36% 51 26% 63 32%
Yes, but with no obvious favoritism to a particular group or groups
24 12 43 22 43 21
Yes, and with obvious favoritism to a particular group or groups
102 52 104 53 93 47
197 100 198 100 198 100
This question is a component of GRI.Q.20.3.
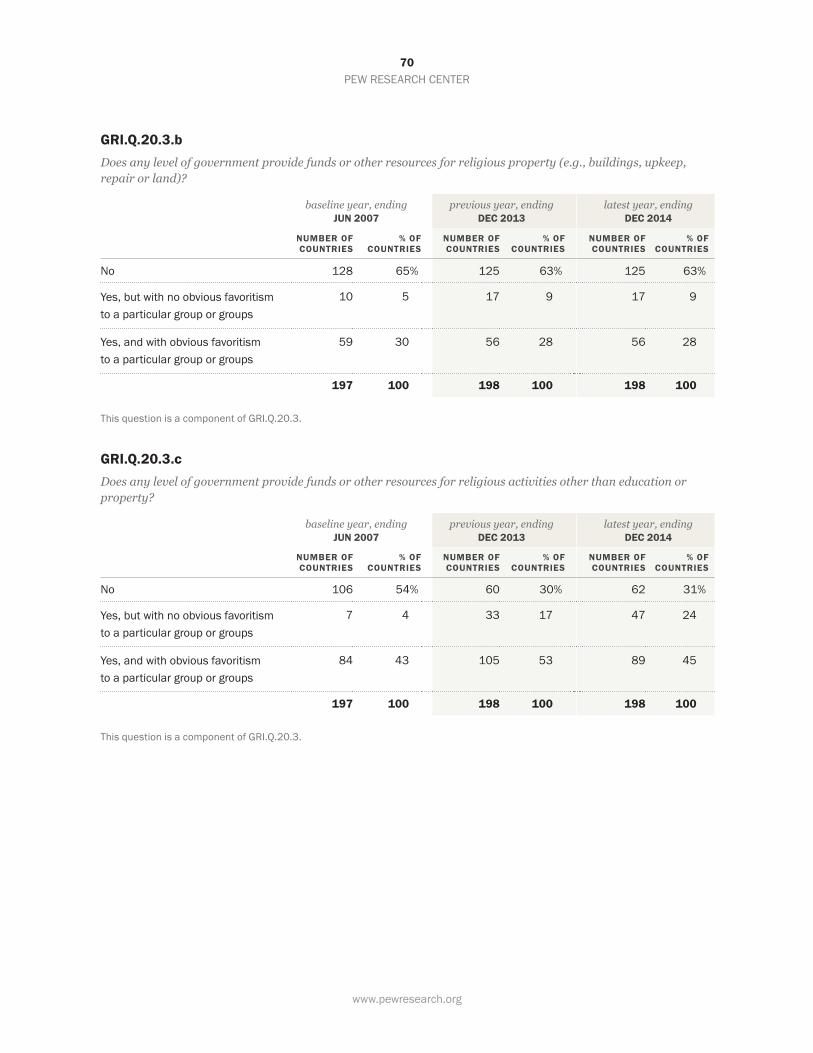
PEW RESEARCH CENTER
www.pewresearch.org
70
GRI.Q.20.3.bDoes any level of government provide funds or other resources for religious property (e.g., buildings, upkeep, repair or land)?
baseline year, ending JUN 2007
previous year, ending DEC 2013
latest year, ending DEC 2014
NUMBER OF COUNTRIES
% OF COUNTRIES
NUMBER OF COUNTRIES
% OF COUNTRIES
NUMBER OF COUNTRIES
% OF COUNTRIES
No 128 65% 125 63% 125 63%
Yes, but with no obvious favoritism to a particular group or groups
10 5 17 9 17 9
Yes, and with obvious favoritism to a particular group or groups
59 30 56 28 56 28
197 100 198 100 198 100
This question is a component of GRI.Q.20.3.
GRI.Q.20.3.cDoes any level of government provide funds or other resources for religious activities other than education or property?
baseline year, ending JUN 2007
previous year, ending DEC 2013
latest year, ending DEC 2014
NUMBER OF COUNTRIES
% OF COUNTRIES
NUMBER OF COUNTRIES
% OF COUNTRIES
NUMBER OF COUNTRIES
% OF COUNTRIES
No 106 54% 60 30% 62 31%
Yes, but with no obvious favoritism to a particular group or groups
7 4 33 17 47 24
Yes, and with obvious favoritism to a particular group or groups
84 43 105 53 89 45
197 100 198 100 198 100
This question is a component of GRI.Q.20.3.

TRENDS IN GLOBAL RESTRICTIONS ON RELIGION
www.pewresearch.org
71
GRI.Q.20.4Is religious education required in public schools?
baseline year, ending JUN 2007
previous year, ending DEC 2013
latest year, ending DEC 2014
NUMBER OF COUNTRIES
% OF COUNTRIES
NUMBER OF COUNTRIES
% OF COUNTRIES
NUMBER OF COUNTRIES
% OF COUNTRIES
No 134 68% 114 58% 111 56%
Yes, by at least some local governments
6 3 9 5 7 4
Yes, by the national government 57 29 75 38 80 40
197 100 198 100 198 100
This question is a component of GRI.Q.20.
GRI.Q.20.5Does the national government defer in some way to religious authorities, texts or doctrines on legal issues?
baseline year, ending JUN 2007
previous year, ending DEC 2013
latest year, ending DEC 2014
NUMBER OF COUNTRIES
% OF COUNTRIES
NUMBER OF COUNTRIES
% OF COUNTRIES
NUMBER OF COUNTRIES
% OF COUNTRIES
No 150 76% 138 70% 143 72%
Yes 47 24 60 30 55 28
197 100 198 100 198 100
This question is a component of GRI.Q.20.

PEW RESEARCH CENTER
www.pewresearch.org
72
Social Hostilities Involving Religion
To assess the level of social hostilities involving religion around the world, the Pew Research Center used the following 13 questions for the Social Hostilities Index (SHI). Pew Research staff then combed through 17 published sources of information, including reports by the U.S. State Department, the United Nations and various nongovernmental organizations, to answer the questions on a country-by-country basis. (For more details, see the Methodology.)
This summary shows the questions, followed by various possible answers and the number and percentage of countries that fell into each category, according to the multiple sources analyzed by Pew Research. For example, on Question No. 12 – “Were there incidents of hostility over proselytizing?” – the study found that for the latest year, ending on Dec. 31, 2013, 176 countries (89%) had no reported incidents of hostility over proselytizing, 13 countries (7%) had incidents that fell short of physical violence and 9 countries (5%) had incidents involving violence.
Additionally, the summary shows whether particular religious hostilities occurred during the previous year, ending Dec. 31, 2012, or in the study’s baseline year, ending in mid-2007. A total of 197 countries are shown for the baseline year; South Sudan was coded for the first time in 2011, bringing the past three years’ totals to 198 countries.
To see how each country scored on each question, see the Results by Country online. When comparing these results with the Pew Research Center’s previous reports, readers should keep in mind that previous reports showed the number of countries in which particular religious hostilities occurred at any time during two overlapping periods: July 1, 2006, through June 30, 2008, and July 1, 2007, through June 30, 2009. Because this report presents data on an annual basis, the incidents for a single year may be less than when two years were taken into account.
Some differences from year to year might not be as significant as they appear due to minor changes in coding procedures and changes in the amount of information available between years. For example, sources for the most recent period studied sometimes had more information on incidents in a country than sources previously had reported. Such additional information may reflect either an actual increase in hostilities in a country, improved reporting for that country or both. (For more details, see the Methodology.)
Percentages may not add to 100 due to rounding.

TRENDS IN GLOBAL RESTRICTIONS ON RELIGION
www.pewresearch.org
73
SHI.Q.1.aWere there crimes, malicious acts or violence motivated by religious hatred or bias?
baseline year, ending JUN 2007
previous year, ending DEC 2013
latest year, ending DEC 2014
NUMBER OF COUNTRIES
% OF COUNTRIES
NUMBER OF COUNTRIES
% OF COUNTRIES
NUMBER OF COUNTRIES
% OF COUNTRIES
No 67 34% 53 27% 59 30%
Yes ^ 130 66 145 73 139 70
Harassment/intimidation 127 64 145 73 139 70
Property damage 40 20 77 39 78 39
Detentions/abductions 12 6 16 8 17 9
Displacement from homes 19 10 23 12 16 8
Physical assaults 55 28 58 29 64 32
Deaths 25 13 35 18 33 17
197 100 198 100 198 100
This is a summary table that captures the types of religious hatred or bias.Nested categories add to more than total because countries can have multiple types of hostilities.^ This line represents the number or percentage of countries in which at least one of the following hostilities occurred.Each country’s score for each type of religious hatred or bias is available in SHI.Q.1a-f in the Results by Country (online).
SHI.Q.1.bHow many different types of crimes, malicious acts or violence motivated by religious hatred or bias occured? The six different types considered include: harassment/intimidation, property damage, detentions/abductions, displacement from homes, physcal assaults and killings.
baseline year, ending JUN 2007
previous year, ending DEC 2013
latest year, ending DEC 2014
NUMBER OF COUNTRIES
% OF COUNTRIES
NUMBER OF COUNTRIES
% OF COUNTRIES
NUMBER OF COUNTRIES
% OF COUNTRIES
No 67 34% 53 27% 59 30%
Yes: one type 56 28 47 24 40 20
Yes: two types 30 15 35 18 39 20
Yes: three types 25 13 36 18 30 15
Yes: four types 11 6 12 6 15 8
Yes: five types 5 3 9 5 11 6
Yes: six types 3 2 6 3 4 2
197 100 198 100 198 100
This is a summary table that captures the severity of religious hatred or bias.Each country’s score based on how many of the six types of religious hatred or bias were documented is available in SHI.Q.1 in the Results by Country (online).

PEW RESEARCH CENTER
www.pewresearch.org
74
SHI.Q.2Was there mob violence related to religion?
baseline year, ending JUN 2007
previous year, ending DEC 2013
latest year, ending DEC 2014
NUMBER OF COUNTRIES
% OF COUNTRIES
NUMBER OF COUNTRIES
% OF COUNTRIES
NUMBER OF COUNTRIES
% OF COUNTRIES
No 174 88% 158 80% 167 84%
Yes, but there were no deaths re-ported
14 7 24 12 21 11
Yes, and there were deaths reported
9 5 16 8 10 5
197 100 198 100 198 100
SHI.Q.3Were there acts of sectarian or communal violence between religious groups?
baseline year, ending JUN 2007
previous year, ending DEC 2013
latest year, ending DEC 2014
NUMBER OF COUNTRIES
% OF COUNTRIES
NUMBER OF COUNTRIES
% OF COUNTRIES
NUMBER OF COUNTRIES
% OF COUNTRIES
No 181 92% 172 87% 178 90%
Yes 16 8 26 13 20 10
197 100 198 100 198 100
Sectarian or communal violence involves two or more religious groups facing off in repeated clashes.

TRENDS IN GLOBAL RESTRICTIONS ON RELIGION
www.pewresearch.org
75
SHI.Q.4Were religion-related terrorist groups active in the country?
baseline year, ending JUN 2007
previous year, ending DEC 2013
latest year, ending DEC 2014
NUMBER OF COUNTRIES
% OF COUNTRIES
NUMBER OF COUNTRIES
% OF COUNTRIES
NUMBER OF COUNTRIES
% OF COUNTRIES
No 137 70% 125 63% 116 59%
Yes 60 30 73 37 82 41
Yes, but their activity was limited to recruitment and fundraising
43 22 22 11 22 11
Yes, with violence that resulted in some casualties (1-9 injuries or deaths)
7 4 14 7 22 11
Yes, with violence that resulted in multiple casualties (10-50 injuries or deaths)
2 1 9 5 10 5
Yes, with violence that resulted in many casualties (more than 50 injuries or deaths)
8 4 28 14 28 14
197 100 198 100 198 100
Religion-related terrorism is defined as politically motivated violence against noncombatants by subnational groups or clandestine agents with a religious justification or intent.

PEW RESEARCH CENTER
www.pewresearch.org
76
SHI.Q.5Was there a religion-related war or armed conflict in the country?
baseline year, ending JUN 2007
previous year, ending DEC 2013
latest year, ending DEC 2014
NUMBER OF COUNTRIES
% OF COUNTRIES
NUMBER OF COUNTRIES
% OF COUNTRIES
NUMBER OF COUNTRIES
% OF COUNTRIES
No 176 89% 172 87% 173 87%
Yes 21 11 26 13 25 13
Yes, with fewer than 10,000 casualties or people displaced
9 5 4 2 4 2
Yes, with tens of thousands of casualties or people displaced
6 3 5 3 5 3
Yes, with hundreds of thousands of casualties or people displaced
3 2 9 5 6 3
Yes, with millions of casualties or people displaced
3 2 8 4 10 5
197 100 198 100 198 100
Religion-related war is defined as armed conflict (involving sustained casualties over time or more than 1,000 battle deaths) in which religious rhetoric is commonly employed to justify the use of force, or in which one or more of the combatants primarily identifies itself or the opposing side by religion.
SHI.Q.6Did violence result from tensions between religious groups?
baseline year, ending JUN 2007
previous year, ending DEC 2013
latest year, ending DEC 2014
NUMBER OF COUNTRIES
% OF COUNTRIES
NUMBER OF COUNTRIES
% OF COUNTRIES
NUMBER OF COUNTRIES
% OF COUNTRIES
No 50 25% 91 46% 69 35%
There were public tensions between religious groups, but they fell short of hostilities involving physical violence
56 28 44 22 55 28
Yes, with physical violence in a few cases
69 35 31 16 31 16
Yes, with physical violence in numerous cases
22 11 32 16 43 22
197 100 198 100 198 100
The data for each year also take into account information from the two previous years.

TRENDS IN GLOBAL RESTRICTIONS ON RELIGION
www.pewresearch.org
77
SHI.Q.7Did organized groups use force or coercion in an attempt to dominate public life with their perspective on religion, including preventing some religious groups from operating in the country?
baseline year, ending JUN 2007
previous year, ending DEC 2013
latest year, ending DEC 2014
NUMBER OF COUNTRIES
% OF COUNTRIES
NUMBER OF COUNTRIES
% OF COUNTRIES
NUMBER OF COUNTRIES
% OF COUNTRIES
No 113 57% 110 56% 109 55%
Yes 84 43 88 44 89 45
At the local level 22 11 24 12 26 13
At the regional level 31 16 15 8 12 6
At the national level 31 16 49 25 51 26
197 100 198 100 198 100
The data for each year also take into account information from the two previous years.
SHI.Q.8Did religious groups themselves attempt to prevent other religious groups from being able to operate?
baseline year, ending JUN 2007
previous year, ending DEC 2013
latest year, ending DEC 2014
NUMBER OF COUNTRIES
% OF COUNTRIES
NUMBER OF COUNTRIES
% OF COUNTRIES
NUMBER OF COUNTRIES
% OF COUNTRIES
No 130 66% 138 70% 138 70%
Yes 67 34 60 30 60 30
197 100 198 100 198 100
The data for each year also take into account information from the two previous years.
SHI.Q.9Did individuals or groups use violence or the threat of violence, including so-called honor killings, to try to enforce religious norms?
baseline year, ending JUN 2007
previous year, ending DEC 2013
latest year, ending DEC 2014
NUMBER OF COUNTRIES
% OF COUNTRIES
NUMBER OF COUNTRIES
% OF COUNTRIES
NUMBER OF COUNTRIES
% OF COUNTRIES
No 162 82% 136 69% 147 74%
Yes 35 18 62 31 51 26
197 100 198 100 198 100
The data for each year also take into account information from the two previous years.

PEW RESEARCH CENTER
www.pewresearch.org
78
SHI.Q.10Were individuals assaulted or displaced from their homes in retaliation for religious activities, including preaching and other forms of religious expression, considered offensive or threatening to the majority faith?
baseline year, ending JUN 2007
previous year, ending DEC 2013
latest year, ending DEC 2014
NUMBER OF COUNTRIES
% OF COUNTRIES
NUMBER OF COUNTRIES
% OF COUNTRIES
NUMBER OF COUNTRIES
% OF COUNTRIES
No 149 76% 120 61% 147 74%
Yes 48 24 78 39 51 26
197 100 198 100 198 100
The data for each year also take into account information from the two previous years.
SHI.Q.11Were women harassed for violating religious dress codes?
baseline year, ending JUN 2007
previous year, ending DEC 2013
latest year, ending DEC 2014
NUMBER OF COUNTRIES
% OF COUNTRIES
NUMBER OF COUNTRIES
% OF COUNTRIES
NUMBER OF COUNTRIES
% OF COUNTRIES
No 183 93% 145 73% 152 77%
Yes 14 7 53 27 46 23
197 100 198 100 198 100
The data for each year also take into account information from the two previous years.Figures for the year ending in December 2013 have been updated to correct a minor error in the previous report.
SHI.Q.12
Were there incidents of hostility over proselytizing?
baseline year, ending JUN 2007
previous year, ending DEC 2013
latest year, ending DEC 2014
NUMBER OF COUNTRIES
% OF COUNTRIES
NUMBER OF COUNTRIES
% OF COUNTRIES
NUMBER OF COUNTRIES
% OF COUNTRIES
No 148 75% 176 89% 174 88%
Yes, but they fell short of physical violence
30 15 13 7 12 6
Yes, and they included physical violence
19 10 9 5 12 6
197 100 198 100 198 100
The data for each year also take into account information from the two previous years.

TRENDS IN GLOBAL RESTRICTIONS ON RELIGION
www.pewresearch.org
79
SHI.Q.13Were there incidents of hostility over conversions from one religion to another?
baseline year, ending JUN 2007
previous year, ending DEC 2013
latest year, ending DEC 2014
NUMBER OF COUNTRIES
% OF COUNTRIES
NUMBER OF COUNTRIES
% OF COUNTRIES
NUMBER OF COUNTRIES
% OF COUNTRIES
No 153 78% 147 74% 148 75%
Yes, but they fell short of physical violence
23 12 28 14 30 15
Yes, and they included physical violence
21 11 23 12 20 10
197 100 198 100 198 100
The data for each year also take into account information from the two previous years.