number of mdr/xdr tb patients under treatment ...iom.nationalacademies.org/~/media/files/activity...
TRANSCRIPT

Number of MDR/XDR TB Patients under Treatment:Implications for the Future
Megan Murray, MD, ScDHarvard School of Public HealthBrigham and Women’s Hospital

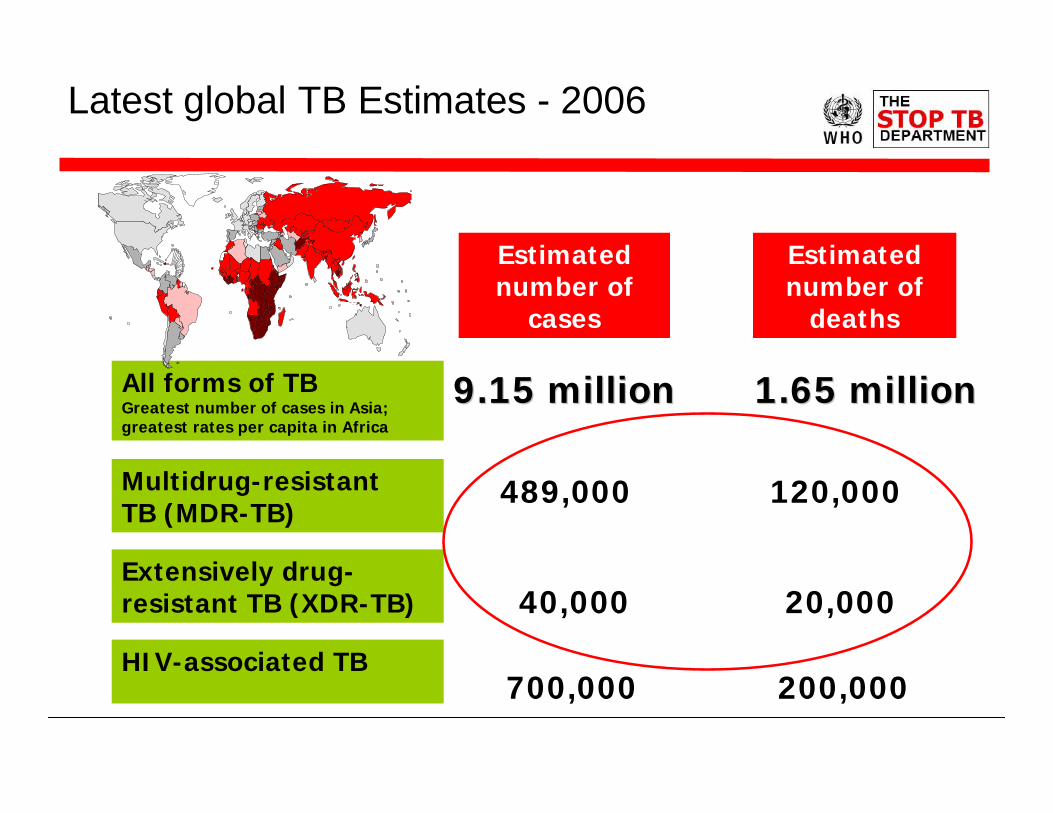
Latest global TB Estimates - 2006
Estimated number of
cases
Estimated number of
deaths
1.65 million1.65 million9.15 million9.15 million
120,000489,000
All forms of TB Greatest number of cases in Asia; greatest rates per capita in Africa
Multidrug-resistant TB (MDR-TB)
Extensively drug-resistant TB (XDR-TB) 40,000 20,000
HIV-associated TB700,000 200,000
Adapted from a slide provided by Dr. Paul Nunn, WHO Geneva

1.2 2.1 2.0 10.1 11.616.3 16.4 21.336.4 34.7
407.5 406.5426.6
403.5
443.8
0
100
200
300
400
500
600
2004 2005 2006 2007 2008
non-GLCGLC
Notified cases of MDR-TB (2004-2006) and projected patients to be treated (2007-2008) compared to estimated burden of MDR-TB
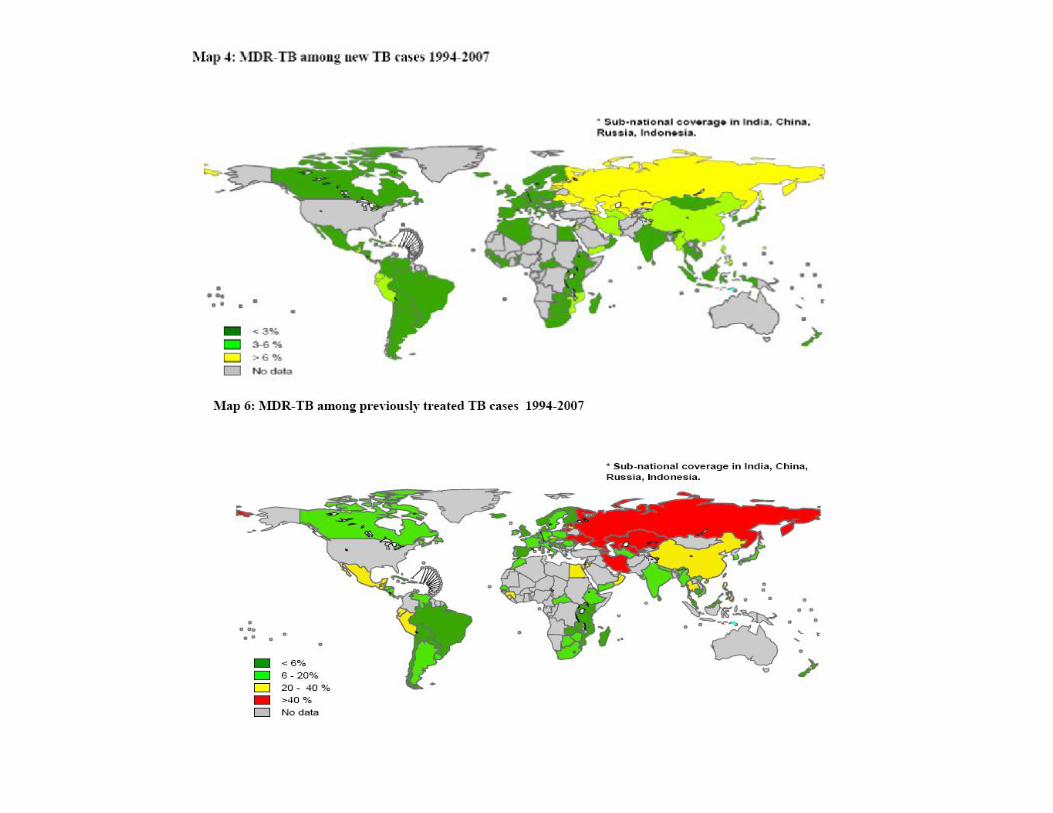
Estimated 489,000 new MDR-TB cases each year
What proportion of the XDR case load is being treated?

Treatment outcomes for MDR
MDR Outcomes– 23 studies reviewed– 15 countries– Long term cure rates 33-83%
• HIV predicts higher failure rates• FQ use and surgery associated with better
outcomes• Worse outcomes with increasing number of drugs
to which resistantChan E and Iseman MD, Multi-drug resistant and extensively drug resistant tuberculosis: a review. Current Opinion in Infectious Diseases. 2008, 21: 587-595
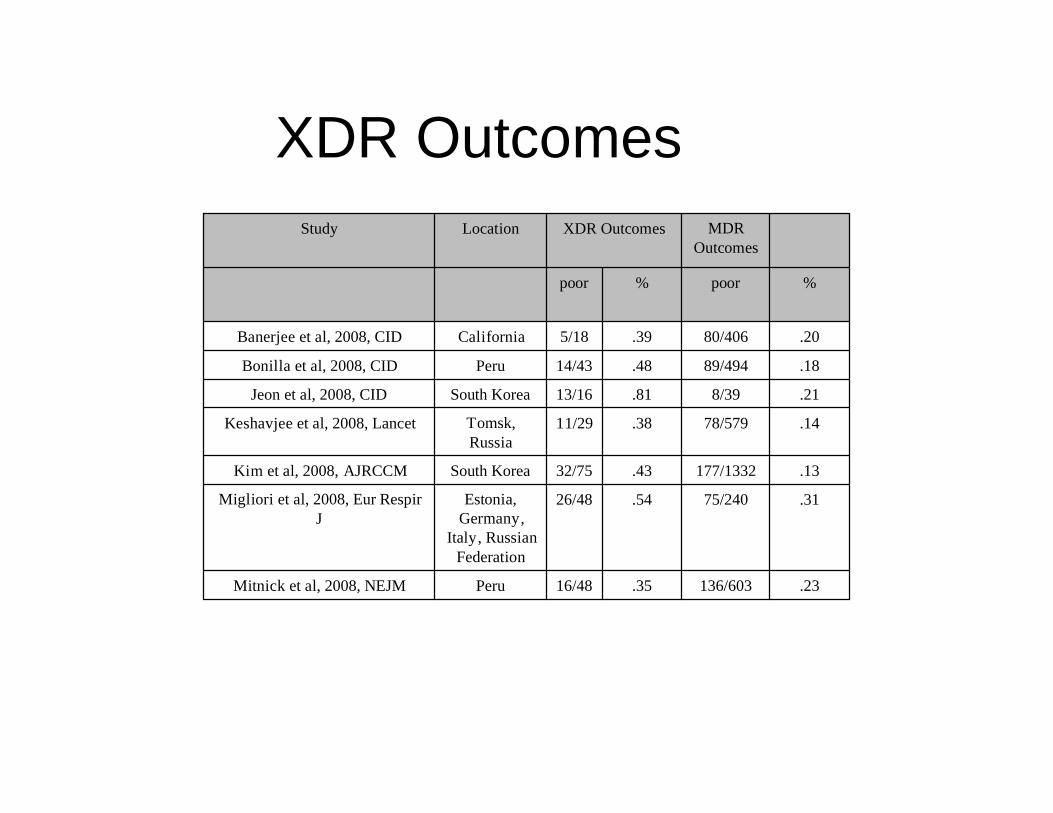
XDR Outcomes
.23136/603.3516/48PeruMitnick et al, 2008, NEJM
.3175/240.5426/48Estonia, Germany,
Italy, Russian Federation
Migliori et al, 2008, Eur Respir J
.13177/1332.4332/75South KoreaKim et al, 2008, AJRCCM
.1478/579.3811/29Tomsk, Russia
Keshavjee et al, 2008, Lancet
.218/39.8113/16South KoreaJeon et al, 2008, CID
.1889/494.4814/43PeruBonilla et al, 2008, CID
.2080/406.395/18CaliforniaBanerjee et al, 2008, CID
%poor%poor
MDR Outcomes
XDR OutcomesLocationStudy
Baseline R Poor
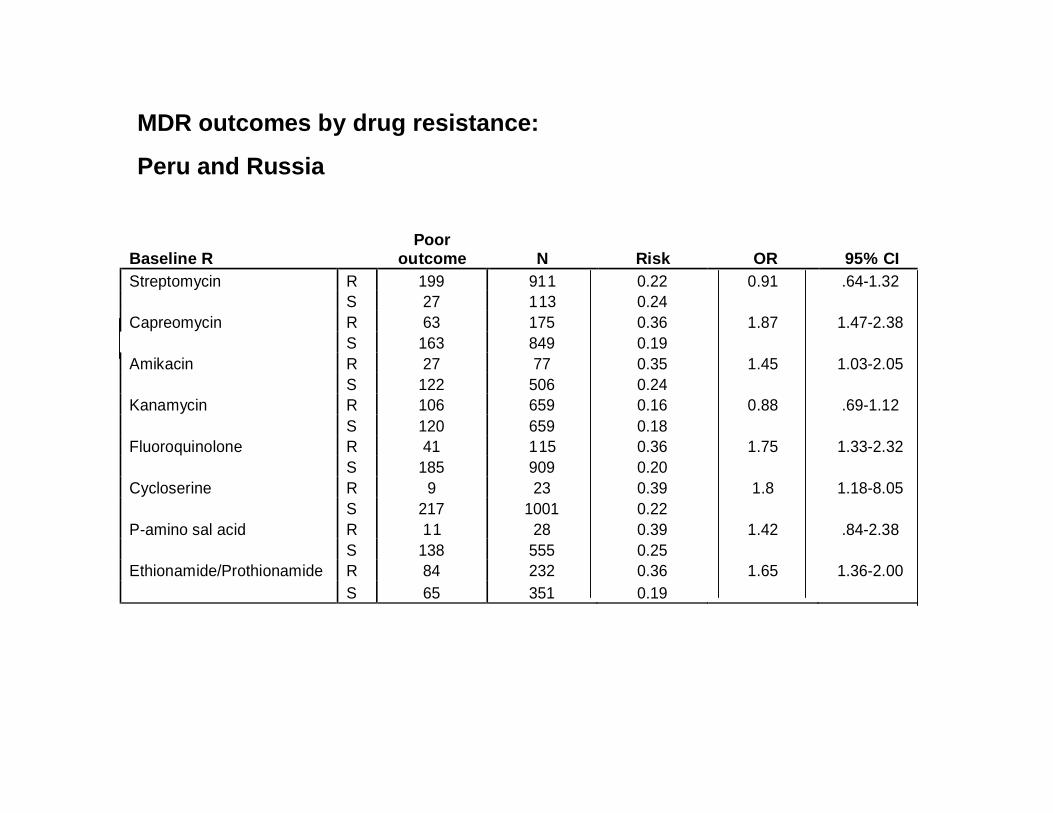
outcome N Risk OR 95% CI Streptomycin R 199 911 0.22 0.91 .64-1.32 S 27 113 0.24 Capreomycin R 63 175 0.36 1.87 1.47-2.38 S 163 849 0.19 Amikacin R 27 77 0.35 1.45 1.03-2.05 S 122 506 0.24 Kanamycin R 106 659 0.16 0.88 .69-1.12 S 120 659 0.18 Fluoroquinolone R 41 115 0.36 1.75 1.33-2.32 S 185 909 0.20 Cycloserine R 9 23 0.39 1.8 1.18-8.05 S 217 1001 0.22 P-amino sal acid R 11 28 0.39 1.42 .84-2.38 S 138 555 0.25 Ethionamide/Prothionamide R 84 232 0.36 1.65 1.36-2.00 S 65 351 0.19
MDR outcomes by drug resistance:
Peru and Russia
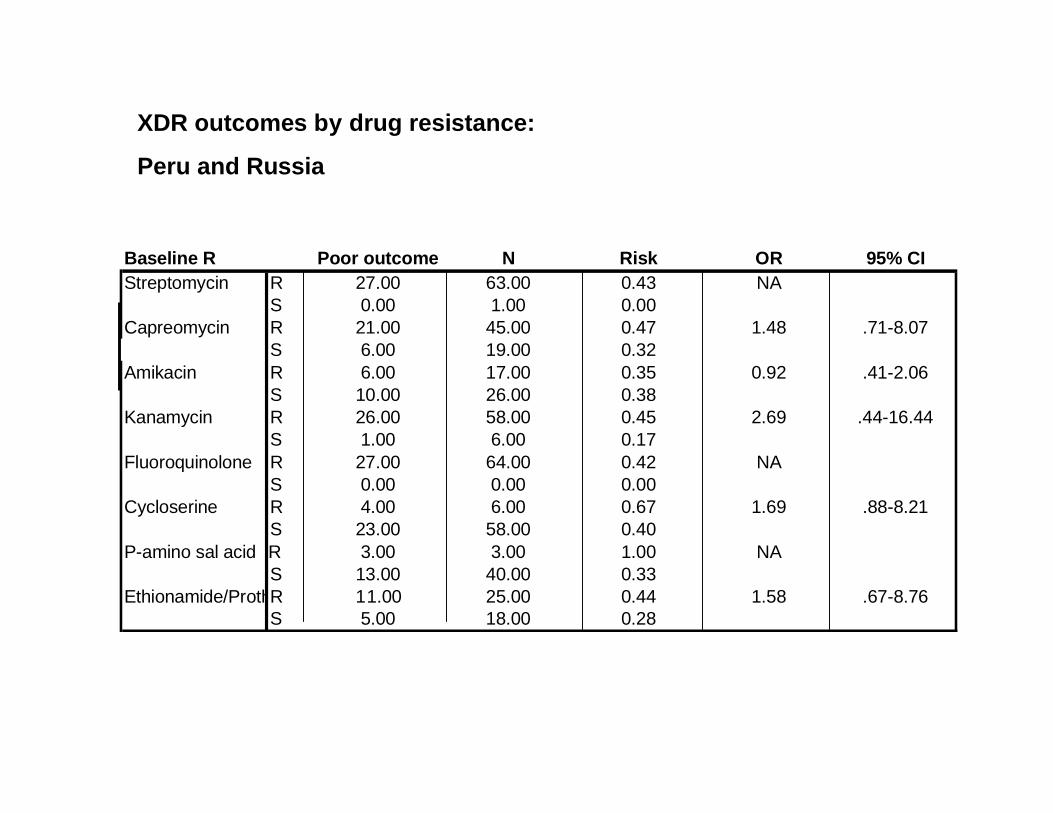
XDR outcomes by drug resistance:
Peru and Russia
Baseline R Poor outcome N Risk OR 95% CIStreptomycin R 27.00 63.00 0.43 NA
S 0.00 1.00 0.00Capreomycin R 21.00 45.00 0.47 1.48 .71-8.07
S 6.00 19.00 0.32Amikacin R 6.00 17.00 0.35 0.92 .41-2.06
S 10.00 26.00 0.38Kanamycin R 26.00 58.00 0.45 2.69 .44-16.44
S 1.00 6.00 0.17Fluoroquinolone R 27.00 64.00 0.42 NA
S 0.00 0.00 0.00Cycloserine R 4.00 6.00 0.67 1.69 .88-8.21
S 23.00 58.00 0.40P-amino sal acid R 3.00 3.00 1.00 NA
S 13.00 40.00 0.33Ethionamide/ProthionamideR 11.00 25.00 0.44 1.58 .67-8.76
S 5.00 18.00 0.28

Reproductive number
R0: the average number of secondary infectious cases directly infected by a single infectious case during the entire infectious period when s/he enters a totally susceptible population
R0>1 R0<1Disease can spread Disease cannot spread
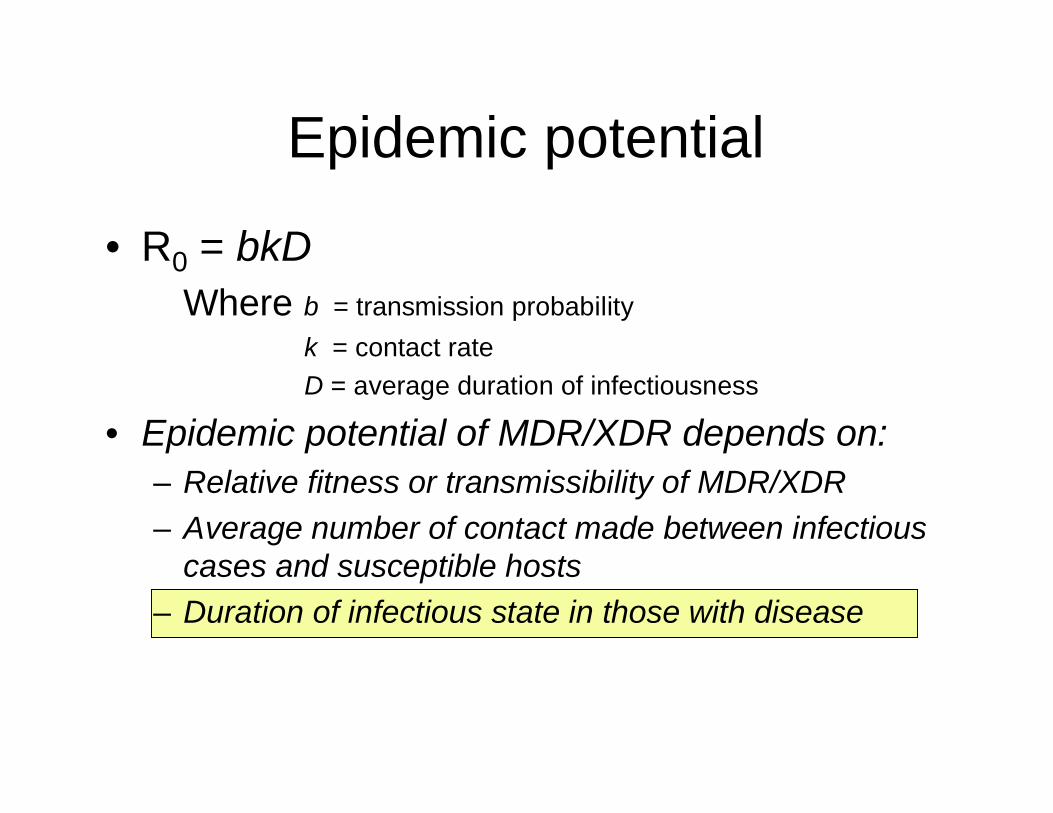
Epidemic potential
• R0 = bkDWhere b = transmission probability
k = contact rateD = average duration of infectiousness
• Epidemic potential of MDR/XDR depends on:– Relative fitness or transmissibility of MDR/XDR – Average number of contact made between infectious
cases and susceptible hosts– Duration of infectious state in those with disease

Predicting the futureS
LU LFL E EU EF
R
Y YFYU
TD DU TU DF TF
RFRU
Drug sensitive
“Unfit” MDR
“Fit” MDR
Cohen T and Murray M, Modeling epidemic of multidrug resistant tuberculosis of heterogeneous fitness, Nat Med, 2004

Phase 2: Widespread
Projections
0
10
2030
40
50
6070
80
90
0 50 100 150 200 250 300 350 400
Years after drug introduction
Per
cent
age
infe
cted
0
200
400600
800
1000
12001400
1600
1800
0 50 100 150 200 250 300 350 400
Years after drug introduction
Pre
vale
nce
of in
fect
ious
TB
=time of switch to DOTS strategy
Latent Infection Active Disease
Drug sensitive
MDR (RF=120%)MDR (RF=80%)
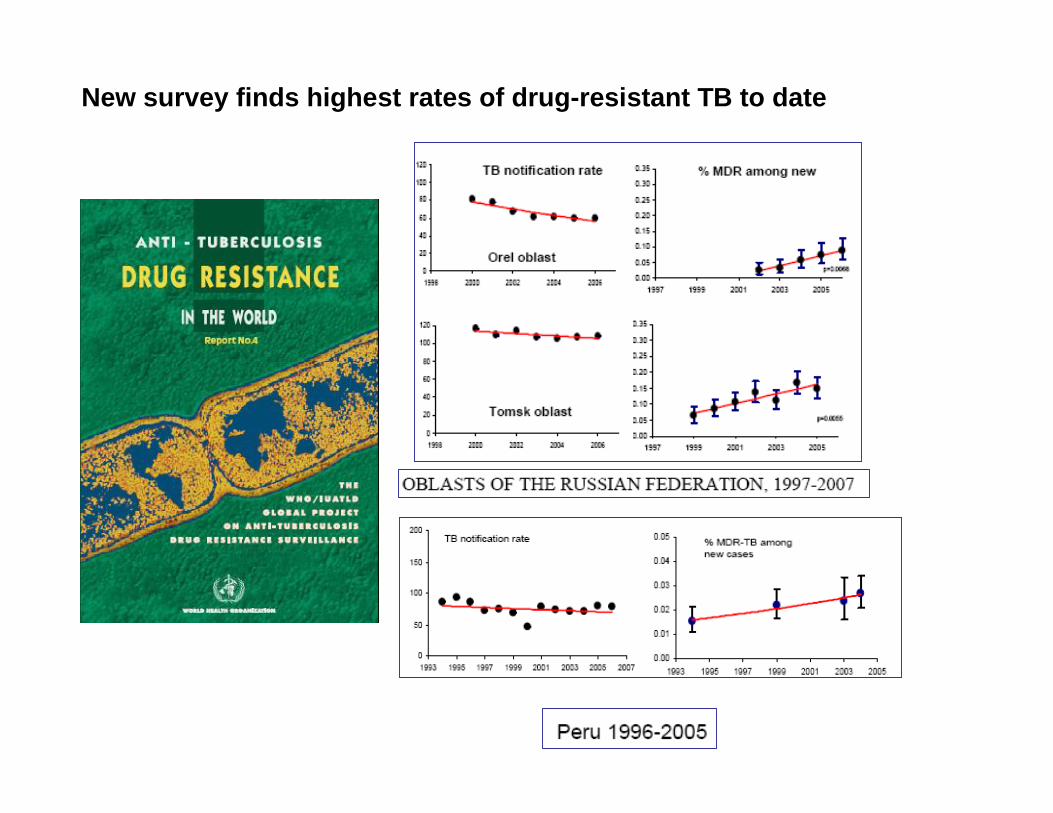
New survey finds highest rates of drug-resistant TB to date
Thanks
• Theodore Cohen (Modeling)• Christie Jeon (resistance prediction)• Karen Jacobsen (XDR outcomes)• Carole Mitnick, Salmaan Keshavjee,
Sonya Shin and country teams (Peru amdRussia data)