nuit health survey 2007–2008 - mcgill university · international polar year inuit health survey:...
TRANSCRIPT

INUIT HEALTH SURVEY 2007–2008
Nunavut
FUNDED AND SUPPORTED BY
2 2007–2008 INUIT HEALTH SURVEY •NUNAVUT
May 2010
Prepared by Prof. G.M. Egeland
International Polar Year Inuit Health Survey: Health in Transition and Resiliency
with the
Nunavut Steering Committee and contributions from CINE staff members and graduate students
Centre for Indigenous Peoples’ Nutrition and Environment School of Dietetics and Human Nutrition Macdonald Campus of McGill University
21,111 Lakeshore Rd., Ste‐Anne‐de‐Bellevue, QC H9X 3V9
Nunavut Steering Committee Member Organizations: Government of Nunavut Health & Social Services
Nunavut Tunngavik Incorporated University of Toronto McGill University

2007–2008 INUIT HEALTH SURVEY •NUNAVUT 3
Acknowledgements
We would like to thank all Nunavummiut adults whose participation in the Inuit Health Survey in 2007 and 2008 contributed to its great success. We would also like to thank the hamlet offices and hamlet health centers for their support in making the survey possible.
We extend a special thank you to the Nunavut Steering Committee, which was made up of individuals representing the Government of Nunavut Health & Social Services, Nunavut Tunngavik Inc., University of Toronto, McGill University, and formerly the Nunavut Association of Municipalities. Their support and guidance throughout all phases of the project were indispensable and appreciated. Specifically, we would like to mention Elisapee Sheutiapik for her support and leadership, without which the project would not have succeeded. We also thank Isaac Sobol, Geraldine Osborne, Laakkuluk Williamson‐Bathory and Kue Young for their ongoing guidance and sage advice.
We thank Brian Ward of McGill University for his expert guidance with the parasitic diseases module and Hope Weiler of McGill University for her expertise in vitamin D.
For providing photo documentation for this report we would like to thank Stephanie McDonald and Charles Spina.
We extend special thanks to CINE staff members and students, Zhirong Cao, Louise
Johnson‐Down, Donna Leggee, Helga Saudny, Nelofar Sheikh, Yella Zahirovich‐Jovich, Jennifer Jamieson and Amy Pronovost for the excellent support provided in preparing the document.
We also acknowledge and thank Eric Loring of the Inuit Tapiriit Kanatami (ITK), who also serves as Governing Board Member of CINE. ITK remains a constant source of guidance and has been very helpful with results communication and knowledge translation.

4 2007–2008 INUIT HEALTH SURVEY •NUNAVUT
Table of Contents
Acknowledgements ............................................................................................................................................... 3
Table of Contents .................................................................................................................................................. 4
Executive Summary ............................................................................................................................................... 6
Overview ............................................................................................................................................................... 9
Results from Home‐Based Questionnaire ............................................................................................................ 10
Home Environment............................................................................................................................................................................... 10
Homelessness and Crowding ................................................................................................................................................................ 10
Language .............................................................................................................................................................................................. 11
Smoking in Households ........................................................................................................................................................................ 11
Food Security ........................................................................................................................................................................................ 11
Country Food and Food Sharing Networks ........................................................................................................................................... 12
Availability of Country Food .................................................................................................................................................................. 13
Cost of Living ........................................................................................................................................................................................ 14
References ............................................................................................................................................................................................ 14
Results from Individual Questionnaires ................................................................................................................. 15
Overview .............................................................................................................................................................................................. 15
Dental Health ........................................................................................................................................................................................ 15
Reported Family Health ........................................................................................................................................................................ 16
Heart Attack ................................................................................................................................................................................... 16
Stroke ............................................................................................................................................................................................ 16
Diabetes ......................................................................................................................................................................................... 17
High Blood Pressure ....................................................................................................................................................................... 17
Cancer ............................................................................................................................................................................................ 17
High Cholesterol ............................................................................................................................................................................. 17
Participants’ Medical Information ......................................................................................................................................................... 18
Diabetes ......................................................................................................................................................................................... 18
Cancer ............................................................................................................................................................................................ 18
High Blood Pressure ....................................................................................................................................................................... 18
High Cholesterol ............................................................................................................................................................................. 18
Reproductive Health ....................................................................................................................................................................... 19
Physical Activity ............................................................................................................................................................................. 20
Smoking Habits .............................................................................................................................................................................. 20
Social Demographic Information .......................................................................................................................................................... 21
Marital Status ................................................................................................................................................................................. 21
Education ....................................................................................................................................................................................... 21
Personal Income ............................................................................................................................................................................. 21
Employment ................................................................................................................................................................................... 22
References ............................................................................................................................................................................................ 22

2007–2008 INUIT HEALTH SURVEY •NUNAVUT 5
Clinical Findings ................................................................................................................................................... 23
Healthy Body Weight ............................................................................................................................................................................ 23
Waist Circumference ............................................................................................................................................................................. 23
Standing Height .................................................................................................................................................................................... 24
Sitting Height ....................................................................................................................................................................................... 24
Blood Lipids .......................................................................................................................................................................................... 24
Blood Pressure ...................................................................................................................................................................................... 25
Type 2 Diabetes Mellitus ....................................................................................................................................................................... 26
References ............................................................................................................................................................................................ 26
What Adults Ate ...................................................................................................................................................27
Country Food ........................................................................................................................................................................................ 27
Market Food ......................................................................................................................................................................................... 28
Calories, Fat, Protein, and Carbohydrates ............................................................................................................................................. 29
Folate ................................................................................................................................................................................................... 30
Iron Status and Anemia ......................................................................................................................................................................... 30
Vitamin D .............................................................................................................................................................................................. 31
Sun Exposure ........................................................................................................................................................................................ 32
References ............................................................................................................................................................................................ 32
Parasitic Diseases and Helicobacter pylori .............................................................................................................. 33
Parasitic Diseases ................................................................................................................................................................................. 33
Bacteria ................................................................................................................................................................................................ 35
Data Tables for Kivalliq, Baffin and Kitikmeot ...................................................................................................... 36
Results from Home‐Based Questionnaire ............................................................................................................................................. 37
Results from Individual Questionnaires ................................................................................................................................................. 41
Clinical Findings .................................................................................................................................................................................... 47
Parasitic Diseases and H. pylori ............................................................................................................................................................. 49
6 2007–2008 INUIT HEALTH SURVEY •NUNAVUT
Executive Summary
This report provides a summary of the results from the Adult Inuit Health Survey: Health in Transition and Resiliency conducted in Nunavut in 2007 and 2008.
BAC KGROUND Nunavummiut have expressed a desire to have health information that is of practical relevance so that informed decisions can be made in the face of the rapid changes that are affecting all dimensions of life in Arctic communities. In response to these concerns, a multifaceted participatory health research project for those 18 years of age and above was developed and undertaken in 25 communities in Nunavut in 2007 and 2008. The goal of the survey was to obtain an overview of the health status and living conditions of Nunavummiut living in Nunavut.
FUND I N G Funding for this project was received from the Government of Canada’s Program for International Polar Year, Canadian Institutes of Health Research, Health Canada, University of Toronto, Government of Nunavut, Indian and Northern Affairs and ArcticNet.
ETH I C S APP RO VA L All work was approved by McGill’s Institutional Review Board, the Nunavut Research Institute and all hamlets through community‐university agreements.
RE SU L T S A total of 1374 households and 1923 individuals participated.
Home E n v i r o nm e n t 75 % of the participants lived in public housing. Many homes were in need of major repairs. Families with children experienced household crowding.
L a n g u a g e Inuktitut was reported as the dominant language spoken in Nunavut homes, followed by English.
Smo k i n g The majority of homes in Nunavut had smokers.
F o o d i n s e c u r i t y
Food insecurity was a problem in homes in Nunavut; unemployment, low income and high food costs were the main reasons for food insecurity.
2007–2008 INUIT HEALTH SURVEY •NUNAVUT 7
C o u n t r y f o o d a n d f o o d s h a r i n g
Participants preferred to eat country food but the high cost of obtaining it made it difficult. Food sharing networks were strong and the majority of households shared their country food with others in their community.
C o s t o f l i v i n g Participants spent more money on food and shelter than other Canadian households.
HEA L TH
S e l f ‐ r e p o r t e d h e a l t h Over 70% of participants reported their health to be good, very good or excellent.
R e p o r t e d f am i l y h e a l t h h i s t o r y Heart disease, diabetes, high blood pressure, cancer and high cholesterol were common health problems for parents and siblings of participants.
P a r t i c i p a n t s ’ h e a l t h h i s t o r y Very few participants reported being told by a health professional that they had heart disease or had had a stroke; but diabetes, cancer, high blood pressure and high cholesterol were common health problems.
P h y s i c a l a c t i v i t y In the week prior to the survey, 84% of participants walked on 5 days for at least 20 minutes.
Smo k i n g At the time of the survey smoking was very common among participants.
E d u c a t i o n 34% of participants completed secondary school.
P e r s o n a l i n c om e a n d emp l o ym e n t The main source of income was work related and over one third of participants had full‐time employment.
C L I N I C A L F I N D I N G S
We i g h t The majority of participants were classified as overweight or obese. The majority of women had an “at‐risk” waist circumference.

8 2007–2008 INUIT HEALTH SURVEY •NUNAVUT
B l o o d l i p i d s
Many participants had healthy lipid levels.
B l o o d p r e s s u r e The majority of participants had normal blood pressure.
T y p e 2 d i a b e t e s me l l i t u s ( h o n e y ‐ sw e e t ) 6% of participants had a fasting glucose level that was too high and 8% had a 2‐hour oral glucose tolerance test with a glucose level that was too high, suggesting either pre‐diabetes or diabetes.
NUTR I T I O N
C o u n t r y f o o d Older participants (≥ 40 years of age) ate more country food than younger participants (< 40 years of age).
Ma r k e t f o o d Almost 80% of adults reported consuming pop in the month prior to the survey and they reported drinking 2 ‐ 3 cans of soft drink per day.
I r o n S t a t u s a n d An em i a Iron deficiency is more common among women, especially younger women.
V i t am i n D The majority of Nunavummiut need more vitamin D.
PARA S I T I C D I S E A S E S AND HE L I C O B A C T E R P Y L O R I
P a r a s i t i c d i s e a s e s Parasitic diseases are not common in Nunavut. Few people tested positive for Echinococcosis, Brucellosis and Toxocariasis, however; Trichinosis and Toxoplasmosis were more common.
B a c t e r i a The majority of participants tested positive for Helicobacter pylori.

2007–2008 INUIT HEALTH SURVEY •NUNAVUT 9
OVERVIEW
The Inuit Health Survey in Nunavut was conducted in 2007 and 2008.
The goal of the survey was to obtain an overview of the health status and living conditions of Inuit living in
Nunavut.
A total of 1374 households and 1923 individuals 18 years of age or older participated. An average of 1.4 people per household participated.
Nunavut participation
Age Gender
<40 yr ≥40 yr Men Women
Number of participants
963 955 772 1151
Nunavut participation by region
Region Households Individuals
Baffin 657 898
Kivalliq 410 585
Kitikmeot 307 440
Average age of participants in the survey was 41 years.
All data presented are based on the actual number of participants (n = number of participants).
Not every household was available to participate; 74% did participate, while 26% were unavailable or refused to participate.
25 communities representing Nunavut’s three regions participated:
Baffin (2007) Kivalliq (2007) Kitikmeot (2008) Sanikiluaq Arviat Kugluktuk Hall Beach Whale Cove Cambridge Bay Igloolik Rankin Inlet Gjoa Haven Cape Dorset Chesterfield Inlet Taloyoak Kimmirut Coral Harbour Kugaaruk Iqaluit Repulse Bay Pangnirtung Baker Lake (2008) Qikiqtarjuaq Clyde River Pond Inlet Grise Fiord
Arctic Bay
Resolute Bay (2008)

10 2007–2008 INUIT HEALTH SURVEY •NUNAVUT
RESULTS FROM HOME‐BASED QUESTIONNAIRES Home Environment
The home environment is important for the health and well‐being of Inuit.
75% of participants in Nunavut lived in public housing.
28% (n=354) of participants lived in homes needing major repairs such as a new roof, structural repairs, plumbing repairs.
Mold was reported as a problem in 6% of homes (n=75), and both mold and need for major repairs in 16% of homes (n=205).
75.2
20.54.3
Public Private Other*
Type of housing (%)
n=1010 n=276 n=58
*Includes housing provided by a third party
such as government or a company. Homelessness and Crowding
During the 12 months prior to the survey, 18% of homes (n=235) provided shelter to homeless persons. An average of 2.3 people stayed a median of 9 weeks.
The average household consisted of 4.6 people. In other Canadian households the number is 2.5 (1).
Each home reported having an average of 3 bedrooms; 71% of the homes had more than 2 people per bedroom.
Based on Statistics Canada’s definition of crowding (1),
which is having more than one person per room where rooms include kitchen, living room and bedrooms, one‐third of homes (n=416) were crowded.
Families with children experience overcrowding in Nunavut.

2007–2008 INUIT HEALTH SURVEY •NUNAVUT 11
78% of homes (n=1015) had children and of those homes, 40% (n=393) were crowded.
In contrast, among the 283 homes without children, the prevalence of crowding was only 2% (n=6).
According to the 2006 Census, only 3% of non‐Aboriginal people lived in a crowded dwelling (1).
Language
In Nunavut the predominant language spoken at home was Inuktitut (71%), followed by English (42%).
Inuinnaqtun and/or the Netsilik dialect were spoken in just under 3% of homes.
Smoking in the Households
Of the households surveyed, 90% of households (n=1205) had smokers, and there were on average two smokers per home.
Smoking indoors was forbidden in 76% of homes (n=850).
Food Security
The food security questionnaire, developed by the United States Department of Agriculture, was used (2).
Indian and Northern Affairs Canada (INAC) modified the questionnaire based on discussions with Inuit interviewers (3).
Fewer than one‐third of households reported that they had enough food to eat (food secure).
Severe food insecurity is defined as disrupted eating patterns and reduced food intake among adults and / or children (3), 35% of households reported severe food insecurity.
According to the Canadian Community Health Survey (CCHS) 2004, only 9% of Canadian households reported moderate or severe food insecurity (3).
Food insecurity is a problem in homes in Nunavut communities.
12 2007–2008 INUIT HEALTH SURVEY •NUNAVUT
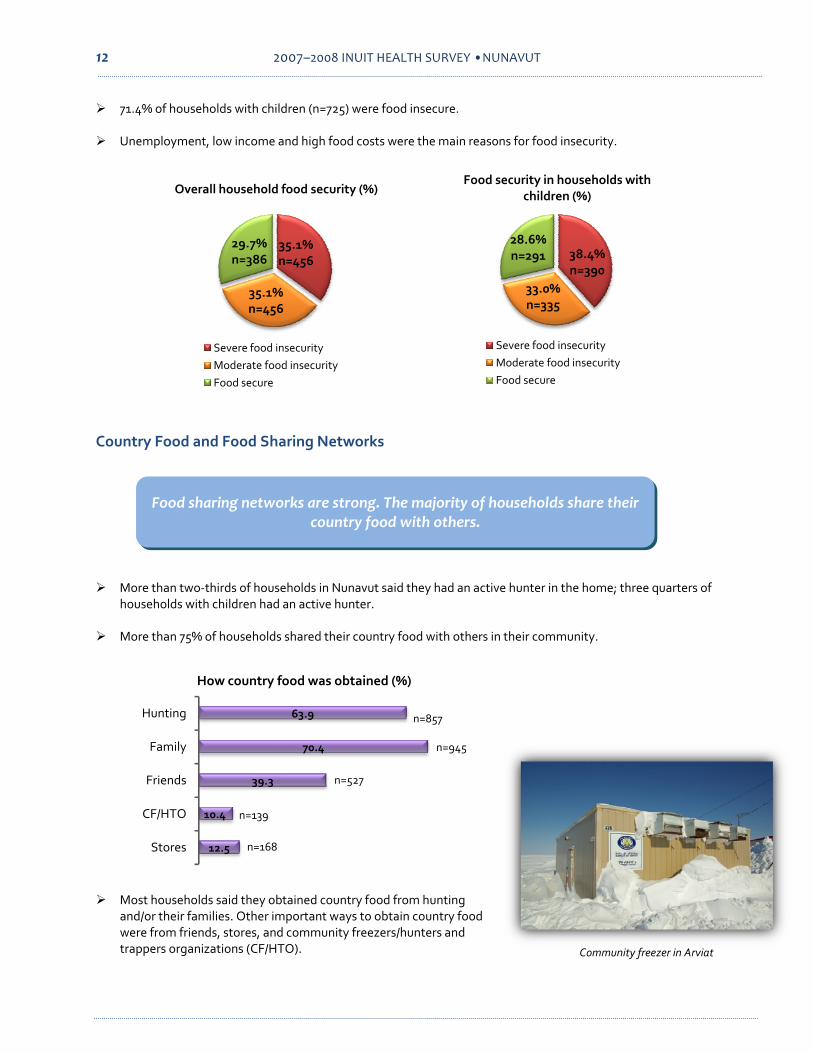
71.4% of households with children (n=725) were food insecure.
Unemployment, low income and high food costs were the main reasons for food insecurity.
Country Food and Food Sharing Networks
More than two‐thirds of households in Nunavut said they had an active hunter in the home; three quarters of
households with children had an active hunter.
More than 75% of households shared their country food with others in their community.
Most households said they obtained country food from hunting
and/or their families. Other important ways to obtain country food were from friends, stores, and community freezers/hunters and trappers organizations (CF/HTO).
35.1%n=456
35.1%n=456
29.7%n=386
Overall household food security (%)
38.4%n=390
33.0%n=335
28.6%n=291
Food security in households with children (%)
Severe food insecuritySevere food insecurityModerate food insecurityModerate food insecurityFood secureFood secure
12.5
10.4
39.3
70.4
63.9
Stores
CF/HTO
Friends
Family
Hunting
How country food was obtained (%)
n=857
n=945
n=527
n=139
n=168
Food sharing networks are strong. The majority of households share their country food with others.
Community freezer in Arviat

2007–2008 INUIT HEALTH SURVEY •NUNAVUT 13
About 20% of households preferred mainly country food, while the rest preferred a mix of both country and
store‐bought foods.
About one‐third (35%) of households in Nunavut worry about contaminants in country food. Availability of Country Food
Most households (81%) preferred to eat more country
food than they could get.
There were many reasons why participants could not get country food. The primary reasons were not having an active hunter in the home, not having a skidoo or boat, and the high cost of supplies and gas to go hunting and fishing (see table).
When households ran out of country food, more than 65% received food from family, friends, the community freezer or Hunter and Trappers Organization. About 38% bought more store food, many went hunting or fishing (27%), and about 20% went without.
The majority of households felt getting country food was
cheaper than store‐bought food. There were 14% who said country food was as costly as store‐bought food, and 10% who thought country food was more expensive.
Limitations to getting country food*
n %
No active hunter 406 38.4
No transportation 451 42.7
Gas & supplies too expensive 334 31.6
Scarce/hard to harvest 126 11.9
Weather/no time 86 8.1
Other 76 7.2
*Percentages do not add up to 100 because participants could give more than one answer.
76.1
13.9 10.0
Cheaper Same More expensive
Cost of country food vs store food (%)
n=940 n=172 n=123
Inuit prefer to eat country food, but the high cost of obtaining it makes it difficult.

14 2007–2008 INUIT HEALTH SURVEY •NUNAVUT
Cost of Living
In the month prior to the survey, half of the households
(n=679) had someone receiving income support.
The average household in Nunavut spent $1875 per month on food. For households with children, the monthly food bill was $1992.
In 2007 the average amount spent on food in other Canadian households was about $609 per month (4).
The average household in Nunavut spent $ 823 per month on shelter. This amount includes rent or mortgage, electricity, heating fuel, gas, water and sewage, and garbage.
According to Statistics Canada’s Survey of household spending, the average Canadian household spent $1,137 per month on shelter in 2007 (4)..
Nunavut households spend more on food and shelter than other Canadian households.
$2162$1884$1964
$1261
Homes with children
Homes with no children
Money spent on food per household each month
Private housing
Public housing
$1560$1349
$669$319
Homes with children
Homes with no children
Money spent on shelter per household each month
Private housing
Public housing
References 1. Statistics Canada. 2006. The 2006 Census: Aboriginal peoples. Available: www.statcan.gc.ca/2008/10000/‐ceb10000_000‐
eng.htm (accessed October 1, 2009).
2. Nord, M., Andrews, M., & Carlson, S. 2006. Household food security in the United States, 2005. Economic Research Report No 29, Washington (DC): Economic Research Service, United States Department of Agriculture. Available: www.fns.usda.gov/fsec/files/fsguide.pdf (accessed Nov 9, 2009).
3. Office of Nutrition Policy and Promotion. 2007. Canadian Community Health Survey Cycle 2.2, Nutrition (2004). Income‐related household food security in Canada. Ottawa (ON): Health Canada.
4. Statistics Canada. 2007. Survey of household spending. Available: www.statcan.gc.ca/pub/62‐202‐x/2006000/t001‐eng.htm (accessed October 14, 2009).

2007–2008 INUIT HEALTH SURVEY •NUNAVUT 15
RESULTS FROM INDIVIDUAL QUESTIONNAIRES
The majority of participants thought their health was good to excellent.
Overview
25.3
46.8
27.9
Excellent/Very good
Good Fair/Poor
Self‐reported general health (%)
n=417
n=770
n=459
25% of participants thought their health was excellent or very good.
According to the Aboriginal Peoples Survey, 2006 half of Inuit aged 15 and over self‐reported to be in excellent or very good health but were less likely to report excellent or very good health than their Canadian counterparts (1).
27.1
44.7
28.3
24.2
48.2
27.6
Excellent/Very good
Good
Fair/Poor
Self‐reported general health by gender (%)
Men
n=274n=185
n=478
n=292
n=240n=177
Women Dental Health
The survey found that 47% of participants felt that their gums
and teeth needed some work or had an ongoing problem.
29.6
46.4
Men Women
Denture or partial plate (%)
n=197
n=471
Many participants had dentures or partial plates, especially female participants.
16 2007–2008 INUIT HEALTH SURVEY •NUNAVUT
REPORTED FAMILY HEALTH HISTORY
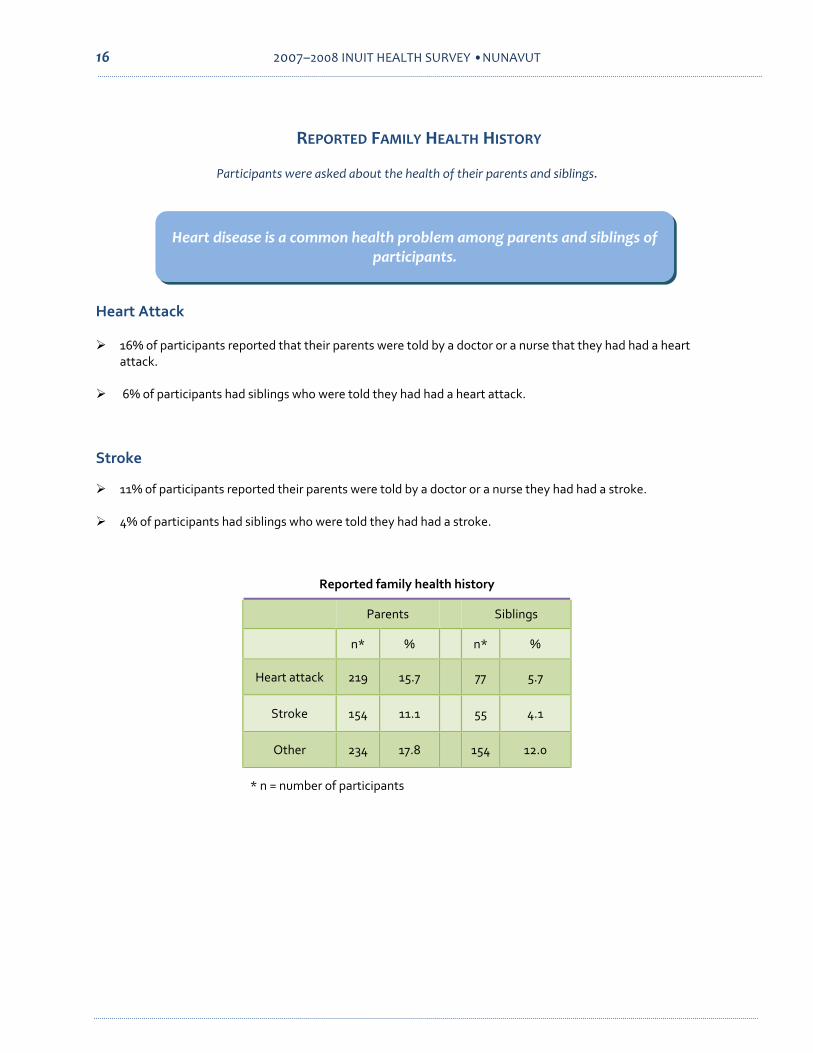
Participants were asked about the health of their parents and siblings.
Heart disease is a common health problem among parents and siblings of participants.
Heart Attack
16% of participants reported that their parents were told by a doctor or a nurse that they had had a heart
attack.
6% of participants had siblings who were told they had had a heart attack.
Stroke
11% of participants reported their parents were told by a doctor or a nurse they had had a stroke.
4% of participants had siblings who were told they had had a stroke.
Reported family health history
Parents Siblings
n* % n* %
Heart attack 219 15.7 77 5.7
Stroke 154 11.1 55 4.1
Other 234 17.8 154 12.0
* n = number of participants

2007–2008 INUIT HEALTH SURVEY •NUNAVUT 17
Diabetes
12% of participants reported that their parents were told by a doctor or nurse that they had diabetes.
5% of participants had siblings who were told they had diabetes.
High Blood Pressure
30% of participants had parents who had been told by a doctor or nurse that they had high blood pressure.
13% of participants had siblings who were told they had high blood pressure.
Cancer
More than one‐third (34%) of participants had parents who had been told that they had a cancer.
12% of participants had siblings who were told they had a cancer.
High Cholesterol
13% of participants had parents who had been told by a doctor or nurse that they had high cholesterol.
7% of participants had siblings who were they had high cholesterol.
Reported family health history
Parents Siblings
n* % n* %
Diabetes 143 11.5 60 4.9
High blood pressure 336 30.2 146 13.3
Cancer 474 33.5 159 12.1
High cholesterol 137 13.4 66 6.5
* n = number of participants
Diabetes, high blood pressure, cancer and high cholesterol are common health problems for parents and siblings of participants.

18 2007–2008 INUIT HEALTH SURVEY •NUNAVUT
PARTICIPANTS’ MEDICAL INFORMATION
Participants were asked about their own health.
Very few participants reported having been told they had heart disease or had had a stroke.
Diabetes, cancer, high blood pressure and high cholesterol are common health problems among participants in Nunavut.
Diabetes
6% of all participants had been told by a doctor or nurse that they had diabetes. Only 1% of participants less than 40 years of age had been told they had diabetes, while 11% of those age 40 and above had been told they had diabetes.
The prevalence of diabetes in Canada was 5.8% in 2007 (2).
The majority of participants with diabetes used medication as the main treatment.
Cancer
8% of participants 40 years of age and above reported they had been told they had a cancer. 6% of women and 3% of men reported having cancer.
High Blood Pressure
33% of participants 40 and above had been told they had high blood pressure; 25% of women and 22% of men reported having high blood pressure.
According to the Canadian Community Health Survey, about 16% of Canadians suffered from high blood pressure in 2007 (2).
The majority of participants with high blood pressure used medication as the main treatment. Diet and exercise were also important treatments.
High Cholesterol
High cholesterol was a common health problem, especially for those 40 and over.
The majority of participants with high cholesterol followed a treatment of medication. Many also followed a program of diet and exercise.

2007–2008 INUIT HEALTH SURVEY •NUNAVUT 19
Participants’ health history
Age Gender
<40 yr ≥40 yr Men Women
n % n % n % n %
Diabetes 10 1.2 92 11.2 43 6.7 59 5.9
Cancer 17 2.0 62 7.5 21 3.2 58 5.8
High blood pressure 119 14.5 268 32.9 140 21.6 247 25.1
High cholesterol 23 2.8 135 16.8 53 8.3 105 10.7
Reproductive health
Time of most recent Pap test
Age
<40 yr ≥40 yr
n % n %
Last 2 years 413 82.9 315 69.2
More than 2 years
32 6.4 53 11.6
Never or more than 5 years
53 10.6 87 19.1
Most women had had a Pap test within two years of the survey; however, 4% of women had never had a Pap test.
Women 40 years of age and above had had 5.9 pregnancies and 4.7 live births, while women below 40 years of age had had 3.5 and 2.7, respectively.
4.7
2.7
5.9
3.5
Age ≥40 yr
Age <40 yr
Pregnancies and live births (N)
Pregnancies
Live births

20 2007–2008 INUIT HEALTH SURVEY •NUNAVUT
Physical activity
On average 84% of participants walked on 5 days for at least 20 minutes in the week prior to the survey. Men walked for almost 145 minutes on these days and women walked for 107 minutes.
48% of respondents to the 2005 Canadian Community Health Survey, aged 12 and older, reported that they walked less thanhalf an hour each day in their leisure time (3).
Smoking Habits
Smoking is very common in Nunavut.
At the time of the survey, 73% of participants reported that they were smoking cigarettes.
4.6
5.3
5.6
4.2
74.2
70.5
62.4
83.1
21.1
24.3
32.0
12.7
Female
Male
Age≥40
Age<40
Smoking (%)
In comparison, 22% of other Canadians smoked in 2007 (4).
22% of participants had already stopped smoking.
On average, men smoked 13 and women 10 cigarettes per day.
The average age when participants began smoking
was 15.1 years.
It is well known that smoking causes cancer, emphysema, and heart disease. Quitting smoking is the best thing you can do to improve your health and quality of life (5).
Ex smoker Current smoker Non smoker
n=107n=699
n=35
n=35
n=269n=524
n=47
n=468n=161
n=47n=755
n=215

2007–2008 INUIT HEALTH SURVEY •NUNAVUT 21
SOCIAL DEMOGRAPHIC INFORMATION Marital Status
The majority of participants in Nunavut are married or have a common law partner.
This survey found that the majority of participants (> 60%) were married or had acommon law partner.
36.8
13.2
25.9
23.5
59.6
66.8
59.0
69.6
<40 years
≥40 years
Women
Men
Participants' marital status (%)
Married/common law partner Education
About 34% of participants in Nunavut completed secondary school.
Highest level of schooling completed
n %
Less than secondary 1089 66.0
Secondary completed 252 15.3
Any post secondary 309 18.7
Personal Income
53% of participants in Nunavut received their income from wages and salaries, self‐employment, carving,
sewing, crafts/arts and home daycare.
For 5% of participants, their main source of income was income support.
Single
n=462
n=308
n=156
n=599n=263
n=562
n=111
n=499
The main source of income was work related. Just over one third of participants had full‐time employment.

22 2007–2008 INUIT HEALTH SURVEY •NUNAVUT
5% of participants received their income from pensions,
benefits from Canada/Nunavut pension plan, suand annuities.
perannuation
24 % of participants received their income from other
sources (employment insurance, workers’ compensation, hunter support program, child support, alimony, dividends, interest, and child tax benefit).
55% of participants less than 65 years of age estimated their
personal income to be less than $20,000.00 per year.
73% of participants 65 years of age and older estimated their personal income to be less than $20,000 per year.
Employment
At the time of the interview 36% of participants had
full‐time employment.
References 1. Tait H. 2008. Aboriginal Peoples Survey 2006: Inuit Health and Social Conditions. Ottawa (ON): Statistics Canada.
Available: www.dsp‐psd.pwgsc.gc.ca/collection_2008/statcan/89‐637‐X/89‐637‐x2008001 (accessed March 8, 2010).
2. Statistics Canada. 2008. Canadian Community Health Survey Cycle 4.1, Health Indicators (2003‐2007), catalogue 82‐221‐X, Available: www.statcan.gc.ca/pub/82‐221‐x/2008001/structure/hs‐es/conditions/../../cchs03‐en.xls (accessed October 19, 2009).
3. Gilmour H. 2007. Physically active Canadians. Health reports, vol.18, no.3. Statistics Canada, catalogue 82‐003, Available: www.statcan.gc.ca/pub/82‐003‐x/2006008/article/phys/10307‐eng.pdf (accessed April 21, 2010).
4. Health Canada. Tobacco Effects. First Nations, Inuit and Aboriginal Health. Ottawa (ON): Health Canada. Available: www.hc‐sc.gc.ca/fniah‐spnia/substan/tobac‐tabac/effects‐effets‐eng.php (accessed April 27, 2010).
5. Lung Association of Canda. Facts about smoking. Available: www.lung.ca/home‐accueil_e.php (accessed April 27,2010).
Employment status
n %
Full time 586 36.1
Part‐time /occasional work 338 20.8
Other 700 43.1
52.8
4.9
17.9
24.4
Main source of income (%)
Work related (n=882)Retirement income (n=81)Income support (n=298)Other (n=407)
55.2
19.1 11.8 13.4
72.9
15.06.5 5.6
< 20,000 20,000 ‐ 40,000 40,000 ‐ 60,000 > 60,000
Personal income (%)
< 65 years ≥ 65 years
n=754
n=261n=161 n=183
n=78
n=16n=7 n=6

2007–2008 INUIT HEALTH SURVEY •NUNAVUT 23
Clinical Findings
During the health survey, participants had their standing height (without shoes) and sitting height measured, as well as their weight and waist circumference. Healthy Body Weight
Body mass index (BMI) is commonly used to assess whether one has a healthy body weight for one’s height. BMI is calculated by taking weight in kilograms and dividing it by [(height in meters) x (height in meters)].
BMI = Wt (kg)
[ht(m) x ht(m)]
39% of participants (n=647) had a healthy body weight.
Health Risk classification according to BMI (1)
BMI Classification Risk of
developing health problems
< 18.5 Under weight Increased
18.5‐24.9
Normal weight Least
> 24.9 Overweight &
Obese Increased
2.1%n=35
38.7%n=647
59.2%n=991
Participants in each classification according to BMI
Underweight
Normal weight
Overweight & Obese
Waist Circumference
A waist circumference greater than 102 cm for men and greater than 88 cm for women is associated with a greater risk for health problems.
In Nunavut, 55% of women (n=544) and 22% of men (n=146) had an “at‐risk” waist circumference.

24 2007–2008 INUIT HEALTH SURVEY •NUNAVUT
Standing Height
Average height of participants
cm ft/in
Men (n=662) 165.3 5’5”
Women (n=1003) 155.9 5’1”
Sitting Height
Because BMI is influenced by leg length, someone with long legs will have a lower BMI than someone with shorter legs but a similar size torso.
When BMI was adjusted by sitting height, the percentage of participants in the healthy weight category went
up and the percentage in the obese and overweight categories went down slightly.
Blood Lipids
The type and amount of lipids circulating in the blood stream provide an indication of a person’s risk for cardiovascular disease.
Nurses collected fasting blood samples in the morning from participants. These samples were used to assess total cholesterol, low density lipoprotein cholesterol (LDL‐chol) which is the unhealthy cholesterol, high density lipoprotein cholesterol (HDL‐chol) which is the healthy cholesterol, and triglycerides.
38% of Nunavut participants had a level of total
cholesterol that was too high. 24% had high levels of the unhealthy cholesterol (LDL‐chol). 17% had low levels of healthy cholesterol (HDL‐chol). Triglyceride levels were too high for 12% of participants
Participants’ Lipid Levels
76.5%
23.5%
LDL‐cholesterol
Good Too high
87.6%
12.4%
Triglycerides
Good Too high
62.3%
37.7%
Total cholesterol
83.1%
16.9%
HDL‐cholesterol
Good Too high Good Too low

2007–2008 INUIT HEALTH SURVEY •NUNAVUT 25
Blood Pressure
Blood pressure is the force needed to deliver blood to all
essure (the blood
is
Blood pressure was measured 3 times when participants
It is important to keep blood pressure at “normal” levels because with high blood pressure or hypertension
Untreated high blood pressure is a risk for heart disease and stroke (2).
parts of our body. Blood pressure is always given as 2 numbers, systolic pressure and diastolic pressure, a higher number over a lower number.
Nurses measured the systolic blood prpressure when the heart is squeezing and sending to the rest of the body = the higher number) and the diastolic blood pressure (the pressure when the heartrelaxing and filling up with blood again = the lower number).
were at rest.
the heart has to work harder and your blood vessels take a beating (2).
Blood pressure category
Systolic pressure
Diastolic pressure
Normal < 120 < 80
Pre‐hypertension 120 ‐139 80 ‐ 89
Hypertension stage 1
140 ‐ 159 90 ‐ 99
Hypertension stage 2
≥ 160 ≥ 100
A survey cannot diagnose hypertension, but does give a picture of the likely extent of blood pressure problems in Nunavut.
59.7n=950
27.8n=442
8.4n=133
2.1n=33
Participants in each blood pressure range (%)
Normal
Pre‐hypertension
Hypertension stage 1
Hypertension stage 2

26 2007–2008 INUIT HEALTH SURVEY •NUNAVUT
Type 2 Diabetes Mellitus
When blood sugar is too high it is a sign that the cells in the body are not getting the fuel they need to function properly, and that a person may have pre‐diabetes or type 2 diabetes.
Fasting blood samples were used to test for blood sugar (glucose).
About 35% of survey participants had a second blood sample taken two hours after drinking a flavoured glucose sugar drink. The test is called an oral glucose tolerance test (OGTT) and is a way of seeing how the body handles glucose.
A survey cannot diagnose diabetes. However, results suggest that about 6% of participants have fasting glucose levels that are too high, suggesting
either pre‐diabetes or Type 2 diabetes.
6.3% 8.3%
Fasting glucose > 6 mmol/L Post OGTT glucose > 7.8 mmol/L
Participants with "at risk" glucose levels
The survey found that 6% of participants in Nunavut had a fasting glucose level that was too high (> 6 mmol/L) which indicates either pre‐diabetes or diabetes. 8% had a 2‐hour OGTT glucose level that was too high (>7.8 mmol/L) which indicates pre‐diabetes or Type 2 diabetes.
References 1. Health Canada. 2003. Canadian Guidelines for Body Weight Classification in Adults. Minister of Public Works and
Government Services Canada. Ottawa, Ontario.
2. American Heart Organization. Understanding blood pressure readings. Available: www.americanheart.org/presenter.jhtml?identifier=2112 (accessed April 22, 2010).

2007–2008 INUIT HEALTH SURVEY •NUNAVUT 27
WHAT ADULTS ATE
Country Food
Country food is a rich source of nutrients.
What we eat and drink along with other lifestyle factors, has the potential to protect us from or increase our
risk of chronic diseases such as heart disease, diabetes (high blood sugar) and osteoporosis (weak bones).
Country food consumption in the 12 months prior to the survey:
• Men ate more country food than women.
• Older adults (≥ 40 years of age) ate more country food than younger adults (< 40 years of age).
• Fresh and dried caribou meat and char were country foods that were eaten often and in large
quantities.
• Ringed seal meat was also eaten very often but in smaller quantities.
Most commonly consumed country food in Nunavut (n=1569)
96.2
88.9
74.5
74.0
70.9
70.5
50.6
47.8
44.7
44.0
Caribou meat (fresh)
Arctic char
Caribou meat (dried)
Ringed seal meat
Berries
Caribou tongue
Ringed seal liver
Canada Goose
Beluga mattaaq w/o blubber
Beluga mattaaq w blubber
% consuming
This column shows on average, how much of each country food was eaten by each
participant who reported consuming these foods.
208.0
112.7
124.8
59.1
13.0
14.8
Average g/day
18.1
22.8
20.4
45.0
This column shows the proportion (%) of participants, who reported eating each
of the country foods listed.
28 2007–2008 INUIT HEALTH SURVEY •NUNAVUT
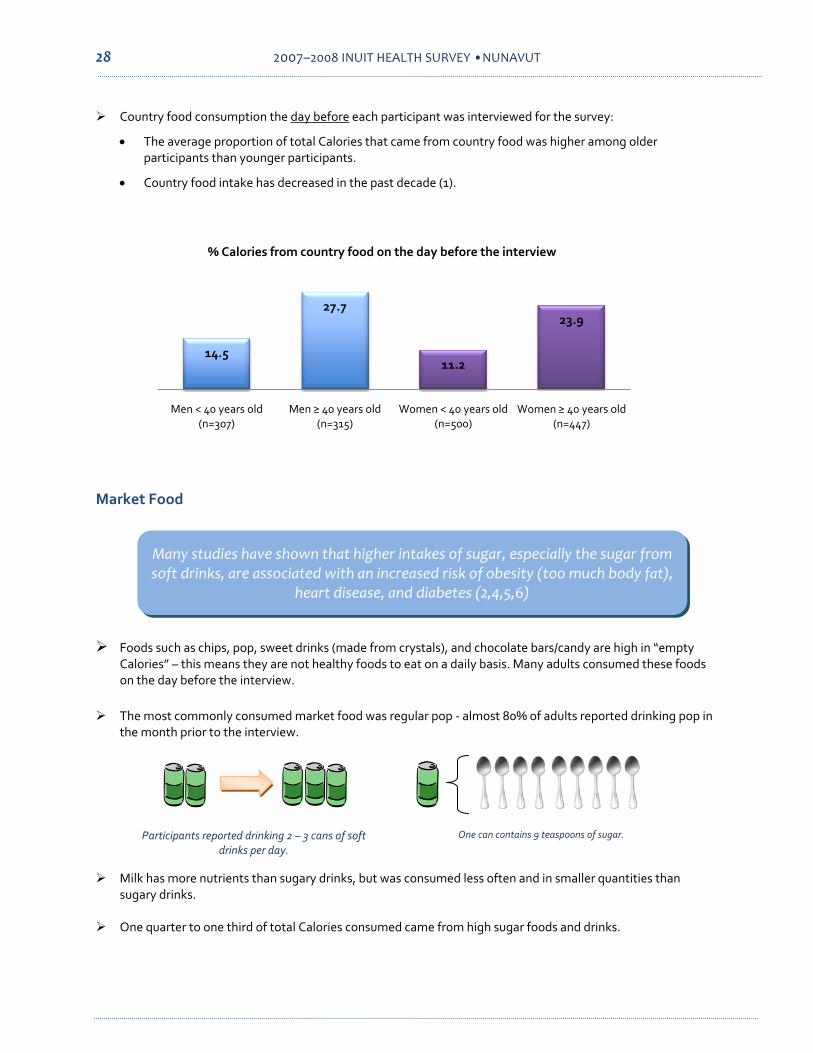
Country food consumption the day before each participant was interviewed for the survey:
• The average proportion of total Calories that came from country food was higher among older participants than younger participants.
• Country food intake has decreased in the past decade (1).
14.5
27.7
11.2
23.9
Men < 40 years old (n=307)
Men ≥ 40 years old (n=315)
Women < 40 years old (n=500)
Women ≥ 40 years old (n=447)
% Calories from country food on the day before the interview
Market Food
Many studies have shown that higher intakes of sugar, especially the sugar from soft drinks, are associated with an increased risk of obesity (too much body fat),
heart disease, and diabetes (2,4,5,6)
Foods such as chips, pop, sweet drinks (made from crystals), and chocolate bars/candy are high in “empty Calories” – this means they are not healthy foods to eat on a daily basis. Many adults consumed these foods on the day before the interview.
The most commonly consumed market food was regular pop ‐ almost 80% of adults reported drinking pop in the month prior to the interview.
Participants reported drinking 2 – 3 cans of soft drinks per day.
One can contains 9 teaspoons of sugar.
Milk has more nutrients than sugary drinks, but was consumed less often and in smaller quantities than sugary drinks.
One quarter to one third of total Calories consumed came from high sugar foods and drinks.

2007–2008 INUIT HEALTH SURVEY •NUNAVUT 29
35.8
27.236.3 29.0
Men < 40 years old
(n=307)Men ≥ 40 years old
(n=315)Women < 40 years old
(n=500)Women ≥ 40 years old
(n=447)
% Calories from foods with more than 25% of energy as sugar on the day before the interview
Calories, Fat, Protein and Carbohydrates
Men consumed more Calories than women, and younger adults consumed more Calories than older adults.
Average Caloric intake was higher among participants in Nunavut compared with the rest of Canadians in the 2004 Canadian Community Health Survey (CCHS) (2).
2588
2183
2094
1841
Men < 40 years old (n=307)
Men ≥ 40 years old (n=315)
Women < 40 years old (n=500)
Women ≥ 40 years old (n=447)
Average Caloric intake
Men consumed more Calories as protein than women.
Men consumed fewer Calories as carbohydrates than women.
Acceptable intake ranges for carbohydrate, protein, and fat (3)
Carbohydrate Protein Fat
45 – 65 % 10 – 35% 20 – 35%
Protein23%
Fat32%
Men (n=622)
Carbohydrates42%
Protein20%
Fat31%
Women (n=947)
Carbohydrates47%

30 2007–2008 INUIT HEALTH SURVEY •NUNAVUT
Folate
Folate is important for healthy pregnancies.
Folate in red blood cells showed adequate levels for women of reproductive age. Iron Status and Anemia
Iron has many functions in our body.
One important function is transporting the oxygen we breath in throughout the body.
Not having enough iron in your blood can make you feel weak, tired, and cold.
Not eating enough iron can lead to iron deficiency, the most common nutritional deficiency in the world.
Country foods like caribou meat, liver, duck, dried meat, and fish are good sources of iron. Beef, ham, and chicken are also high in iron.
Men appear to have good iron status.
Iron status among Nunavut participants
Definitions Men (%) Women (%)
Anemia (weak blood) Low hemoglobin in
blood 20 26
Iron deficiency Low iron stores in the
body 6 32
Iron deficiency + Anemia
Very low iron stores and low hemoglobin
3 13
Iron deficiency is more common among women, especially young women.

2007–2008 INUIT HEALTH SURVEY •NUNAVUT 31
Vitamin D
The majority of Inuit need more vitamin D.
Vitamin D is important for good bone health. Not getting enough can lead to brittle bones.
Foods containing vitamin D include arctic char, blubber, liver, fatty fish, and vitamin D fortified milk.
Only about 10% of participants under 40 years of age had the recommended level of Vitamin D.
Levels of 25‐hydroxyvitamin D in the blood stream are used to determine vitamin D status.
Vitamin D status measured in blood
25(OH)D nmol/L
Status
> 75 Ideal
37.5 – 75 Enough, but not ideal
< 37.5 Deficient
6.7
40.0
53.3
10.3
72.4
17.2
30.1
62.0
8.0
41.5 41.5
16.9
Ideal Enough, but not ideal
Deficient Ideal Enough, but not ideal
Deficient
< 40 yrs old
≥ 40 yrs old
Men's vitamin D status (%)Women's vitamin D status (%)

32 2007–2008 INUIT HEALTH SURVEY •NUNAVUT
Sun Exposure
People should get some sun every day for more vitamin D.
The body can make vitamin D when the skin is exposed to sunlight during the summer months.
The survey found that more than 44% of participants spend more than 2 hours in the sun during the summer months, while 7% of participants do not spend any time in the sun.
Exposing arms and legs to direct sunlight for 5 to 30 minutes between 10:00 AM and 3:00 PM twice a week in the summer appears to be sufficient to make vitamin D. The time required depends on the time of day, season, latitude and skin pigmentation. (7)
7.4 13.6 11.822.7
44.4
None < 30 min 30‐60 min 1‐2 h > 2 h
Summer months sun exposure (%)
n=89n=163 n=141
n=272
n=532
References 1. Kuhnlein, H, Receveur O, Soueida R, Egeland GM. 2004. Arctic Indigenous Peoples Experience the Nutrition Transition
with Changing Dietary Patterns and Obesity. J. Nutr. 134 (6):1447‐53.
2. Garriguet, D. 2007. Canadians' Eating Habits. Health Reports. 18(2):17‐32.
3. Institute of Medicine, Food and Nutrition Board. 2005. Dietary Reference Intakes for Energy, Carbohydrates, Fiber, Fat, Fatty Acids, Cholesterol, Protein, and Amino Acids. The National Academies Press. Washington DC.
4. Chen, L, Appel LJ, Loria C, et al. 2009. Reduction in consumption of sugar‐sweetened beverages is associated with weight loss: the PREMIER trial. Am J Clin Nutr. 89(5):1299‐1306.
5. Stanhope, KL, Schwarz JM, Keim NL, et al. 2009. Consuming fructose‐sweetened, not glucose‐sweetened, beverages increases visceral adiposity and lipids and decreases insulin sensitivity in overweight/obese humans. J Clin Invest. 119(5):1322‐32.
6. Schulze, MB, Manson JE, Ludwig DS, et al. 2004. Sugar‐sweetened beverages, weight gain, and incidence of type 2 diabetes in young and middle‐aged women. JAMA. 292(8):927‐34.
7. Holick, MF. 2007. Vitamin D deficiency. NEJM. 357(3):266‐81.
2007–2008 INUIT HEALTH SURVEY •NUNAVUT 33
PARASITIC DISEASES AND HELICOBACTER PYLORI
Blood samples from participants were tested to determine exposure to several parasites and to the bacteria called Helicobacter pylori.
It is important to remember that a positive test indicates exposure at some time during the person’s life, and does not necessarily mean an active infection.
Parasitic Diseases Echinococcosis
Caused by Echinococcus sp., a tape worm. The form found in northern communities exists in wolves, moose and caribou.
Eating meat from infected animals or contact with dog feces are the routes for human infection.
The infection is not common. 6% of participants (n=100) had a positive test.
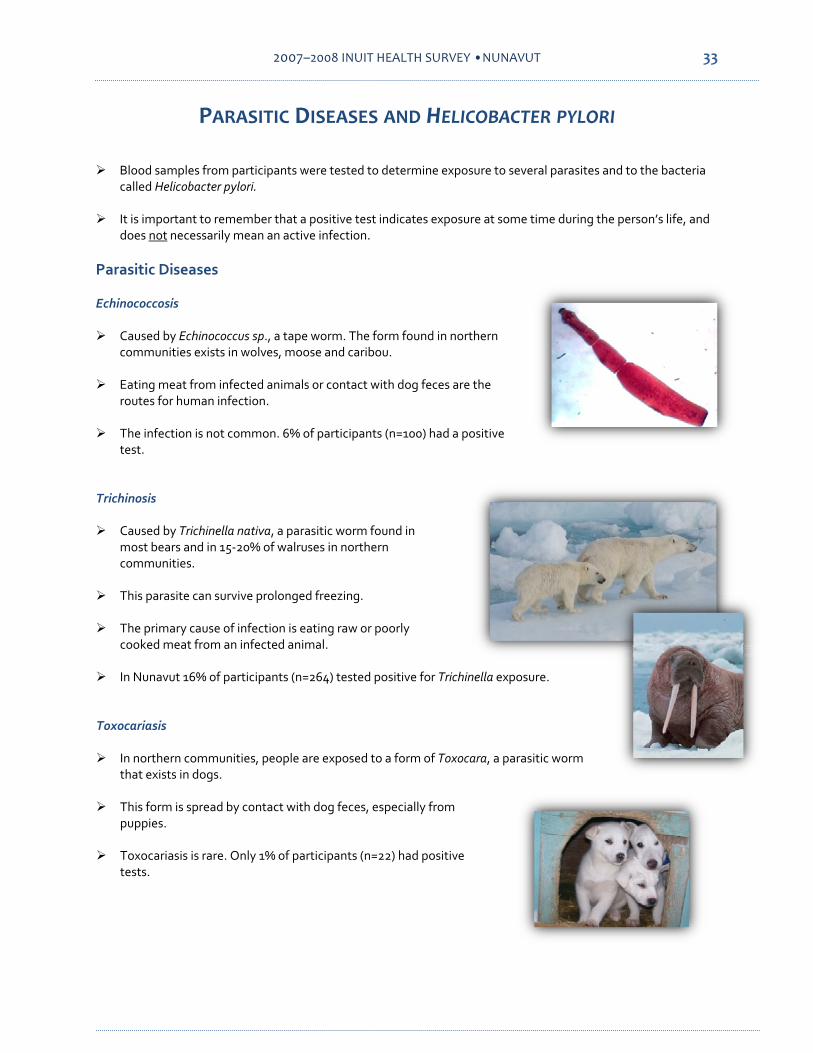
Trichinosis
Caused by Trichinella nativa, a parasitic worm found in most bears and in 15‐20% of walruses in northern communities.
This parasite can survive prolonged freezing.
The primary cause of infection is eating raw or poorly cooked meat from an infected animal.
In Nunavut 16% of participants (n=264) tested positive for Trichinella exposure. Toxocariasis
In northern communities, people are exposed to a form of Toxocara, a parasitic wormthat exists in dogs.
This form is spread by contact with dog feces, especially from
puppies.
Toxocariasis is rare. Only 1% of participants (n=22) had positive tests.

34 2007–2008 INUIT HEALTH SURVEY •NUNAVUT
Toxoplasmosis
Caused by Toxoplasma gondii, one of the most successful parasites in the world. There are more than 2 billion people infected globally.
Any animal can be infected, so raw and poorly cooked meat, as well as exposure to cat feces, can be sources of infection.
Freezing at very low temperatures for a long time may kill the parasite, but is not a guarantee.
Toxoplasmosis is the most common parasitic infection in the North. In Nunavut 28% of participants (n=459) had a positive test.
Infection is life‐long, but is not usually a problem except for women who become infected during pregnancy and for people with compromised immunity.
Brucellosis
Caused by bacteria that infect many mammals, including marine mammals.
Exposure can come during slaughter and cleaning of animals.
Infection is very rare. Fewer than 2% of participants in Kivalliq and Baffin had positive tests.
7.2
23.5
5.1
20.7
< 40 years ≥ 40 years
Toxoplasmosis in Nunavut (%)
MenWomen
2007–2008 INUIT HEALTH SURVEY •NUNAVUT 35
Bacteria
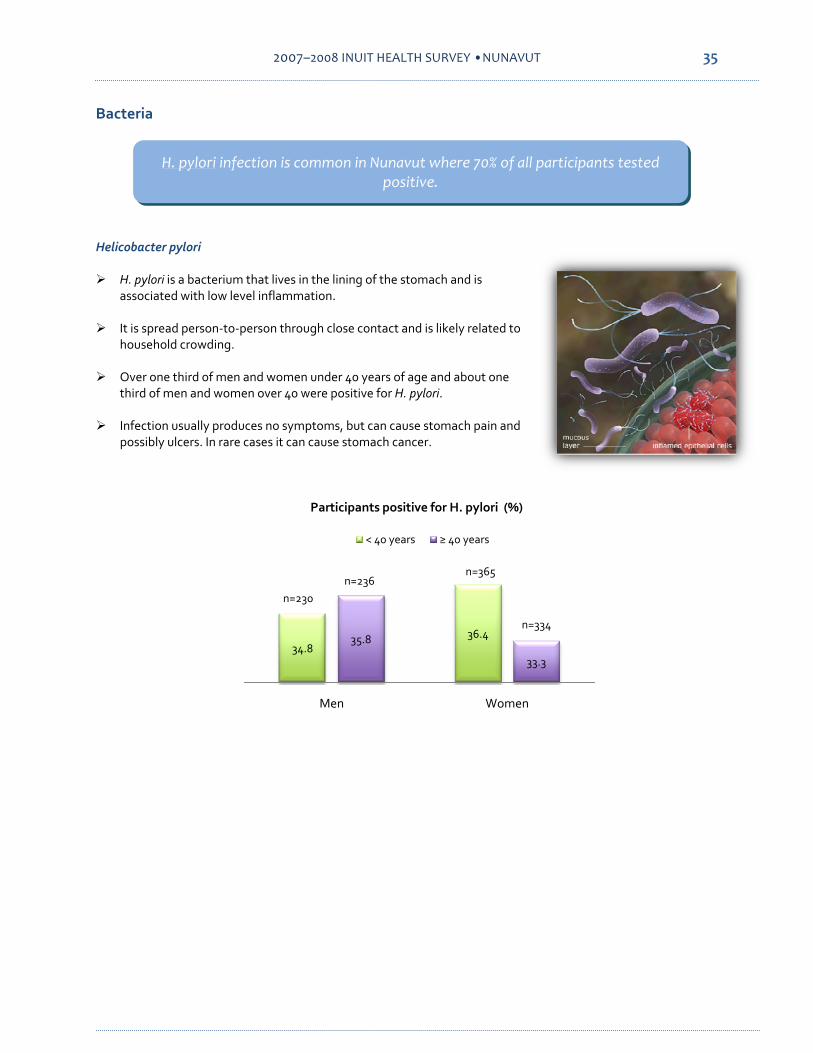
H. pylori infection is common in Nunavut where 70% of all participants tested positive.
Helicobacter pylori
H. pylori is a bacterium that lives in the lining of the stomach and is associated with low level inflammation.
It is spread person‐to‐person through close contact and is likely related to household crowding.
Over one third of men and women under 40 years of age and about one
third of men and women over 40 were positive for H. pylori.
Infection usually produces no symptoms, but can cause stomach pain and possibly ulcers. In rare cases it can cause stomach cancer.
34.836.435.8
33.3
Men Women
Participants positive for H. pylori (%)
< 40 years ≥ 40 years
n=230n=236
n=365
n=334

36 2007–2008 INUIT HEALTH SURVEY •NUNAVUT
DATA TABLES
FOR
KIVALLIQ, BAFFIN AND KITIKMEOT

2007–2008 INUIT HEALTH SURVEY •NUNAVUT 37
RESULTS FROM HOME‐BASED QUESTIONNAIRES
Type of housing
Public Private Other*
n % n % n %
Kivalliq 317 81.9 61 15.8 9 2.3
Baffin 481 73.6 129 19.7 44 6.7
Kitikmeot 212 70.0 86 28.4 5 2.7
Nunavut 1010 75.2 276 20.5 58 4.3
* Includes housing provided by a third party such as government or a company.
Homes with mold and/or needing major repairs
Major repairs
Mold
Major repairs & Mold
n % n % n %
Kivalliq 106 28.2 14 3.7 72 19.2
Baffin 141 23.1 39 6.4 85 13.9
Kitikmeot
107 36.4
22 7.5
48 16.3
Nunavut 354 27.6 75 5.9 205 16
Shelter for homeless people
Homes providing shelter
Average number of people
Median stay (weeks)
n % n n
Kivalliq 56 14.6 2.3 6.5
Baffin 137 21.0 2.2 9.7
Kitikmeot 42 13.9 2.7 4.3
Nunavut 235 17.5 2.3 8.7

38 2007–2008 INUIT HEALTH SURVEY •NUNAVUT
Household crowdinga
Homes with children Homes without children
Crowded Crowded Total (N) n % Total (N) n %
Kivalliq 303 144 49.2 78 1 1.3
Baffin 481 157 33.3 138 4 3.0
Kitikmeot 231 92 43.6 67 1 1.6
Nunavut 1015 393 40.3 283 6 2.2 a More than 1 person per room, including kitchen, living room and bedrooms (Statistics Canada).
Languages spoken in the home
Inuktitut Innuinaqtun Netsilik English French
n % n % n % n % n %
Kivalliq 294 75.4 2 0.5 0 0 146 37.4 0 0
Baffin 585 89.3 2 0.3 0 0 169 25.8 1 0.2
Kitikmeot 72 23.8 31 10.2 6 2.0 256 84.5 1 0.3
Nunavut 951 70.6 35 2.6 6 0.5 571 42.4 2 0.2
Smoking in households
Households with
smokers Smoking forbidden
indoors n % n %
Kivalliq 340 87.2 247 79.4
Baffin 588 90.5 407 70.7
Kitikmeot 277 91.4 196 85.2
Nunavut 1205 89.7 850 76.1
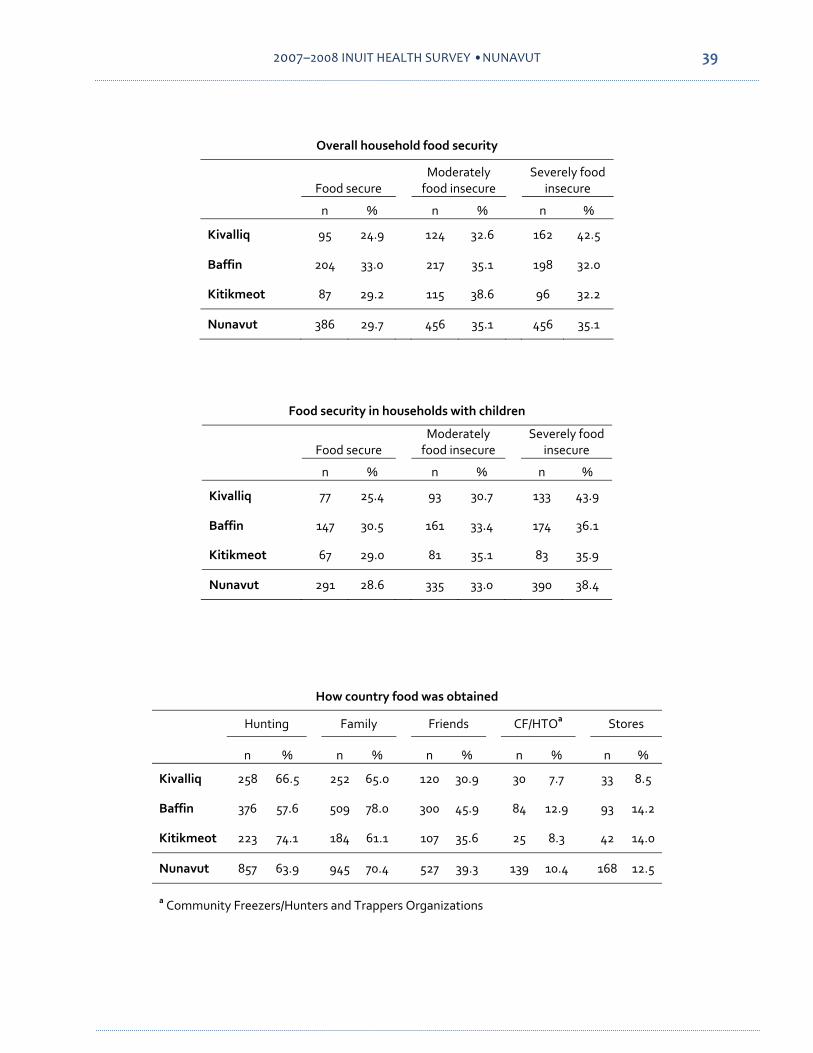
2007–2008 INUIT HEALTH SURVEY •NUNAVUT 39
Overall household food security
Food secure
Moderately food insecure
Severely food insecure
n % n % n %
Kivalliq 95 24.9 124 32.6 162 42.5
Baffin 204 33.0 217 35.1 198 32.0
Kitikmeot 87 29.2 115 38.6 96 32.2
Nunavut 386 29.7 456 35.1 456 35.1
Food security in households with children
Food secure
Moderately food insecure
Severely food insecure
n % n % n %
Kivalliq 77 25.4 93 30.7 133 43.9
Baffin 147 30.5 161 33.4 174 36.1
Kitikmeot 67 29.0 81 35.1 83 35.9
Nunavut 291 28.6 335 33.0 390 38.4
How country food was obtained
Hunting Family Friends CF/HTOa Stores
n % n % n % n % n %
Kivalliq 258 66.5 252 65.0 120 30.9 30 7.7 33 8.5
Baffin 376 57.6 509 78.0 300 45.9 84 12.9 93 14.2
Kitikmeot 223 74.1 184 61.1 107 35.6 25 8.3 42 14.0
Nunavut 857 63.9 945 70.4 527 39.3 139 10.4 168 12.5
a Community Freezers/Hunters and Trappers Organizations

40 2007–2008 INUIT HEALTH SURVEY •NUNAVUT
Limitations to getting country fooda
Gas & supplies
too expensive
No active hunter
No
transportation Scarce/hard to harvest
Weather/no time
n % n % n % n % n %
Kivalliq 112 38.9 121 42.0 91 31.6 28 9.7 18 6.3
Baffin 221 41.5 216 40.5 155 29.1 65 12.2 47 8.8
Kitikmeot 73 30.9 114 48.3 88 37.3 33 14.0 21 8.9
Nunavut 406 38.4 451 42.7 334 31.6 126 11.9 86 8.1
a Percentages do not add up to 100 because participants could give more than one answer.
How participants rated the cost of country food versus store‐bought food
Cheaper
Same
More expensive n % n % n %
Kivalliq 315 85.6 32 8.7 21 5.7
Baffin 404 70.0 97 16.8 76 13.2
Kitikmeot 221 76.2 43 14.8 26 9.0
Nunavut 940 76.1 172 13.9 123 10.0
Money spent per household on food each month
Homes with children Homes without children
Private housing Public housing Private housing Public housing
Kivalliq $2208 $1798
$1830 $1094
Baffin $1954 $1928 $1556 $1183
Kitikmeot $2421 $2274 $2232 $1655
Nunavut $2162 $1964 $1884 $1261

2007–2008 INUIT HEALTH SURVEY •NUNAVUT 41
Money spent per household on shelter each month
Homes with children Homes without children
Private housing Public housing Private housing Public housing
Kivalliq $1260 $497 $538 $272
Baffin $1796 $830 $1522 $324
Kitikmeot $1445 $578 $1448 $369
Nunavut $1560 $669 $1349 $319
RESULTS FROM INDIVIDUAL QUESTIONNAIRES
Participation by age and gender
Age Gender
<40 yr ≥40 yr Men Women n % n % n % n %
Kivalliq 299 51.1 286 48.9 249 42.6 336 57.4
Baffin 450 50.4 443 49.6 352 39.2 546 60.8
Kitikmeot 214 48.6 226 51.4 171 38.9 269 61.1
Nunavut 963 50.2
955 49.8
772 40.2 115
1 59.9
Participation and Refusal by household
Eligible
households Households that participated
Households that refused
N n % n %
Kivalliq 679 1372 60.4 207 30.5
Baffin 811 410 81.1 164 20.2
Kitikmeot 446 657 68.4 140 31.4
Nunavut 1936 307 70.9 511 26.4

42 2007–2008 INUIT HEALTH SURVEY •NUNAVUT
General health
Excellent/Very
good Good Fair/Poor n % n % n %
Kivalliq 113 22.2 248 48.7 148 29.1
Baffin 220 28.3 362 46.5 196 25.2
Kitikmeot 84 23.4 160 44.6 115 32.1
Nunavut 417 25.3 770 46.8 459 27.9
Participants with dentures or a partial plate
n %
Kivalliq 219 42.0
Baffin 348 43.7
Kitikmeot 101 27.8
Nunavut 668 39.7
Family health history (parents)
Heart attack Stroke Other heart disease
n % n % n %
Kivalliq 74 17.3 47 11.3 63 16.1
Baffin 106 16.2 75 11.3 133 21.0
Kitikmeot 39 12.4 32 10.4 38 13.2
Nunavut 219 15.7 154 11.1 234 17.8

2007–2008 INUIT HEALTH SURVEY •NUNAVUT 43
Family health history (siblings)
Heart attack Stroke Other heart disease
n % n % n %
Kivalliq 27 6.8 12 3.2 34 9.3
Baffin 38 6.1 26 4.1 86 14.1
Kitikmeot 12 3.8 17 5.3 34 10.9
Nunavut 77 5.7 55 4.1 154 12.0
Family health history (parents)
Diabetes
High blood pressure Cancer
High cholesterol
n % n % n % n %
Kivalliq 41 11.0 103 30.0 128 30.5 25 8.1
Baffin 74 12.8 157 30.1 245 35.7 81 16.9
Kitikmeot 28 9.7 76 30.4 101 32.6 31 13.1
Nunavut 143 11.5 336 30.2 474 33.5 137 13.4
Family health history (siblings)
Diabetes
High blood pressure Cancer
High cholesterol
n % n % n % n %
Kivalliq 15 4.3 53 16.6 44 11.5 13 4.5
Baffin 34 6.0 64 12.6 79 12.5 37 7.8
Kitikmeot 11 3.6 29 10.7 36 11.8 16 6.3
Nunavut 60 4.9 146 13.3 159 12.1 66 6.5

44 2007–2008 INUIT HEALTH SURVEY •NUNAVUT
Participants’ medical information
Heart attack Stroke Other heart disease
n % n % n %
Kivalliq 28 5.5 15 2.9 44 8.7
Baffin 29 3.7 11 1.4 79 10.0
Kitikmeot 10 2.8 9 2.5 33 9.1
Nunavut 67 4.0 35 2.1 156 9.4
Participants’ medical information
Diabetes
High blood pressure Cancer
High cholesterol
n % n % n % n %
Kivalliq 34 6.7 141 28.0 24 4.7 37 7.4
Baffin 50 6.4 173 22.1 38 4.8 90 11.6
Kitikmeot 18 5.0 73 21.0 17 4.7 31 9.0
Nunavut 102 6.2 387 23.7 79 4.8 158 9.8
Reproductive health: Time of most recent Pap test
Last 2 years 3 ‐ 5 years
Never or more than 5 years
n % n % n %
Kivalliq 200 70.9 29 10.3 53 18.8
Baffin 355 76.0 42 9.0 70 15.0
Kitikmeot 173 84.8 14 6.9 17 8.3
Nunavut 728 76.4 85 8.9 140 14.7

2007–2008 INUIT HEALTH SURVEY •NUNAVUT 45
Reproductive health: Pregnancies and live births
Pregnancies Live births
Average Average
Kivalliq 5.0 3.9
Baffin 4.5 3.6
Kitikmeot 4.7 3.5
Nunavut 4.7 3.7
Smoking habits
Current smoker Ex smoker Non smoker
n % n % n %
Kivalliq 373 71.5 120 23.0 29 5.6
Baffin 585 73.5 170 21.4 41 5.2
Kitikmeot 265 73.0 86 23.7 12 3.3
Nunavut 1223 72.8 376 22.4 82 4.9
Participants’ marital status
Single
Married / Common law partner
n % n %
Kivalliq 140 26.8 317 60.7
Baffin 206 25.9 491 61.6
Kitikmeot 73 20.3 253 70.3
Nunavut 419 25.0 1061 63.2

46 2007–2008 INUIT HEALTH SURVEY •NUNAVUT
Highest level of schooling completed
Less than secondary
Secondary completed Any post secondary
n % n % n %
Kivalliq 354 69.8 63 12.4 90 17.8
Baffin 506 64.7 106 13.6 170 21.8
Kitikmeot 229 63.4 83 23.0 49 13.6
Nunavut 1089 66.0 252 15.3 309 18.7
Employment status
Full time
Part‐time /occasional work Other
n % n % n %
Kivalliq 159 31.8 99 19.8 242 48.4
Baffin 292 38.2 155 20.3 318 41.6
Kitikmeot 135 37.6 84 23.4 140 39.0
Nunavut 586 36.1 338 20.8 700 43.1
Main source of income
Work related
Retirement income Income support Other
n % n % n % n %
Kivalliq 232 44.7 23 4.4 101 19.5 163 31.4
Baffin 432 54.6 37 4.7 137 17.3 185 23.4
Kitikmeot 218 60.9 21 5.9 60 16.8 59 16.5
Nunavut 882 52.9 81 4.9 298 17.9 407 24.4

2007–2008 INUIT HEALTH SURVEY •NUNAVUT 47
Personal income
<20,2000 20,000‐40,000 40,000‐60,000 >60,000 n % n % n % n %
Kivalliq 276 62.3 80 18.1 46 10.4 38 8.6
Baffin 381 54.2 138 19.6 85 12.1 97 13.8
Kitikmeot 175 53.5 59 18.0 37 11.3 54 16.5
Nunavut 832 56.5 277 18.8 168 11.4 189 12.8
Clinical Findings Participants in each weight category by Body Mass Index (BMI)
BMI < 18.5
BMI 18.5‐24.9
BMI > 24.9
Underweight Normal weight
Overweight or Obese
n % n % n %
Kivalliq 5 1.0
169 32.8
341 66.2
Baffin 9 1.2 367 47.0 405 51.9
Kitikmeot 21 0.6 111 31.0 245 68.4
Nunavut 35 2.1 647 38.7 991 59.2
Average standing height of participants
Men Women n cm ft/in n cm ft/in
Kivalliq 249 166.2 5’ 5” 336 154.3 5’ 1”
Baffin 352 164.5 5’ 5” 546 153.6 5’ ½”
Kitikmeot 171 165.3 5’ 5” 244 158.7 5’ 2½”
Nunavut 662 165.3 5’ 5” 1003 155.9 5’ 1”

48 2007–2008 INUIT HEALTH SURVEY •NUNAVUT
Participants in each waist circumference category
Men Women
Normal ≤ 102 cm
At risk >102 cm
Normal ≤ 88 cm
At risk >88 cm
n % n % n % n %
Kivalliq 154 73.0 57 27.0 120 41.2 171 58.8
Baffin 254 85.5 43 14.5 246 51.1 235 48.9
Kitikmeot 98 68.1 46 31.9 75 35.2 138 64.8
Nunavut 506 77.6 146 22.4 441 44.8 544 55.2
Participants with unhealthy blood lipid levels
Total
cholesterol (too high)
HDL‐cholesterol (too low)
LDL‐cholesterol (too high)
Triglycerides (too high)
n % n % n % n %
Kivalliq 163 31.8 69 13.5 107 21.0 68 13.3
Baffin 318 40.9 157 20.2 200 26.3 101 13.0
Kitikmeot 143 39.1 54 14.8 77 21.2 37 10.1
Nunavut 624 37.7 280 16.9 384 23.5 206 12.4
Participants in each blood pressure range
Normal
Pre‐hypertensive
Hypertension Stage 1
Hypertension Stage 2
n % n % n % n %
Kivalliq 286 60.7 135 28.7 41 8.7 9 1.9
Baffin 406 56.2 227 31.4 71 9.8 19 2.6
Kitikmeot 258 70.9 80 22.0 21 5.8 5 1.4
Nunavut 950 59.7 442 27.8 133 8.4 33 2.1
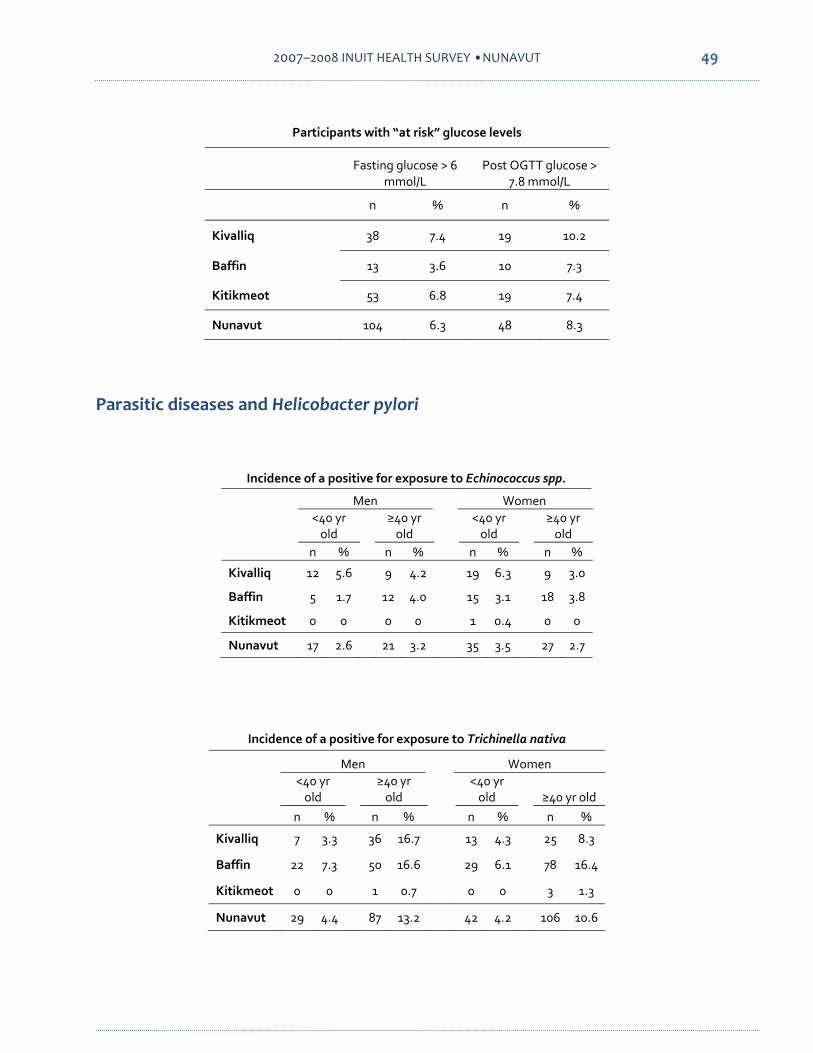
2007–2008 INUIT HEALTH SURVEY •NUNAVUT 49
Participants with “at risk” glucose levels
Fasting glucose > 6 mmol/L
Post OGTT glucose > 7.8 mmol/L
n % n %
Kivalliq 38 7.4 19 10.2
Baffin 13 3.6 10 7.3
Kitikmeot 53 6.8 19 7.4
Nunavut 104 6.3 48 8.3
Parasitic diseases and Helicobacter pylori
Incidence of a positive for exposure to Echinococcus spp.
Men Women
<40 yr old
≥40 yr old
<40 yr old
≥40 yr old
n % n % n % n %
Kivalliq 12 5.6 9 4.2 19 6.3 9 3.0
Baffin 5 1.7 12 4.0 15 3.1 18 3.8
Kitikmeot 0 0 0 0 1 0.4 0 0
Nunavut 17 2.6 21 3.2 35 3.5 27 2.7
Incidence of a positive for exposure to Trichinella nativa
Men Women
<40 yr old
≥40 yr old
<40 yr old ≥40 yr old
n % n % n % n %
Kivalliq 7 3.3 36 16.7 13 4.3 25 8.3
Baffin 22 7.3 50 16.6 29 6.1 78 16.4
Kitikmeot 0 0 1 0.7 0 0 3 1.3
Nunavut 29 4.4 87 13.2 42 4.2 106 10.6

50 2007–2008 INUIT HEALTH SURVEY •NUNAVUT
Incidence of a positive for exposure to Toxocara
Men Women
<40 yr old
≥40 yr old
<40 yr old
≥40 yr old
n % n % n % n %
Kivalliq 1 0.5 3 1.4 0 0 1 0.3
Baffin 0 0 7 2.3 1 0.2 5 1.0
Kitikmeot 0 0 1 0.7 0 0 3 1.3
Nunavut 1 0.2 11 1.7 1 0.1 9 0.9
Incidence of a positive for exposure to Toxoplasma gondii
Men Women
<40 yr old ≥40 yr old
<40 yr old ≥40 yr old
n % n % n % n %
Kivalliq 5 2.3 38 17.8 6 2.0 39 12.9
Baffin 37 12.4 87 29.1 43 9.0 134 28.1
Kitikmeot 5 3.5 29 20.3 2 0.9 34 15.2
Nunavut 47 7.2 154 23.5 51 5.1 207 20.7
Incidence of a positive for exposure to Brucella spp.
Men Women
<40 yr old
≥40 yr old
<40 yr old
≥40 yr old
n % n % n % n %
Kivalliq 2 1.2 5 2.9 3 1.3 5 2.1
Baffin 6 2.1 8 2.8 7 1.6 7 1.6
Kitikmeota
Nunavutb 8 1.8 13 2.9 10 1.5 12 1.7
a Not measured b Kivalliq and Baffin only

2007–2008 INUIT HEALTH SURVEY •NUNAVUT 51
Incidence of a positive test for Helicobacter pylori
Men Women <40 yr old ≥40 yr old <40 yr old ≥40 yr old
n % n % n % n %
Kivalliq 78 36.3 83 38.6 119 39.4 97 32.1
Baffin 111 36.9 106 35.2 175 36.7 157 32.9
Kitikmeot 41 28.5 47 32.6 71 31.7 80 35.7
Nunavut 230 34.8 236 35.8 365 36.4 334 33.3

52 2007–2008 INUIT HEALTH SURVEY •NUNAVUT
IPY – INUIT HEALTH SURVEY
Centre for Indigenous Peoples' Nutrition and Environment
McGill University, Macdonald Campus, 21,111 Lakeshore Road, Ste‐Anne‐de‐Bellevue, QC H9X 3V9
— www.inuithealthsurvey.ca —