nucleation of methane hydrates at moderate subcooling by ... pub... · nucleation of methane...
TRANSCRIPT

Nucleation of Methane Hydrates at Moderate Subcooling byMolecular Dynamics SimulationsFelipe Jimenez-Angeles† and Abbas Firoozabadi*,†,‡
†Reservoir Engineering Research Institute, Palo Alto, California 94301, United States‡Department of Chemical and Environmental Engineering, Yale University, New Haven, Connecticut 06510, United States
*S Supporting Information
ABSTRACT: Methane hydrates are crystalline structures composed of cages of hydrogen-bonded water molecules in which methane molecules are trapped. The nucleationmechanisms of crystallization are not fully resolved, as they cannot be accessedexperimentally. For methane hydrates most of the reported simulations on the phenomenacapture some of the basic elements of the full structure. In few reports, formation ofcrystalline structures is reached by imposing very high pressure, or dynamic changes oftemperature, or a pre-existing hydrate structure. In a series of nanoscale moleculardynamics simulations of supersaturated water−methane mixtures, we find that the order ofthe crystalline structure increases by decreasing subcooling. Crystalline structures I and IIform and coexist at moderate temperatures. Crystallization initiates from the spontaneousformation of an amorphous cluster wherein structures I, II, and other ordered defectsemerge. We observe the transient coexistence of sI and sII in agreement with experiments.Our simulations are carried out at high methane supersaturation. This conditiondramatically reduces the nucleation time and allows simulating nucleation at moderate subcooling. Moderate temperatures drivehydrates to more ordered structures.
■ INTRODUCTION
At low temperature and moderate pressure a mixture of waterand methane and other small molecules may form an ice-likephase known as clathrate hydrates. These are crystallinestructures of water-forming cages in which small moleculesknown as guest molecules stabilize the cage.1,2 The ratio ofguest to water molecules can be up to 0.15 when all the cavitiesare filled. Typical guest molecules include methane, ethane,CO2, and ethylene oxide.3 Hydrates have a broad range oftechnological applications including separation and sequestra-tion processes, fuel transportation, climate change, hydrogenstorage, geology, planetary and marine sciences, and so on.4−10
Large reserves of methane hydrate exist under the sediments ofthe ocean floors making it the most abundant clathrate hydrateand an important source of hydrocarbon energy.11−13 Hydratesmay also cause serious safety and environmental concern inhydrocarbon production.14 The capture of oil in the recentaccident in the Gulf of Mexico was unsuccessful because offormation of hydrates.15
Methane hydrates form when water and methane are broughtinto contact at hydrate formation conditions (T, P). At thoseconditions both components (mixed and separated) may stayfor a long period at a metastable fluid state. The equilibriumstate includes the methane hydrate solid. Formation of hydratesrequires the dissolution of methane in water. At some timehydrates nucleate and start to grow. In experimental setupsconsisting of methane gas and water, a reservoir of methane isrequired to maintain the pressure constant. The consumptionof methane means that it is dissolved into water. During the
growth stage methane is incorporated into the cages of thehydrate structure. The induction time is defined when hydratesbecome detectable macroscopically (typically between fewminutes up to days). An equivalent way to define the inductiontime is when a detectable consumption of methane starts. Thenucleation time refers to the formation of the first stablehydrate nucleus. It can not be determined with precision due tothe difficulty to detect hydrates nuclei.According to nucleation theory, it is necessary to overcame a
Gibbs free energy barrier to form methane hydrate from anunstable state.16,17 The magnitude of the Gibbs free energybarrier is given by the energy needed to create a crystal−fluidinterface plus the energy gain to create the crystal volume. Thedriving force to overcome the free energy barrier is thedifference between the chemical potentials of the old and newphases.18 Low temperature, high pressure, and high super-saturation (excess of methane in the solution) increase thedriving force and prompt hydrate formation. In nucleationtheory the nucleation time is a strong function of super-saturation. By increasing supersaturation the nucleation timedecreases.16
The molecular mechanism of hydrate nucleation is afundamental open question. Molecular simulations have beenused to uncover some of the molecular mechanisms ofnucleation and growth of clathrate hydrates. Rodger et
Received: January 8, 2014Revised: May 5, 2014Published: May 6, 2014
Article
pubs.acs.org/JPCC
© 2014 American Chemical Society 11310 dx.doi.org/10.1021/jp5002012 | J. Phys. Chem. C 2014, 118, 11310−11318

al.19−21 simulate an interface of methane gas next to a water−methane solution. Their setup is constructed by melting amethane hydrate crystal at high temperature. While theaqueous solution is metaestable (supersaturated) the systemis carried to hydrate formation conditions. They observeformation of hydrate structures within the first 5 ns ofsimulation. Walsh et al.22,23 construct a methane gas−aqueoussolution interface equilibrated at high temperature. Theconcentration of methane in the aqueous solution is very lowas a consequence of the equilibration process. In a second stepthe setup is brought to hydrate formation conditions. Prior tohydrate nucleation the number of methane molecules dissolvedin the aqueous solution increases significantly. Depending onthe simulation conditions (T, P), the simulation times toobserve formation of stable hydrate structures range fromseveral hundreds of nanoseconds up to several microseconds.Using a similar arrangement and a coarse grain model of water,Jacobson et al.24,25 study hydrate formation of methane, carbondioxide, and generic guests. Liang and Kusalik explorenucleation of H2S in a related setup.26
A common condition of the studies on hydrate nucleationmentioned above is that hydrate formation is triggered whenmethane concentration in the aqueous solution is above certainminimal value.27 In a detailed study, Walsh et al. quantify themethane mole fraction dissolved in water at the instant ofnucleation. They find a strong dependence with temperature,pressure, and the geometry of the interface. At prenucleationconditions, the methane mole fraction ranges from 0.02 up to0.04, for temperatures between 245−250 K and pressuresbetween 50−4000 bar.28 Guo and Rodger find a critical value ofthe methane mole fraction around 0.05 beyond which hydratestructures spontaneously form.29 A mole fraction of up to 0.077has been detected in nucleation of H2S hydrates.
26 For H2S theequilibrium solubility in water is high and the meltingtemperature of the H2S hydrtae is higher than for the methanehydrate.Subcooling is defined as ΔTs = Tm − T, where Tm is the
melting temperature and T is the temperature of the system. Acommon consideration in the studies addressing hydratenucleation is a high subcooling (ΔTs ≥ 50 K) and highpressure. In molecular simulations of hydrates the meltingtemperature depends on the models of water and guestmolecules. A water model that better describes the icetemperature is also expected to describe well the hydratemelting temperature.30 Increasing subcooling and the pressureincrease methane solubility in water which in turn increases theprobability to form stable hydrate cages.29−31 In order toproduce hydrate structures in reasonable computational times,simulation studies are carried out at high pressures and highsubcoolings.19−24,28 The drawback of such considerations isthat the systems are driven into arrested states. In general,structures with long-range order are not formed; amorphousclusters containing structural units of clathrate hydrates (cagesfrom sI, sII, and other type of cages)19−22,24,32−34 are formed.The formation of sI is observed at very high pressure (200MPa) and low temperature (T = 245−250 K).23 A continuousincrease of temperature in NVE simulations of H2S solutionsgives rise to structures with relatively high crystalline order.35
In a recent approach Sarupria and Debeneditti suggest asupersaturated homogeneous mixture of dissolved gas inwater36 with 0.07 methane mole fraction at T = 240 K and P= 20 MPa. By doing so, they observe formation of hydrateclusters over time scales of several hundreds of nanoseconds.
The structures are similar to those found in two-phasesimulation setups at high subcooling.19−24,28
A number of authors consider a pre-existing hydrate structureto study hydrate growth.33,34,37−39 This approach allowsstudying crystal growth but leaves out the fundamentals ofinitial stages of the nucleus formation. Crystalline hydratephases sI and sII may grow from an amorphous cluster atmoderate subcooling.39 Based on this observation, a two-stepscheme24,34 in crystal nucleation has been proposed consistingof (1) the initial formation of amorphous clusters and (2) theevolution of clusters toward a crystalline state at macroscopictimes. The simulation time to observe the second step at thetemperatures at which the amorphous clusters are nucleated isbeyond the simulation time scale.Despite major efforts in simulation addressing hydrate
nucleation, the underlying mechanism of the formation ofcrystal structures is not yet fully clear. Several investigationsindicate that temperature has an important effect on the orderof the crystalline structure.24,34,35 To the best of our knowledge,the initial stages of methane hydrate nucleation have not beenstudied nor the full process from spontaneous nucleation andcrystal growth at moderate subcooling. In this work we carryout molecular dynamics simulations of supersaturated homoge-neous mixtures of methane and water at moderate temper-atures. Methane concentration is set by our design beyond thelimit of equilibrium solubility. By doing so, hydrates formwithout a high subcooling. Large methane concentration allowsto observe some of the underlying mechanisms of crystalnucleation in accessible computational times. Moderatetemperatures aid the formation of the crystalline hydratestructures.
■ MODELS AND SIMULATION METHODA homogeneous mixture of methane and water is constructedby placing randomly Nm methane molecules and Nw watermolecules into a cubic L-side box. The initial box size iscalculated based on a total density of the mixture around 0.67g/cm3. The overlapping positions of particles at the initialconfiguration are prevented by distance and energy criteria. A 3ns simulation is carried out to stabilize the system at the targettemperature T and pressure P. The stabilization run is carriedout at the same conditions as the production run. During thestabilization simulation, the volume of the cell decreases about20%. The resulting configuration is the initial of a moleculardynamics simulation of several hundreds of nanoseconds whichis monitored for hydrate formation. We select a pressure of 50MPa and temperatures from 250 to 285 K corresponding tosubcooling of 54 K ≳ ΔTs ≳ 19 K (the melting temperature ofthe hydrate estimated by molecular dyanamics simulations30,40
is ∼304 K at P = 50 MPa). A summary of the simulationconditions is given in Table 1.Water molecules are modeled by the TIP4P-ice41 while
methane molecules are described as spherical particles. TheLennard-Jones parameters for methane are σ = 3.72 Å and ε =1.318 kJ/mol;42 the Lorentz−Berthelot combining rules areused for water−methane interactions. The simulations areperformed using the open source code Gromacs.43−45 Fullperiodic boundary conditions are applied in all directions. Atime-step of 2 fs is used. Short-range interactions are truncatedat 1.2 nm and long-range electrostatic interactions arecomputed using the smooth particle mesh Ewald summation.For the 3 ns simulation run we use Berendsen46 barostat andthermostat with relaxation time constants τp = 0.1 ps and τT =
The Journal of Physical Chemistry C Article
dx.doi.org/10.1021/jp5002012 | J. Phys. Chem. C 2014, 118, 11310−1131811311

0.5 ps, respectively. For the long simulation we use the Nose−Hoover47,48 thermostat with a relaxation time of τT = 2 ps,whereas the pressure is kept constant by means of theParrinello−Rahman49 barostat with a relaxation time of τP = 4ps. The leapfrog algorithm is used for integrating Newton’sequation of motion, and rigid water molecule constraints areimplemented with the SHAKE algorithm.50 Our simulations areperformed at T = 250, 260, 275, and 285 K. The pressure iskept constant at P = 50 MPa (see Table 1). Our estimation of
the melting temperature for sI of methane hydrate at 50 MPa is304 K as mentioned above.The methane to water ratio in the crystalline sI of methane
hydrates is 1/5.75 which corresponds to a methane molefraction of xm = 0.16. By preparing mixtures with differentcontents of methane we observe that a methane mole fractionup to ∼0.09 remains dissolved in water at P = 50 MPa and T =285. At a higher methane concentration (xm = 0.098 with Nm =320, Nw = 2944), the mixture separates in less than 3 ns into amethane gas phase and an aqueous solution with few dissolvedmolecules of methane (spinodal decomposition). In a similarway, at T = 290 K, we find that the limit of dissolved methane isless than 0.08 mole fraction. In our study we choose a methanemole fraction of 0.08.The experimental equilibrium solubility of methane in water
at hydrate conditions is xm ∼ 10−3.51,52 A metastable solutionabove this value may exist and is consistent with thermody-namics. The CPA equation of state reproduces experimentalsolubility of hydrocarbons and other compounds in water witha high degree of accuracy.53 The maximum metaestablesolubility of methane in water computed by means of theCPA equation of state is xm ≈ 0.1 at T = 285 K and P = 50MPa. This value is in agreement with our estimated value frommolecular dynamics simulations.
■ RESULTSWe observe hydrate formation in all of our simulations. Thenucleation time is defined as the time when the sustained
Table 1. Summary of the Conditions in our Studya
run # nr Nm Nw T (K) tN (ns) xm
1 2 256 2944 250 37, 53.5 0.082 2 256 2944 260 21, 19.6 0.083 2 256 2944 275 5, 6 0.084 1 768 8832 275 3.5 0.085 2 256 2944 285 3.5, 17 0.086 1 768 8832 285 15 0.087 2 1024 11776 285 11, 17.5 0.088 1 1280 14720 285 20 0.08
aFirst column gives the label of the run, second column is the numberof runs for the specified conditions (nr), third coulumn is the numberof methane molecules (Nm), fourth column is the number of watermolecules (Nw), fifth column is the temperature (T), sixth column arethe nucleation times (tN), and seven column is the methane molefraction (xm). The pressure is equal to 50 MPa in all the runs.
Figure 1. (a) Potential energy of the system during simulation for the small setup (Nm = 256, Nw = 2944) at T = 250 (black line), 260 (red line), 275(green line), and 285 K (blue line); P = 50 MPa in all cases. Snapshots of the simulation box at the end of the simulation run: (b) T = 260, (c) 275,and (d) 285 K. Water molecules are represented by two light blue lines joining the oxygen−hydrogen centers, whereas methane molecules arerepresented by red spheres. A color code is used to distinguish different types of cages: red is the small 512, blue is 51262, green is 51263, and gray is51264.
The Journal of Physical Chemistry C Article
dx.doi.org/10.1021/jp5002012 | J. Phys. Chem. C 2014, 118, 11310−1131811312

growth of hydrate structure initiates. In terms of the number ofcages produced as a function of time, nucleation time is thelatest time when the number of cages is equal to zero. Thenucleation times of our simulation runs are reported in the sixthcolumn of Table 1. The nucleation times for 0.08 methanemole fraction are between 3 and 53.5 ns. There is a decreasingtrend of the nucleation time associated with temperaturebetween T = 250 and 275 K. At T = 285 K, the nucleation timeis higher than at T = 275 K, but some unstable cages form asearly as 3 ns. For the highest temperature, some clusters formbefore t = 5 ns which do not remain stable. The simulations atT = 285 K have nucleation times between 11 and 20 ns, with noclear trend associated with the size of the system. This isconsistent with nucleation theory where nucleation timereduces as supersaturation increases.16 Sarupria and Debene-
detti36 report a nucleation time of several hundreds ofnanoseconds for xm = 0.07 at T = 240 K and P = 20 MPa.At those conditions, we obtain a nucleation time of ∼300 ns, inline with their values.Figure 1a portrays the potential energy versus simulation
time of the methane−water small setup at four differenttemperatures (runs 1−4 corresponding to temperatures from250 to 285 K, respectively). In general, the four plots show adecreasing trend toward an asymptotic value as time increases.The system reaches its stationary state faster, while a largerpotential energy drop is produced with the increase oftemperature. The plots at T = 275 and 285 K have a smallshoulder at around t = 50 and 70 ns, respectively. At this point,the systems reach a metastable state from which they escapeeasily due to their high temperature fluctuations. The potential
Figure 2. Snapshots of the simulation box at different times showing several stages of nucleation and growth of sI of methane hydrate. Watermolecules are represented by two light blue lines joining the oxygen−hydrogen centers whereas methane molecules are represented by red spheres.A hydrogen bond (dotted black lines) is formed between the oxygen from an acceptor water molecule and the hydrogen atom from a donor watermolecule when they are within a separation distance of 3 Å and form an angle equal or less than 10° with the donor oxygen. Some of the hydrogenbonds are highlighted with thicker lines to aid visualization. The snapshots are taken from the same angle at different magnifications (see the 10 Åscale bar and coordinate axis at the lower left corner). Simulation conditions are Nw = 11776, Nm = 1024, T = 285 K, and P = 50 MPa.
The Journal of Physical Chemistry C Article
dx.doi.org/10.1021/jp5002012 | J. Phys. Chem. C 2014, 118, 11310−1131811313

energy is always decreasing during the whole simulation run,even if the nucleation time is of several tens of nanoseconds(e.g., at T = 250 K, P = 50 MPa, and xm = 0.08). This isdifferent from the simulations starting from two-phase systemswhere periods of constant potential energy are observed andthe main drops occur during the dissolution of methane intowater and the ordering of the structures.23,28 In both cases(mixed or separated components), the equilibrium is onlyreached when the hydrate forms.In our simulations, a larger energy drop is indicative of the
higher order of the structure formed. At T = 250 (not shown)and 260 K (Figure 1b), amorphous clusters form. At T = 275 K(Figure 1c), a more regular structure with some irregularregions is observed, and at T = 285 K (Figure 1d), a muchmore regular cluster is formed. Similarly, ref 35 reports thecontinuous increase of temperature results in exothermicformation of H2S hydrates structures sI, sII, and HS-I. Ourresults at T = 250 K are qualitatively similar to those obtainedby initially having the two components separated by aninterface.22 In the latter, however, the dissolution of methaneinto water significantly increases the computational time. Thereis a correlation between the number of cages formed andtemperature. We will discuss this point later.The clusters shown in Figure 1b−d are mostly cages of the
type 512, with 12 pentagonal faces conformed by 20 watermolecules (red cages in Figure 1b−d). A larger cage denoted as51262 consists of two hexagonal faces and 12 pentagonal faces(blue cages in Figure 1b−d). The unit cell of sI is composed oftwo 512 and six 51262 cages.54 In sI, the 51262 cages may sharehexagonal and pentagonal faces. 512 cages, on the other hand,occupy empty spaces and do not share faces when they are insI, while they do in sII. The 51264 cages are specific to sII (graycages in Figure 1d). The 51263 cages are metastable (greencages in Figure 1b−d) and have been observed in other studiesin methane hydrate nucleation.22,23 The clusters formed at T =275 and 285 K exhibit clear traces of sI and sII. Larger systemsare selected to form domains of the crystalline phases. Runs 4and 6 are three times larger, run 7 is four times larger, and run 8is five times larger (see Table 1). Despite the fact thatnucleation is a random process, the general features are similarfor different system sizes. Below we present the results for run7. A comparison among different setups is presented afterwardby computing the average number of cages.In Figure 2 snapshots of the simulation box for one of the
simulations of run 7 (Nm = 1024, Nw = 11776 at T = 285 K) atdifferent simulation times are shown. At t = 0 (not shown), asingle phase is made of methane molecules in water. Nostructure is initially observed. At early stages during thesimulation, stable pentagonal faces appear and around t = 5 nsthe first stable cage forms and the growing of an amorphouscluster initiates (Figure 2a,b). Another amorphous cluster isformed at a different region in the simulation box (Figure 2c).The cages formed so far are of the type 512; some are not fullydeveloped. At some point both clusters coalesce and form asingle larger amorphous cluster (Figure 2d). At the time ofcoalescence, the cluster extends nearly over the full length ofthe box. After coalescence, the cluster becomes more compact(Figure 2e). Between t = 30 and 33 ns at the central region ofthe box (at the region where coalescence takes place), the firsttraces of sI appear (Figure 2e,f). At the time when the firsttraces of sI are formed the cluster’s longest dimension is around4.5 nm.
In Figure 2f, the hexagonal faces of a 51262 cage are shown atthe upper corner of the highlighted box. Another cage of thesame kind is seen at the central region exhibiting its pentagonallateral faces while it shares a hexagonal face with an incompletecage. The cages at the two lowest corners of the red box are ofthe type 512, however, they are not conforming sI. These cagesare expected to transform in longer times into 51262 to conformthe long-range order of sI. The methane molecules apparentlywithin the cages are actually aligned molecules forming a row,implying that other cages are formed in the z direction. At t =37 ns, the two 51262 cages at the center of the box arecompletely formed and a new row of the same cages isnucleated at the upper left corner of the box. At t = 50 ns, thesecond row is fully formed and the growth continues. Anamorphous cluster is formed at the lower right corner of thesimulation box and approaches the larger cluster. At t = 60 ns,sI at the central region of the box is well-defined and the clustercontinues growing in all directions. The structure of the clusterat the lower region of box is rather amorphous but shows theformation of many hydrogen bonds. The upper part of thecluster turns progressively more ordered, and at this region, theelements of sII appear afterward (see discussion below).To quantify our results, we use an algorithm similar to that
proposed by Jacobson et al. to classify the cage geometry.32 Weidentify cages by looking for oxygen atoms within a distance of6.1 Å from a central methane molecule. Then we use theconnectivity of water molecules and the topology of the ringsthey form.55 Two oxygen atoms are connected if they arewithin a distance of 3.5 Å. We look for all possible pentagonaland hexagonal rings formed by connected oxygen atoms.Oxygen atoms are the vertices of an undirected graph toidentify the rings. This procedure is used to identify the 512,51262, 51263, and 51264 cages composed of 20, 24, 26, and 28water molecules, respectively. To determine the number ofempty 512 cages we look for complementary half cagesconstructed from a pentagonal ring surrounded by fiveconnected pentagonal rings. The cages with a methanemolecule inside are discarded. We assume cages other than512 to be filled due to larger size.Figure 3 shows the evolution of the number (nc) of different
types of cages formed in one of the simulations in run 7.Around t ≈ 30 ns the sustained growth of 512 cages initiates.
Figure 3. Evolution of cage types during simulation for run 7. Thelines shown are coded as follows: black for 512; red for 51262; green for51263; and blue for 51264 cages.
The Journal of Physical Chemistry C Article
dx.doi.org/10.1021/jp5002012 | J. Phys. Chem. C 2014, 118, 11310−1131811314
Few complete cages are formed before this time. The larger51262 cages appear around t ≈ 35 ns followed by their sustainedgrowth. Their appearance is clearly related to the formation ofsI as discussed above. 51263 and 51264 cages appear at t ≈ 60 and80 ns, respectively. The 512 cage is the most abundant in theentire simulation followed by 51262. The 51264 cage, whichbelongs to sII, is the smallest fraction. The formation is relatedto the appearance of domains of sII as we will discuss below.The rate of formation of 512 and 51262 cages is very high beforet ≈ 120 ns and tend to stabilize in the long time. The formationof 51263 and 51264 cages is at lower rate than the smaller cagesand reach stable values faster. The plots of the number of cagesas a function of time for all our simulations are presented inFigure S1 of the Supporting Information. For run 7, emptycages represent about 3% of the total number of 512 cageswhich is less than 2% of the total number of cages. Later we willhave further discussion on the number of empty cages.The tetrahedral order parameter56 is defined as F3 =
⟨∑j=1ni−1∑k=j+1
ni (|cos θjik| cos θjik + 1/9)2⟩, where ni is the numberof oxygen atoms within a distance of 3.5 Å from the ith atomand θjik is the angle formed by the oxygen atoms i, j, and k. Thefour-body order parameter57,58 is defined as F4 = ⟨cos 3ϕ⟩,where ϕ is the torsion angle of the configuration H−O···O−Hformed with the outermost hydrogen atoms of two adjacentwater molecules. Averages ⟨...⟩ are computed over the totalnumber of water molecules. F3 is equal to zero for a tetrahedralnetwork and F4 is 0.7 for hydrate (for both sI and sII), −0.04for liquid water, and −0.4 for ice. Figure 4 shows the evolution
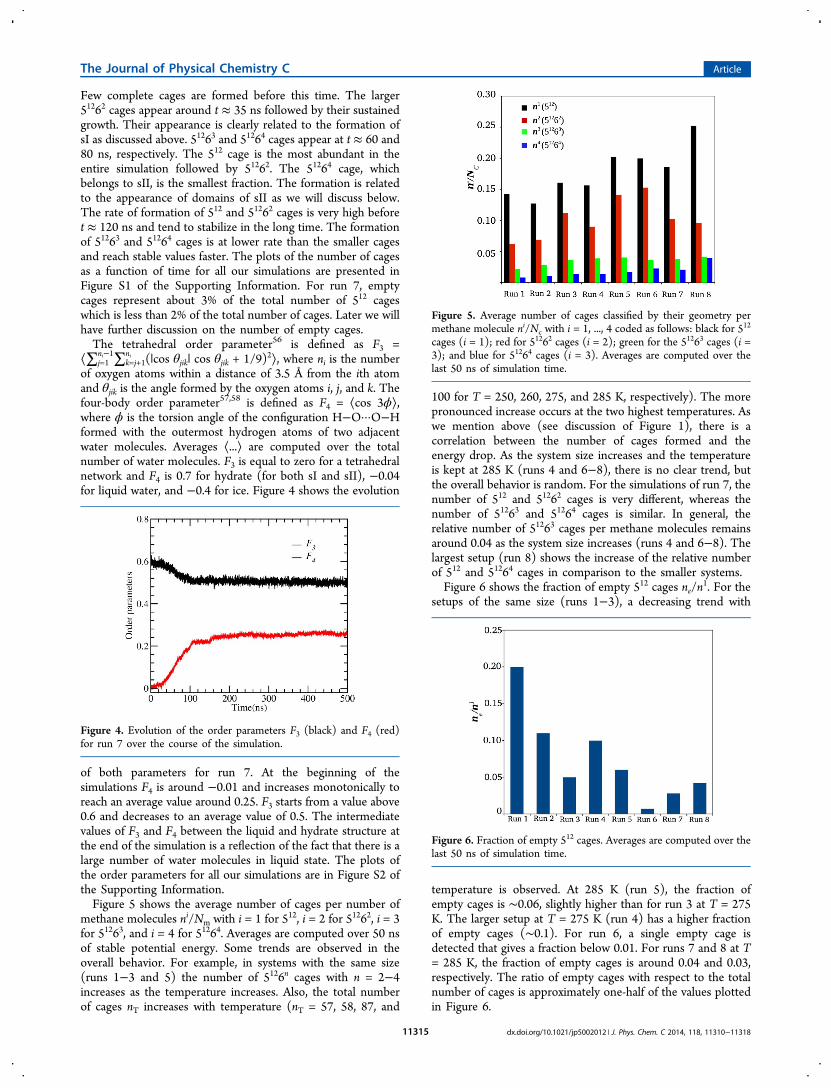
of both parameters for run 7. At the beginning of thesimulations F4 is around −0.01 and increases monotonically toreach an average value around 0.25. F3 starts from a value above0.6 and decreases to an average value of 0.5. The intermediatevalues of F3 and F4 between the liquid and hydrate structure atthe end of the simulation is a reflection of the fact that there is alarge number of water molecules in liquid state. The plots ofthe order parameters for all our simulations are in Figure S2 ofthe Supporting Information.Figure 5 shows the average number of cages per number of
methane molecules ni/Nm with i = 1 for 512, i = 2 for 51262, i = 3for 51263, and i = 4 for 51264. Averages are computed over 50 nsof stable potential energy. Some trends are observed in theoverall behavior. For example, in systems with the same size(runs 1−3 and 5) the number of 5126n cages with n = 2−4increases as the temperature increases. Also, the total numberof cages nT increases with temperature (nT = 57, 58, 87, and
100 for T = 250, 260, 275, and 285 K, respectively). The morepronounced increase occurs at the two highest temperatures. Aswe mention above (see discussion of Figure 1), there is acorrelation between the number of cages formed and theenergy drop. As the system size increases and the temperatureis kept at 285 K (runs 4 and 6−8), there is no clear trend, butthe overall behavior is random. For the simulations of run 7, thenumber of 512 and 51262 cages is very different, whereas thenumber of 51263 and 51264 cages is similar. In general, therelative number of 51263 cages per methane molecules remainsaround 0.04 as the system size increases (runs 4 and 6−8). Thelargest setup (run 8) shows the increase of the relative numberof 512 and 51264 cages in comparison to the smaller systems.Figure 6 shows the fraction of empty 512 cages ne/n
1. For thesetups of the same size (runs 1−3), a decreasing trend with
temperature is observed. At 285 K (run 5), the fraction ofempty cages is ∼0.06, slightly higher than for run 3 at T = 275K. The larger setup at T = 275 K (run 4) has a higher fractionof empty cages (∼0.1). For run 6, a single empty cage isdetected that gives a fraction below 0.01. For runs 7 and 8 at T= 285 K, the fraction of empty cages is around 0.04 and 0.03,respectively. The ratio of empty cages with respect to the totalnumber of cages is approximately one-half of the values plottedin Figure 6.
Figure 4. Evolution of the order parameters F3 (black) and F4 (red)for run 7 over the course of the simulation.
Figure 5. Average number of cages classified by their geometry permethane molecule ni/Nc with i = 1, ..., 4 coded as follows: black for 512
cages (i = 1); red for 51262 cages (i = 2); green for the 51263 cages (i =3); and blue for 51264 cages (i = 3). Averages are computed over thelast 50 ns of simulation time.
Figure 6. Fraction of empty 512 cages. Averages are computed over thelast 50 ns of simulation time.
The Journal of Physical Chemistry C Article
dx.doi.org/10.1021/jp5002012 | J. Phys. Chem. C 2014, 118, 11310−1131811315
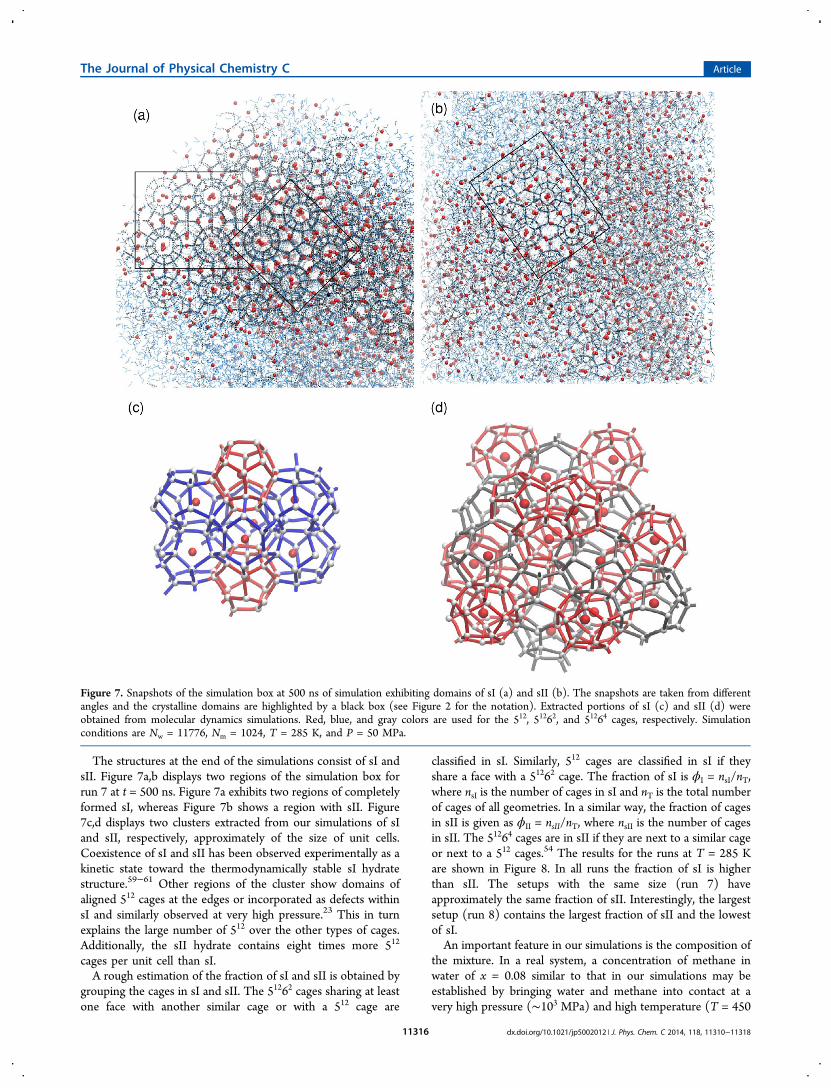
The structures at the end of the simulations consist of sI andsII. Figure 7a,b displays two regions of the simulation box forrun 7 at t = 500 ns. Figure 7a exhibits two regions of completelyformed sI, whereas Figure 7b shows a region with sII. Figure7c,d displays two clusters extracted from our simulations of sIand sII, respectively, approximately of the size of unit cells.Coexistence of sI and sII has been observed experimentally as akinetic state toward the thermodynamically stable sI hydratestructure.59−61 Other regions of the cluster show domains ofaligned 512 cages at the edges or incorporated as defects withinsI and similarly observed at very high pressure.23 This in turnexplains the large number of 512 over the other types of cages.Additionally, the sII hydrate contains eight times more 512
cages per unit cell than sI.A rough estimation of the fraction of sI and sII is obtained by
grouping the cages in sI and sII. The 51262 cages sharing at leastone face with another similar cage or with a 512 cage are
classified in sI. Similarly, 512 cages are classified in sI if theyshare a face with a 51262 cage. The fraction of sI is ϕI = nsI/nT,where nsI is the number of cages in sI and nT is the total numberof cages of all geometries. In a similar way, the fraction of cagesin sII is given as ϕII = nsII/nT, where nsII is the number of cagesin sII. The 51264 cages are in sII if they are next to a similar cageor next to a 512 cages.54 The results for the runs at T = 285 Kare shown in Figure 8. In all runs the fraction of sI is higherthan sII. The setups with the same size (run 7) haveapproximately the same fraction of sII. Interestingly, the largestsetup (run 8) contains the largest fraction of sII and the lowestof sI.An important feature in our simulations is the composition of
the mixture. In a real system, a concentration of methane inwater of x = 0.08 similar to that in our simulations may beestablished by bringing water and methane into contact at avery high pressure (∼103 MPa) and high temperature (T = 450
Figure 7. Snapshots of the simulation box at 500 ns of simulation exhibiting domains of sI (a) and sII (b). The snapshots are taken from differentangles and the crystalline domains are highlighted by a black box (see Figure 2 for the notation). Extracted portions of sI (c) and sII (d) wereobtained from molecular dynamics simulations. Red, blue, and gray colors are used for the 512, 51262, and 51264 cages, respectively. Simulationconditions are Nw = 11776, Nm = 1024, T = 285 K, and P = 50 MPa.
The Journal of Physical Chemistry C Article
dx.doi.org/10.1021/jp5002012 | J. Phys. Chem. C 2014, 118, 11310−1131811316

K). Then, pressure and temperature are lowered to oursimulation conditions (P = 50 MPa and T = 285 K). Degassingdoes not occur instantaneously, and water and methane remainin a metastable mixture. Note that methane mole fraction in afully occupied sI of methane hydrate is xm = 0.16. Oursimulations are carried out at half of that concentration andshow that only a few nanoseconds are needed to form hydratesat these conditions. This result is advantageous from thecomputational point of view. At the beginning of this sectionwe point out that a mixture with a concentration of methanehigher than the equilibrium concentration may exist. Ourmolecular dynamics simulations and a well established equationof state support it.
■ CONCLUSIONSWe have selected a supersaturated methane−water mixture inour hydrate molecular simulation. This allowed us simulatinghomogeneous methane hydrate nucleation of large systems inshort computational times at moderate conditions (T = 285 Kat P = 50 MPa).54 Different from many other studies there is nointerface initially19−24 nor pre-existing hydrate struc-tures33,34,38,39 in our work. The distinctive feature of ourstudy is the formation of crystalline domains of sI and sII atmoderate temperatures and moderate pressure. Other authorshave observed formation of sI at high pressure and lowtemperature23 or by having dynamic variations of temper-ature.24,34,35 We find that a larger potential energy drop isobserved as the temperature increases which in turn iscorrelated with a higher order of the structures formed. Thehydrate nucleation initiates with the formation of anamorphous cluster from which the crystalline domainsoriginate. We observe complete domains of methane hydratesI and sII, in agreement with experiments.59−61 In all cases, thefraction of sI is higher than sII. Only in the largest simulatedsetup the factions of both structures are comparable. Thedriving force for nucleation is provided by the highconcentration of methane in water.18 The high mobility ofwater and methane molecules at moderate subcooling reducenucleation times. We observe the whole two-step nucleationprocess from the initial formation of an amorphous cluster tothe formation of the crystalline structures.24,34 Our study inhomogeneous hydrate nucleation combines a moderatepressure and temperatures above the freezing point of water,which are the conditions for many applications. These
conditions are required in future kinetic and antiagglomerationstudies by surfactants.
■ ASSOCIATED CONTENT
*S Supporting InformationFigures S1 and S2. This material is available free of charge viathe Internet at http://pubs.acs.org.
■ AUTHOR INFORMATION
Corresponding Author*E-mail: [email protected]. Phone: +1 (650)326-9172. Fax: +1 (650) 472-9285.
NotesThe authors declare no competing financial interest.
■ ACKNOWLEDGMENTSWe thank the member companies of the Reservoir EngineeringResearch Institute (RERI) for their financial support.
■ REFERENCES(1) Englezos, P. Clathrate Hydrates. Ind. Eng. Chem. Res. 1993, 32,1251−1274.(2) Koh, C. A. Towards a Fundamental Understanding of NaturalGas Hydrates. Chem. Soc. Rev. 2002, 31, 157−167.(3) Gao, S.; House, W.; Chapman, W. G. NMR/MRI Study ofClathrate Hydrate Mechanisms. J. Phys. Chem. B 2005, 109, 19090−19093.(4) Park, Y.; Kim, D.-Y.; Lee, J.-W.; Huh, D.-G.; Park, K.-P.; Lee, J.;Lee, H. Sequestering Carbon Dioxide into Complex Structures ofNaturally Occurring Gas Hydrates. Proc. Natl. Acad. Sci. U.S.A. 2006,103, 12690−12694.(5) Chatti, I.; Delahaye, A.; Fournaison, L.; Petitet, J.-P. Benefits andDrawbacks of Clathrate Hydrates: A Review of Their Areas of Interest.Energy Convers. Manage. 2005, 46, 1333−1343.(6) Glasby, G. Potential Impact on Climate of the Exploitation ofMethane Hydrate Deposits Offshore. Mar. Pet. Geol. 2003, 20, 163−175.(7) Florusse, L. J.; Peters, C. J.; Schoonman, J.; Hester, K. C.; Koh, C.A.; Dec, S. F.; Marsh, K. N.; Sloan, E. D. Stable Low−PressureHydrogen Clusters Stored in a Binary Clathrate Hydrate. Science 2004,306, 469−471.(8) Mao, W. L.; Mao, H.-K.; Goncharov, A. F.; Struzhkin, V. V.; Guo,Q.; Hu, J.; Shu, J.; Hemley, R. J.; Somayazulu, M.; Zhao, Y. HydrogenClusters in Clathrate Hydrate. Science 2002, 297, 2247−2249.(9) Reagan, M. T.; Moridis, G. J. Global Climate and the Response ofOceanic Hydrate Accumulations. Meth. Hyd. Newslett. 2010, 10, 9−12.(10) Koh, C. A.; Sloan, E. D.; Sum, A. K.; Wu, D. T. Fundamentalsand Applications of Gas Hydrates. Annu. Rev. Chem. Biol. Eng. 2011,27, 237−257.(11) Collett, T. S.; Kuuskraa, V. A. Hydrates Contain Vast Store ofWorld Gas Resources. Oil Gas J. 1998, 96, 90−95.(12) Lee, S.-Y.; Holder, G. D. Methane Hydrates Potential as aFuture Energy Source. Fuel Process. Technol. 2001, 71, 181−186.(13) Sloan, E. D. Fundamental Principles and Applications of NaturalGas Hydrates. Nature 2003, 426, 353−363.(14) Bagirov, E.; Lerche, I. Hydrates Represent Gas Source, DrillingHazard. Oil Gas J. 1997, 95, 99−104.(15) Graham, B.; Reilli, W. K.; Beinecke, F.; Boesch, D. F.; Garcia, T.D.; Murray, C. A.; Ulmer, F. Deep Water: The Gulf Oil Disaster andthe Future of Offshore Drilling. Report to the President; 2011.(16) Yoreo, J. J. D.; Vekilov, P. In Biomineralization; Dove, P. M.,Yoreo, J. J. D., Weiner, S., Eds.; Mineralogical Society of America:Washington, DC, 2003; Vol. 54, pp 57−93.(17) Abraham, F. F. Homogeneous Nucleation Theory; AcademicPress: New York, 1974.
Figure 8. Percentage of cages in sI (blue bars) and sII (red bars) forthe different setups at T = 285 K and P = 50 MPa.
The Journal of Physical Chemistry C Article
dx.doi.org/10.1021/jp5002012 | J. Phys. Chem. C 2014, 118, 11310−1131811317

(18) Kashchiev, D.; Firoozabadi, A. Driving Force for Crystallizationof Gas Hydrates. J. Cryst. Growth 2002, 241, 220−230.(19) Moon, C.; Taylor, P. C.; Rodger, P. M. Molecular DynamicsStudy of Gas Hydrate Formation. J. Am. Chem. Soc. 2003, 125, 4706−4707.(20) Zhang, J.; Hawtin, R. W.; Yang, Y.; Nakagava, E.; Rivero, M.;Choi, S. K.; Rodger, P. M. Molecular Dynamics Study of MethaneHydrate Formation at a Water/Methane Interface. J. Phys. Chem. B2008, 112, 10608−10618.(21) Hawtin, R. W.; Quigley, D.; Rodger, P. M. Gas HydrateNucleation and Cage Formation at a Water/Methane Interface. Phys.Chem. Chem. Phys. 2008, 10, 4853−4864.(22) Walsh, M. R.; Koh, C. A.; Sloan, E. D.; Sum, A. K.; Wu, D. T.Microsecond Simulations of Spontaneous Methane Hydrate Nuclea-tion and Growth. Science 2009, 326, 1095−1098.(23) Walsh, M. R.; Rainey, J. D.; Lafond, P. G.; Park, D.-H.;Beckham, G. T.; Jones, M. D.; Lee, K.-H.; Koh, C. A.; Sloan, E. D.;Wu, D. T.; Sum, A. K. The Cages, Dynamics, and Structuring ofIncipient Methane Clathrate Hydrates. Phys. Chem. Chem. Phys. 2011,13, 19951−19959.(24) Jacobson, L. C.; Hujo, W.; Molinero, V. Amorphous Precursorsin the Nucleation of Clathrate Hydrates. J. Am. Chem. Soc. 2010, 132,11806−11811.(25) Jacobson, L. C.; Hujo, W.; Molinero, V. Nucleation Pathways ofClathrate Hydrates: Effect of Guest Size and Solubility. J. Phys. Chem.B 2010, 132, 13796−13807.(26) Liang, S.; Kusalik, P. G. Exploring Nucleation of H2S Hydrates.Chem. Sci. 2011, 2, 1286−1292.(27) Ripmeester, J. A.; Alavi, S. Molecular Simulations of MethaneHydrate Nucleation. ChemPhysChem 2010, 11, 978−980.(28) Walsh, M. R.; Beckham, G. T.; Koh, C. A.; Sloan, E. D.; Wu, D.T.; Sum, A. K. Methane Hydrate Nucleation Rates from MolecularDynamics Simulations: Effects of Aqueous Methane Concentration,Interfacial Curvature, and System Size. J. Phys. Chem. C 2011, 115,21241−21248.(29) Guo, G.-J.; Rodger, P. M. Solubility of Aqueous Methane UnderMetastable Conditions. J. Phys. Chem. B 2013, 117, 6498−6504.(30) Conde, M. R.; Vega, C. Determining the Three-PhaseCoexistence Line in Methane Hydrates Using Computer Simulations.J. Chem. Phys. 2010, 133, 064507−1−12.(31) Guo, G.-J.; Zhang, Y.-G.; Wu, C.-H. Can the DodecahedralWater Cluster Naturally Form in Methane Aqueous Solutions? AMolecular Dynamics Study on the Hydrate Nucleation Mechanisms. J.Chem. Phys. 2008, 128, 194504−1−8.(32) Jacobson, L. C.; Hujo, W.; Molinero, V. ThermodynamicStability and Growth of Guest-Free Clathrate Hydrates. J. Phys. Chem.B 2009, 113, 10298−10307.(33) Vatamanu, J.; Kusalik, P. G. Unusual Crystalline andPolycrystalline Structures in Methane Hydrates. J. Am. Chem. Soc.2006, 128, 15588−15589.(34) Vatamanu, J.; Kusalik, P. G. Observation of Two-StepNucleation in Methane Hydrates. Phys. Chem. Chem. Phys. 2010, 12,15065−15072.(35) Liang, S.; Kusalik, P. G. Nucleation of Gas Hydrates withinConstant Energy Systems. J. Phys. Chem. B 2013, 117, 1403−1410.(36) Sarupria, S.; Debenedetti, P. G. Homogeneous Nucleation ofMethane Hydrate in Microsecond Molecular Dynamics Simulations. J.Phys. Chem. Lett. 2012, 3, 2942−2947.(37) Vatamanu, J.; Kusalik, P. G. Molecular Insights into theHeterogeneous Crystal Growth of sI Methane Hydrate. J. Phys. Chem.B 2006, 110, 15896−15904.(38) Tung, Y.-T.; Chen, L.-J.; Chen, Y.-P.; Lin, S.-T. The Growth ofStructure I Methane Hydrate from Molecular Dynamics Simulations. J.Phys. Chem. B 2010, 114, 10804−10813.(39) Jacobson, L. C.; Molinero, V. Can Amorphous Nuclei GrowCrystalline Clathrates? The Size and Crystallinity of Critical ClathrateNuclei. J. Am. Chem. Soc. 2011, 133, 6458−6463.(40) The melting temperature is determined following the method ofref 30 with 1 K of accuracy. We used a sI methane hydrate crystal slab
made of 3 × 3 × 5 unit cells (2070 water molecules and 360 methanemolecules) next to an aqueous phase (1000 water molecules with 100methane molecules dissolved). A methane gas phase (260 molecules)is located next to the aqueous solution.(41) Abascal, J. L. F.; Sanz, E.; García Fernandez, R.; Vega, C. APotential Model for the Study of Ices and Amorphous Water: TIP4P/Ice. J. Chem. Phys. 2005, 122, 234511−1−9.(42) Calero, S.; Dubbeldam, D.; Krishna, R.; Smit, B.; Vlugt, T. J. H.;Denayer, J. F. M.; Martens, J.; Maesen, T. L. M. Understanding theRole of Sodium During Adsorption: A Force Field for Alkanes inSodium-Exchanged Faujasites. J. Am. Chem. Soc. 2004, 126, 11377−11386.(43) Berendsen, H.; Spoel, D. V. D.; Drunen, R. V. Gromacs: AMessage-Passing Parallel Molecular Dynamics Implementation.Comput. Phys. Commun. 1995, 91, 43−56.(44) Spoel, D. V. D.; Lindahl, E.; Hess, B.; Groenhof, G.; Mark, A. E.;Berendsen, H. J. C. GROMACS: Fast, Flexible, and Free. J. Comput.Chem. 2005, 26, 1701−1718.(45) Hess, B.; Kuttner, C.; van der Spoel, D.; Lindahl, E. GROMACS4: Algorithms for Highly Efficient, Load-Balanced, and ScalableMolecular Simulation. J. Chem. Theory Comput. 2008, 4, 435−447.(46) Berendsen, H. J. C.; Postma, J. P. M.; van Gunsteren, W. F.; DiNola, A.; Haak, J. R. Molecular-Dynamics with Coupling to anExternal Bath. J. Chem. Phys. 1984, 81, 3684−3690.(47) Nose, S. A Unified Formulation of the Constant TemperatureMolecular-Dynamics Methods. J. Chem. Phys. 1984, 81, 511−519.(48) Hoover, W. G. Canonical Dynamics: Equilibrium Phase-SpaceDistributions. Phys. Rev. A 1985, 31, 1695−1697.(49) Parrinello, M.; Rahman, A. Crystal Structure and Pair Potentials:A Molecular-Dynamics Study. Phys. Rev. Lett. 1980, 45, 1196−1199.(50) Ryckaert, J. P.; Ciccotti, G.; Berendsen, H. J. C. NumericalIntegration of the Cartesian Equations of Motion of a System withConstraints: Molecular Dynamics of n-Alkanes. J. Comput. Phys. 1977,23, 327−341.(51) Kim, Y. S.; Ryu, S. K.; Yang, S. O.; Lee, C. S. Liquid Water−Hydrate Equilibrium Measurements and Unified Predictions ofHydrate-Containing Phase Equilibria for Methane, Ethane, Propane,and Their Mixtures. Ind. Eng. Chem. Res. 2003, 42, 2409−2414.(52) Servio, P.; Englezos, P. Measurement of Dissolved Methane inWater in Equilibrium with Its Hydrate. J. Chem. Eng. Data 2002, 47,87−90.(53) Li, Z.; Firoozabadi, A. Cubic-Plus-Association (CPA) Equationof State for Water-Containing Mixtures: Is “Cross Association”Necessary? AIChE J. 2009, 55, 1803.(54) Sloan, E. D.; Koh, C. A. Clathrate Hydrates of Natural Gases;CRC Press: Boca Raton, FL, 2008.(55) Matsumoto, M.; Baba, A.; Ohmine, I. Topological BuildingBlocks of Hydrogen Bond Network in Water. J. Chem. Phys. 2007, 127,134504−1−9.(56) Baez, L.; Clancy, P. Computer Simulation of the Crystal Growthand Dissolution of Natural Gas Hydrates. Ann. N.Y. Acad. Sci. 1994,715, 177−186.(57) Rodger, P. M.; Forester, T. R.; Smith, W. Simulations of theMethane Hydrate/Methane Gas Interface Near Hydrate FormingConditions. Fluid Phase Equilib. 1996, 116, 326−332.(58) Moon, C.; Hawtin, R. W.; Rodger, P. M. Nucleation andControl of Clathrate Hydrates: Insights From Simulation. FaradayDiscuss. 2007, 136, 367−382 and discussion 395−407..(59) Schicks, J. M.; Ripmeester, J. A. The Coexistence of TwoDifferent Methane Hydrate Phases under Moderate Pressure andTemperature Conditions: Kinetic versus Thermodynamic Products.Angew. Chem., Int. Ed. 2004, 43, 3310−3313.(60) Fleyfel, F.; Devlin, J. P. Carbon Dioxide Clathrate HydrateEpitaxial Growth: Spectroscopic Evidence for Formation of the Simpletype-II Carbon Dioxide Hydrate. J. Phys. Chem. 1991, 95, 3811−3815.(61) Staykova, D. K.; Kuhs, W. F.; Salamatin, A.; Hansen, T.Formation of Porous Gas Hydrates from Ice Powders: DiffractionExperiments and Multistage Model. J. Phys. Chem. B 2003, 107,10299−10311.
The Journal of Physical Chemistry C Article
dx.doi.org/10.1021/jp5002012 | J. Phys. Chem. C 2014, 118, 11310−1131811318