nuclear industry code of practice for routine water ... nicop for wq monitoring version 1… ·...
TRANSCRIPT

NUCLEAR INDUSTRY GROUP FOR LAND QUALITY
Nuclear Industry Code of Practice for Routine Water Quality Monitoring
Version 1, February 2015

NIGLQ Nuclear Industry Code of Practice for Routine Water Quality Monitoring Page i
Preface This report has been prepared by Amec Foster Wheeler (formerly AMEC) under contract to the Nuclear Decommissioning Authority (NDA) – Purchase Order NDA011979. The views expressed and conclusions drawn are those of the authors and do not necessarily represent those of NDA.
Conditions of publication This report is made available under NDA’s Transparency Policy. In line with this policy, NDA is seeking to make information on its activities readily available, and to enable interested parties to have access to and influence on its future programmes. The report may be freely used for non-commercial purposes. However, all commercial uses, including copying and re-publication, require NDA’s permission. All copyright, database rights and other intellectual property rights reside with NDA. Applications for permission to use the report commercially should be made to the NDA’s Communications department at the address below. Although great care has been taken to ensure the accuracy and completeness of the information contained in this publication, NDA cannot assume any responsibility for consequences that may arise from its use by other parties. © Nuclear Decommissioning Authority 2015. All rights reserved
DOCUMENT REVISION RECORD Version Number Reason for version Date Version 1 For publication February 2015
Draft 6.3 Issued to NIGLQ for
endorsement February 2015
Draft 5.3 For consultation/review external to NIGLQ
June 2014

NIGLQ Nuclear Industry Code of Practice for Routine Water Quality Monitoring Page ii
Foreword This document was commissioned by the Nuclear Decommissioning Authority (NDA) as part of its Direct Research Portfolio (DRP). The document was prepared by Chris Glaister and Nick Jefferies of Amec Foster Wheeler with assistance from Adrian Clacher, John Cobb, Mike Carey and Ben Fretwell (Amec Foster Wheeler) and John McCord (Stoller). The specification for the document was prepared on behalf of the NDA by members of the Land Quality Working Group (LQWG) of the Nuclear Waste and Decommissioning Research Forum. The Technical Lead for the project on behalf of the LQWG was Hugh Richards (Magnox Ltd) supported by John Heathcote (Dounreay Site Restoration Ltd). The LQWG also acts as a sub-group of the Nuclear Industry Group for Land Quality (NIGLQ), which is the sponsoring organisation for this document. During its preparation, a draft of this document [Draft 5.3] was subject to review by members of NIGLQ, representatives of regulators (Environment Agency and SEPA) and consultants (Golder Associates, URS and Peter Dumble Hydrogeology). The first published version of this document was endorsed by NIGLQ at its meeting on 25 February 2015. In funding the production of this document, NDA expects its Site Licensee Companies and their contractors to use it when specifying and undertaking routine water quality monitoring on NDA sites, or else to be able to justify any substantive deviations from its guidance.

NIGLQ Nuclear Industry Code of Practice for Routine Water Quality Monitoring Page iii
Executive Summary
This document provides good practice guidance for use by Site Licence Companies (SLCs) and their contractors/consultants in designing and reviewing routine water quality monitoring programmes at UK Nuclear Licensed Sites. For any given site the outcome of using this guidance should be a monitoring programme that is self-consistent and uses modern good practice techniques and arrangements appropriate to that site.
The intended readership is staff of SLCs and their contractors/consultants involved in the design, implementation and review of routine water quality monitoring programmes, and in the assessment/interpretation of the resulting data. It is understood that such staff will have varying knowledge, experience and background. This document is therefore designed to:
• Provide field technicians and junior/new technical staff with a better understanding of why monitoring is carried out, and of specific issues relevant to water quality monitoring on Nuclear Licensed Sites
• Act as a ‘quick reference guide’ for more experienced technical staff, by summarising key issues and signposting relevant existing guidance.
The types of waters dealt with in this document are groundwater, open freshwater bodies, ‘in-pipe’ and ‘end of pipe’ surface water drainage and inter-tidal surface waters. Excluded are ‘in-pipe’ or ‘end-of-pipe’ effluents, offshore marine/estuarine waters and deep lacustrine waters.
The focus of the document is on routine (long-term) water quality monitoring, which is defined as “the collection of water quality data and related hydrometric data at regular intervals over time, in accordance with a documented protocol, with defined criteria for assessment of results, such that results that are not in line with expectations can be identified and appropriate actions initiated”. The document is not primarily concerned with water quality sampling as part of site characterisation, which would usually precede the establishment of a routine water quality monitoring programme.
The guidance in this document concentrates on those aspects of routine water quality monitoring specific to nuclear sites and radioactive contaminants. It provides only summary guidance relating to non-radioactive contaminants (other than those issues specific to nuclear sites) and topics common to both radioactive and non-radioactive contamination, such as sampling point design, hydrochemistry and relevant hydrometric parameters. It signposts out to other guidance and standards where applicable.
Keywords
water, quality, sampling, monitoring, surface water, groundwater, contamination, design, maintenance, analysis, radioactive, non-radioactive, routine, data, hydrogeology, assessment.

NIGLQ Nuclear Industry Code of Practice for Routine Water Quality Monitoring Page iv
Abbreviations and acronyms
Term Definition
ALARP As Low As Reasonably Practicable
APC Area of Potential Concern
ASTM ASTM International
BAT Best Available Technique
BGL Below Ground Level
BOD Biological Oxygen Demand
BPEO Best Practicable Environmental Option
BPM Best Practical Means
BS British Standard
BSS Basic Safety Standards
BTEX Benzene, Toluene, Ethylbenzene, Xylene
CoC Change of Custody
COD Chemical Oxygen Demand
CSM Conceptual Site Model
DNAPL Dense Non Aqueous Phase Liquid
DO Dissolved Oxygen
DQF Data Quality Flag
DQO Data Quality Objective
DRO Diesel Range Organics
DRP Direct Research Portfolio
DSRL Dounreay Site Restoration Limited
DWI Drinking Water Inspectorate
EA Environment Agency
EC Electrical Conductivity
EPA90 Environmental Protection Act 1990
EPR2010 Environmental Permitting Regulations 2010
EQS Environmental Quality Standard
FSA Food Standards Agency
GDL Generalised Derived Limits
GIS Geographical Information System
GRO Gasoline Range Organics
HPA Health Protection Agency (now Public Health England (PHE))
HSE Health & Safety Executive
IBC Intermediate Bulk Container
ICP-OES Inductively Coupled Plasma Optical Emission Spectrometry
ICP-MS Inductively Coupled Plasma Mass Spectrometry

NIGLQ Nuclear Industry Code of Practice for Routine Water Quality Monitoring Page v
Term Definition
IRR99 Ionising Radiations Regulations 1999
JAGDAG (Water Framework Directive – UK) Joint Agencies Groundwater
Directive Advisory Group
LNAPL Light Non Aqueous Phase Liquid
LoD Limit of Detection
MCERTS [Environment Agency] Monitoring Certification Scheme
MNA Monitored Natural Attenuation
MoU Memorandum of Understanding
MRV Minimum Reporting Value
MS Method Statement
MTBE Methyl tertiary butyl ether
NDA Nuclear Decommissioning Authority
NIA65 Nuclear Installations Act 1965
NICoP Nuclear Industry Code of Practice
NAPL Non Aqueous Phase Liquid
NIGLQ Nuclear Industry Group for Land Quality
NORM Naturally Occurring Radioactive Material
NRPB National Radiological Protection Board
ONR Office for Nuclear Regulation
PAHs Polycyclic Aromatic Hydrocarbons
PCBs Polychlorinated Biphenyls
PCoC Potential Contaminant of Concern
POW Point Of Work risk assessment
PPC Pollution Prevention & Control
QA Quality Assurance
QC Quality Control
QLRA Qualitative Risk Assessment for Land Contamination
QMS Quality Management System
RAM Radioactive Materials
RPA Radiation Protection Advisor
RSA93 Radioactive Substances Act 1993
RSRL Research Sites Restoration Limited
SEPA Scottish Environment Protection Agency
SLC Site Licence Company
SPR Source Pathway Receptor
SSoW Safe System of Work
SVOC Semi Volatile Organic Compound
TDS Total Dissolved Solids

NIGLQ Nuclear Industry Code of Practice for Routine Water Quality Monitoring Page vi
Term Definition
TNT Trinitrotoluene
TPH Total Petroleum Hydrocarbons
TPHCWG Total Petroleum Hydrocarbons Criteria Working Group
TSS Total Suspended Solids
UKAS United Kingdom Accreditation Service
UKTAG Water Framework Directive - UK Technical Advisory Group
USEPA United States Environmental Protection Agency
UXO Unexploded Ordnance
VOC Volatile Organic Compound
WHO World Health Organisation

NIGLQ Nuclear Industry Code of Practice for Routine Water Quality Monitoring Page vii
Contents 1 Introduction ......................................................................................................................... 1
1.1 Aims and intended readership ................................................................................... 1
1.2 How to use this document ......................................................................................... 1
1.3 Why is this guidance needed? ................................................................................... 2
1.4 Scope and key definitions .......................................................................................... 2
2 Defining Objectives ............................................................................................................ 7
2.1 Develop understanding of drivers .............................................................................. 8
2.1.1 Statutory/regulatory drivers.................................................................................... 8
2.1.2 Business drivers .................................................................................................... 9
2.2 Types of water quality monitoring .............................................................................. 9
2.2.1 Characterisation monitoring ................................................................................... 9
2.2.2 Compliance monitoring .......................................................................................... 9
2.2.3 Performance monitoring ...................................................................................... 10
2.2.4 Reassurance or confirmatory monitoring............................................................. 10
2.3 Defining technical goals ........................................................................................... 11
2.3.1 General principles ................................................................................................ 11
2.3.2 The role of the Conceptual Site Model ................................................................ 11
2.3.3 The need for Baseline data ................................................................................. 14
2.3.4 Examples of technical goals ................................................................................ 15
2.4 Identifying information needed to meet technical goals .......................................... 16
2.5 Potential pitfalls ........................................................................................................ 16
3 Designing the Monitoring Network ................................................................................... 17
3.1 Existing monitoring points ........................................................................................ 17
3.2 Review of existing monitoring data .......................................................................... 19
3.3 Issues to consider when locating monitoring points ................................................ 19
3.4 When might ‘off-site’ monitoring be appropriate? .................................................... 21
3.5 Guidance on locating monitoring points .................................................................. 22
3.5.1 Factors to be considered ..................................................................................... 22
3.5.2 Guidance: surface water monitoring locations .................................................... 23
3.5.3 Guidance: groundwater monitoring locations at the site boundary ..................... 23
3.5.4 Guidance: groundwater monitoring locations for APCs ....................................... 24
3.6 Potential pitfalls ........................................................................................................ 25
4 Designing & Maintaining Monitoring Points ...................................................................... 26
4.1 Surface water monitoring ......................................................................................... 26
4.1.1 Design .................................................................................................................. 27
4.1.2 Are Existing Monitoring Points Suitable?............................................................. 27
4.1.3 Refurbishment, maintenance and decommissioning ........................................... 27
4.2 Groundwater monitoring .......................................................................................... 27
4.2.1 Design .................................................................................................................. 27
4.2.2 Cross-contamination through the borehole ......................................................... 30
4.2.3 Are existing monitoring points suitable? .............................................................. 31
4.2.4 Maintenance & refurbishment .............................................................................. 32
4.2.5 Decommissioning ................................................................................................ 34
4.3 Potential pitfalls ........................................................................................................ 35
5 Choosing the Analytical Suite .......................................................................................... 37
5.1 Introduction .............................................................................................................. 37
5.2 What contaminants are potentially present? ........................................................... 37
5.2.1 Radioactive contaminants.................................................................................... 37
5.2.2 Non-radioactive contaminants ............................................................................. 41
5.3 Reasons for determining natural water chemistry ................................................... 43
5.4 Optimising the analytical schedule .......................................................................... 45
5.4.1 Radioactive PCoCs .............................................................................................. 46
5.4.2 Non-radioactive PCoCs ....................................................................................... 49
5.5 Selecting the analytical laboratory ........................................................................... 50

NIGLQ Nuclear Industry Code of Practice for Routine Water Quality Monitoring Page viii
5.6 Limits of detection .................................................................................................... 51
5.7 Potential Pitfalls ....................................................................................................... 52
6 Choosing the Frequency & Duration of Monitoring .......................................................... 53
6.1 Influence of external factors .................................................................................... 54
6.2 Influence of Water Pathway Characteristics ............................................................ 56
6.2.1 Surface Water ...................................................................................................... 56
6.2.2 Groundwater ........................................................................................................ 57
6.3 Intervention response time ...................................................................................... 59
6.4 Monitoring duration .................................................................................................. 59
6.4.1 Overall duration ................................................................................................... 59
6.4.2 Duration at specific monitoring points .................................................................. 59
6.5 Potential pitfalls ........................................................................................................ 60
7 Sample Collection and Field Measurements .................................................................... 61
7.1 Introduction .............................................................................................................. 61
7.2 Surface water sampling: approaches & equipment ................................................. 61
7.3 Groundwater sampling: approaches & equipment .................................................. 62
7.3.1 Sampling methods ............................................................................................... 62
7.3.2 Sampling equipment ............................................................................................ 64
7.3.3 Potential issues when sampling .......................................................................... 66
7.4 Hydrometric measurements .................................................................................... 67
7.4.1 Surface water ....................................................................................................... 68
7.4.2 Groundwater ........................................................................................................ 68
7.5 NAPL measurement ................................................................................................ 69
7.6 Chemical and physical measurements on the sample ............................................ 69
7.6.1 Introduction .......................................................................................................... 69
7.6.2 Detection of radioactive contamination ................................................................ 70
7.6.3 Measurement of water chemistry parameters ..................................................... 70
7.6.4 Qualitative observations ...................................................................................... 73
7.7 Waste water management ....................................................................................... 73
7.8 Constraints and solutions ........................................................................................ 74
7.9 Potential pitfalls ........................................................................................................ 75
8 Sample Care..................................................................................................................... 77
8.1 Introduction .............................................................................................................. 77
8.2 Sample containers: selection ................................................................................... 77
8.3 Sample Preparation ................................................................................................. 78
8.3.1 Sample filtration ................................................................................................... 78
8.3.2 Sample preservation ............................................................................................ 79
8.3.3 Developing the sample preparation strategy ....................................................... 80
8.4 Sample storage ........................................................................................................ 81
8.5 Sample dispatch and transport ................................................................................ 82
8.6 Potential pitfalls ........................................................................................................ 83
9 Reporting, Data Management and Record Keeping ........................................................ 84
9.1 Drivers & expectations ............................................................................................. 84
9.2 Data management ................................................................................................... 86
9.2.1 Storage and archiving .......................................................................................... 86
9.2.2 Data presentation and reporting .......................................................................... 87
10 Data Assessment ......................................................................................................... 88
10.1 Introduction .............................................................................................................. 88
10.2 Factors influencing baseline water quality ............................................................... 89
10.3 Data validation ......................................................................................................... 89
10.4 Handling anomalous or erroneous data .................................................................. 91
10.5 Approach to assessment of routine water quality monitoring data .......................... 91
10.6 Comparison with assessment values ...................................................................... 92
10.6.1 Non-radioactive substances ............................................................................ 94
10.6.2 Radioactive substances ................................................................................... 94
10.7 Identifying outliers .................................................................................................... 98
10.8 Trend analysis ......................................................................................................... 99

NIGLQ Nuclear Industry Code of Practice for Routine Water Quality Monitoring Page ix
10.9 Developing responsive action plans ........................................................................ 99
10.10 Potential pitfalls .................................................................................................. 101
11 Safety, Quality Assurance & Quality Control ............................................................. 102
11.1 Safety ..................................................................................................................... 102
11.2 QA/QC definitions .................................................................................................. 102
11.3 Design phase ......................................................................................................... 103
11.4 Sampling phase ..................................................................................................... 104
11.4.1 Approach to QA and QC ................................................................................ 104
11.4.2 Artefacts in the data ....................................................................................... 105
11.5 Despatch/Analysis Phase ...................................................................................... 106
11.6 Action Phase .......................................................................................................... 107
12 References ................................................................................................................ 108
Appendix 1 Example Borehole Quality Assessment. Based on a form provided courtesy
Sellafield Ltd
Appendix 2 Example Borehole maintenance checklist. Based on a form provided courtesy of Amec Foster Wheeler
Appendix 3 Example QC Check-List. Based on a form provided courtesy of DSRL
Appendix 4. Example field form. Based on a form provided courtesy of Amec Foster Wheeler

NIGLQ Nuclear Industry Code of Practice for Routine Water Quality Monitoring Page 1
1 Introduction
1.1 Aims and intended readership
This document provides good practice guidance for use by Site Licence Companies (SLCs) and their contractors/consultants in designing and reviewing routine water quality monitoring programmes at UK Nuclear Licensed Sites. For any given site the outcome of using this guidance should be a monitoring programme that is self-consistent and uses modern good practice techniques and arrangements appropriate to that site. The intended readership is staff of SLCs and their contractors/consultants involved in the design, implementation and review of routine water quality monitoring programmes, and in the assessment/interpretation of the resulting data. It is understood that such staff will have varying knowledge, experience and background. This document is therefore designed to:
• Provide field technicians and junior/new technical staff with a better understanding of why monitoring is carried out, and of specific issues relevant to water quality monitoring on Nuclear Licensed Sites
• Act as a ‘quick reference guide’ for more experienced technical staff, by summarising key issues and signposting relevant existing guidance.
In facilitating a consistent approach to routine water quality monitoring, this document will:
• Assist in generating high quality monitoring data and in their subsequent interpretation and assessment
• Reduce the potential for challenge from regulators and other stakeholders
• Facilitate appropriate use of manpower and financial resource.
1.2 How to use this document
Throughout this document, a number of text boxes are included, separate from the main body text. These are of the following types.
1) Blue boxes are located at the start of each chapter, and are of two types:
a. ‘Overview’ boxes (e.g. Box 1.1) containing information on what the chapter covers, stating what knowledge the reader should be able to gain from the chapter and providing ‘navigation’ directions to key sections for more experienced technical staff
b. ‘Process maps’ (where appropriate) indicating the sequence of actions to address the issues in the relevant chapter
2) Green boxes contain more detailed definitions of specific terms or expand on issues covered in the main body of the text
3) Yellow boxes are at the end of each chapter, and highlight potential pitfalls relevant to that chapter.
Most of the guidance in this document is not prescriptive. However, in some instances, judgements endorsed by the Nuclear Industry Group for Land Quality

NIGLQ Nuclear Industry Code of Practice for Routine Water Quality Monitoring Page 2
(NIGLQ) are put forward about what does or does not represent good practice. Such instances of ‘More Prescriptive Guidance’ are clearly highlighted using italicised text. The overall process map for developing a typical routine water quality monitoring programme is shown in Box 1.2. For ease of navigation, the chapters of this document are mapped onto this process map. In addition, Chapter 11 deals with safety, quality assurance and quality control aspects, which apply throughout.
1.3 Why is this guidance needed?
Most UK Nuclear Licensed Sites undertake routine monitoring of groundwater and/or surface waters. See Section 1.4 for the definition of ‘routine monitoring’ used in this document. Routine monitoring is carried out for a variety of reasons, discussed in Section 2.1.
These routine monitoring programmes have been developed by SLCs (with varying levels of input from regulators) to address obligations arising from regimes regulated by the environment agencies and by the Office for Nuclear Regulation (ONR), including the requirements of the Nuclear Site Licence Conditions [1].
Existing monitoring programmes on nuclear sites have typically evolved over time, and their scope and scale can vary considerably. The objectives and underlying reasoning behind aspects of such programmes may become unclear over time, as different objectives and/or priorities are addressed or new monitoring techniques are introduced. This may lead to increased costs and workload without proportionate gains in relation to the monitoring objectives. Guidance is therefore needed to assist SLCs in rationalising their monitoring programmes.
In addition, publicly available guidance on routine water quality monitoring does not cover some issues specific to the nuclear industry. These include both technical issues, such as the use of gross alpha/beta measurements as ‘indicator’ parameters, and practical issues, such as arrangements for transfer of radioactively contaminated samples to off-site laboratories. This document is intended to fill this gap.
1.4 Scope and key definitions
The guidance in this document concentrates on those aspects of water quality monitoring specific to nuclear sites and radioactive contaminants. It summarises guidance relating to non-radioactive contaminants (other than those issues specific to nuclear sites) and topics common to both radioactive and non-radioactive contamination, such as sampling point design, hydrochemistry and relevant
Box 1.1: Overview (Example)
Outline: Provides an outline of the chapter, introducing the main topics.
Aims: Describes what the reader will gain from the chapter.
Navigation: Highlights key sections for more experienced staff.

NIGLQ Nuclear Industry Code of Practice for Routine Water Quality Monitoring Page 3
hydrometric parameters. It signposts out to other guidance and standards where applicable, with priority given to UK regulators’ guidance and British Standards1.
Define
objectives
Determine
locations
Determine
analytical suite
Determine
frequency and
duration of
sampling
Collect
samples and
data
Report,
interpret and
assess data
Chapter 2
Chapters 3 and 4
Chapter 5
Chapter 6
Chapters 7 and 8
Chapters 9 and 10
Feedback
Feedback
Feedback
Feedback
Box 1.2: Process Map for a Typical Routine Water Quality Monitoring Programme
In relation to the document scope, the following definitions are used:
1) ‘Water’ refers to the various types of water that may be present on or near to UK nuclear sites. That is:
• Groundwater (as defined in the EC Water Framework Directive 2000/60/EC [2]), namely ‘all water which is below the surface of the ground in the
1 It is also noted that the UK organisation Contaminated Land: Applications in Real
Environments (CL:AIRE) has published a short Technical Bulletin (TB3) on “Principles and Practice for the Collection of Representative Groundwater Samples” (2008).

NIGLQ Nuclear Industry Code of Practice for Routine Water Quality Monitoring Page 4
saturation zone and in direct contact with the ground or subsoil’, which by implication includes water in perched saturation zones
• Open freshwater bodies such as springs, streams, rivers, ponds, lakes, open drainage ditches, canals and reservoirs
• Inter-tidal surface waters, including beach springs and tidal pools
• ‘In-pipe’ and ‘end of pipe’ surface water drainage.
Excluded from consideration are:
• ‘In-pipe’ or ‘end of pipe’ effluents (e.g. radioactive effluents, treated sewage effluents or surface water drainage discharges subject to waste water consents/permits)2. Environment Agency (EA) and Scottish Environment Protection Agency (SEPA) Radiological Monitoring Technical Note 1 deals with standardised reporting of radioactive discharges from nuclear sites [3]
• Offshore marine/estuarine waters
• Deep lacustrine waters.
2) ‘Water quality’ refers to all aspects of the physical and chemical (including radionuclides) composition of the water, including suspended solids where relevant. This document does not deal with microbial aspects of water quality.
3) ‘Water quality monitoring’ means the collection of water quality data at more or less regular intervals over time. Such monitoring may include hydrometric measurements (e.g. measurement of water level and flow) to support the acquisition and assessment of water quality data. However, this document is not a guide to hydrometric monitoring in general.
4) ‘Routine water quality monitoring’ means the collection of water quality data and related hydrometric data at regular intervals over time, in accordance with a documented protocol, with defined criteria for assessment of results, such that results that are not in line with expectations can be identified and appropriate actions initiated.
Definitions of terms relating to contamination as used in this document are given in Box 1.3. Potential components of a routine water quality monitoring programme are listed in Box 1.4. British Standards relevant to water quality monitoring are listed in Box 1.53.
2 Specifically, this document does not provide guidance on monitoring arrangements to
quantify permitted discharges of aqueous radioactive wastes from nuclear licensed sites.
3 Many SLCs have access to British Standards via the IHS ‘Standards Expert’ on-line
database.

NIGLQ Nuclear Industry Code of Practice for Routine Water Quality Monitoring Page 5
Box 1.4: Potential Components of a Routine Water Quality Monitoring Programme
• In-field visual & olfactory observations of indicators of water quality (e.g. colour, smell).
• Manual and/or automated hydrometric measurements (e.g. surface water flow, groundwater level) to support assessment/interpretation of water quality monitoring data.
• Measurement of the thickness of Non-Aqueous Phase Liquid (NAPL) layer if present.
• Manual and/or automated field measurements of water quality parameters (e.g. dissolved oxygen, electrical conductivity, temperature and pH).
• Laboratory analysis of water samples for natural water chemistry.
• Laboratory analysis of water samples for Potential Contaminants of Concern.
Box 1.3: Definitions relating to Contamination
Contaminant: A substance or agent, present as a result of human activity, which has the potential to cause harm or pollution. This document refers to both radioactive and non-radioactive contaminants. Area of Potential Concern (APC): An area where contamination of land is potentially present or is known to be present. An APC may be the result of historical or present-day activities or processes. Potential Contaminant of Concern (PCoC): A contaminant which has been identified as present or potentially present in land or water, based on past measurements and/or the history of the site or APC.

NIGLQ Nuclear Industry Code of Practice for Routine Water Quality Monitoring Page 6
Box 1.5: Relevant British Standards
BS EN ISO 5667-1: 2006 Water Quality – Sampling. Guidance on the Design of Sampling Programmes and Sampling Techniques
BS 5667-4: 1987 Water Quality – Sampling. Guidance on Sampling from Lakes, Natural & Man-Made
BS ISO 5667-6: 2014 Water Quality – Sampling. Guidance on Sampling Rivers and Streams
BS 6068-6.9: 1993 Water Quality – Sampling. Guidance on Sampling from Marine Waters
BS ISO 5667-11: 2009 Water Quality – Sampling. Guidance on the Sampling of Groundwaters
BS 6068-6.14: 1998 Water Quality – Sampling. Guidance on Quality Assurance of Environmental Water Sampling and Handling
BS ISO 5667-3: 2012 Water Quality – Sampling. Guidance on the Preservation and Handling of Water Samples
BS ISO 5667-20: 2008 Water Quality – Sampling. Guidance on the Use of Sampling Data for Decision Making – Compliance with thresholds and classification systems
BS ISO 5667-22: 2010 Water Quality – Sampling. Guidance on the Design & Installation of Groundwater Monitoring Points
BS ISO 5667-23: 2011 Water Quality – Sampling. Guidance on Passive Sampling in Surface Waters
BS 5930:1999+A2:2010 Code of Practice for Site Investigations (sections relevant to water quality monitoring partly replaced by the following three standards):
BS 10175:2011+A1:2013: Investigation of Potentially Contaminated Sites – Code of Practice
BS ISO 21413: 2005 Manual Methods for the Measurement of a Groundwater Level in a Well
BS EN ISO 22475-1: 2006 Geotechnical Investigation & Testing – Sampling Methods & Groundwater Measurements Part 1

NIGLQ Nuclear Industry Code of Practice for Routine Water Quality Monitoring Page 7
2 Defining Objectives
Clear objectives are essential to develop a fit for purpose routine water quality monitoring programme. Objectives should be set considering the following main aspects:
1) Why is the monitoring necessary (considering statutory/regulatory and/or business drivers)?
2) What are the technical goals (considering what questions need to be answered)?
3) What is the information needed to meet the technical goals (including both the information needed to design the monitoring programme and the types of measurement required)?
4) What are the criteria for assessment of levels, variability and/or trends in contaminant concentrations which if met, would require some form of action to be taken?
As routine water quality monitoring is already being carried out on most UK nuclear sites, objective setting will typically involve review and potential revision of existing objectives.
Useful guidance on objective setting can be found in guidance provided by EA, SEPA and Food Standards Agency (FSA) on environmental radiological monitoring [4], by the US Environmental Protection Agency (USEPA) on Data Quality Objectives (DQO) [5,6], and by the World Health Organisation (WHO) [7] and the Water Framework Directive-UK Technical Advisory Group (UKTAG) [8]. The aspects set out above correspond to some of the requirements of the early stages of the DQO process, and readers are encouraged to use the DQO guidance as a source of
Box 2.1: Overview - Chapter 2 Outline: This chapter addresses objective setting for routine water quality
monitoring programmes, considering drivers and technical goals. The information in this chapter does not contain much nuclear/radioactivity-specific content.
Aims: For the reader:
� To recognise the importance of properly defined objectives for the routine monitoring programme
� To recognise the need to identify statutory/regulatory and business drivers for monitoring
� To understand the different categories of monitoring appropriate to different contexts
� To understand how to develop appropriate technical goals for monitoring.
Navigation: Key sections for more experienced staff: Section 2.1 (Develop Understanding of Drivers) and Section 2.2 (Types of Monitoring).

NIGLQ Nuclear Industry Code of Practice for Routine Water Quality Monitoring Page 8
additional guidance on objective setting. Note, however, that the present document does not attempt to use the DQO framework explicitly.
2.1 Develop understanding of drivers
2.1.1 Statutory/regulatory drivers
A number of statutory/regulatory drivers (some nuclear-specific) may require an effective monitoring programme to be in place, with the following areas of legislation potentially relevant to water quality on nuclear sites in the UK4:
1. Legislation relating to the Nuclear Site Licence
2. Legislation relating to process activities on the site and to disposals of radioactive and non-radioactive wastes (including aqueous wastes/effluents) from the site
3. Legislation relating to contaminated land
4. Legislation (additional to (2) and (3) above) relating to protection of the water environment.
5. Legislation relating to the planning process, for sites where development subject to planning approval is planned.
Nuclear safety in the UK is regulated through the Office of Nuclear Regulation (ONR), under the Nuclear Installations Act 1965 (as amended) (NIA65). This is complemented by the Ionising Radiations Regulations 1999 (IRR99), which define the requirements for the protection of workers and members of the public from ionising radiations.
NIA65 and the associated Site Licence Conditions [1] provide the regulatory regime for land (including groundwater) contaminated by radioactivity on Nuclear Licensed Sites. Licence Condition 34 concerns the prevention of leakage and escape of radioactive material and radioactive waste from control/containment and the detection of such leakage or escape, and is relevant to monitoring of groundwater as a means of detecting sub-surface spread of radioactivity on Nuclear Licensed Sites.
The UK environment agencies regulate discharges and disposal of radioactive wastes from Nuclear Licensed Sites. In England & Wales this is implemented through the Environmental Permitting Regulations 2010 (as amended) (EPR2010) and in Scotland through the Radioactive Substances Act 1993 (as amended) (RSA93). In some cases specific water quality monitoring requirements may be prescribed by the regulator under this legislation. Surface water discharges from nuclear licensed sites may be considered by the relevant environment agency to be waste effluent (and hence aqueous radioactive waste if radioactively contaminated) and subject to relevant legislation5.
Memoranda of Understanding (MoU) between the Health and Safety Executive (HSE) and EA [9] and SEPA [10] are in place which clarify regulatory arrangements on UK nuclear sites.
4
Note that this list covers the main areas of legislation; it does not consider the details of which legislation applies where in the UK.
5 Note the previously stated exclusion that this document does not provide guidance on
monitoring arrangements to quantify permitted discharges of aqueous radioactive wastes from Nuclear Licensed Sites.

NIGLQ Nuclear Industry Code of Practice for Routine Water Quality Monitoring Page 9
A summary of regulatory regimes and principal regulators is given in a 2010 SAFEGROUNDS document [11], although this predates changes to radioactive substances legislation throughout the UK in 2011 and the Water Environment (Controlled Activities) (Scotland) Regulations 2011.
2.1.2 Business drivers
The term ‘business drivers’ here means drivers that do not derive directly from statutory/regulatory requirements, but which the SLC may need to address to effectively manage the site and any associated environmental liabilities. Such drivers may include:
• A need to reduce uncertainty in the extent and mobility of groundwater contamination at a site
• A need to provide reassurance/confirmation of continued lack of impact of site operations on water quality (whether in terms of no discernible impact or no deterioration)
• A need to confirm that an implemented or on-going remedial intervention has had or is having the expected effect on water quality.
2.2 Types of water quality monitoring
The drivers will define the need for one or more of the following types of monitoring:
2.2.1 Characterisation monitoring
The term ‘characterisation monitoring’ applies to monitoring carried out to understand a known or potential water quality problem at a site or area of a site (e.g. groundwater contaminant plume behaviour).
Information from characterisation monitoring is used to improve the Conceptual Site Model (CSM) for the problem under investigation (Section 2.3.2). This will reduce uncertainties when assessing risks from contamination and may inform remediation options appraisal or design of remediation.
Characterisation monitoring may also be undertaken to establish the baseline water quality at or adjacent to the site (Section 2.3.3).
Characterisation monitoring is typically a relatively short-term (<1 year) activity when applied to a single area, but at a site scale it may continue on and off in one form or another as long as water quality issues at the site remain.
Characterisation monitoring should not be considered as long-term or routine, and as such is not a primary focus of this document.
2.2.2 Compliance monitoring
Compliance monitoring is driven by statutory/regulatory requirements and is typically a long-term activity, lasting more than a few years. Although in some cases the regulator may specify aspects of the monitoring programme, often the SLC will develop a programme that it believes is suitable to demonstrate compliance with the statutory/regulatory requirements. In the latter case, there may be some dialogue with the regulator to agree the scope of the programme.

NIGLQ Nuclear Industry Code of Practice for Routine Water Quality Monitoring Page 10
Examples of compliance monitoring include:
• To address nuclear Site Licence Conditions. For example, to confirm the adequacy of control/containment of an area of radioactive land contamination in accordance with LC34
• To support a Best Available Technique (BAT) or Best Practicable Means (BPM) justification under radioactive substances legislation. For example, monitoring the management of groundwater contaminated by radioactivity that is giving rise to a discharge of aqueous radioactive waste from the site
• To quantify any impact on the water environment of any authorised disposals of solid radioactive wastes
• To fulfil conditions of an Environmental Permit or Pollution Prevention and Control (PPC) permit relating to a non-radioactive substances activity at the site (e.g. groundwater monitoring around an on-site landfill)
• To demonstrate compliance with consents for surface water discharges considered to be non-radioactive waste effluents.
Where there is no explicit regulatory requirement for monitoring, but the SLC elects to undertake monitoring that could contribute to meeting a statutory obligation, there may not be a clear distinction between what might be called elective compliance monitoring and what is here termed reassurance or confirmatory monitoring.
2.2.3 Performance monitoring
Performance monitoring is a type of monitoring undertaken to criteria set by the SLC in the context of some form of remediation scheme. It can be carried out during and/or after remediation (depending on the kind of remediation undertaken) and monitors the effectiveness of the scheme in achieving its objectives.
Remediation by means of a formal Monitored Natural Attenuation (MNA) scheme will involve a type of performance monitoring.
2.2.4 Reassurance or confirmatory monitoring
Reassurance or confirmatory monitoring is used to confirm that the water quality of the site is not affected by site or off-site activities, or that water quality is not deteriorating. It may follow on from characterisation monitoring where there is no indication of contamination (i.e. to act as a continuing record of absence of contamination), or where contamination is present but judged to be not requiring active remedial intervention under current site conditions. Typical examples include:
• Confirming lack of impact on a site from upstream/up-gradient sources of potential contamination
• Confirming the continued adequacy of management of existing ground contamination, in the absence of specifically designed remediation6
• Confirming continued satisfactory operation of facilities handling/storing nuclear material and other potential contaminating materials, for example as part of a leak detection system or as downstream/down-gradient site perimeter monitoring
6 Depending on the history of the contamination and any past remedial interventions, there
may be an element of performance monitoring involved. For radioactive contamination, there may be an element of elective compliance monitoring involved.

NIGLQ Nuclear Industry Code of Practice for Routine Water Quality Monitoring Page 11
• Supporting some kind of deregulation, such as a delicensing case where adjoining land is to remain licensed
• Surrender of an environmental permit.
More Prescriptive Guidance: Other than characterisation monitoring, all the above types of monitoring should comprise routine monitoring undertaken in accordance with a documented protocol, with appropriately defined criteria for assessment of results. However, the need for defined assessment criteria may be relaxed in some cases of reassurance or confirmatory monitoring.
2.3 Defining technical goals
2.3.1 General principles
The technical goals for a routine water quality monitoring programme should reflect the relevant statutory/regulatory and business drivers. Technical goals can usefully be formulated by considering questions that the monitoring data are likely to be used to address. Examples of types of technical goals formulated in this way are given in Section 2.3.4.
2.3.2 The role of the Conceptual Site Model
In general, technical goals should be framed in the context of an existing Conceptual Site Model (CSM) for the site or area of site in question. The CSM is a simplified representation (in diagrammatic and/or written form) of the current understanding of the features, events and processes operating at a site or an area of the site. An example of a hydrogeological CSM, taken from EA’s Groundwater protection: Principles and practice (GP3) [12], is shown in Figure 1.
The detection and investigation of variations in water quality (especially deteriorations) resulting from human activities typically form the main objective of a routine water quality monitoring programme. Potential causes of variation require investigation and, where appropriate, mitigation where the variation cannot be attributed to natural causes or artefacts. The CSM should summarise information and inferences relating to potential contaminant sources, pathways and receptors, including the possible relationships between them. The term ‘pollutant linkage’ is used to describe a particular combination of contaminant, pathway and receptor.
In the context of routine water quality monitoring, both the groundwater and surface water may be pathways for contaminant movement and receptors that may be harmed (polluted) by contamination.
The CSM should describe:
• The main features of the site
• The site’s environmental setting, including its geology and hydrogeology
• The previous and current uses of the site
• Areas of Potential Concern (APC), which arise from historical or current activities on the site (i.e. potential contaminant sources)
• Potential Contaminants of Concern (PCoC) and their mode of occurrence
• Potential receptors. In this NICoP, the focus is on water environment receptors and receptors that may come into contact with the water environment

NIGLQ Nuclear Industry Code of Practice for Routine Water Quality Monitoring Page 12
• Potential pathways to the identified receptors. In this NICoP, the focus is on pathways via groundwater or surface water.
Figure 1: Example of a hydrogeological conceptual model (from [12])
Any key conceptual uncertainties or assumptions made in the absence of data should be clearly stated in the documentation of the CSM. Identified data gaps or uncertainties can be used to inform further characterisation activities, and their output used to test and refine the CSM. It is good practice to test alternative CSMs if there are significant uncertainties or alternative plausible assumptions.
A CSM can vary widely in complexity according to the purpose for which it has been developed and the amount of information that is available. A basic CSM can be used to inform the development of the routine monitoring programme. Data from the monitoring programme then feed back to increase the level of detail and understanding in the CSM, which may in turn lead to changes to the routine water quality monitoring programme. A well-substantiated and well-designed routine monitoring programme should be based on a mature CSM that is unlikely to be challenged by further monitoring results.

NIGLQ Nuclear Industry Code of Practice for Routine Water Quality Monitoring Page 13
The CSM informs the design of the routine water quality monitoring programme through:
• Identifying and prioritising APCs as potential sources of contamination of groundwater and/or surface water
• Identifying groundwater and/or surface water known to be contaminated or at risk of contamination
• Identifying potential impacts of APCs on water quality
• Identifying the boundaries of the area at risk of contamination
• Identifying appropriate types of monitoring points (e.g. for surface waters, intercepted groundwater and/or in situ groundwater)
• Enabling monitoring point locations to be selected
• Enabling appropriate sampling frequencies to be selected.
Good practice for the development of a CSM is provided by the Environment Agency [13,14,15], in British Standards [16,17], NIGLQ guidance [18] and in SAFEGROUNDS site characterisation guidance [19].
The CSM should be updated to incorporate any improved understanding derived from the routine water quality monitoring programme or from other information sources. The routine monitoring programme should be reviewed at regular intervals, preferably annually, to ensure it remains relevant to the requirements of the site. The review should address the issues set out in Box 2.2. Regular review of the routine water quality monitoring programme will also ensure that ‘monitoring creep’ (the gradual expansion of the programme without justification) does not occur.
There may also be a need to amend the sampling frequency on an ad-hoc basis. Examples of such ad-hoc changes include responding to: anomalous results and consequent management actions; planned events such as groundworks or major decommissioning activities with the potential to affect water quality, and; unplanned events such as leaks, spills or floods. Such changes should be ‘by exception’ and the justification recorded.

NIGLQ Nuclear Industry Code of Practice for Routine Water Quality Monitoring Page 14
2.3.3 The need for Baseline data
The SLC is concerned with changes in water quality arising from activities carried out on site. Therefore, regardless of the specific drivers or technical goals, the results of any routine monitoring programme should be evaluated with reference to an adequately characterised baseline condition set at some defined point in time. Ideally, there would be an adequately characterised baseline prior to contamination occurring at a site, but in practice this is often not possible. Therefore, an arbitrary
Box 2.2: Periodic Review of Routine Water Quality Monitoring Programmes
The following issues should be considered as part of a periodic review:
• Objectives: Have the objectives and/or drivers of the programme changed, and if so, how do these impact on the programme?
• Is the reason for monitoring at each location still appropriate (e.g. is the location still required for statutory or performance monitoring)?
• Have there been any events (e.g. leaks/spills or implementation of remediation) which may impact on water quality?
• Are the existing installations/monitoring points still considered fit for purpose?
• Are there any issues with maintenance of monitoring points?
• Have there been any developments in respect of stakeholder or regulator engagement?
• Have there been any updates to the CSM and/or contamination risk assessments that change the assessed potential impact of contamination?
• Do time-series data indicate any change in the shape and extent of any groundwater contamination plumes?
• Does the dataset demonstrate a relationship between water levels and water quality that has not been previously recognised?
• Does the dataset demonstrate a previously unrecognised relationship between water quality and sampling methodology or personnel, where these have changed?
• Does the dataset demonstrate a previously unrecognised relationship between water quality and laboratory or laboratory method, where these have been changed?
• Do the data suggest an increase in temporal variability of water quality?
• Are data from the monitoring point still required at the current frequency and for the current determinands?
The impact on the scope of the programme should be determined in the event that any of the above applies, and the programme modified to accommodate these impacts. This may involve the addition or removal of monitoring points, an increase or decrease in monitoring frequency, or changes to the analytical schedule.

NIGLQ Nuclear Industry Code of Practice for Routine Water Quality Monitoring Page 15
point in time may need to be chosen as a baseline. Furthermore, re-baselining may become appropriate at some stage, for example if there is a substantial change in the number and/or locations of monitoring points.
The baseline should consist of a quantitative characterisation of relevant hydrometric, hydrochemical and contaminant parameters, including their variability over sub-annual timescales. The identification of which parameters need to be monitored should be based on the CSM (see ‘More Prescriptive Guidance’ below). Chapter 6 provides guidance on the frequency of routine water quality monitoring; note that only some of the issues discussed in that chapter will be relevant to characterisation of the baseline.
More Prescriptive Guidance: Where there is uncertainty in the Conceptual Site Model concerning the identities of PCoC, the baseline characterisation should include demonstrating the absence of reasonably suspected PCoC at relevant monitoring points before they can be confidently omitted from the scope of future routine monitoring. Where the CSM indicates the potential for substantial short-term variability in water quality parameters (e.g. driven by seasonal or shorter-term hydrological effects) then characterisation monitoring at appropriate frequency should be undertaken to quantify such variability in the baseline.
2.3.4 Examples of technical goals
The following examples illustrate how technical goals for routine water quality monitoring can be set taking account of the drivers for monitoring (Section 2.1), the type of monitoring required (Section 2.2) and the CSM (Section 2.3.2).
Example 1: Compliance with a radioactive substances legislation permit condition. A specified permit condition might be to monitor for radionuclides in a surface water drainage outlet from the site. In this context the technical goal could be defined as: ‘Be able, with a reasonably high level of confidence, to detect future discharge of specified contaminants above some defined levels of interest beyond the site boundary’. This would be an example of routine compliance monitoring.
Example 2: Addressing Licence Condition 34. An SLC might wish to use monitoring to address Licence Condition 34(2) [1] in relation to existing radioactive ground contamination. In this context, the technical goal of monitoring could be defined as: ‘Be able, with a reasonably high level of confidence, to detect future spread of specified contaminants above some defined levels of interest beyond the current extent of contamination’. This would be an example of routine confirmatory monitoring (i.e. confirming no deterioration) with an element of elective compliance monitoring.
Example 3: Assessing performance of a remedial intervention. A recently implemented remedial intervention might have removed or isolated a substantial amount of the source of a groundwater contamination plume. In this context the technical goal could be defined as: ‘Evaluate the effectiveness of the remediation in terms of attenuation of specified contaminants in the plume over time’. This would be an example of routine performance monitoring.
Example 4: Investigation of unexpected contaminant behaviour. A recently observed unexpected upward trend of a contaminant concentration in a borehole might indicate that the existing CSM for the behaviour of this contaminant is incorrect. In this context the technical goal could be defined as: ‘Test alternative variants of the CSM as regards the source(s) of the contamination and/or pathways

NIGLQ Nuclear Industry Code of Practice for Routine Water Quality Monitoring Page 16
in the groundwater system’. This would be an example of non-routine characterisation monitoring.
2.4 Identifying information needed to meet technical goals
Once technical goals of monitoring have been defined, the information which needs to be gathered through monitoring can be identified. This will include consideration of the following:
• What to monitor
• Where to monitor
• How to monitor
• How often to monitor
• What field measurements to make
• What analyses to carry out
• What assessment criteria to compare the results against.
Much of the remainder of this document is guidance on addressing these questions.
2.5 Potential pitfalls
Potential pitfalls in relation to setting objectives of water quality monitoring are highlighted in Box 2.3.
Box 2.3: Potential pitfalls
Potential pitfalls in relation to setting objectives include the following:
• Failing to set clearly defined objectives
• Failing to clearly identify the drivers for monitoring
• Failing to set technical goals linked to drivers
• Basing the design of a monitoring programme on an undocumented CSM
• Basing the design of a monitoring programme on a CSM incorporating major untested assumptions
• Not updating the CSM in light of quantitative information gained from the routine monitoring programme
• The continued use of a CSM that is out of date or otherwise not fit for purpose
• Not setting or adequately characterising a baseline
• ‘Creep’ in implicit (but not clearly defined) objectives and consequent growth in the monitoring programme
• Not reviewing the objectives of the monitoring programme at appropriate intervals

NIGLQ Nuclear Industry Code of Practice for Routine Water Quality Monitoring Page 17
3 Designing the Monitoring Network
Most nuclear sites will already have a routine water quality monitoring programme in place. Such programmes should be considered as being continually open to change to take into account trends in water quality, improvements to the CSM, ongoing site characterisation and risk assessment, changes in the regulatory regime and any relevant site events or changes in site conditions.
This chapter provides guidance on designing a network of monitoring points for routine water quality monitoring, including incorporation of existing monitoring points into the programme. It considers the selection of monitoring locations; a process map is shown in Box 3.2. The design of individual monitoring locations is covered in Chapter 4.
3.1 Existing monitoring points
An essential component of the design process is the review of any existing monitoring, whether this comprises a comprehensive network or isolated locations, including those which may not be related to current site activities. First, the following should be established:
• The locations of all existing monitoring points
• The design and condition of all existing monitoring points
• Existing monitoring points that do not conform with good practice design. Design of water quality monitoring points is considered in Chapter 4.
For existing monitoring points, the key issues to be considered are:
• Which, if any, existing monitoring points are in the right locations to be included in the routine water quality monitoring programme? Guidance on identifying appropriate locations is given in Section 3.5.
Box 3.1. Overview – Chapter 3 Outline: This chapter considers design of a water quality monitoring network.
The information in this chapter does not contain much nuclear/radioactivity-specific content.
Aims: For the reader to understand:
� the importance of reviewing existing information
� how to choose monitoring point locations
Navigation: Key sections for more experienced staff: Section 3.4 (Location
Selection: ‘Off-site’ monitoring) and Section3.5 (Location Selection: Guidance).

NIGLQ Nuclear Industry Code of Practice for Routine Water Quality Monitoring Page 18
• Do any existing monitoring points require improvement works (refurbishment)?
• Do any existing monitoring points require decommissioning, for example because
they are poorly designed? Chapter 4 outlines the consequences of poorly
designed monitoring points and provides guidance on their decommissioning
• Is the numbering system for existing monitoring points to be included in the routine water quality monitoring programme straightforward to understand? If not, should it be rationalised, to reduce the potential for errors and misunderstanding in the future?

NIGLQ Nuclear Industry Code of Practice for Routine Water Quality Monitoring Page 19
3.2 Review of existing monitoring data
Existing monitoring data should be reviewed in the context of the existing CSM, known/potential risks to receptors and the objectives of the monitoring programme. It is important that those undertaking this review should liaise closely with those involved in site characterisation to ensure that all relevant information is taken into account. The review, in conjunction with assessment of the condition of existing monitoring points, will identify the need for any new water quality monitoring points. Where new monitoring points are required, the key issues to be considered are:
• Where, in three dimensions, should the new monitoring points be located? Consideration and guidance on locating monitoring points is given in the remainder of this chapter
• What design(s) should be used? Guidance is given in Chapter 4. It is important to consider the potential phenomenon of ‘monitoring creep’ when reviewing available water quality information and designing the monitoring network. Monitoring creep is where the scope and scale of the monitoring programme increases without proportionately contributing to meeting the programme objectives. This can occur for several reasons, including where new monitoring points are ‘temporarily’ included (e.g. characterisation monitoring to investigate a potential additional source). There can be a reluctance to remove such points from the routine monitoring programme, even where there is no evidence of contamination.
Regular review of the monitoring programme with respect to its stated objectives (e.g. on an annual basis) should mitigate the risk of monitoring creep. No monitoring point should be included in the programme unless it serves an identified purpose.
3.3 Issues to consider when locating monitoring points
Routine water quality monitoring should focus on those groundwater and surface water bodies most at risk from contamination, as determined by risk assessment. The CSM will identify these bodies and can be used to infer the key surface water and groundwater flow pathways. A lower level of routine monitoring should be undertaken in other groundwater and surface water bodies at the site. Knowledge and understanding of local and regional hydrology and geology/hydrogeology, together with an appreciation of the transport properties of PCoCs, should be used to select monitoring point locations.
Water quality monitoring points should be located (taking into account any constraints) to provide information on:
• Background water quality, including for water coming onto the site
• Water quality leaving the site
• Water quality close to and down-gradient of known or suspected contaminant sources, including off-site monitoring if warranted
• Water quality for any relevant water abstractions on or down-gradient of the site.
Selecting locations for surface water quality monitoring points is generally straightforward because, by definition, such water bodies are present at the land surface and potential surface water flow paths from contaminant sources are easily understood. Where there are significant flows (e.g. in streams and surface water drainage ditches), contaminant residence times in the surface water are short and the most appropriate monitoring locations are therefore at the site boundaries.

NIGLQ Nuclear Industry Code of Practice for Routine Water Quality Monitoring Page 20
Routine water quality monitoring should also take place at locations where surface waters flow onto the nuclear site; this would determine the potential impact of off-site sources and of any authorised aerial discharges on water quality on the nuclear site.
For surface water bodies that are not subject to significant flow, such as ponds and lakes, care should be taken to ensure that the monitoring points chosen are representative of the water body as a whole. Due to natural heterogeneity (such as inflow and outflow points, depth variations and stratification) more than one monitoring point may be required to adequately represent the water body.
In groundwater, sustained changes in water quality (as opposed to fluctuations driven by natural processes) generally occur gradually as a result of groundwater flow and contaminant dispersion, variations in contaminant mobility and variations in the rate of contaminant degradation and production of breakdown products. Changes may occur more rapidly where preferential pathways such as fractures or man-made features are present.
There is generally some uncertainty about where to locate groundwater monitoring points, as understanding of subsurface geology, hydrogeology and Source-Pathway-Receptor pollutant linkages will never be at a level where the ‘ideal’ locations can be selected. Physical constraints, such as locations of infrastructure and ongoing site activities, may also mean that some preferred locations cannot be monitored. Location selection can therefore only ever be considered as the best practicable based on existing knowledge and professional judgement. Acknowledgement of such limitations is an important aspect in the monitoring plan design process.
Selection of locations for groundwater monitoring points will be influenced by many relevant factors, including the following:
• The CSM and the associated level of confidence in it, which indicates where contamination is present or is likely to be present at the current time, and where contaminants might migrate to within the period of the monitoring programme
• An understanding of subsurface processes which operate on site. The nature of the made ground and natural strata underlying many UK Nuclear Licensed Sites means that groundwater flow (particularly in superficial deposits) can be very heterogeneous. More than one contaminant pathway may be present on a site
• Contaminant concentrations and temporal trends at existing monitoring points. For example, new monitoring points may be required where existing monitoring indicates a growing groundwater plume
• The risk posed by the potential or known contaminant. The level of risk can be expressed through either qualitative risk assessment (e.g. using the Nuclear Industry Group for Land Quality [NIGLQ] Qualitative Risk Assessment for Land Contamination [QLRA] methodology [18]) or quantitative risk assessment. On a complex site, monitoring locations may initially be prioritised on the basis of assessed risks to receptors
• Constraints imposed by site structures/infrastructure and by site operations
• Budget constraints.
It is good practice to state clearly the technical and non-technical influences on the choice of monitoring locations in the design document.

NIGLQ Nuclear Industry Code of Practice for Routine Water Quality Monitoring Page 21
3.4 When might ‘off-site’ monitoring be appropriate?
The CSM may indicate that monitoring of surface water or groundwater outside the Nuclear Licensed Site might be necessary. Box 3.3 presents technical and non-technical criteria which should prompt consideration of whether such ‘off-site’ monitoring is required.
Many practical aspects of off-site monitoring are similar to those faced on-site. However, a number of additional issues require consideration, including:
• Land outside the nuclear site may have a different owner
• Other regulatory regimes may apply
• Third parties become involved, some of whom may not have a full understanding of risk assessment. For example, monitoring off-site may be perceived as meaning severe contamination is present
• The converse of the above is that off-site monitoring may provide reassurance to the local community, in particular where no off-site contamination is expected and the monitoring programme is in place purely as a reassurance measure
• Liaison with third parties together with varying uses of off-site land may mean that the effort, costs and constraints associated with establishing off-site monitoring points are greater than would be encountered on-site
• Lack of site security may preclude deployment of vulnerable equipment, such as that used for continuous monitoring
• There may be additional risks (Photo 1).
Box 3.3: Off-site monitoring – checklist
Off-site monitoring should be considered if one or more of the following conditions are met:
• Where off-site migration of contaminants is known or suspected
• Where contaminant concentrations at monitoring points close to the site boundary show a rising trend
• Where contaminant concentrations at monitoring points close to the site boundary exceed or are close to assessment values (see Chapter 10)
• Where specific off-site receptors are at risk, such as water abstraction points or at locations where groundwater discharges at surface
• Where required by the relevant regulatory authority
• Where such monitoring would be of reassurance to the land-owner and/or local community

NIGLQ Nuclear Industry Code of Practice for Routine Water Quality Monitoring Page 22
Photo 1 Off-site monitoring may introduce new risks
Off-site monitoring may already be taking place, for example as part of the SLC’s routine environmental monitoring programme or by the UK environment agencies or local authorities. Where off-site monitoring is required to meet the same objectives, liaison with the relevant regulator or local authority may allow optimisation of the respective programmes, preventing unnecessary duplication of effort.
3.5 Guidance on locating monitoring points
3.5.1 Factors to be considered
The number and location of monitoring points required is dependent on factors including:
• Monitoring objectives (see Chapter 2)
• The type of monitoring required (see Section 2.2)
• Whether APCs are present
• The characteristics of the PCoCs
• Measured or predicted contaminant concentrations relative to assessment values (see Chapter 10)
• Whether water quality is deteriorating or improving
• Temporal variability (e.g. seasonal variation in groundwater flow directions)

NIGLQ Nuclear Industry Code of Practice for Routine Water Quality Monitoring Page 23
• The types of receptors present
• The level of confidence in the CSM (Section 2.3.2).
Given the number of factors above, it is not possible to be prescriptive about the number of monitoring points required at a site. However, by using the information available in the CSM, it is possible for suitably experienced staff to design a monitoring network that will be appropriate to the geological and hydrogeological conditions and the nature of any contaminants present.
Where existing monitoring points are considered, their suitability should be taken into account, as discussed at the beginning of this chapter. Where two or more potentially suitable boreholes are in close proximity to each other, existing monitoring data should be compared and the borehole which yields the highest contaminant concentrations should be selected.
3.5.2 Guidance: surface water monitoring locations
Contaminant residence times in flowing surface waters are short. Therefore the most appropriate monitoring locations for streams, surface water drainage ditches and surface water outfalls on a nuclear site are at the site boundary. Routine water quality monitoring should take place at all locations where surface waters flow on and off the nuclear site.
3.5.3 Guidance: groundwater monitoring locations at the site boundary
A routine groundwater monitoring programme will generally need to detect any significant migration of contamination beyond the site boundary. In the case of radioactive contamination, this will typically be the boundary of the Nuclear Licensed Site. To achieve this, boreholes should be located just inside the site boundary. The numbers and locations of such groundwater monitoring points should be informed by the CSM.
More Prescriptive Guidance: Where there is a relatively simple groundwater flow regime (i.e. one with a well-understood predominantly horizontal uniform hydraulic gradient) and where no areas with the potential to cause contamination of groundwater have been identified, a minimum of three groundwater monitoring points should be installed along the down-gradient boundary of the Nuclear Licensed Site. This will enable groundwater quality flowing off the nuclear site to be monitored. At least one borehole should be located on the up-gradient boundary of the Nuclear Licensed Site to enable groundwater quality flowing onto the nuclear site to be monitored. The reasoning behind these requirements is both to allow the calculation of groundwater flow direction and to make some accommodation for the possibility of unrecognised variation in groundwater flow directions. Note that these boundary monitoring locations are in addition to boreholes required for specific Areas of Potential Concern on the site.
The number of monitoring points on the up-gradient site boundary will depend on a number of factors. Broadly speaking, more up-gradient boundary monitoring points will be needed where:
• The hydrogeological regime is complex (e.g. with: more than one groundwater body that could be contaminated; preferential pathways; influences from built structures; temporal variations in groundwater flow direction; variable saline influence)

NIGLQ Nuclear Industry Code of Practice for Routine Water Quality Monitoring Page 24
• Contaminants unrelated to site activities, or resulting from authorised aerial discharges from site operations, are known to be present in water flowing onto the site.
Additional groundwater monitoring points at the down-gradient site boundary will be required where one or more Areas of Potential Concern have been identified on the site. These may form ‘sentinel boreholes’, and are discussed further in Section 3.5.4.
3.5.4 Guidance: groundwater monitoring locations for APCs
APCs and associated potential pollutant linkages will have been identified on most nuclear sites. The CSM will have defined those groundwater bodies or areas of groundwater bodies at risk. Where the CSM indicates a significant known or potential impact on water quality, groundwater monitoring may be required close to the APC and in any contaminant plume(s) arising from the source. The number of monitoring points should reflect the size of the source, the associated risk and the expected variability in water quality. The CSM and the physiochemical characteristics of the contaminant should be taken into account when considering the depth at which the groundwater body should be sampled. For example, monitoring for Light Non-Aqueous Phase Liquids (LNAPLs) should take place across the groundwater table, taking into account the range of fluctuation.
It is generally impracticable to fully characterise a contaminant plume due to the number of monitoring points that would be required. Instead, it may be appropriate to define the area/volume of water that exceeds assessment values. This approach is similar to that advised by SEPA in position statement WAT-PS-10-01 [20], which uses the concept of ‘assessment’ and ‘compliance’ points to measure the impact of a source on a body of groundwater at specified distances from the source. Environment Agency gives similar guidance on the location of compliance points for groundwater resource protection. For example, see Table 8.2 of [12] and also [21].
Depending on the risk posed by the APC, some or all of the following types of routine monitoring locations may be required:
1. ‘In-plume’ boreholes, where a known plume is present
2. ‘Delineation’ boreholes, immediately down-gradient and either side of the plume. These act to give an ‘early warning’ of plume migration/dispersion
3. ‘Sentinel’ boreholes, further down-gradient of plume. These act as a long-term indicator of plume migration. Where plumes are contained within the nuclear site, monitoring at the site boundary is a common approach for sentinel boreholes
4. ‘Up-gradient’ boreholes, to provide a baseline against which the impact of the APC on water quality can be assessed.
When considering potential locations for ‘delineation’ or ‘sentinel’ boreholes, particular care should be taken in evaluating groundwater flow direction and its variability in time and space.
Locating suitable boreholes is a relatively simple process where there are a small number of geographically distinct APCs, but becomes more complex where a groundwater body or area of a groundwater body is affected by multiple APCs. In this case, it may be difficult to determine the source of observed groundwater contamination. If it is necessary to distinguish the effects of each APC on the same groundwater body (e.g. to monitor the effects of any source remediation), consideration should be given to increasing the number of monitoring points around

NIGLQ Nuclear Industry Code of Practice for Routine Water Quality Monitoring Page 25
adjacent APCs. Alternatively, groups of APCs (e.g. where similar in nature or very near to each other) should be considered as a single source, with placement of monitoring boreholes accordingly.
Where necessary (for example where a large number of APCs are present), a prioritisation process such as QLRA [18] can be used to focus routine water quality monitoring on areas of greatest concern, but the overall aim should be to develop a monitoring regime based on an understanding of the impact of all APCs on the water environment.
The design of a monitoring programme can also be informed by the systematic approach set out in the early quantitative stages of the US EPA DQO process [5,6]. However, application of the quantitative, statistically-based stages of the DQO process to determining the number of groundwater monitoring points has a number of difficulties and pitfalls, and should only be attempted where such a statistical approach is justified by the technical goals of monitoring and the CSM.
3.6 Potential pitfalls
Potential pitfalls in relation to specifying locations for water quality monitoring are highlighted in Box 3.4.
Box 3.4: Potential pitfalls
Potential pitfalls which may be encountered when specifying monitoring locations include:
• Scope creep
• Inadequate/incomplete CSM
• Not adequately determining background (incoming) water quality
• Not monitoring all potentially significant sources of groundwater or surface water contamination identified in the CSM
• Monitoring points are located without considering anticipated contaminant migration rates
• Inclusion of existing monitoring points that are not fit for purpose. See Chapter 4
• Not monitoring the whole area at risk
• Not including off-site monitoring points where a risk has been identified
• Lack of discussion with, and buy in from, regulators and other stakeholders
• Inadequate liaison with those undertaking site characterisation
• Inappropriate application of statistically-based approaches/tools

NIGLQ Nuclear Industry Code of Practice for Routine Water Quality Monitoring Page 26
4 Designing & Maintaining Monitoring Points
This chapter provides guidance on the design and maintenance of water quality monitoring points. Poor design or maintenance may mean that objectives cannot be met, and in some cases create an increased risk to receptors. Surface water and groundwater monitoring points are discussed separately. In each section, the following aspects are discussed:
• How to design water quality monitoring points
• How to evaluate the suitability of existing water quality monitoring points
• How to maintain, refurbish and decommission water quality monitoring points.
4.1 Surface water monitoring
Measurements or samples may be taken either from natural water bodies (streams, rivers, lakes, pools, springs etc) or man-made features, such as ‘in-pipe’ and ‘end of pipe’ surface water drains, weirs, open drainage ditches, canals and reservoirs. The types of monitoring/measurement point fall into one of two groups:
• Engineered monitoring points, e.g. V-notch weirs and weir boxes (for flow measurement) and stream gauge boards (for measuring the stage or height of the water surface at a specific location)
• Non-engineered monitoring points, i.e. a location in a surface water body from which a sample is taken.
The choice of monitoring locations is discussed in Chapter 3. Sampling techniques are described in Chapter 7.
Engineered monitoring points are generally used to monitor the hydrometric properties of the water body, such as stage (water surface level relative to a fixed point) and the volumetric rate of flow in a channel. Simple velocity measurements can also be taken by direct means using mechanical or electromagnetic meters,
Box 4.1: Roadmap – Chapter 4
Outline: This chapter discusses the design and maintenance aspects of routine water quality monitoring points. The information in this chapter does not contain much nuclear/radioactivity-specific content.
Aims: For the reader to:
� Understand the design and maintenance of water quality monitoring points.
� Identify how to assess the suitability of existing monitoring points against programme objectives.
� Understand the need to appropriately decommission those monitoring points deemed unsuitable for further monitoring.
Navigation: Key sections for more experienced staff – Sections 4.1.2 & 4.2.2 (suitability of existing monitoring points), Sections 4.1.3 & 4.2.3 (maintenance), Section 4.2.3 (decommissioning), Box 4.4 (potential pitfalls)

NIGLQ Nuclear Industry Code of Practice for Routine Water Quality Monitoring Page 27
tracers or floats and converted to volumetric flow rate by multiplication with the channel cross sectional area. Once baseline information on representative contaminant concentrations is available, hydrometric data can act as a proxy for contaminant discharge rate, subject to appropriate periodic monitoring of water quality.
The choice of monitoring point type is informed by the monitoring objectives, what measurements need to be made, the sampling methodology and health & safety requirements.
4.1.1 Design
More detailed advice on the choice of surface water monitoring points and the design and installation of engineered features is provided in BS ISO 5667-6: 2014 [22]. Regulatory consents will be needed to install engineered monitoring points. Additional advice is also provided by the EA and SEPA in documentation on the monitoring of landfill leachate, groundwater and surface water [23,24]. Although not specific to the UK, useful guidance on surface water flow measurement is also provided by the US National Nonpoint Source Monitoring Program [25].
4.1.2 Are Existing Monitoring Points Suitable?
In the case of engineered monitoring locations, such as gauging boards and weirs, their design should be assessed to determine whether they meet current standards as given in BS EN ISO 748:2007 [26],BS 3680-3B:1997 [27], ISO 1100-2 [28] and EA guidance [29]. Non-engineered monitoring points in surface water bodies should have a sufficient depth of water to allow complete submergence of the sampling container without disturbing bottom sediments (unless sediment samples are required) and sufficient clearance to allow sample retrieval without dislodging material from the banks of the watercourse or re-suspending sediment from the bed of the water body.
4.1.3 Refurbishment, maintenance and decommissioning
For non-engineered surface water sampling points, refurbishment, maintenance and decommissioning have limited applicability. Refurbishment and/or maintenance may be needed to maintain a safe working environment, such as vegetation management and bank stability work. Decommissioning would most likely simply comprise abandonment.
Where engineered features such as stream gauges and weirs are involved, removal or modification may need regulatory consent, and the appropriate regulator should be approached prior to any work commencing, giving details of the proposed work and the underlying reasoning. Refurbishment and maintenance of such features may include vegetation management, sediment clearance/removal immediately upstream and resurveying of elevations. Decommissioning will most likely involve removal of all equipment and perhaps restoration of the area.
4.2 Groundwater monitoring
4.2.1 Design
BS ISO 5667-22 (2010) [30] and SAFEGROUNDS [19] provide guidance on the design and installation of groundwater monitoring points, including boreholes.

NIGLQ Nuclear Industry Code of Practice for Routine Water Quality Monitoring Page 28
Key design issues which should be considered when carrying out generic and detailed design include:
• Anticipated operational lifetime. The design must be such that the borehole is capable of providing fit for purpose samples and preventing any cross-contamination over the required timescale, which is typically in the order of years to decades
• Ease of construction, maintenance and decommissioning. The design should not be unnecessarily complex, to minimise construction costs and facilitate maintenance and ultimate decommissioning
• Future site development plans. Often the operational lifetime of a borehole is limited by site development rather than by degradation. If a borehole will become inaccessible during site development/decommissioning, it will be necessary to plan to decommission the borehole while access is still possible
• Drilling method. The choice of drilling method should be informed by the subsurface geology. The suitability of different methods (e.g. cable tool, rotary, sonic, direct push & auger) varies depending on the firmness or density of the rock/soil and whether gravel, cobbles and/or boulders are present. Some techniques are inappropriate for use in certain types of strata, while others may be suitable but not ideal. In addition, sensitivity of nearby structures to vibration may have a bearing on the drilling method adopted
• Drilling diameter. The drilling diameter needs to be sufficiently large to enable reliable sealing of the annular gap with any installation. For guidance, see for example [31])
• Installed casing diameter and material. The internal diameter of the installation (screen and casing) needs to be large enough to accommodate the proposed sampling equipment, and should include a margin to allow the casing to kink over time. However, to minimise purging, should this sampling approach be taken (see Section 7.3), the diameter should not be excessive. Care should be taken in the choice of materials, as they will need to survive the planned lifespan of the installation and be compatible with potential contaminants of concern and the natural groundwater composition. Refer to BS ISO 5667-22 for further discussion
• Probable contaminant concentrations and the potential for encountering non-aqueous phase liquids (NAPLs). This will enable any special design requirements or precautions during construction to be specified
• Type of installation. Sampling in a borehole can take place either from a single depth or at multiple depths by use of nested or multi-level installations. Refer to Section 4.4 and Table 4 of BS ISO 5667-22 for further discussion
o The design of a typical groundwater monitoring point is a single short-screened monitoring borehole targeted to sample a specific depth in the groundwater body. Longer screens can be used, but care must be taken to minimise vertical flows (see below). Clusters of single short-screened monitoring boreholes can be used to obtain information from different depths at a single location. However, it is essential that each installation is designed such that the required purge/sample volumes can be obtained
o In general, no more than two nested installations should be used in a single borehole. Care and close supervision is needed to ensure seals

NIGLQ Nuclear Industry Code of Practice for Routine Water Quality Monitoring Page 29
between screened sections are effective, to avoid cross-contamination through the annular space. Notwithstanding this, there may be ambiguity in the interpretation of sampling results due to (possibly unfounded) concerns about cross-contamination. For this reason, nested boreholes should only be used after careful consideration
o Multi-level borehole sampling installations may be used to target specific depth intervals where there is a need to more precisely map the vertical distribution of contaminants. These types of installations are discussed in reference [32]. They should only ever be constructed using specialist advisors and contractors familiar in their installation. There may be limitations in the types of sampling and testing that can be done inside such installations
• Possibility of artesian flow conditions. Artesian conditions can cause problems when drilling, especially in terms of water management. They also require specially designed borehole headworks
• Possibility of tidal fluctuation of the groundwater level. Tidal fluctuations, which will cause twice-daily ingress/egress of water through the screen and filter pack, can potentially cause accelerated siltation
• Potential for the spread of contamination through the borehole. The monitoring interval should be chosen to minimise or eliminate vertical flows. The principal issue is the length of the filter pack and its location relative to hydrogeological units and rock types intersecting the borehole wall. Most importantly the filter pack should not be such that two aquifer units are interconnected. Specific guidance is given in Section 4.4.2 of BS-ISO 5667-22
• Screen and filter pack selection. Siltation can be the biggest single problem in the long-term maintenance of some groundwater monitoring points. The filter pack and screen are designed to minimise the ingress of fine particles to the monitoring point, whilst not clogging up the filter pack such as to restrict ingress of groundwater. The size of openings in the screen and filter pack should be appropriate to the particle size in the subsurface soil/rock
• Geotextile Wrap. It is preferable not to use a geotextile wrap, as it can be blocked by small particles and/or by biofouling. However, it may be a necessary filter in some fine-grained formations
• Landfill Gas/Radon/VOCs7. If there is the potential for gas build up (for example if the borehole is located on or near a landfill or in an area where there is the potential for gas production through biodegradation of organic materials in the ground), consideration should be given to installing the borehole with a vent or gas sampling valve. A vent should be used if hydrometric measurements are being made using down-hole loggers. A gas sampling valve may also be useful to enable sampling/’sniffing’ if elevated radon or VOC concentrations might be present
• Headworks. Borehole headworks protect the borehole and facilitate access for sampling and maintenance. The headworks should prevent unwanted access to the borehole, protect the borehole from the elements (especially entry of water) and from surface activities, allow for deployment and/or storage of monitoring equipment and be clearly and securely labelled. Headworks may be flush with the ground surface or upstanding. If flush with the ground surface, the design should
7 Note that monitoring of ground gases is not within the scope of this NICoP.

NIGLQ Nuclear Industry Code of Practice for Routine Water Quality Monitoring Page 30
be appropriate to anticipated loads, such as from traffic, and should ensure that entry of surface water into the installation is prevented. A potential problem with ground-flush headworks is the parking of vehicles or equipment over the sampling point, preventing access when required
• Record keeping & data management. All records relating to borehole construction should be retained. As a minimum, for new boreholes this should include:
o Surveyed position (x, y & z coordinates)
o Borehole log (including position of any water strikes and total depth)
o ‘As drilled’ report from drilling contractors
o ‘As drilled’ records of sampling and field indications of contamination
o Length and depth of groundwater monitoring point(s), including details of screen, filter pack and any geotextile membrane
o Photographs taken during and after installation
o Datum point for water level measurements
o Record of borehole development
All depths to water (which are recorded as metres below the datum point) should also be recorded as elevations (m OD)
Borehole numbering should be unique and permanent. For those boreholes with multiple groundwater monitoring points, numbering of groundwater monitoring points in new boreholes should be consistent (e.g. P1 being the closest to surface)
• Video surveys. If practicable, a borehole video survey should be undertaken after completion of the installation to provide a baseline record of down-hole conditions. Subsequent borehole surveys should be carried out if a problem is suspected or identified; for example, if monitoring results become anomalous.
When drilling in potentially contaminated ground it is important that:
• Suitable arrangements are in place for working in potentially contaminated areas (Method Statement, Work Safety Plan etc.)
• Appropriate workplace monitoring is carried out during construction, both to ensure worker safety and to enable contaminants to be identified, thereby allowing an appropriate drilling approach (e.g. staged casing) and optimum screen location
• The drilling approach minimises the potential for the spread of contamination during borehole construction.
4.2.2 Cross-contamination through the borehole
Vertical flows within the borehole screen can occur where the screened section includes two or more permeable intervals separated by lower permeability strata. Potential impacts include cross-contamination between the permeable units and the inability to collect good quality water quality samples. For example, see discussion of flows in [33]. These effects add biases and uncertainty to the interpretation of sample origin and in-situ concentrations in the groundwater body. A properly constructed groundwater monitoring point will monitor a single water-bearing unit, and therefore cannot cause cross-contamination.

NIGLQ Nuclear Industry Code of Practice for Routine Water Quality Monitoring Page 31
The consequences of cross-contamination through an inappropriately completed borehole may include the following:
• Increased environmental impact, due to contamination of a larger volume of groundwater
• Increased financial liability, for example if remediation is subsequently required
• Increased risk to receptors and potential for affecting additional receptors
• Breach of legislation, such as water resources protection legislation, and potential for prosecution
• Poor quality samples that are not representative of a single water-bearing unit
• Distortion of groundwater levels in both water-bearing units, leading to uncertainties concerning the CSM.
Inadvertent groundwater contamination from the surface may result from poor borehole design and/or maintenance, for example through inadequate sealing of headworks against ingress of contaminated surface water or spilled contaminative liquids. Ingress of clean surface water can render groundwater quality data invalid by displacing contaminated groundwater from the environs of the monitoring point.
4.2.3 Are existing monitoring points suitable?
The design of existing monitoring points should be evaluated against the objectives of the monitoring programme and current good practice standards. Techniques which can be used to establish the suitability of the design and to prioritise any unsuitable boreholes for decommissioning include:
• A predominantly qualitative approach where key issues are considered. This has the advantage that only the most important issues (such as potential for cross-flow of contaminated water) are considered
• A quantitative approach where a ‘Quality Score’ is assigned to each borehole based on a number of pre-defined criteria (Box 4.2). Whether or not to continue monitoring is determined by the Quality Score and comparison with potential alternative boreholes. An example of a form for calculating quality scores is given in Appendix 1.

NIGLQ Nuclear Industry Code of Practice for Routine Water Quality Monitoring Page 32
Headworks should be secured (i.e. locked) to prevent unauthorised access, vandalism or deliberate contamination.
Where existing boreholes do not conform to current good practice standards, the impact of these monitoring points on groundwater quality or provision of fit for purpose data should be evaluated. Ideally, all boreholes that do not conform to good practice should be decommissioned and replaced where necessary. This may not always be possible, where there are radiological or access constraints, or necessary. For example, a borehole may not meet good practice design but be within acceptable bounds of performance. In this case, some form of refurbishment may be appropriate. If boreholes that do not meet good practice are to be left in place and/or used for ongoing routine monitoring, the SLC should record the decision and its justification.
More Prescriptive Guidance. If boreholes that do not meet good practice are to be left in place and/or used for ongoing routine monitoring, the SLC should record the decision and its justification.
4.2.4 Maintenance & refurbishment
Groundwater monitoring boreholes should not, in general, require extensive maintenance. Maintenance of the headworks is likely to be the focus of attention in most cases. However, silting-up of the borehole can be a problem in some silt-rich formations. An example of a form used on a borehole maintenance programme is
Box 4.2: Quality Scoring Criteria for Groundwater Monitoring Points
Any scoring system should assess the monitoring point in the context of the CSM and against specific criteria relating to sample quality and the potential for spreading contamination.
Potential criteria include:
• Screen length. Guidance in BS ISO 5667-22 (2010) suggests that screens should not exceed 3m in length in most cases. Generally, this is a pass/fail criterion. There will however be situations where long-screen wells are necessary and these should be explained and justified.
• Screen position. That is, whether or not the screen connects more than one discrete water-bearing unit. A pass/fail criterion.
• Silt level in borehole. Silt should not substantially extend into the screened interval. Generally a relative score is given, based on the proportion of screen length that is silted up.
• Physical condition. Generally pass/fail.
• Potential for surface water ingress. Surface water ingress can lead to spread of contamination and/or dilution in the monitoring point. Generally pass/fail but can usually be resolved through maintenance of borehole headworks.
• Availability of ‘as constructed’ information. This includes borehole logs, screen length and position etc. Generally pass/fail but issues can be partly resolved by carrying out a monitoring well camera inspection.

NIGLQ Nuclear Industry Code of Practice for Routine Water Quality Monitoring Page 33
shown in Appendix 2. Common causes of borehole deterioration are shown in Box 4.3.
Box 4.3: Common Causes of Borehole Deterioration Type of Deterioration Cause
Sand/silt infiltration (may be inevitable in some formations, though geotextile wrap helps)
Poor screen/filter pack selection/installation
Screen corrosion
Insufficient well development
Collapse of filter pack
Loss of production/yield
Equipment failure
Area or regional water level decline
Biofouling or other clogging of filter and/or geotextile wrap
Well plugging
Well collapse
Precipitates/films on equipment
Deposition of dissolved solids
Biofouling
Corrosion of equipment Surface or groundwater chemistry (e.g. elevated salinity). In turn, perturbs water chemistry
Water chemistry perturbed Lack of end caps or headworks seals allows objects/animals/water to enter groundwater monitoring point
Structural Failure
Improper screen placement
Poor grout support
Site operations (e.g. redevelopment, traffic)
Ground settlement (e.g. on areas of fill)
Blockage by tree roots
Damage by vehicles to up-standing head-works
Borehole becomes insecure
Locking screws or other locking devices on headworks are lost
Locking screws or other locking devices on headworks are not used (e.g. because time-consuming to remove and replace)
Poor borehole maintenance can result in:
• Inability to obtain a groundwater sample, for example where the borehole is blocked or the screen has silted up
• Spread of contamination and misleading water quality results. See discussion in Section 4.2.2
• Errors in sample identification and subsequent interpretation, for example because identification labels are missing or degraded
• Errors in calculated groundwater elevations. The major cause is through damage to headworks, which results in unrecognised change in the datum point for water level monitoring.

NIGLQ Nuclear Industry Code of Practice for Routine Water Quality Monitoring Page 34
Regular condition surveys should be carried out to identify any maintenance requirements. For most monitoring points an annual survey would be appropriate; however, it is good practice to ensure that any defects are recorded, reported and subsequently corrected at each sampling visit. More regular surveys may be appropriate in some cases, such as where site works are being carried out nearby, where there are large numbers of vehicle movements over the headworks or where there may be significant consequences in the event of a defect.
Comparison of new data with historical data collected from the same monitoring point can be a useful indicator of problems. For example, a change in total depth of an installation may indicate a blockage or silting up. Increasing drawdown on sampling can indicate loss of efficiency. A summary of the previous round’s data can be included as part of sampling forms so that field technicians can identify specific problems (Chapter 7).
Borehole refurbishment is an extension to borehole maintenance. It is unlikely that refurbishment can overcome problems arising from an inappropriately completed monitoring point, unless taken to the extreme of reaming out the existing borehole. Rather refurbishment might involve:
• Replacement of headworks and/or near-surface casing
• Removal of collapsed material from an uncased borehole, such as that resulting from instability of the borehole wall
• Removal and replacement of faulty/stuck monitoring equipment
• Installation of new casing and screen within the existing installation (e.g. to reduce ingress of fines)
• Redevelopment using inertial pumps, air-lift pumps or bailers to remove silt
• Replacement of worn/deteriorated labelling.
A cost/benefit assessment may be required to consider whether refurbishment or decommissioning and replacement would be most appropriate.
4.2.5 Decommissioning
Reasons for decommissioning boreholes include:
• Unsuitable design
• Damage beyond repair
• Equipment irretrievably stuck in borehole
• No longer required as part of the monitoring programme
• Not compatible with future site works.
Where a borehole is to be decommissioned, consideration should be given to whether a replacement at or near to the current position is required. Changes in position may be necessary due to:
• Construction being scheduled in the current location
• Operating constraints, such as:
o Located on or near an essential roadway or emergency route
o Elevated external radiation dose from nearby facility

NIGLQ Nuclear Industry Code of Practice for Routine Water Quality Monitoring Page 35
o High sub-surface contaminant concentrations, which would necessitate significant additional measures during borehole construction to protect the workforce and prevent spread of contamination during drilling.
In such cases alternative positions which meet the objectives should be considered. However, it must be recognised that a monitoring borehole cannot be replaced in a ‘like for like’ manner by another borehole, albeit one located nearby. The replacement borehole should have a different, unique, identifier.
Guidance on borehole decommissioning is provided by both the EA [34] and SEPA [35]. Their guidance notes that each situation is different, and that this should be taken into account when specifying the decommissioning procedure. Decommissioning essentially comprises removal of headworks followed by backfilling to mimic local geology or backfilling with a low permeability material such as bentonite or cement. Removal of casing should be considered ‘where the casing has corroded or broken, or the grouting has failed’ [34]. The top of the backfilled borehole is then completed with an impermeable plug and cap such as concrete or bentonite grout to prevent ingress of potentially contaminated surface water or spills. The plug or cap should be positioned below ground level to accommodate the future use of the site. In all cases a record of the decommissioning should be made and kept (Chapter 9).
4.3 Potential pitfalls
Potential pitfalls in relation to the design and maintenance of water quality monitoring points are highlighted in Box 4.4.

NIGLQ Nuclear Industry Code of Practice for Routine Water Quality Monitoring Page 36
Box 4.4: Potential Pitfalls
Potential pitfalls relating to the design and maintenance of water quality monitoring points include:
• Not carrying out a full assessment of existing monitoring points.
• Errors made in the design process. For example:
o Borehole design results in cross-contamination
o Screen selection and filter pack design not optimised to minimise silting
o Failing to take into account potential for artesian conditions
o Inadequate headworks protection for long monitoring periods
o Inadequate allowance for traffic loadings when specifying headworks
o Borehole installation not deep enough to provide the required purge/sample volume
• Inadequate supervision of drilling contractors, especially during installation of monitoring points.
• Inconsistent labelling of multilevel or nested installations.
• Omitting to record sampling points in the site asset databases.
• Poor record keeping.
• Renumbering/re-labelling of monitoring points causing confusion.
• Losing keys to borehole headworks.
• Inadequate or no monitoring point maintenance programme. No planned budget or inadequate budget.
• Failing to decommission installations that are not fit for purpose or no longer required, leading to the potential for spread of contamination.

NIGLQ Nuclear Industry Code of Practice for Routine Water Quality Monitoring Page 37
5 Choosing the Analytical Suite
5.1 Introduction
Inputs that inform the selection of an analytical suite for a routine water quality monitoring programme include:
• Site characterisation and/or desk studies, which contribute to the development of the CSM
• Site baseline
• Regulatory requirements specified as part of site consents.
During characterisation monitoring, including defining the baseline, the analytical suite should encompass all PCoCs. The suite will typically be reduced for routine water quality monitoring to comprise only those determinands that are present at levels of concern and/or ‘indicator species’ such as gross alpha/beta activity, the presence of which at certain concentrations would trigger management actions including further investigation and analysis.
The process map for this chapter is presented in Box 5.2.
5.2 What contaminants are potentially present?
5.2.1 Radioactive contaminants
Most UK Nuclear Licensed Sites produce, store, use or process nuclear fuel, or have done so in the past. ‘Spent’ fuel (fuel no longer of use in sustaining a nuclear reaction) is typically stored under water in cooling ponds, usually located on the site where it was used, prior to reprocessing or a decision regarding long-term storage or disposal. Some waste materials produced from spent fuel (e.g. Fuel Element Debris) are also stored in water-filled waste silos or vaults.
Box 5.1: Roadmap – Chapter 5
Outline: This chapter provides guidance on choosing the monitoring analytical suite. It covers the main radioactive and non-radioactive contaminants, issues that affect contaminant mobility, measurement techniques and optimising the monitoring suite. This chapter contains substantial nuclear/radioactivity-specific content.
Aims: For the reader to understand:
� The types of contaminants commonly found in surface water and/or groundwater on nuclear sites.
� How their chemical characteristics affect transport in the water environment.
� How the analytical suite can be optimised. Navigation: Key sections for more experienced staff – Section 5.3 (reasons for
determining natural water chemistry), Section 5.4 (optimising the analytical schedule) and Section 5.6 (selection of appropriate limits of detection).

NIGLQ Nuclear Industry Code of Practice for Routine Water Quality Monitoring Page 38
Soluble fission products (nuclei which result from the fission of a larger atomic nucleus) and activation products (products of neutron capture by other materials) can be released into contacting waters and may be released to ground if any leaks or spills occur from containment facilities or during transport. Such leaks and spills have occurred in the past. Water may also have become contaminated as a result of accidents, such as the 1957 Windscale fire.
Although much of the radioactivity associated with these incidents has now decayed, low levels of some soluble longer-lived radionuclides are sometimes detected in water on and around nuclear sites. The most commonly detected radionuclides are H-3 and Sr-90, plus C-14, Cl-36, Tc-99 and/or Cs-137 at certain sites. None of these have long-lived decay products.

NIGLQ Nuclear Industry Code of Practice for Routine Water Quality Monitoring Page 39
Isotopes of uranium and other actinides such as americium and plutonium may be potential contaminants of concern on sites where nuclear fuel has been manufactured, used or processed, or where nuclear weapons have been assembled and maintained. For actinides other than uranium, low solubilities usually limit the extent to which they can migrate in surface water or groundwater.
An understanding of radionuclide mobility in the environment is important to define an appropriate analytical suite. The most relevant chemical properties are those concerned with element behaviours in aqueous solutions and their interactions with solid surfaces: solubility limitation, sorption and precipitation/co-precipitation. These are discussed in more detail in [36]. Geochemical behaviour of radionuclides commonly or occasionally detected in water on nuclear sites is summarised in Box 5.3. The box is sub-divided into ‘most commonly detected radionuclides’ (H-3 and Sr-90) and ‘radionuclides detected at some sites’ (C-14, Cl-36, Tc-99, Cs-137 and uranium isotopes). To understand the mobility of some radionuclides with more complex aqueous chemistry, it is necessary to determine some chemical properties of the water in which they occur. Nuclear properties such as half-life and mode of radioactive decay are presented in Box 5.7.
It is important to identify and assess any changes in water quality that, even if not of high significance in their own right, might indicate the potential for more significant deterioration of water quality in the future. For example, tritium is identified as an Indicator Parameter in the UK Drinking Water Regulations [37] in part because of its high mobility in groundwater; other radionuclides may also be present in the groundwater system but have not yet reached the monitoring point.

NIGLQ Nuclear Industry Code of Practice for Routine Water Quality Monitoring Page 40
Box 5.3: Geochemical behaviour of selected radionuclides dissolved in surface waters and shallow groundwater
Most commonly detected radionuclides
Tritium (H-3). Tritium in water most commonly occurs as part of the water molecule (HTO). As a result it is transported at the same rate as water, and is the most mobile of the radionuclides encountered on nuclear sites.
Strontium (Sr-90). Strontium is highly soluble and has a simple aqueous chemistry, occurring only as the Sr2+ ion. It is only moderately adsorbed onto mineral surfaces by ion exchange, and can also co-precipitate into carbonate- and sulphate-bearing minerals. It is moderately retarded in groundwater, generally travelling up to tens of times more slowly than groundwater. Retardation can be substantially reduced by greater salinity of groundwater due to cation competition for sorption sites.
Radionuclides detected at some sites
Carbon (C-14). Carbon in solution occurs as carbonate species and organic complexes, and is reactive in redox and biochemical transformations. Its inorganic speciation in solution is pH-sensitive. CO2 is only important below pH6. HCO3
- dominates between pH 6 and 10, with CO3
2- above pH 10. The mobility of C-14 depends on the fate of carbon in the surface water or shallow groundwater. Typically, it will be a relatively mobile contaminant.
Chlorine (Cl-36). Under the range of conditions considered, chlorine occurs in solution mainly as the chloride anion, Cl-, which is highly soluble and is very weakly sorbing or non-sorbing. As a consequence, it will migrate at a velocity close to that of the groundwater.
Technetium (Tc-99). Technetium has a complex aqueous chemistry, with solubility and sorption properties strongly influenced by the chemistry of the water in which it occurs. Under redox conditions typical of near-surface groundwaters it occurs in a highly soluble, very weakly sorbing anionic form, and migrates at a velocity close to that of the groundwater. Under more reducing conditions it occurs in a less soluble, highly sorbing cationic form which has very low mobility in groundwater.
Caesium (Cs-137). Caesium has a simple aqueous chemistry and occurs only as the Cs+ ion. It is highly soluble, but tends to be strongly adsorbed onto mineral surfaces. The sorbed Cs-137 may be non-exchangeable. Consequently it is strongly retarded in groundwater, generally travelling many tens or hundreds of times more slowly than groundwater.
Uranium (U-238, U-234, U-235). Uranium has a complex aqueous chemistry, with solubility strongly influenced by the chemistry of the water in which it is immersed. Under redox conditions typical of near-surface groundwaters it occurs in more soluble and mobile anionic forms, while under more reducing conditions it occurs in less soluble forms with lower mobility.

NIGLQ Nuclear Industry Code of Practice for Routine Water Quality Monitoring Page 41
5.2.2 Non-radioactive contaminants
A wide range of non-radioactive substances that can potentially contaminate water are used on nuclear sites. Some sites have an industrial or wartime history prior to their use by the nuclear industry, and ‘legacy’ contamination relating to pre-nuclear usage may be present. Examples of substances that are/were typically used in facilities on nuclear sites and which represent PCoCs with respect to water are shown in Box 5.4.
Box 5.4: Non-radioactive PCoCs on nuclear sites Facility Potential Contaminant of Concern
Heat and power equipment (e.g. boilers, generator houses) and associated fuel storage tanks
Hydrocarbons: diesel, petrol, kerosene, heating oils
Lubricated equipment (e.g. turbines, circulator motors)
Hydrocarbons (oils)
Electrical transformers, electrical cables
PCBs & PCB-contaminated oils
R&D facilities (e.g. laboratories and pilot-scale plants)
A range of solid/liquid inorganic and organic chemicals, including acids and alkalis.
Some pilot plants may have extensively used non-aqueous-phase liquids such as organic solvents (chlorinated hydrocarbons, BTEX compounds, tri-butyl phosphate /odourless kerosene) or mercury
Water treatment plants Flocculating agents and water purification chemicals including acids and alkalis for regenerating ion exchange resins
Disposal facilities Wide range of inorganic and organic chemicals including solvents, acids and alkalis
Incinerators, post-war burning grounds and fire training areas
Organic chemicals including PAHs, dioxins and fire-fighting chemicals
Chemical storage areas Wide range of inorganic and organic chemicals
Garages, workshops, maintenance buildings
Fuels, solvents and a wide range of other inorganic and organic chemicals
Historical Activities As above, with in certain cases the addition of explosives and Unexploded Ordnance (UXO)

NIGLQ Nuclear Industry Code of Practice for Routine Water Quality Monitoring Page 42
In addition to these primary substances, consideration must also be given to monitoring for the presence of potential breakdown or degradation products, such as from dehalogenation of chlorinated hydrocarbons or from breakdown of hydrocarbons. In certain cases these breakdown products may pose a greater environmental threat to water than the original contaminating material (e.g. vinyl chloride as a breakdown product of tetrachloroethene), particularly where Monitored Natural Attenuation (MNA) is considered as a remediation method. Further information on the use of MNA is provided by EA [38].
The chemical properties of key organic PCoCs in the water environment are given in Box 5.5. As with radionuclides, the migration behaviours of non-radioactive contaminants are strongly influenced by these properties and their interactions with solid surfaces.

NIGLQ Nuclear Industry Code of Practice for Routine Water Quality Monitoring Page 43
5.3 Reasons for determining natural water chemistry
Characterisation of natural water chemistry forms an important input to routine water quality monitoring, and involves determination of the main chemical constituents of the water (e.g. major cations [Ca, Mg, Na, K] and anions [HCO3 (alkalinity), Cl, SO4, NO3]), and other chemical parameters, including pH, dissolved oxygen, electrical conductivity etc. Natural water chemistry should be established as part of the baseline. Selected parameters should continue to be measured as part of routine
Box 5.5: Mobility in water – Key organic PCoCs
• Hydrocarbons. These compounds are formed from carbon and hydrogen only, and are most commonly present on nuclear sites as fuels: diesel, petrol, kerosene and heating oils. The solubility of commonly-occurring hydrocarbons is low and they typically form a separate light non-aqueous phase liquid (LNAPL). In the sub-surface, LNAPL moves downwards under the influence of gravity and capillary forces. When the retention capacity of the soil is exceeded, LNAPL will accumulate on the surface of the water table, potentially spreading laterally in directions not controlled by the hydraulic gradient. Where the groundwater table fluctuates, LNAPL is generally smeared over this zone. Depending on the driving head, LNAPL can also penetrate below the water table. Portions of the lighter fractions of the free phase and any soluble additives such as MTBE will dissolve and migrate with the flowing groundwater. The transport and fate of DNAPLs in the sub-surface is described in [i].
The breakthrough of hydrocarbons at a monitoring point may be preceded by a reduction in dissolved oxygen and nitrate, and an increase in alkalinity, as part of hydrocarbon degradation [38]. These determinands can therefore act as indicators of hydrocarbon contamination.
• Chlorinated hydrocarbons. Chlorinated hydrocarbons are long-lived and relatively mobile contaminants in groundwater. In surface water, their high volatility means they are rapidly lost to atmosphere. The key physical and chemical properties that influence chlorinated hydrocarbon behaviour in groundwater are their high densities and low solubilities, which mean that a separate dense non-aqueous phase liquid (DNAPL) is often present. Where present, DNAPLs can sink below the water table and accumulate on the surface of finer-grained layers. The movement of DNAPL is complex, and dependent on the small-scale variability of the rocks and soils through which they move and on the topography of layers on which they accumulate; this latter effect means that they move independently of hydraulic gradient. The transport and fate of DNAPLs in the sub-surface is described in [ii]. This document is also relevant to DNAPLs other than those formed from chlorinated hydrocarbons.
i. CL:AIRE, An Illustrated Handbook of LNAPL Transport and Fate in the Subsurface, CL:AIRE, London, ISBN-978-1-905046-24-9, 2014
ii. Environment Agency, An Illustrated Handbook of DNAPL Transport and Fate in the Subsurface, Environment Agency R&D Publication 133, June 2003

NIGLQ Nuclear Industry Code of Practice for Routine Water Quality Monitoring Page 44
water quality monitoring as necessary to aid interpretation of contaminant concentrations.
Certain aspects of natural water chemistry, such as redox potential and ionic strength, influence the behaviour of some contaminants in the water environment. In addition, some aspects of water chemistry can be altered by degradation of organic contaminants, and can therefore act as indicators of the presence of contamination. For example, dissolved oxygen concentrations and the concentrations of reduced species of redox-sensitive elements such as Fe and Mn can be used as indicators of the degradation of organic contaminants, where the degradation process consumes oxygen. This may also be reflected in elevated HCO3 concentrations. Understanding spatial variations in natural water chemistry is also usually an important component of establishing the hydrogeological conceptual site model, which underpins the understanding of contamination migration in groundwater.
Temporal or spatial variations in water chemistry can also result from natural water mixing processes. For example, in a coastal environment, there will be a degree of mixing between saline water and freshwater, either directly or via sea spray. As a consequence, water chemistry can vary on different timescales, for example on a diurnal basis related to the tide or seasonally where there are higher amounts of wind-blown sea spray in winter months.
Mixing with saline water is relevant for routine water quality monitoring on some nuclear sites because potassium, a component of both shallow groundwater and saline water (through generally present in much higher concentrations in the latter), is naturally radioactive due to the presence of K-40, a beta/gamma-emitting radionuclide. The concentration of K-40 in water is controlled by natural potassium concentrations; it can be a major contributor to total beta activity in some waters, particularly saline waters. As deep groundwaters are generally not relevant to this NICoP, the main cause of elevated salinity will be proximity to the coast, which is of relevance to the majority of UK nuclear sites. Typical seawater contains 12 Bq/L K-40.
Given this, salinity (and ideally potassium) should be measured at least when establishing the baseline water quality at locations where water may be brackish or where saline waters are expected. During routine monitoring, it may be sufficient to monitor electrical conductivity as an indicator of salinity and therefore potassium.
It is important to understand the contribution of K-40 to total beta activity in water samples to prevent inaccurate conclusions about the presence of man-made radionuclides such as Sr-90 being drawn from gross beta activity measurements. The contribution from the seasonally varying input of potassium-rich agricultural fertilisers into surface waters should also be considered for the same reasons.
Natural water chemistry parameters should be measured during routine monitoring if they provide information on the behaviour of PCoCs. For example:
• pH, dissolved oxygen, and/or redox potential provide information on the speciation, and hence mobility, of certain radioactive contaminants. Examples are C-14 and Tc-99
• Electrical conductivity can be used as an indicator of natural background K-40 activity
• temporal and spatial changes in water chemistry provides understanding of changes in the extent and/or rate of degradation of organic contaminants. A

NIGLQ Nuclear Industry Code of Practice for Routine Water Quality Monitoring Page 45
typical suite of water chemistry analyses for a programme to evaluate degradative attenuation of organic contaminants is shown in Box 5.6.
Clearly, such measurements are not required if the PCoCs are not influenced by, or do not influence, natural water chemistry.
5.4 Optimising the analytical schedule
It is recommended that analysis is scheduled for all PCoCs in the early characterisation stages of monitoring, including setting the baseline. These results can then be used to inform the development of an analytical schedule or routine water quality monitoring.
Box 5.6: Typical analytical suite to determine potential for degradation of organic contaminants
There are three main attenuation mechanisms for organic contaminants, as identified in EA guidance [38]:
1. Aerobic degradation - transformation and/or elimination of an organic compound by micro-organisms in the presence of oxygen.
2. Anaerobic degradation - transformation and/or elimination of an organic compound by micro-organisms in the absence of oxygen. Compounds other than oxygen act as electron acceptors; for example, nitrate, manganese IV, iron III, sulphate and carbon dioxide.
3. Reductive dehalogenation - progressive removal of halogens from chlorinated hydrocarbons under anaerobic conditions.
Parameters that should be measured to demonstrate these natural attenuation processes are identified in EA guidance [38].
1 2 3
Concentration of parent contaminant √√ √√ √√ Concentrations of co-contaminants
1 √√
Concentration of daughter products √ √ √√ Dissolved oxygen √ √ √√ Total organic carbon (TOC) √ √ √√ Concentrations of electron acceptors
2 √ √ √√
Redox* √ √ √√ pH √ √ √√ Alkalinity √ √ √ Temperature √ √ √ Chloride √ √ √ Dissolved Hydrogen √ √ Notes
√√ Considered essential
√ Recommended 1 e.g. petroleum hydrocarbons or chlorinated solvents.
2 e.g. Fe(III), Mn(IV), NO3, SO4 CO2 (electron acceptors), Fe(II), Mn(II), NO2 &
N2, H2S, CH4 (metabolic by-products of redox reactions). * Alternatively one or more redox sensitive species, e.g. Fe, Mn, SO4 or NO3

NIGLQ Nuclear Industry Code of Practice for Routine Water Quality Monitoring Page 46
One potential approach to optimise the analytical programme for routine monitoring is the use of a tiered analytical schedule for those locations where data indicate that contaminants are now absent or at very low concentrations. The first tier involves screening analysis using ‘indicator’ compounds such as gross alpha and beta activities or Total Petroleum Hydrocarbons (TPH). This approach is cost- and resource-effective, with the potential to accelerate data acquisition through reducing turnaround times. There are, however, a number of potential difficulties which should be carefully considered in the context of the monitoring programme objectives. For example, end users are not always clear about what is being measured in screening analyses, and the indicator measurement can be dominated by natural background or anthropogenic contributions unrelated to the site. In other cases, screening techniques may be insufficiently sensitive or discriminatory. This is discussed further for radioactive PCoCs in Section 5.4.1 and for non-radioactive PCoCs in Section 5.4.2.
More Prescriptive Guidance: The use of screening measurements is recommended as part of routine water quality monitoring. However, if incorrectly interpreted, screening measurements may lead to inappropriate conclusions being drawn regarding the contamination status of the water environment. It is therefore important that the team interpreting the data are aware of the limitations of the screening measurements used.
5.4.1 Radioactive PCoCs
The main forms of radionuclide decay are alpha decay (emission of an alpha particle from the nucleus) and beta decay (emission of an electron or positron from the nucleus, or capture by the nucleus of an orbital electron). The nucleus may be left in an excited state as a result, with decay to ground state occurring through the emission of gamma radiation. The principal modes of formation, half-lives and decay modes of the main radionuclides of interest to groundwater monitoring are summarised in Box 5.7.

NIGLQ Nuclear Industry Code of Practice for Routine Water Quality Monitoring Page 47
The higher solubility of some beta-emitting radionuclides such as K-40, Sr-90, Tc-99 and Cs-137 means that the total activity of beta-emitting radionuclides in both uncontaminated and radioactively contaminated water is typically higher than that of alpha-emitting radionuclides.
Screening analyses for some of these radionuclides can be carried out through the measurement of gross alpha and gross beta activity, with the results being used during routine monitoring to decide whether more detailed second tier analysis for relevant specific radionuclides should take place8. Use of this approach needs to be justified following adequate baseline characterisation to confirm that the screening measurements are capable of detecting changes in contamination by the radionuclide(s) of concern. If this is not the case, it may be that such screening measurements are not useful in routine monitoring.
When characterising the baseline, detailed analysis for specific radionuclides should always be undertaken where gross alpha or gross beta activity is above the natural background and the cause of the elevated gross activity is not known or is uncertain. Detailed analysis for specific radionuclides should also be undertaken where the CSM indicates potential presence of radionuclide(s) of concern below typical background levels of gross alpha or gross beta activity, or which would not be detected by a screening analysis (e.g. H-3).
For gross alpha and gross beta screening analyses, there may be differences between reported values of gross activity depending on the analytical technique employed. Gross alpha activity should be relatively consistent regardless of method,
8 ‘Total gamma’ measurement is possible but is seldom used due to the ease of carrying out
quantitative gamma spectrometry.
Box 5.7: Main radiological properties of commonly-occurring radionuclides dissolved in water
Radionuclide Principal mode of formation
Half-life Major decay
H-3 Activation 12.3 years Beta*
C-14 Activation 5,730 years Beta*
Cl-36 Activation 301,000 years Beta
K-40 Natural 1.2 109 years Beta/gamma
Sr-90, Y-90 Fission 28.8 years, 2.7 days Beta
Tc-99 Fission 2.1 105 years Beta
Cs-134 Activation of a fission product
2.1 years Beta/gamma
Cs-137, Ba-137m Fission 30.1 years, 2.5 minutes Beta/gamma
U-234 Natural 2.5 105 years Alpha
U-235 Natural 7.0 108 years Alpha/gamma
U-238 Natural 4.5 109 years Alpha
Notes: Y-90 and Ba-137m are the short-lived daughters of Sr-90 and Cs-137. They are generally in equilibrium with their parents *H-3 and C-14 lack beta particle energies sufficient to be detectable using gross beta screening measurements.

NIGLQ Nuclear Industry Code of Practice for Routine Water Quality Monitoring Page 48
but gross beta activity can vary considerably. Measured gross beta activities are also dependent on the calibration nuclide: see below.
There are a number of different gross beta analytical techniques, which are summarised in Box 5.8. The most commonly used technique for determining gross beta activity in water samples is gas proportional counting. It is insensitive to low energy (‘soft’) beta particles such as those emitted from H-3, C-14 and Pu-241. The sample is also evaporated to dryness for gas counting, so volatile radionuclides are lost. For ‘soft beta’-emitting radionuclides, gross beta counting using liquid scintillation counting would be required; however, this technique has reduced counting efficiency for higher energy beta particles. If Sr-90 and Y-90 are known to be the dominant beta emitters in the water, then Cherenkov counting is a suitable technique. Guidance on appropriate screening techniques should be sought from the analytical testing laboratory.
Some limitations are inherent with screening methods for gross alpha and gross beta activities.
• As shown from Box 5.8, there are a number of different approaches to measuring gross beta activity in water. Different screening techniques have different sensitivities towards beta-emitting radionuclides. This must be understood when selecting an appropriate screening technique and when interpreting results. For example, if gas proportional counting is employed as the gross beta screening technique, it is usual to also analyse separately for H-3, a commonly-occurring
Box 5.8: Gross beta analytical techniques for water samples
• Gas Proportional Counting uses the fact that particles produced by radioactive decay ionize gas atoms or molecules in the detector, with the resulting electrons and ions formed creating a measurable current flow. Proportional counters allow the discrimination of alpha and beta particles, but are insensitive to low energy (‘soft’) beta particles. It is suitable for the detection of Sr-90 and Cs-137. This is the most widely used method for gross beta counting in both the UK and USA.
• Liquid Scintillation Counting (LSC) uses the measurement of light emitted from an organic material (a scintillator) when the molecules are excited by beta particles. The prepared sample in liquid form is mixed with a solvent containing the scintillator and placed in a darkened enclosure where light emissions are measured by photomultiplier tubes. Liquid scintillation counting has higher sensitivity to low energy (‘soft’) beta particles, and has reduced counting efficiency for higher energy beta particles.
• Cherenkov Counting. High-energy beta emitters, such as yttrium-90 (the daughter of strontium-90) and potassium-40 in water can be counted in a liquid scintillation counter without the scintillator. The Cherenkov radiation is detected directly by the photomultiplier tubes in the LSC. No sample preparation is needed for this technique, which is generally used for screening of high energy beta emitters. Y-90 takes several days to grow in with a water sample; Y-90 is strongly sorbed on geological materials and generally will not be present in a groundwater sample ‘as collected’.

NIGLQ Nuclear Industry Code of Practice for Routine Water Quality Monitoring Page 49
radioactive contaminant in water that is not detectable by gas proportional counting.
• Gross alpha/beta measurements will not differentiate between naturally occurring and man-made radionuclides. For example, K-40 can be a major contributor to gross beta activity in some waters. This leads to two possible interpretation errors. Firstly, minor variations in natural water chemistry have the potential to be interpreted as relating to anthropogenic contributions. Second, anthropogenic contributions to gross beta measurement may be overlooked as a result of being masked by K-40.
• The specific activity of natural potassium is approximately 30.9 Bq/g. In seawater, this results in a natural background concentration of approximately 12 Bq/L. Information on potassium concentration in the water will enable the contribution of K-40 towards the gross beta activity to be determined, and will allow appropriate conclusions to be drawn regarding the presence of man-made beta-emitting radionuclides. The typically high LoD for K-40 by gamma spectrometry means that analysis of elemental potassium is typically needed for this purpose, at least at the baseline characterisation stage.
• It is highly unlikely that plutonium isotopes will be present in water at sufficiently high concentrations to distinguish them from naturally occurring alpha-emitting radionuclides from the U-235, U-238 and Th-232 decay chains using gross alpha analysis. Specific radiochemical analysis is required to quantify Pu isotopes in water. The detection limit is 2-3 orders of magnitude better than that for gross alpha analysis.
• The gross activity (Bq/L) reported by a screening technique is determined by calibration against a specific radionuclide. For gross beta, typical calibration radionuclides are K-40 and Cs-137, which have significantly different beta emission energies. Unless the calibration radionuclide is the only radionuclide in the sample, the activity reported by gross beta analysis will not equal the sum of the activities of all beta-emitting radionuclides in the sample. When comparing datasets obtained using the same screening technique, it is necessary to ensure that the same calibration radionuclide has been used for both datasets. If this is not the case, guidance should be sought from the analytical testing laboratory regarding the nuclide-specific correction factor to be used to recalculate gross activity.
The scope of the radiochemical analytical schedule will be determined by the nature of the contaminants present and the outcome of gross alpha and gross beta screening analysis. Detection limits (and implications for sample volumes and counting time) should be linked to monitoring objectives and assessment values. In addition, potential loss of volatile radioactive PCoCs during sample preparation may need to be considered (e.g. loss of C-14 following acidification of water samples). Specific advice should be sought from the testing laboratory if analysis of potentially volatile radionuclides is required.
5.4.2 Non-radioactive PCoCs
For non-radioactive PCoCs, laboratory screening analyses are applicable to classes of organic contaminants such as hydrocarbons. An unexpectedly high result should prompt additional analysis and speciation. As with screening analyses for radionuclides, it is important to understand what is being measured and what the associated limitations are. A lack of understanding may lead to inappropriate

NIGLQ Nuclear Industry Code of Practice for Routine Water Quality Monitoring Page 50
comparison with other analyses and with risk-based assessment values. It is important to appreciate that screening measurements consider a broad range of chemicals within a specific class, and that individual compounds captured by a screening measurement may vary significantly in toxicity and risk level. For example, if Gasoline Range Organics (GRO) are suspected or present when using TPH as a screening measurement, then BTEX (benzene, toluene, ethylbenzene, xylene) should be evaluated in addition to TPH, and TPH speciation considered. It also should be noted that these are methods, not chemical descriptions; the GRO method will respond to chlorinated solvents as well as petroleum hydrocarbons, and the TPH method responds to a very wide range of chemicals other than petroleum hydrocarbons. Further information on TPH screening analysis is given by the Environment Agency [39] and the United States TPH Criteria Working Group [40], and advice should be sought from the analytical laboratory.
Examples of screening analyses are given in Box 5.9.
5.5 Selecting the analytical laboratory
Samples from routine water quality monitoring programmes should be analysed by experienced testing laboratories that undertake analysis of environmental samples. The chosen laboratory should be certified to BS EN ISO 9001 and 17025, in addition to being capable of meeting the specific monitoring objectives. For such UK laboratories, it is preferable that they are accredited by UKAS (United Kingdom Accreditation Service). UKAS carry out regular audits on analytical laboratories to ensure the required standards are being met and this provides the site with reassurance with regards to the standard of the data being supplied. However, the UKAS process does not check the accuracy of results. If an overseas testing
Box 5.9: Screening analyses for non-radioactive contaminants
• Hydrocarbons: A number of different analyses are available. Common measurements include TPH, GRO, DRO and banded speciated hydrocarbons. For risk-based assessment a combined indicator and fraction approach is most appropriate, with indicator compounds based on the most toxic and prevalent compounds, and fractions identified on the basis of fate and transport considerations.
• PAH: The UK drinking water standard for four specified PAHs is 0.1 µg/L, related to the carcinogenicity of benzo[a]pyrene. ‘Total’ PAH is commonly reported as USEPA16, which comprises the sum of 16 particular PAHs as identified by the US EPA.
• PCB: Total PCB measurements commonly comprise seven PCB congeners. The UK Drinking Water Standard for PCBs is 0.1 µg/L, significantly higher than typical detection limits for Total PCB analysis, and as such there is little added benefit in more detailed analysis.
• Heavy/toxic metals: Measurement of heavy/toxic metals by ICP-OES or ICP-MS (for example) is relatively simple and inexpensive, and so screening analyses are not necessary. Note that ICP-OES is not capable of quantifying down to drinking water limits for all metals.

NIGLQ Nuclear Industry Code of Practice for Routine Water Quality Monitoring Page 51
laboratory is to be considered, it will be necessary to confirm that the quality assurance (QA) standards and accreditation are suitable.
The analytical testing laboratory should have written procedures and performance specifications for the required analyses, which should be undertaken to limits of detection appropriate for environmental samples. In the UK, methods for all common determinands in water samples should be accredited by UKAS. Some methods for less common determinands may be unaccredited because of the small numbers of analyses undertaken.
Some nuclear sites use unaccredited on-site analytical testing laboratories for some routine water quality analyses. Only laboratories that are set up to undertake analysis to environmental levels should be considered for such work, and then only if the site is able to demonstrate that results are to an acceptable quality through regular cross-comparison with a UKAS-accredited laboratory. The use of on-site analytical laboratories for screening water samples before dispatch from site is discussed in Section 8.5. Such screening analyses are additional to, not instead of, analysis discussed in this Chapter.
In England and Wales, the EA sets Monitoring Performance Standards under MCERTS9 for statutory (compliance) monitoring, which Site Licence Companies can use to ensure that the monitoring data supplied meets regulatory requirements. As of 2014, MCERTS is limited to non-radioactive pollutants/contaminants. It is good practice to apply relevant MCERTS Monitoring Performance Standards to water quality monitoring that is not part of a statutory programme.
5.6 Limits of detection
The Limit of Detection (LoD) relates to the concentration of a compound or substance which can be detected reliably but not necessarily accurately quantified, and is based on the observation that measurement uncertainty rises as the LoD is approached. The limit of quantification is typically 3-5 times the LoD.
Monitoring objectives should be considered when setting LoDs, and appropriately qualified and experienced people (e.g. from the analytical testing laboratory) consulted. The aim is that any contaminant concentrations of potential significance should be detectable (i.e. > LoD). The work undertaken prior to the start of routine water quality monitoring will have identified appropriate assessment values (see Section 10.3); these should not be exceeded by the LoDs.
Recently, some problems have occurred where assessment levels produced using risk-based quantitative techniques have led to unachievable LoDs being required. This has been acknowledged by the Environment Agency [64], who have stated that they are aware that certain assessment values (Minimum Reporting Values; MRV) cannot reasonably be achieved by many laboratories. This notwithstanding, the drive towards lower LoDs is likely to continue for those substances considered harmful to the environment, and SLCs should consider this when setting LoDs for routine monitoring programmes.
EURATOM [41] requires LoDs for radionuclides in drinking water:
• H-3 & Radon: 10% of parametric value of 100 Bq/L (i.e. 10 Bq/L)
9 MCERTS is the EA’s monitoring certification scheme, which provides a framework to
meet the EA’s quality requirements.

NIGLQ Nuclear Industry Code of Practice for Routine Water Quality Monitoring Page 52
• Gross alpha and gross beta: 40% of screening values of 0.1 Bq/L and 1.0 Bq/L (i.e. 0.04 Bq/L and 0.4 Bq/L respectively)
Drinking Water Inspectorate (DWI) advice for England [42] and Wales [43] is that for the purposes of determining radionuclide content of drinking water the detection limit should be below 20% of the relevant reference concentration.
Further information on LoD and similar terminology used to describe the accuracy of results is given in Currie [44] and in ISO 11929:2009 [45].
5.7 Potential Pitfalls
Potential pitfalls in relation to selecting an analytical suite are highlighted in Box 5.10.
Box 5.10: Potential pitfalls
Potential pitfalls which may be encountered when selecting an analytical suite include:
• Inadequate characterisation of natural water chemistry during characterisation monitoring
• Inadequate CSM that does not identify all PCoCs or misidentifies PCoCs
• Use of screening measurements prior to adequate baseline characterisation
• Not rationalising the analytical suite once baseline characterisation has been achieved
• Failure to discuss the programme with a suitably qualified analyst
• Specification of inappropriate LoDs or inappropriate technique
• Failing to take into account natural water chemistry when interpreting results for indicator parameters (e.g. gross beta activity)
• Use of on-site laboratories and analytical methods that are designed for generating data for coarse screening or trending purposes rather than quantitative assessment
• Use of unaccredited on-site laboratories without being able to demonstrate that results are to an acceptable quality through regular cross-comparison with a UKAS-accredited laboratory

NIGLQ Nuclear Industry Code of Practice for Routine Water Quality Monitoring Page 53
6 Choosing the Frequency & Duration of Monitoring
Once an appropriate monitoring network is designed and the analytical suite chosen, a decision must be made on the frequency at which each point should be monitored. As with other aspects of the monitoring programme, the monitoring frequency should be developed by suitably qualified and experienced staff, and should be regularly reviewed and modified as appropriate.
This chapter reviews factors associated with temporal variation, sensitivity of water bodies, groundwater travel times and other aspects which may inform the choice of monitoring frequency. Guidance on choosing an appropriate monitoring frequency is then given. The choice of monitoring frequency will be a function of a number of factors, including the potential residence times of contaminants in the water body, the likelihood of the water body being affected by site activities and perceived and actual risks to receptors. The duration of monitoring is also considered in relation to the monitoring objectives.
The early stages of monitoring (characterisation monitoring: see Section 2.2) should be undertaken at a relatively high frequency and incorporate a broad suite of determinands. This will ensure that sufficient data are collected to develop the CSM and to establish baseline conditions. Commonly there will be a subsequent reduction in the scale and frequency of monitoring once the routine water quality monitoring phase commences.
A transition from characterisation to routine monitoring can be achieved by:
• Developing the CSM to a level where an adequate understanding of the groundwater and surface water regimes in relation to PCoCs can be demonstrated
• Assessing risks to receptors through identification of sources, pathways, receptors and potential pollutant linkages
• Refining the sampling and analysis plan based on the above.
The process map for this chapter is shown in Box 6.2.
Box 6.1: Roadmap – Chapter 6
Outline: This chapter describes the factors that affect sampling frequency, and provides guidance on choosing the frequency and duration of monitoring. The information in this chapter does not contain much nuclear- or radioactivity-specific content
Aims: For the reader to understand the interaction between the development & refinement of the CSM and the frequency and duration of monitoring as a whole and at specific locations
Navigation: Key sections for more experienced staff – Table 6.1 (factors influencing monitoring frequency) and Section 6.4 (monitoring duration).

NIGLQ Nuclear Industry Code of Practice for Routine Water Quality Monitoring Page 54
6.1 Influence of external factors
Natural processes and events can cause variations in contaminant concentrations on a variety of timescales, although long-term trends are rare. Variations caused by these external factors can be subdivided into the following types:
• Diurnal variations. In coastal areas, tidal effects result in variations in water levels and variable proportions of saline and freshwater in surface waters and groundwater10. Freshwater bodies may also show marked diurnal fluctuation in some aspects of water quality (e.g. pH) in summer due to photosynthesis
• Multi-day variations. The most important variations relevant to this NICoP are those that occur in response to storm events. In surface water these cause large increases in flow (and therefore dilution), but may also result in flooding and mobilisation of contaminants. Rapid changes in groundwater level can also result in corresponding variations in water quality.
10
The impact of tidal variations on groundwater levels and/or groundwater quality will depend on the hydrogeological properties of the rocks through which groundwater flows. In particular, contaminant concentrations in groundwater may only fluctuate very close to the point at which the groundwater discharges into the sea. The impact of tidal variations on surface water quality and levels are likely to be felt over greater distances; water quality will be influenced by the mixing characteristics of freshwater bodies as they enter the sea.

NIGLQ Nuclear Industry Code of Practice for Routine Water Quality Monitoring Page 55
• Seasonal variations. Seasonally-varying recharge to groundwater bodies can result in changes in groundwater level and also in groundwater quality. The latter can result from the periodic flushing of contaminants in the zone of water table fluctuation (e.g. LNAPL smear zones), variable dilution of contaminants in down-gradient plumes, and variation in groundwater flow direction. Changes in surface water quality can occur due to seasonally-varying flows and consequent variable dilution and dispersion.
• Variations over several years. These can occur as a result of longer-term changes in weather. For example, droughts or wet periods can influence groundwater levels over periods of several years, with consequences for water quality as described above.
An example of typical seasonal variation in groundwater level and quality is shown in Figure 2.
Figure 2 Example of Natural Seasonal Variation
The importance of these external factors on surface water or groundwater will be site-specific. The chosen monitoring frequency should take them into account to provide a representative dataset.
To capture basic seasonal changes, site-wide routine water level monitoring should take place at least twice a year, targeting when groundwater ‘highstand’ and ‘lowstand’ are expected. Twice yearly level monitoring would be adequate only where the behaviour is well-understood. If annual fluctuation is merely suspected, or the typical timings of groundwater ‘highstand’ and ‘lowstand’ are not known, more frequent site-wide baseline characterisation monitoring would first be required. Each round of site-wide water level monitoring should take place over a relatively short time period to minimise the effects of time-dependent changes.

NIGLQ Nuclear Industry Code of Practice for Routine Water Quality Monitoring Page 56
More Prescriptive Guidance: To capture basic seasonal (annual) changes, site-wide routine water level monitoring should take place at least twice a year.
Automatic water level monitoring of at least one typical groundwater monitoring point (calibrated against occasional manual measurements) should be carried out to obtain a high quality time series hydrograph over a period long enough to capture typical seasonal variations. The period may need to be for longer than 12 months if unusual weather patterns occur during the monitoring period, and it may be useful to maintain at least one continuous automated long-term groundwater record on a site for the duration of routine groundwater quality monitoring. These data can be used in conjunction with water quality data to evaluate the impact of seasonal effects on water quality and improve the CSM.
More Prescriptive Guidance: Automatic monitoring of at least one typical groundwater monitoring point should be carried out to obtain a high quality time series hydrograph over a period long enough to capture typical seasonal variations.
If any groundwater pumping schemes are in operation on or adjacent to the site (for example as part of a remediation project), higher frequency monitoring may be required to monitor performance of the groundwater pumping scheme and optimise its efficiency. Any ‘extreme’ weather events (e.g. resulting in site flooding) may also justify additional measurement to understand the possible effect on contaminant transport.
6.2 Influence of Water Pathway Characteristics
The physical characteristics of water bodies strongly influence the choice of monitoring frequency, in particular with regard to contaminant transport. As the characteristics of surface water and groundwater bodies are significantly different, the two types are considered separately.
6.2.1 Surface Water
In flowing water (e.g. rivers and streams) travel times are rapid and residence times for most contaminants will be short. There may therefore be considerable temporal variation in water quality. In such situations it will not be possible to manually sample the full range of water quality conditions. Automatic monitoring of water levels (e.g. using a datalogger to measure at 15 minute intervals) and automatic monitoring or continuous collection of samples for field chemical parameters such as pH and electrical conductivity should be considered as this can help inform water quality results obtained from manual sampling. As a minimum, surface water level measurements should be undertaken whenever a water quality sample is taken, so that the hydrological context of the sample is recorded.
In natural flowing water, water quality sampling should be undertaken at sufficient frequency (typically monthly or quarterly) to ensure that the effects of variability in flow on water quality are accounted for in time series data. Sampling at lower frequencies is not recommended for water bodies considered to be at risk from site activities, because of the possibility that contaminating events may be missed and because natural factors such as seasonality will not be captured. Monthly monitoring provides a reasonable default frequency, and is the frequency typically used by regulators to assess natural water quality. It provides, in the longer-term, a reasonable dataset for statistical analysis of trends.
In static water bodies such as lakes and ponds, conditions change more slowly and are less variable than in streams and rivers. Quarterly water quality sampling and

NIGLQ Nuclear Industry Code of Practice for Routine Water Quality Monitoring Page 57
water level monitoring is justifiable in these environments, although the potential for stratification and over-turn should be considered. Continuous water level monitoring is of less use in relation to water quality monitoring in these environments.
Lower sampling frequencies are possible in the cases of ephemeral water bodies (e.g. springs, wetlands, bogs etc), in water bodies that have been shown to be free of contamination and at very low risk of future contamination. Note that sampling of marine waters is specifically excluded from the scope of this document.
6.2.2 Groundwater
The CSM should include a description of the hydrogeological environment at the site, subdividing the rocks and soils into a series of hydrogeological units. These units are distinguished from one another on the basis of properties such as permeability and porosity, the nature of the channels through which groundwater flows (fractures or rock matrix), the groundwater flow pattern within the unit and the degree of hydraulic connectivity with adjacent units.
The principal characteristics of the groundwater body that influence the frequency of monitoring are:
• Estimated groundwater velocities and transit times from sources to monitoring points and to the site boundary, which should be calculated using the CSM
• Estimated contaminant velocities and transit times from sources to monitoring points and to the site boundary. The extent to which contaminant velocity is reduced relative to that of the groundwater is controlled by the strength of sorption of the contaminant onto the surfaces of the rock or soil [36]. Some contaminants, such as H-3 in tritiated water, will migrate at or close to the groundwater velocity; others, such as Cs-137, will migrate much more slowly. See Box 5.3 for further discussion. Monitoring frequency in a borehole should be based on an evaluation of the most mobile contaminant; however, it is not necessary to analyse for all PCoCs at the same frequency
• Contaminant concentrations, in particular whether they approach or exceed relevant water quality assessment values
• Whether the plume is expanding, stable or shrinking
• Groundwater vulnerability (i.e. the consequence of contamination from a given activity on the groundwater body), which is largely determined by the effectiveness of the unsaturated zone in containing surface-derived contaminants. Note, however, that on nuclear sites the construction of the facilities may have so disturbed the natural geology that the mapped aquifer vulnerability does not apply within the site boundary
• Groundwater sensitivity. Sensitivity is greater for productive aquifers (i.e. an economic resource on which any impact will be significant) and greatest in close proximity to sensitive receptors such as drinking water supplies and ecologically important wetlands
• Temporal variability in measured contaminant concentrations.
Notwithstanding the above, sampling frequency will need to meet any minimum requirements stipulated by the regulator.
From the above, it is evident that a given contaminant source could have different impacts on different groundwater bodies. As such there is no ‘one size fits all’

NIGLQ Nuclear Industry Code of Practice for Routine Water Quality Monitoring Page 58
approach to determining groundwater monitoring frequency. The frequency should be determined by suitably experienced staff on the basis of the monitoring objectives, the CSM, regulatory requirements and risk assessment. Box 6.3 provides guidance on how monitoring frequency is influenced by the factors discussed above.
More Prescriptive Guidance. The frequency of routine groundwater monitoring should be determined by suitably qualified and experienced staff on the basis of the monitoring objectives, the CSM, regulatory requirements and risk assessment.
Box 6.3: Summary of factors influencing groundwater sampling frequency
Factor
Influence on groundwater sampling frequency
Lower frequency indicated
Higher frequency indicated
Regulatory requirements Unregulated process Regulated process
Water body factors
Groundwater flux11
Lower Higher
Groundwater velocity12
Lower Higher
Variability in response to hydrogeological variations (seasonal & short-term)
Limited Large variations in water
quality
Groundwater vulnerability Lower Higher
Sensitivity of groundwater and groundwater dependent receptors
Lower Higher
Contaminant factors
Presence of contaminants Not present Present
Existing concentration of contaminants
Significantly below assessment values
Above or close to assessment values
Pollution potential Non hazardous substances
Hazardous pollutants, including radionuclides
Contaminant mobility Lower Higher
Contaminant persistence Lower Higher
Plume status Shrinking Expanding
Location Factors
Distance to specific receptors (e.g. water abstraction)
Distant Nearby
Distance from source Distant Nearby
Contaminant migration rates in groundwater mean that monitoring of groundwater at a frequency higher than monthly is rarely justifiable, unless the monitoring is for leak detection purposes. Monthly monitoring may be appropriate for the purposes of
11
Groundwater flux, Q = volumetric flow rate per unit area measured in the direction of flow 12
Velocity is proportional to Q divided by the porosity through which water flows

NIGLQ Nuclear Industry Code of Practice for Routine Water Quality Monitoring Page 59
characterisation, but the frequency should reduce as the CSM is developed and the routine monitoring programme matures. Groundwater monitoring programmes typically reduce to quarterly monitoring (every 3 months) or semi-annual monitoring (every 6 months) following the transition from characterisation monitoring and may reduce further, particularly where groundwater velocities are very low (e.g. groundwater travel times to the site boundary being measured in decades) or where monitoring has shown the risk to the receptor is low.
Annual or biennial (every two years) monitoring may be acceptable in the longer term. Even lower monitoring frequencies may be applicable where the risk is considered very low, where the rate of change is predicted to be very slow, or where the additional data provided will simply be used to supplement data from other points monitored at a higher frequency.
6.3 Intervention response time
The intervention response time should also be considered when selecting routine water quality monitoring frequency. Monitoring should be planned such that sufficient early warning can be given to put in place any actions specified in the responsive action plan, which is discussed further in Section 10.9. In considering response time, factors such as laboratory turnaround times, decision-making timescales and the nature and speed of implementation of any contingency actions need to be taken into account in addition to the actual monitoring frequency.
For flowing surface waters or groundwater flow in very permeable near-surface superficial deposits, the contaminant may have moved through the system by the time analytical results have been received from the routine monitoring programme. Such routine monitoring cannot provide an early warning in such circumstances, and can only provide reassurance (if no significant impact occurs) or data to subsequently assess the impact of the contamination.
6.4 Monitoring duration
6.4.1 Overall duration
The duration of the various elements of the routine monitoring programme (i.e. mapped onto the various requirements) will be informed by the programme objectives and context. Any monitoring programme will be subject to significant change at certain points in the site’s life-cycle, for example when moving to a care and maintenance phase. However, in general the scope can be expected to reduce over time as site operations cease and any remediation of contaminated land is undertaken. The monitoring programme effectively moves from one based on compliance and performance to one based on reassurance monitoring.
6.4.2 Duration at specific monitoring points
Monitoring objectives must be taken into account when considering whether to stop monitoring at individual locations. Monitoring at specific points may cease if:
• Monitoring objectives for that monitoring point have been fully achieved and/or the driver for monitoring no longer exists
• Access to the monitoring point is no longer possible or safe
• The monitoring point is found to be not fit for purpose.

NIGLQ Nuclear Industry Code of Practice for Routine Water Quality Monitoring Page 60
The following should be taken into account when deciding whether monitoring objectives have been fully achieved at a given monitoring point:
• Contaminant concentration trends (rising, falling, stable)
• Comparison of contaminant concentrations with relevant assessment values:
o Where concentrations have always been consistently below an assessment value, and the CSM leads to the expectation that this situation will continue, monitoring may cease (on the basis that no significant risk is present)
o Where a declining trend results in contaminant concentrations falling below an assessment value, and the CSM leads to the expectation that concentrations will remain below the assessment value, monitoring may cease (on the basis that the risk is no longer present at that point) unless there is potential for ‘rebound’ in contaminant concentrations when a remedial intervention ceases
o If one of the monitoring objectives is to define the volume of groundwater affected by the contaminant above the assessment value and the plume is expanding, monitoring points should be relocated to better define the plume boundary.
The planned duration of monitoring at each point should be reassessed at each review of the monitoring programme. See Box 2.2, which lists the issues that should be taken into account in a periodic review.
6.5 Potential pitfalls
Potential pitfalls in relation to choosing the frequency and duration of monitoring are highlighted in Box 6.4.
Box 6.4: Potential pitfalls
Potential pitfalls in relation to choosing the frequency and duration of monitoring
• Failing to adequately take into account the objectives of the monitoring programme.
• Incorrect or inappropriate use of the CSM in determining monitoring frequency/duration.
• Using a monitoring frequency inappropriate to the assessed risk.
• Using a monitoring frequency inappropriate to the natural characteristics of the water body (e.g. such that seasonal effects cannot be adequately assessed).
• Collecting data that no longer serve a useful purpose (e.g. the result will not change anything).
• Not carrying out regular reviews of the programme.
• Not devoting adequate resource to interpretation of monitoring results.

NIGLQ Nuclear Industry Code of Practice for Routine Water Quality Monitoring Page 61
7 Sample Collection and Field Measurements
7.1 Introduction
This chapter addresses the practical issues surrounding the collection of water samples from surface water and groundwater monitoring points, and provides guidance on field measurements. Approaches to sampling surface waters and groundwater are presented in Sections 7.2 and 7.3. Guidance on the measurement of water levels and of non-aqueous phase liquids (NAPLs) at the sampling location is presented in Sections 7.4 and 7.5. Section 7.6 provides guidance on field chemical and physical measurements that can be made on the sample. Sample care (that is, the management of sample preparation, preservation and transport) is discussed separately in Chapter 8. Management of waste water produced during the groundwater sampling process is discussed in Section 7.7. The requirements for characterising, treating and discharging this water can be onerous, and can result in substantial programme costs, timescales and management effort. Groundwater sampling approaches that reduce the volumes of waste water have advantages in this context and have been introduced on some nuclear sites in the UK; guidance is given in Section 7.3.1. Finally, Section 7.8 identifies constraints that may be encountered when sampling surface water and groundwater, and identifies potential solutions.
7.2 Surface water sampling: approaches & equipment
Surface water samples can be collected in various ways: at a single point in space and time; as composite samples from a number of locations or over a period of time,
Box 7.1: Roadmap – Chapter 7
Outline: This chapter addresses the practical issues surrounding the collection of water samples from surface water and groundwater monitoring points, and provides guidance on the field measurement of water quality parameters and water level at the sampling point. This chapter contains some nuclear- and radioactivity-specific content.
Aims: For the reader to understand:
� the need for clear operating instructions / method statements tailored to the programme objectives
� The types of field measurements that can be taken at the sampling location
� How these measurements can inform subsequent analysis and interpretation
� The importance of using appropriately trained field personnel
Navigation: Key sections for more experienced staff – Box 7.2 (When to use dedicated sampling equipment), Section 7.5 (NAPL Contamination), Section 7.7 (Waste Water Management) and Box 7.5 (Constraints & Solutions).

NIGLQ Nuclear Industry Code of Practice for Routine Water Quality Monitoring Page 62
and; as continuous samples using automatic samplers. The type of sample should be chosen to meet the objectives of the monitoring programme. Equipment used for sampling may include sampling jars/containers (the material of which should be tailored to the required analysis), scoops and extendable rods.
Care should be taken to ensure that the sample is representative. This requires consideration of issues such as decontamination/cleaning of equipment, storage, preservation and transport (Chapter 8), as well as ensuring the sample is taken according to the sampling plan and monitoring objectives. For example, this would involve avoiding sampling stagnant water and unnecessary disturbance of bottom and bank sediments. Where sampling is in an area affected by tidal changes, samples and measurements for successive monitoring rounds should be taken at the same point in the tidal cycle to enable comparison between samples. Samples should be taken from below the water surface to avoid collecting floating debris or other products, but not near the bed of the water body, to avoid the inclusion of sediment that is not usually in suspension.
EA and SEPA documentation on the monitoring of landfills [23, 24] provides additional detail on sampling of surface water. Detailed information is also provided in EA guidance on wetland monitoring and in BS guidance on sampling from lakes [46], rivers and streams [22].
7.3 Groundwater sampling: approaches & equipment
7.3.1 Sampling methods
Water in the borehole between sampling events may undergo mixing and chemical changes. Changes may occur through interaction with the materials forming the borehole and with the atmosphere, through biological activity and as a result of foreign materials entering the borehole. As a consequence, a sample taken from the borehole may not always be representative of that within the adjacent groundwater body. There are three methodologies that can be deployed for groundwater sampling, which are described below.
Volume purge and sample
The objective of ‘volume purge and sample’ is to fully purge the borehole by pumping sufficient water out of it before sampling. Abstraction of three borehole volumes of groundwater from short-screened boreholes (i.e. less than 3m in length, and typical of those found on UK nuclear sites) is recommended by BS ISO 5667-11 2009 (page 17) [47]. This approach is also appropriate for most longer boreholes, although larger purge volumes would be required. This NICoP follows the BS guidance, which defines a single borehole volume as the total volume of water contained within the borehole casing/screen and in the material in the annulus between the screen and the formation, contrary to earlier EA and SEPA guidance [23, 24] which explicitly did not include the annular material.
It may be possible to reduce the purge volume from the three borehole volumes recommended above. However, the stability of the composition of the abstracted water would need to be confirmed to demonstrate that sufficient purging had been undertaken. This will require periodic measurement of the quality of abstracted water during purging; see Section 7.6.3 for more information.

NIGLQ Nuclear Industry Code of Practice for Routine Water Quality Monitoring Page 63
Purging three borehole volumes may be impracticable due to the time required, for example due to the slow inflow of water from low permeability strata. In these circumstances, the water level in the borehole should be reduced significantly by abstraction, and a sample collected after substantial recovery has taken place. This will ensure that a high proportion of the sample comprises groundwater that has recently flowed into the borehole.
Low flow purge and sample
The objective of ‘low flow purge and sample’ is to purge the borehole locally at the point of sampling. This approach requires a smaller purge volume and flow rate than the high flow purge approach described above.
A submerged pump is used to extract water from the formation at very low flow rates (typically from 100 mL to 1L per minute). This method (Photo 2) means water within the monitoring installation above and below the screen/filter pack is left undisturbed, with purging and inflow only taking place at the screen/filter pack interval. This substantially reduces the volume of water abstracted and the rate of inflow of water to the borehole, which in turn reduces the inflow of fines, the suspended solid loading in the sample and the potential for blocking geotextile filters (if used) and filter packs. Note that, if this technique is used, the sample abstraction point must remain the same: e.g. in the centre of the screened interval.
In order to determine when sufficient water has been purged, it is usual to monitor the chemistry of the purged water until stability is achieved. See Section 7.6.3 for further discussion.
Photo 2 Low flow sampling equipment

NIGLQ Nuclear Industry Code of Practice for Routine Water Quality Monitoring Page 64
There is no UK-specific guidance relating to low-flow sampling. However, a full description of the technique is given in the (withdrawn) ASTM Standard Practice D 6771 [48] and in US EPA 2010 [49]. The main challenge is to ensure appropriate quality samples are collected. An understanding of natural vertical flows in the borehole is important to understand what is being sampled. Sampling must take place from the same depth in the borehole on each occasion. The use of a controllable flow cell and water quality instrumentation is essential to allow regulation of flow rate and to determine when water quality readings (specific conductivity, pH, temperature, dissolved oxygen etc) have stabilised and a sample can be taken.
No purge or passive sampling
The sample is either taken at a specific time (grab samplers) or over an extended period of time (passive samplers). Neither requires any well purging; instead the approach relies on the natural flow of water through the borehole being sufficient for the water in the borehole at the sampled depth to be representative of that in the adjacent rock or soil.
All three approaches have the objective of obtaining representative samples. The benefit of ‘low flow purge and sample’ and ‘no purge or passive sampling’ is that less water is produced as waste during the sampling process. See Section 7.7 for further discussion. In groundwater monitoring points that have significant vertical flow, the groundwater sample obtained following purging may differ significantly from one collected using ‘low flow purging’ or ‘no purging’.
More Prescriptive Guidance: The approach to groundwater sampling needs to be justified. When moving from one sampling approach to another (generally from ‘volume purge’ to ‘low flow purge’ or ‘no purge or passive sampling’), there should be a period when both approaches are used to allow cross-comparison. The new sampling approach should only be adopted when the site is confident that it produces representative groundwater samples.
7.3.2 Sampling equipment
To obtain representative water samples of suitable quality, the equipment used should be:
• Clean and uncontaminated to prevent cross-contamination. This is generally achieved by careful cleaning of portable equipment between sampling locations or through the use of dedicated sampling equipment such as borehole-specific pumps or installed equipment. See Photo 3. Single use equipment can also be used in some circumstances (e.g. to collect ‘no purge’ or ‘passive’ samples)
• Manufactured from materials that do not react with the water or contaminants within the water on the timescale of the sampling event
• Capable of taking samples from the monitoring point and transferring them into the sample container without significantly affecting the physical, chemical or biological properties of the sample.

NIGLQ Nuclear Industry Code of Practice for Routine Water Quality Monitoring Page 65
Photo 3 Installed borehole equipment
The main types of equipment used for collecting groundwater samples from boreholes are pumps13 and passive or no-purge depth samplers. Bailers are rarely the most appropriate sampling method because of the physical disturbance they cause when being lowered through the water column. A detailed description of the construction and operating principles of each type of equipment is given in [23] and summarised in BS ISO 5667-11. There is currently no specific guidance on the use of passive or no-purge samplers for groundwater sampling in the UK, but these are increasingly in use as an alternative to low flow sampling both in the USA and in the UK.
There are advantages and disadvantages associated with each type of monitoring, which are summarised in Appendix 10 of [23]. The suitability of each type of device for different water quality parameters is summarised in Table 4 of BS ISO 5667-11. The main issues are:
• Quality of sample
• Cost of equipment
• Ease of use
• Pumping rate or sample volume, which influences the time required to collect a representative sample
• Ease of maintenance
13
Various types of pumps are used: suction pumps, including peristaltic pumps; inertial pumps; electrical submersible pumps, and; gas-displacement & bladder pumps.

NIGLQ Nuclear Industry Code of Practice for Routine Water Quality Monitoring Page 66
• Suitability for specific contaminants. For example, suction and gas lift pumps are likely to result in sample degassing and the loss of volatile components. Such pumps are unlikely to be suitable for collecting samples for analysis of volatile determinands such as VOCs.
Groundwater obtained from boreholes should be discharged directly to the sample container. If pumped, the flow rate should be kept low when collecting samples for analysis for VOCs or redox-sensitive parameters, to minimise any degassing or entrainment of air that may occur when filling the sample container. Sample containers should in general be filled to the brim to enhance sample preservation unless otherwise instructed by the analytical laboratory. Some containers may be supplied with a ‘fill level’ marker to ensure the correct ratio of sampled water to a preservative already in the supplied container. Samples should be clearly labelled in a form agreed with the laboratory, and submitted with sample analysis instruction forms and chain of custody documentation.
Care should be taken to ensure that the sample is representative of water conditions at the time of sampling. Potential issues related to borehole design were discussed in Section 4.2. Sampling problems may occur if:
• An inappropriate sampling method is used, which does not meet the sampling objectives for the borehole
• Insufficient purging has been carried out to obtain a fully purged sample from across the entire screened interval
• There are vertical flows in the borehole, which significantly bias the sample (unless collection of a flow-biased sample is the sampling objective)
• The water sample is contaminated by NAPL in the borehole
• Portable sampling equipment is not adequately decontaminated between sample points.
Some of these aspects are discussed below. Further potential pitfalls during groundwater sampling are given in Box 7.6.
7.3.3 Potential issues when sampling
NAPL Contamination
The groundwater sample may become contaminated with NAPL if an LNAPL layer is present on the surface of the groundwater. Sampling equipment will become contaminated with LNAPL if it is lowered and raised through this layer, and entrainment of LNAPL in the groundwater sample may also occur. Cross-contamination can be eliminated by using dedicated sampling equipment in NAPL-contaminated boreholes. Collecting the water sample from several metres below the groundwater table will minimise or prevent NAPL entrainment. Additional care, such as minimising drawdown during sampling, should be taken to avoid inadvertently sampling the NAPL.
Cross-contamination
Cross-contamination between sampled groundwaters can occur if portable sampling equipment is not adequately decontaminated between sampling locations. The ease of decontamination will depend on the nature of the contaminants and the ease of accessing surfaces for decontamination. Decontamination of NAPL-contaminated surfaces is difficult, and dedicated sampling equipment should be used where NAPL contamination is present. Some dissolved contaminants are strongly sorbed onto

NIGLQ Nuclear Industry Code of Practice for Routine Water Quality Monitoring Page 67
surfaces, and decontamination would require significant flushing of the sampling equipment before collecting the next sample. In these circumstances, it is preferable to use dedicated sampling equipment. In other locations, for example at greater distances from contaminant sources, PCOCs might be restricted to non-sorbing contaminants such as tritiated water or dissolved chlorinated hydrocarbons, or to weakly sorbing contaminants. In these circumstances, portable and dedicated sampling equipment are equally suitable. Box 7.2 provides guidance on when to use dedicated sampling equipment. Total procedure blanks are a way of investigating whether cross-contamination is occurring.
More Prescriptive Guidance: Dedicated groundwater sampling equipment should always be used where NAPL contamination is present.
Where portable sampling equipment is used, protocols should be developed for cleaning equipment between sampling locations or for demonstrating that any cross-contamination is insignificant. A ‘rinsate blank’ should be taken each sampling round to demonstrate that cross-contamination is not significant or that decontamination has been successful. This is likely to involve flushing uncontaminated water through the sampling equipment and analysing a sample of the rinsate.
7.4 Hydrometric measurements
Water level measurements may be used for the calculation of flow in surface water bodies, or flows may be measured directly. Groundwater level measurements contribute to the understanding of fluxes of water, flow direction and the relationship of surface water with groundwater. In the case of groundwater, water level measurements inform the CSM by providing data and information on:
• The potential for natural vertical and horizontal flow of groundwater
• Natural fluctuations in the groundwater body, which can impact contaminant concentrations. For example, where there is natural variation in flow direction this
Box 7.2: When to use dedicated groundwater sampling equipment
Dedicated groundwater sampling equipment should be used where NAPL contamination is present.
It is preferable to use dedicated groundwater sampling equipment where strongly sorbing contaminants are present.
Where PCoCs are limited to non-sorbing or weakly-sorbing entities, either portable or dedicated sampling equipment can be used. The advantages and disadvantages of dedicated sampling equipment relative to portable sampling equipment are:
• Higher equipment cost
• Lower sampling time (and less labour required)
• No decontamination necessary (and less labour required)
The choice between dedicated or portable sampling equipment will involve balancing the additional operational effort required for sampling and decontaminating portable equipment against the additional cost of installing and maintaining dedicated sampling equipment.

NIGLQ Nuclear Industry Code of Practice for Routine Water Quality Monitoring Page 68
can impact the lateral and vertical position of a dissolved phase plume in the water body
• The identification of hydrogeological units
• The locations and impacts of groundwater recharge (e.g. process water leaks/inputs) and discharge (e.g. groundwater abstraction) points
• The performance of schemes to mitigate groundwater contamination or protect groundwater from the potential for contamination. These include pump and treat, in-ground barriers, surface caps and permeable reactive barriers.
Groundwater level measurements are also necessary as part of the process of taking groundwater samples.
7.4.1 Surface water
Field measurements of surface water level and flow may be taken manually or automatically.
Where simple surface water level gauges are used for measuring water levels, these should be securely mounted. Automatic water level gauges are more complex to install and require more maintenance, but are of greater use where water levels are expected to change more rapidly. In both cases gauges should be installed in such a manner that the datum point will remain fixed over time and in an area where flow is characteristic of the channel.
Flow in rivers and streams can be measured by direct velocity measurement using mechanical or electromechanical current meters, tracers or floats, or by measurement of water level above weirs. The last is the preferred, and most accurate, option. Detailed information on measurement and calculation of stream-flow is provided in BS ISO 748 [50] and in the Directorate of Water Management Hydrometric Manual [29]. Note that the EA or SEPA must be consulted prior to installing a weir.
7.4.2 Groundwater
Groundwater level should be measured both as an independent activity to understand groundwater flow behaviour and whenever groundwater samples are collected. It is recommended that automatic measurements are taken in at least one location on the site to produce a detailed hydrograph, which will allow water quality measurements to be related to seasonal or other transient effects in the groundwater system. In addition, a detailed hydrograph would help build understanding of local recharge patterns and other influences on groundwater level, such as any process water leaks and undocumented pumping. To maximise the number of boreholes with such data, it is recommended that loggers are moved between boreholes each year, unless there is a specific reason for longer duration monitoring in a particular borehole, for example to monitor performance of a remediation scheme. Where a nested installation is present it is good practice to place loggers in each measuring point in a nest. Additional guidance on automatic water level monitoring is available from other sources [31, 51].
Manual measurement should be taken from a fixed datum point using a clean dip tape. The depth markings on the dip tape should be routinely checked against a certified (e.g. Class II) steel tape to ensure that the tape has not stretched with use. The elevation of the datum point above Ordnance Datum (expressed as metres above Ordnance Datum) should be known. The position of the datum point should be

NIGLQ Nuclear Industry Code of Practice for Routine Water Quality Monitoring Page 69
confirmed from the field recording form. Where the fixed datum point is above or below the surrounding ground level, for example an upstanding casing, the distance between the datum point and the ground level should be measured to provide a reference ground level in the event that the casing is broken or damaged at a later date. All measurements should be made to the suitable precision, in practice typically between 5 mm and 10 mm. The depth to the base of the borehole should be measured to provide an indicator of the degree of silting present. Any deviation from the expected range of groundwater levels should prompt a repeat measurement to determine whether there has been a measurement error. The final stage of the process is to convert the depth to water to an elevation (metres Ordnance Datum).
Where groundwater level is measured as part of the sampling process, the level should be measured before any sampling activities, such as purging, begin. Ideally, further measurements should be taken during and after purging to provide information on yield and permeability and to help identify any issues with slow recharge that may affect the practicalities of routine sampling.
Where automated water level measuring equipment is installed, regular manual measurements should be made to validate the instrument readings and, if necessary, adjust them. Download frequency should be informed by the size of the available memory, as well as by the reporting requirements. Where possible, direct read cables should be used to maximise frequency of data logging and remove the need to extract the logger. Depending on the type of logger an additional barometric logger may be required to compensate for fluctuations in atmospheric pressure.
7.5 NAPL measurement
The presence of NAPLs in groundwater poses specific problems when carrying out field measurement and sampling. Sampling for NAPL should only be carried by staff who have been trained in such sampling procedures. If LNAPL is suspected to be present, an interface probe should be used to determine its presence and thickness. Guidance from a suitably qualified and experienced person should be sought when interpreting the data obtained from such measurements. The distribution of DNAPLs in an aquifer can be complex, and their presence is difficult to detect. Guidance on the transport and fate of DNAPL in groundwater is given in [52]. Corresponding guidance on the transport and fate of LNAPL in groundwater is given in [53].
7.6 Chemical and physical measurements on the sample
7.6.1 Introduction
This Section provides guidance on chemical and physical measurements that can be made at the point of sampling, including:
• Measurements to detect radioactive contamination of the water sample
• Measurement of water chemistry parameters (e.g. electrical conductivity, dissolved oxygen, pH, redox potential and temperature) that provide information which helps to:
• Confirm that stabilisation of water chemistry has been achieved in groundwater samples during purging
• Characterise the water sample
• Assist in determining the analytical schedule

NIGLQ Nuclear Industry Code of Practice for Routine Water Quality Monitoring Page 70
• Provide an early indication of changes in water quality
• Allow a basic cross-check with subsequent analytical results
• Qualitative observations, including sample appearance, odour, and presence of NAPL.
Field staff should be encouraged to be observant and to report their observations, as they will visit locations that others may not visit. The condition of monitoring equipment, installations and access should be noted and any problems identified at the earliest opportunity. Where possible, problems should be rectified at the time that they are identified. Field records produced by sampling technicians should be reviewed by technically qualified and experienced supervisors/managers. It is good practice to hold daily debrief sessions to discuss any problems or observations made. Notes of debrief sessions should be taken and any required actions notified to the appropriate person or body.
7.6.2 Detection of radioactive contamination
This section is concerned only with measurement of radioactivity in surface water and groundwater samples. Radiological monitoring to inform methods of working and to ensure the safety of sampling staff is excluded from this NICoP. Such monitoring and any radiation protection requirements should be specified in the Safe System of Work (SSoW). In general, monitoring of radiation exposure to individuals and contamination monitoring of equipment will be required in radiologically designated areas and at locations where the CSM has identified that radioactive contamination is possible or probable.
Field measurements of radioactivity using conventional Health Physics probes can potentially provide information on radioactive contaminants in solid materials collected as part of water quality sampling (e.g. stream bed sediments entrained in a surface water sample or silt entrained in a purged groundwater sample). However, dissolved levels of radionuclides in water samples will almost always be too low to detect using conventional Health Physics probes.
The benefits of rapid radionuclide analysis during site restoration are well-understood. For example, see [54], a recent report produced as part of NDA’s Direct Research Portfolio. A second report from this project reviews the literature relevant to rapid characterisation of contaminated materials that does not have a reliable gamma fingerprint [55]. For example, in-situ reusable radiochemical sensors have been developed in the US for groundwater monitoring of Sr-90 and Tc-99 on nuclear sites. Such devices are not currently used on UK nuclear sites. They should only be used if it can be demonstrated that they provide suitable data; this requires understanding of whether the water sample analysed is representative (see Section 7.3 for further discussion) and of the accuracy, precision and limit of detection of the analytical method (see Chapters 5.6 and 11).
7.6.3 Measurement of water chemistry parameters
Water chemistry parameters typically measured on site and the purposes of measuring them are set out in Box 7.3. Box 7.3 also gives typical values for UK surface waters and shallow groundwaters; note that these ranges do not include all natural waters. These parameters can be measured using readily available hand-held instrumentation. Note that it is not necessary to measure every parameter at a particular site or at every monitoring point if the information has limited value.
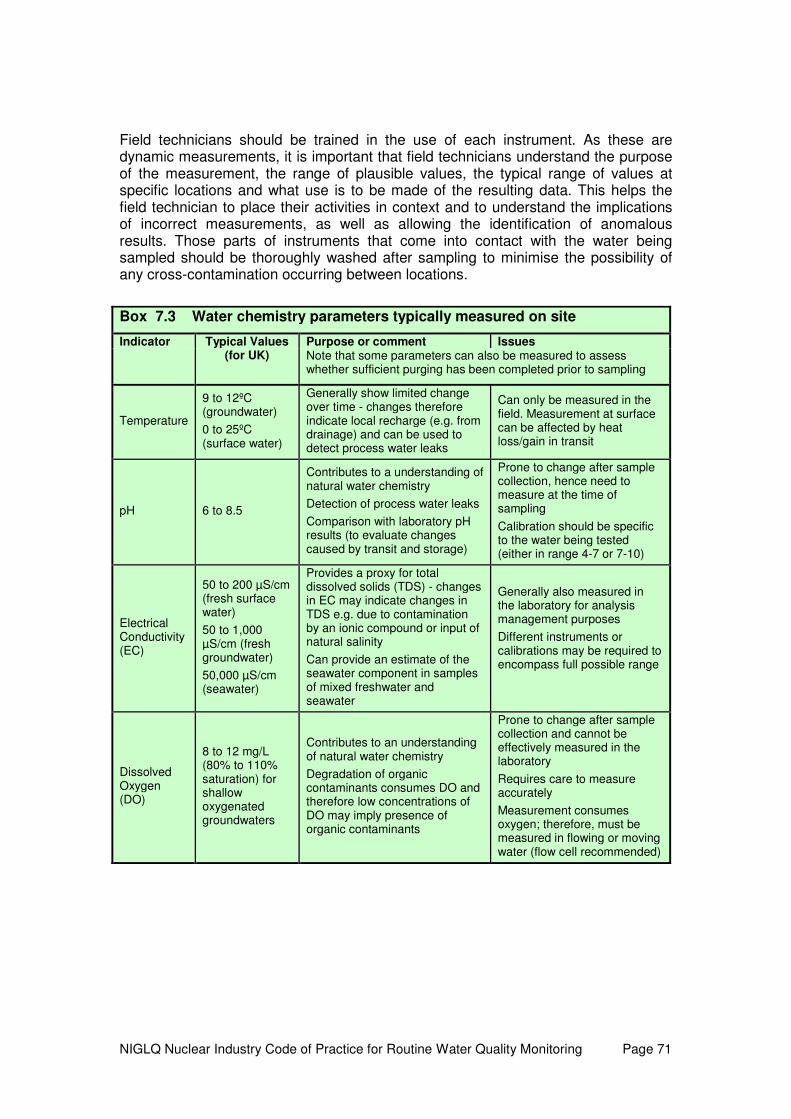
NIGLQ Nuclear Industry Code of Practice for Routine Water Quality Monitoring Page 71
Field technicians should be trained in the use of each instrument. As these are dynamic measurements, it is important that field technicians understand the purpose of the measurement, the range of plausible values, the typical range of values at specific locations and what use is to be made of the resulting data. This helps the field technician to place their activities in context and to understand the implications of incorrect measurements, as well as allowing the identification of anomalous results. Those parts of instruments that come into contact with the water being sampled should be thoroughly washed after sampling to minimise the possibility of any cross-contamination occurring between locations.
Box 7.3 Water chemistry parameters typically measured on site
Indicator Typical Values Purpose or comment Issues (for UK) Note that some parameters can also be measured to assess
whether sufficient purging has been completed prior to sampling
Temperature
9 to 12ºC (groundwater)
0 to 25ºC (surface water)
Generally show limited change over time - changes therefore indicate local recharge (e.g. from drainage) and can be used to detect process water leaks
Can only be measured in the field. Measurement at surface can be affected by heat loss/gain in transit
pH 6 to 8.5
Contributes to a understanding of natural water chemistry
Detection of process water leaks
Comparison with laboratory pH results (to evaluate changes caused by transit and storage)
Prone to change after sample collection, hence need to measure at the time of sampling
Calibration should be specific to the water being tested (either in range 4-7 or 7-10)
Electrical Conductivity (EC)
50 to 200 µS/cm (fresh surface water)
50 to 1,000 µS/cm (fresh groundwater)
50,000 µS/cm (seawater)
Provides a proxy for total dissolved solids (TDS) - changes in EC may indicate changes in TDS e.g. due to contamination by an ionic compound or input of natural salinity
Can provide an estimate of the seawater component in samples of mixed freshwater and seawater
Generally also measured in the laboratory for analysis management purposes
Different instruments or calibrations may be required to encompass full possible range
Dissolved Oxygen (DO)
8 to 12 mg/L (80% to 110% saturation) for shallow oxygenated groundwaters
Contributes to an understanding of natural water chemistry
Degradation of organic contaminants consumes DO and therefore low concentrations of DO may imply presence of organic contaminants
Prone to change after sample collection and cannot be effectively measured in the laboratory
Requires care to measure accurately
Measurement consumes oxygen; therefore, must be measured in flowing or moving water (flow cell recommended)

NIGLQ Nuclear Industry Code of Practice for Routine Water Quality Monitoring Page 72
Box 7.3 Water chemistry parameters typically measured on site
Indicator Typical Values Purpose or comment Issues (for UK) Note that some parameters can also be measured to assess
whether sufficient purging has been completed prior to sampling
Redox potential
Up to +400mV with respect to Standard Hydrogen Electrode for shallow oxygenated groundwaters
Contributes to an understanding of natural water chemistry (i.e. presence of reducing or oxidising conditions)
Provides an understanding of the aqueous speciation of contaminants
May provide evidence for the degradation of organic contaminants
Prone to change after sample collection and cannot be reliably measured in the laboratory
Requires care to measure accurately (flow cell recommended). Instrument difficult to calibrate and maintain
Results often misunderstood due to poor understanding of what is being measured
Particular care should be taken in recording the measurement units, as certain instruments differ in the units used, or have the facility to record data in different units. For example, electrical conductivity can be recorded in mS/cm or µS/cm, and most meters correct readings to either 20 ºC or 25 ºC. Care is therefore needed in comparing field results with those obtained from laboratory analysis, or field results obtained using different methods/instruments.
Although many field instruments are calibrated on delivery, most water quality equipment requires routine calibration prior to use and at specified intervals thereafter. Typically field instruments are calibrated once or twice per day when in use: at the start of operations and later in the day if necessary. More frequent cleaning and calibration may be necessary in variable water quality conditions and where equipment is repeatedly exposed to varying contaminated, oily or silty waters. Calibration should also be carried out as part of the quality control (QC) procedure if an anomalous reading is obtained. Where calibration solutions are used they should be traceable, certified and in date, with all calibration recorded as part of field records. Care should be taken to avoid inadvertently contaminating clean calibration solution.
Certain instrumentation also requires periodic manufacturer calibration (typically annually) and should only be used with a valid and in-date calibration certificate. It is good practice to keep copies of any calibration certificates in the field data file, and it may be a client requirement that copies are provided as part of the QA/QC process.
Where possible, surface water quality measurements should be undertaken in flowing water. Where groundwater is pumped for purging prior to sampling, water quality measurements are best taken inside a flow cell. Results should be recorded manually or electronically on forms tailored to the specific monitoring programme. All information recorded on the hand-written or electronic sampling form should be quality checked and then transferred to a record management system. Any original hand-written forms should be retained as hard copy or scanned, and any electronic field logs should be digitally captured as entered.
Different methodologies for groundwater sampling were discussed in Section 7.3. When carrying out low flow sampling, one or more water chemistry parameters are measured during the purging process, and a groundwater sample taken only when

NIGLQ Nuclear Industry Code of Practice for Routine Water Quality Monitoring Page 73
the parameters have stabilised. At this time, a final reading should be taken and recorded prior to taking the groundwater sample. Stability in this context means that the variation in three consecutive readings taken at 5 minute intervals is within the criteria shown in Box 7.4.
Box 7.4: Stability Criteria when collecting groundwater samples. Reproduced from [49]
Field Measurement Stability Criteria (for multiple readings)
pH ± 0.1 units
Temperature 3% (°C)
Electrical Conductivity 3%
Dissolved oxygen 10% for values greater than 0.5 mg/L. If three values are less than 0.5 mg/L, consider stabilised
Turbidity 10% for values greater than 5 NTU. If three values are less than 5 NTU, consider stabilised
Stability monitoring can also be incorporated into higher volume purge procedures, particularly where less than three boreholes volumes are to be purged during ‘volume purging’.
7.6.4 Qualitative observations
Qualitative observations should be made during the sampling process and of the water sample, and include:
• Appearance: colour, presence of suspended solids or non-aqueous (NAPL) sheens on water. Observations should be made against a consistent background e.g. blank sheet of paper
• Odour: distinctive odours may provide an early indication of contaminant issues, particularly for contaminants such as solvents. Care should be taken to minimise exposure to potential contamination, and it is not recommended for the operative to directly sniff the sample
• Qualitative indication of flow of surface water, if quantitative monitoring is not being undertaken
• Other: any other observations which may relate to water quality or could affect the accuracy or precision of field or laboratory measurements (e.g. damaged headworks allowing entry of surface water or organic material).
Any changes in appearance of samples that occur during or after the sampling process, such as the formation of precipitates, should be recorded.
7.7 Waste water management
Management of purged water from borehole sampling is a significant issue on UK nuclear licensed sites. The requirements for characterisation, treatment and discharge can be onerous, and result in high costs, timescales and management

NIGLQ Nuclear Industry Code of Practice for Routine Water Quality Monitoring Page 74
effort. In addition, if the purged water is required to be treated as radioactive waste, its generation is considered undesirable and may require a BAT or BPM justification.
Options for disposal of the purged water are discharge to ground at the borehole location (with or without pre-treatment of the water) or disposal (with or without treatment) as aqueous radioactive waste or non-radioactive effluent at a consented discharge location.
Disposal of purged water to the ground surface without pre-treatment is not acceptable on nuclear sites if the water is potentially or known to be radioactively or chemically contaminated. For some classes of contaminants (e.g. VOCs), it may be possible to treat contaminated water at the borehole location by passing it through activated carbon units, and it may be acceptable to discharge the treated water to ground. In principle, it should also be possible to discharge purge water to ground or drain if it is not contaminated. In both cases, permission to do this will need to be obtained from the relevant person or department on the site and, potentially, the regulator. There may be a requirement to filter purge water before disposal – it is often easier to do this at point of generation rather than later.
Disposal at a location remote from the borehole generally involves transport of the purged water in bowsers or Intermediate Bulk Containers (IBCs), the latter being preferable if there is the need to treat or store the purged water prior to discharge. Treatment may be required to reduce suspended solids (either by natural settlement or accelerated using a flocculant) or to remove contaminants. The site discharge consent(s)/authorisation will specify limits on water quality for discharged material. The requirement for any characterisation and/or treatment prior to discharge should be agreed.
7.8 Constraints and solutions
Common constraints that may be encountered when sampling surface water and groundwater on nuclear sites are shown in Box 7.5, together with potential solutions. It is important to identify any such constraints when designing the sampling programme, and to consider whether the specified objectives can be met with such constraints applied. Of those constraints listed in Box 7.5, some will not apply to every site and some will apply only to specific parts of some sites. For example, additional controls will be required in radiologically supervised or controlled areas to ensure worker safety, prevent the spread of radioactive contamination and to meet requirements on the movement of radioactive materials out of the area and off-site.

NIGLQ Nuclear Industry Code of Practice for Routine Water Quality Monitoring Page 75
7.9 Potential pitfalls
Potential pitfalls during groundwater sampling are presented in Box 7.6. Potential pitfalls during field measurements are presented in Box 7.7.
Box 7.5: Constraints and Solutions
• Limitations on use of acids or alkalis for sample preservation (see Section 8.3.2)
o Evaluate consequences of not using preservatives
o Where not preserving samples may compromise data quality, develop an appropriate SSoW
• Limitations on moving equipment in/out of radiologically designated areas
o Use of dedicated sampling equipment either inside the designated area or at each monitoring point
• Limitations on purge water volumes
o Challenge perception that purge water should be disposed of as waste
o Use of low flow or passive / no-purge sampling techniques
• Restrictions on discharge of waste water to ground
o On-site treatment of VOC-contaminated water
o Discuss options with regulators
• Constraints on TDS content for waste water discharged to site drains
o Water treatment (flocculation and/or filtration)
• Dose minimisation
o Develop time management system if sampling in high dose rate area
o Consult with Radiation Protection Advisor (RPA)
• Other access limitations (e.g. due to site operations)
o Liaise with facility managers when developing sampling plan
• Limitations on usage of electrical equipment
o Investigate alternatives (e.g. manually-operated inertial pumps or ‘no purge’ samplers)

NIGLQ Nuclear Industry Code of Practice for Routine Water Quality Monitoring Page 76
Box 7.7: Potential pitfalls during field measurements
• Use of uncalibrated or incorrectly calibrated field monitoring equipment.
• Not maintaining or correctly operating instruments (e.g. broken membranes on Dissolved Oxygen probes).
• Use of monitoring equipment with an inappropriate range.
• Inappropriate use and/or interpretation of redox measurements.
• Inconsistent use of dip datum points and/or use of dip datum points that have been damaged or changed between measurements.
• Failing to record field measurements.
• Failing to appropriately decontaminate equipment.
• Failing to appropriately train and/or brief field technicians.
• Failing to appropriately purge water prior to taking measurements.
• Inadvertently contaminating calibration solution.
Box 7.6: Potential pitfalls during groundwater sampling
• Not taking into account practical constraints at design phase
• Not considering generation of secondary waste
• Incorrect or missing labelling of sample points
• Sampling from wrong location or datum
• Use of inappropriate sampling methodology to match sampling objectives
• Inadequate purging (e.g. due to under-estimating purge volumes)
• Unnecessarily prolonged purging where monitoring of field chemical parameters during purging not undertaken or not used to good effect
• Use of inappropriate sampling equipment or inappropriate re-use
• Excessive flow rates when sampling for VOCs
• Inadequate specification of sample containers
• Collecting insufficient sample volumes
• Mixing NAPLs into groundwater samples
• Insufficient training or briefing of site operatives

NIGLQ Nuclear Industry Code of Practice for Routine Water Quality Monitoring Page 77
8 Sample Care
8.1 Introduction
Appropriate sample preparation (e.g. filtration), preservation (e.g. acidification and/or refrigeration) and transport (on-site and to an off-site laboratory) are vital to provide confidence in the analytical results and subsequent interpretation. There is available guidance for non-radiological contaminants, which is signposted from this document. This Chapter focuses on issues specific to samples containing radioactive contaminants and on the transport of samples from nuclear sites. Box 8.2 presents the process map for this chapter.
8.2 Sample containers: selection
Sample containers must be suitable for the required analysis. The issues to consider are:
• Volume of the container. Is it sufficient for the required analyses?
• Container material. Is it inert and is it suitable for dissolved gases or other volatile compounds if such analyses are required?
• Container seal. Is it suitable for liquids, and is it subject to deterioration when exposed to the contaminant in question?
Where a number of different types of analyses are required, it is generally necessary to split a single water sample into a number of different sample containers, each appropriate to the analysis in question. Guidance on the selection of sampling containers is provided by the Environment Agency [23]. However, the analytical laboratory should be consulted and may supply suitable containers matched to the required analyses. Further guidance on containers and filling requirements is provided by the Standing Committee of Analysts [56]. Re-use of sample containers (even following cleaning) should be avoided.
More Prescriptive Guidance: Sample storage containers should not be re-used.
Box 8.1: Roadmap – Chapter 8
Outline: This chapter provides guidance on sample preparation, preservation, dispatch and transport. It focuses on requirements for radioactive determinands, but summarises and signposts guidance/standards for common non-radioactive determinands. This chapter contains substantial nuclear/radioactivity-specific content
Aims: For the reader to understand how preparation, storage, dispatch and transport can potentially affect sample quality and, ultimately, the accuracy of subsequent results and interpretation
Navigation: Key sections for more experienced staff – Section 8.3.3 (Developing the sample preparation strategy) and Box 8.3 (Potential Pitfalls).

NIGLQ Nuclear Industry Code of Practice for Routine Water Quality Monitoring Page 78
8.3 Sample Preparation
Sample preparation is an important step in obtaining reliable and accurate analytical data relating to contaminant concentrations in water samples. In this context, it comprises filtration and preservation. These should be considered together, and the analytical laboratory consulted, when developing the sample preparation strategy.
8.3.1 Sample filtration
On collection, water samples will typically contain both dissolved substances and suspended solids. It is important to distinguish between these two types of material.
In surface water, suspended solids may be naturally present and, depending on the monitoring objectives, it may be appropriate to analyse for this material. This can be carried out by measuring Total Suspended Solids (TSS) content and carrying out separate analysis of the contaminant content of both the filtered water and filtered-out solids.
In contrast, the objective for groundwater monitoring is generally to measure dissolved substances. Any suspended solids present will generally be an artefact of the sampling process and/or poor quality borehole installations. If suspended solids are not removed from the water sample before analysis, analytes contained in the particulates or adsorbed onto particulates will be measured if the solids are dissolved

NIGLQ Nuclear Industry Code of Practice for Routine Water Quality Monitoring Page 79
during the analytical process. The consequence could be elevated measured concentrations of some constituents, potentially including toxic metals and some man-made and naturally occurring radionuclides. Incorrect conclusions will be drawn if such elevated concentrations are interpreted as dissolved substances.
The requirement for filtration and its timing (on site or at the analytical testing laboratory) is discussed in Section 8.3.3. The longer a sample is left unfiltered, the greater is the uncertainty that will be introduced into the analytical measurement. If there is a visible change in the appearance of a sample in the time interval between collection and filtration, then filtration has been left too late. Particulates may dissolve with time or, conversely, dissolved substances could become incorporated into, or sorbed onto, the particulates. Precipitation of iron oxides can be rapid when groundwaters from reducing environments are exposed to air.
EA guidance [23] is that field filtration is preferable, to maintain consistency in sampling procedures and minimise uncertainty in reported results. Where field filtration is not possible, any delays in consigning the sample to the laboratory should be minimised. The laboratory should, in any case, be consulted with regard to whether and when to filter. Where filtering is required, a 0.45 µm filter is generally appropriate; pre-filtration using coarser filters may be required in the event that there is high sediment loading. It is typically necessary to collect a number of sub-samples and to filter and preserve them, or not, according to the analysis required.
8.3.2 Sample preservation
Preservation is necessary for many analytes to ensure that deterioration of the water sample between sampling and analysis is kept to an acceptable level and does not significantly affect the concentration of the analyte. This deterioration occurs as a result of physical, chemical and biological processes, and can significantly affect the chemistry of the water. For example chemical precipitation (e.g. of ferric oxyhydroxides from iron(II)-rich groundwater on exposure to air) may occur within a matter of hours. Precipitating iron oxides may also adsorb or co-precipitate elements that are to be analysed in the sample, meaning there is the potential for severe error in interpreting the results. It is possible for a laboratory to attempt re-dissolution of the precipitate, but this will also dissolve any pre-existing suspended solids that may be present, hence the importance of filtering at the appropriate time.
More Prescriptive Guidance: Acid preservatives should not be used for unfiltered samples because acidification can cause entrained/suspended solids in the sample to dissolve.
Preservation can be achieved using chemical methods and/or by keeping the sample at a low temperature. The preservation technique is specific to individual determinands or groups of determinands. Not all determinands will require the water sample to be preserved.
Chemical preservation will require appropriate Health & Safety assessment (e.g. COSHH assessments). It generally involves the addition of an acid. Guidance on the need for preservation and the type, volume and molar strength of the acid should be sought from the laboratory, who may supply suitable sample containers pre-dosed with the appropriate preservative. Such pre-dosed containers should only be used if prior filtering (in the field) is guaranteed.
Temperature-controlled preservation is achieved using a combination of insulated ‘cool boxes’ and refrigerators. Samples that are particularly temperature sensitive

NIGLQ Nuclear Industry Code of Practice for Routine Water Quality Monitoring Page 80
(e.g. for VOC analysis) should be immediately transferred to a cool box, and subsequently to a refrigerator on the day of collection. Samples must not be frozen.
8.3.3 Developing the sample preparation strategy
The sample preparation strategy should take into account water chemistry, suspended solid loading, the potential for change after sample collection and the potential impact of filtration and preservation on the concentration of the contaminant or contaminants to be measured. The requirements for filtration and preservation can vary according to the required analysis. The consequence is that it is generally necessary to collect a number of sub-samples for each water sample, using different containers, filtration and preservation protocols.
Principles to be followed in developing a sample preparation strategy are summarised below, based on the assumption that the objective is analysis for dissolved substances, with key aspects highlighted in the ‘More Prescriptive Guidance’ below:
• Filtration is required to remove particulate that would otherwise be included with dissolved matter during the analytical process. This is relevant for samples to be analysed for inorganic cations (which includes many radionuclides as well as non-radioactive toxic metals) and for gross alpha/gross beta analysis.
• Filtration is not required for samples to be analysed for H-3 or most inorganic anions, including radionuclides that are present in the water sample as anions (e.g. Cl-36). However, there is no detriment if filtration is undertaken.
• Samples for analysis of organic compounds should not be filtered, as filtration may remove organic contaminants from the sample.
• The following waters intended for the analysis of inorganic cations (which includes many radionuclides) must be filtered at the time of collection:
• Water samples with high entrained suspended solids (i.e. visible turbidity and/or settlable solids)
• Water samples where precipitates are known to form if the water is not preserved (since acid preservative may also dissolve pre-existing suspended solids in such samples)
• For other water samples intended for the analysis of inorganic cations (including many radionuclides), filtration can be undertaken either at the time of sampling or at the laboratory. Uncertainty in the analytical result will be reduced by early filtration.
• The following should be kept cool, with refrigeration commencing on the day of sampling:
• Water samples for analysis of volatile contaminants, such as VOCs
• Water samples for analysis of organic contaminants and unstable inorganic species
• It is less easy to generalise requirements for chemical preservation. Samples to be analysed for inorganic cations (such as toxic metals, and including radionuclides that are present in the water sample as cations) and for gross alpha/gross beta analysis will require acidification prior to analysis. The analytical testing laboratory should be consulted on preservation requirements for other determinands.

NIGLQ Nuclear Industry Code of Practice for Routine Water Quality Monitoring Page 81
• Chemical preservation using acids should only be undertaken on samples filtered at the time of sampling. The acid can be added in the field after filtration or in the laboratory. That said, where the objective of adding acid is to minimise sample degradation (rather than to dissolve precipitate, for example), the acid should be added as soon as possible after the time of sampling.
More Prescriptive Guidance. Filtration is required for samples to be analysed for inorganic cations (such as toxic metals, and including radionuclides that are present in the water sample as cations) and for gross alpha/gross beta analysis. Filtration is not required for samples to be analysed for H-3 or most inorganic anions (including radionuclides that are present in the water sample as anions). Samples for analysis of organic compounds should not be filtered. Samples to be analysed for inorganic cations (such as toxic metals, and including radionuclides that are present in the water sample as cations) and for gross alpha/gross beta analysis will require acidification prior to analysis. The analytical testing laboratory should be consulted on preservation requirements for other determinands.
Clearly it is not possible to gain meaningful sample concentration data for any substance that has been added as a preservative. In all cases, liaison with the laboratory should also take place as certain substances may affect instrument calibration. For example, instrument performance may differ depending on whether hydrochloric or nitric acids are used for acidification.
Guidance is available regarding the maximum acceptable delay before analysis for individual determinands [56], with additional guidance on sample filtration and preservation (including maximum tolerable storage times prior to filtration) provided in BS ISO 5667-3:2012 [57].
Lastly, filtration and chemical preservation at the point of sampling add time and cost to the routine monitoring programme. The use of acids as preservatives also introduces additional hazards requiring risk assessment. As a result filtration and chemical preservation at the point of sampling are sometimes omitted, even though this may compromise the quality of subsequent laboratory analysis. (For example, individuals carrying out the risk assessment on the sampling process may consider that sample filtration and chemical preservation should be deferred until the samples have been received by the analytical laboratory.)
More Prescriptive Guidance. Where necessary(see text above for circumstances), filtration and chemical preservation must be undertaken at the point of sampling, even though these processes add time and cost to the routine monitoring programme and may introduce additional hazards into the risk assessment. In those circumstances where filtration and chemical preservation in the field is required, omitting or deferring this step is likely to compromise the quality of subsequent laboratory analytical data. Addition of acid preservative without prior filtration is likely to compromise the quality of subsequent laboratory analytical data.
8.4 Sample storage
All samples should be stored in a secure location. Section 8.2 discusses where refrigerated storage may be required. Section 8.3.3 signposts available guidance on maximum recommended storage times.
It is important that samples are despatched to the analytical testing laboratory (usually an off-site commercial laboratory) in a timely manner. On some nuclear sites, on-site screening for radioactivity is undertaken prior to off-site sample dispatch. If this is required, maximum recommended storage times should not be

NIGLQ Nuclear Industry Code of Practice for Routine Water Quality Monitoring Page 82
exceeded before analytical testing. Exceeding the maximum recommended storage time may result in under-measurement of the contaminant concentration, and may lay the SLC open to subsequent challenges on data quality.
More Prescriptive Guidance: Maximum recommended storage times should not be exceeded before analytical testing. Exceeding the maximum recommended storage time may result in under-measurement of the contaminant concentration, and may lay the Site Licence Company open to subsequent challenges on data quality.
8.5 Sample dispatch and transport
For nuclear sites, there are two approaches for the despatch of samples off-site:
• Clear samples from site as being exempt from radioactive material (RAM) transport regulations. This would require either on-site screening analysis to demonstrate the samples are exempt or the use of historical data to argue for exemption. Calculation of whether a package can be deemed exempt is dependent on the concentrations of specific nuclides as given in the Carriage of Dangerous Goods (CDG) regulations [58], which implement the European Agreement concerning the International Carriage of Dangerous Goods by Road Regulations [59]. These values apply across the UK.
• Despatch the samples as radioactive material subject to RAM regulations, with or without on-site screening analysis. If not using on-site screening analysis, historical data should be used to support selection of the appropriate type/grade of package.
Off-site laboratories must be consulted to ensure that they are licensed to handle samples of the measured or estimated activity. It may also be necessary to make arrangements for the return of residues from higher activity samples.
Suitably qualified and experienced people such as the site Radiation Protection Advisor (RPA) or Accredited Health Physicist should be consulted before samples are dispatched.
If the material is to be despatched as RAM, the following steps are necessary:
• Estimation of total package inventory (potentially using historical monitoring data)
• Consultation with suitable qualified and experienced people e.g. RPA, Accredited Health Physicist and Dangerous Goods Safety Advisor to ensure:
• Selection of appropriate type/grade of package (based on estimation of inventory, external dose rates and surface contamination). For routine water quality samples this would typically be an Excepted Package or, in rare cases, a Type A container
• Compliance with all transport regulations and site-specific procedures
• Selection of appropriate courier to transport RAM
• The analytical testing laboratory is able to receive the samples. If the samples are radioactive, the laboratory requires an open source registration under radioactive substances legislation and its Conditions for Acceptance must be appropriate to the radionuclide inventory dispatched.
Samples should be carefully packed into suitable packages (e.g. cool boxes) with sufficient packaging to prevent movement and minimise the possibility of breakage. Samples should be double-contained or an absorbent material added to the

NIGLQ Nuclear Industry Code of Practice for Routine Water Quality Monitoring Page 83
container to prevent leakage in the event of breakage. Samples suspected to be highly contaminated should be packed separately from those considered relatively ‘clean’.
Lastly, the consignor should confirm that the samples/RAM have arrived at the laboratory in satisfactory condition. The use of a Chain of Custody for this purpose is discussed further in Sections 11.4 and 11.5
8.6 Potential pitfalls
Potential pitfalls associated with sample care are shown below in Box 8.2.
Box 8.2: Potential pitfalls
Potential pitfalls associated with sample care are:
• Inadequate planning of on-site screening analysis leading to back-log in on-site screening laboratory and delay to off-site sample dispatch
• Over-cautious assessment of risks from on-site use of chemical preservatives
• Use of inappropriate sample containers
• Failure to filter on-site (where necessary to assure data quality)
• Inadequate on-site filtration equipment (e.g. lack of coarse pre-filtration capability)
• Filtration of samples after precipitates have formed
• Addition of acid preservatives to unfiltered samples (e.g. misuse of containers pre-dosed with acid)
• Lack of suitable on-site storage facilities
• Storage times exceeding maximum recommended time
• Inadequate refrigeration
• Frozen samples leading to broken bottles
• Failing to engage with RPA/Health Physics/ Dangerous Goods Safety Advisor regarding clearance from site
• Use of non-compliant couriers for transport
• Incorrectly identifying RAM that is being transported from site. This leads to incorrect packages, labelling and transportation paperwork
• Reluctance to use historical data as a basis for exemption from RAM transport regulations or for estimation of inventory of RAM packages

NIGLQ Nuclear Industry Code of Practice for Routine Water Quality Monitoring Page 84
9 Reporting, Data Management and Record Keeping
9.1 Drivers & expectations
A considerable amount of resource is expended in acquiring high quality monitoring data, and the costs and implications (both environmental and reputational) of poor or inappropriate management of records can be considerable. As noted by SAFEGROUNDS [60], there is an expectation on the part of regulators, owners, investors, site workers and the general public that data of any type collected by SLCs should be appropriately collated and managed, and that they:
• Should contain all the information that may be required both now and in the future (including after site closure)
• Should be accessible to all those who may require access to them (within the bounds of commercial confidentiality and security requirements)
• Should be assembled and maintained in a secure form.
In addition to forming a database (to inform interpretation of water quality and potential contamination), there may also be a legal or commercial requirement that records are maintained. In particular, appropriate record keeping is of importance when land is to be sold or delicensed, and can greatly facilitate the process, particularly in defining liabilities to be sold or transferred.
This section discusses the importance and benefits of good data management and record-keeping, but does not provide explicit guidance on how such practices should be applied. Guidance on data and records management is provided in documents produced by SAFEGROUNDS [60] and the NDA [61].
Monitoring programmes will generate the type of records set out in Box 9.2. The data can be divided into two main types: raw data (i.e. information recorded without conversion, and therefore including non-numerical data and numerical data downloaded from dataloggers) and processed data (i.e. information changed in some way from its original form). While digital data will exist primarily on local or networked hard drives (and potentially other formats such as the Cloud), raw data will be in a range of formats, including written records, electronic field records, datalogger downloads, photographs and laboratory results in database, spreadsheet or scans. A number of digital formats are available, and their longevity and ability to be converted into other formats should be taken into account. All these records require retention
Box 9.1: Roadmap – Chapter 9
Outline: This chapter provides guidance on how the data obtained from routine water quality monitoring programmes should be managed and reported. The information in this chapter does not contain much nuclear- and radioactivity-specific content.
Aims: For the reader to:
� Understand the expectations for reporting, data management and record keeping
� Be aware of the type of records that should be maintained
� Understand how to handle anomalous or erroneous results
Navigation: Key sections for more experienced staff – Box 9.2 (types of records)

NIGLQ Nuclear Industry Code of Practice for Routine Water Quality Monitoring Page 85
and management. For example, there may be statutory requirements for some data storage. See Section 9.2.
Box 9.2 Record Types
Record Type Examples of information Raw data Processed data
Sampling programme
Programme objectives Monitoring objectives Monitoring strategy
Monitoring plan Review documentation
Modification documentation
n/a n/a
General
Location of sample Time and date of sampling
Units of measurement for field measurements
Prevailing weather conditions (temperature, pressure)
Field forms n/a
Rainfall Rainfall Daily rainfall Time series data
Groundwater level Level below datum
Datum used Atmospheric pressure
Field sheets Tabulated data
Datalogger downloads
Levels to m OD Groundwater hydrographs
Surface water level
Level m BGL Datum used
Atmospheric pressure
Field sheets Tabulated data
Datalogger downloads
Levels to m OD Surface water hydrographs
Surface water flow Spot flow measurements
Calibration measurements Stage discharge relationship
Spot flow readings Datalogger downloads
Surface water velocity
Field observations
Appearance Odour
LNAPL layer thickness Sample point condition
Field sheets Tabulated data Photographs
Electronic records
n/a
Purging records Purge volume Field sheets Datalogger downloads
n/a
Field water quality measurements
Type of measurement Measurement results Calibration records
Field sheets Tabulated data
Datalogger downloads
Time series data
Laboratory results
Name and location of laboratory Sample matrix
Date received at laboratory Temperature on receipt
Analytical method Analytical suite Determinand
LoD Result
Flags (non conformance etc.) Analysts’ observations
Chain of custody documentation
Laboratory result report
Results screened against:
Water quality targets Assessment levels
Verified and corrected data
Time series data

NIGLQ Nuclear Industry Code of Practice for Routine Water Quality Monitoring Page 86
9.2 Data management
Records require tracking from inception, and should be stored securely to allow future extraction, interrogation and reporting. Records should:
• Be quality assured (Chapter 12)
• Be complete (i.e. comprising records of all stages in the monitoring programme)
• Have a unique identification number
• Be traceable to a particular sample, sampling event (time, date, person), location, analytical method and laboratory.
• Have the ability to be cross-referenced and searched in a manner that allows all relevant records for a specific query to be retrieved (e.g. all samples from a specific round, all samples from a specific sampling point etc)
• Use consistent and clearly identifiable units
• Be accessible to appropriate users
• Be in a format that is easily transferable to other formats (e.g. using database queries, export functions etc)
• Be robustly stored with backup measures and a disaster recovery plan in place
• Be secure from malicious or accidental damage (e.g. password protected).
Note that while hard copy data can be scanned and stored electronically, records should clearly distinguish between raw data collected as part of the sampling and analysis programme and data that have been processed post-acquisition. Data processing should be carried out in a manner that preserves the original raw data, as well as producing the processed dataset.
The data storage system chosen should be designed in such a manner that it provides secure and robust storage over the long-term (i.e. ‘future-proofed’). The requirement to interrogate the dataset will not necessarily cease with the sale or delicensing of the site or area of the site, and legal/commercial issues may also apply. For this reason it is preferable that the system chosen should be tried and trusted. The use of bespoke or obscure systems or software should be avoided as they are more likely to become obsolete or unsupported, particularly where their operation relies heavily on the expertise of key personnel or suppliers. However, even where the tried and trusted approach is used, provision should be made for data migration as systems and software improve or successor systems arise. It is worth noting that it is increasingly difficult to access data held on floppy disc or VHS, technologies that were in regular use until only recently, and there is no reason why this may not soon be the case with current accepted technology.
9.2.1 Storage and archiving
As discussed, two sets of data (raw and processed) are generated as part of the sampling and analytical process. Each type should be clearly identified and stored in separate folders or subfolders on a system readily accessible to appropriate users.
Digital storage can facilitate long-term data management and protection through the use of backup technologies and remote storage. However, these are effective only when they are deployed regularly, and a backup strategy should be incorporated into

NIGLQ Nuclear Industry Code of Practice for Routine Water Quality Monitoring Page 87
the overall QA procedure, consistent with site data retention procedures and mechanisms. Where data currently exist only in digital form, consideration should be given to producing a hard copy of all validated data (see Section 10.3) to allow for the possibility of system failure or obsolescence. Securely archived and indexed hard copy gives greater assurance of data being retrievable over multi-decade timescales.
More Prescriptive Guidance. Data should be maintained and stored in accord with site data retention procedures and mechanisms.
9.2.2 Data presentation and reporting
The data obtained from the monitoring programme should be evaluated against the monitoring programme objectives and relevant assessment values (see Chapter 10). The results of this evaluation should be presented in a suitable format. The precise format used is open to choice, but may depend on the volume of data. It may also be influenced by the reporting requirements of the regulator.
Reporting should be both factual (a presentation of the results obtained) and interpretive, including comparison of the results with relevant assessment values. For a relatively small programme these can be presented together in a single report, while for larger programmes separate factual and interpretive reports may be more suitable. Where data are being submitted to third parties, such as regulators, these parties should be consulted to agree appropriate formats. Summary tables, charts or diagrams may be preferred to aid interpretation.
Interpretation and understanding of the data will be facilitated by presentation as time series charts, which allow trends in contaminant concentrations to be visualised. Similarly, presentation of data as spatial ‘snapshots’ of contaminant concentrations assist interpretation and understanding, allowing the location and extent of the contamination to be demonstrated. For large monitoring programmes the use of GIS software should be considered to facilitate effective presentation.
The presentation and reporting of data forms part of the overall monitoring programme, and is subject to relevant QA requirements (see Chapter 11).

NIGLQ Nuclear Industry Code of Practice for Routine Water Quality Monitoring Page 88
10 Data Assessment
10.1 Introduction
This chapter considers assessment of data obtained from a routine water quality monitoring programme, and covers:
• Factors influencing baseline water quality (Section 10.2), which needs to be adequately characterised to allow effective assessment of monitoring data
• Data validation and how to handle anomalous or erroneous data (Sections 10.3 and 10.4)
• Possible approaches for data assessment and interpretation (Sections 10.5 to 10.8)
• How to develop a responsive action plan (Section 10.9).
Allocation of sufficient experienced resource to assessment and reporting is central to meeting the monitoring programme objectives. Without appropriate resourcing, the value obtained from the programme will be significantly reduced. There is the potential for important events to be missed or incorrectly interpreted, while unimportant events/fluctuations (including one-off anomalies) may be given undue attention.
Formal assessment and reporting of routine monitoring data should be carried out at pre-defined points in time. Informal assessment, which should also be recorded, can take place at any time.
Assessment (formal or informal) should take place:
• On receipt of field results (to enable an early response to any obvious issues with water quality)
• On completion of a defined set of monitoring activities (e.g. following a round of monitoring)
Box 10.1: Overview – Chapter 10
Outline: This chapter provides guidance on the assessment of routine water quality monitoring results, including data validation, approaches to assessment and development of responsive action plans. The information contained in this chapter contains a significant amount of nuclear- and radioactivity-specific content.
Aims: For the reader to understand:
� Factors influencing baseline water quality
� How to validate data
� Relevant types of assessment values
� How to formulate a fit for purpose responsive action plan
Navigation: Key sections for more experienced staff: Section 10.6 (comparison with assessment values) and Section 10.9 (how to develop responsive action plans)

NIGLQ Nuclear Industry Code of Practice for Routine Water Quality Monitoring Page 89
• On receipt of laboratory results (e.g. comparison of results against defined criteria to determine if results are in line with expectations)
• During periodic updates to the CSM and reviews of the monitoring programme (e.g. including new monitoring data to justify changes to the CSM).
10.2 Factors influencing baseline water quality
For both radioactive and non-radioactive substances, baseline concentrations (see Section 2.3.3 for discussion of the baseline) are influenced by:
• Natural Processes:
o Geographical location (e.g. proximity to coast, influencing the concentration of dissolved salts in rainfall and potential for presence/intrusion of saline groundwater)
o Rainfall and recharge patterns
o Mineralogy and geochemistry of the rocks through which groundwater passes (largely related to leaching potential from host minerals)
o Residence time (influencing the concentration of dissolved substances)
o Mixing of waters from different origins.
• Anthropogenic Processes:
o Agricultural practices, for example affecting potassium, ammonium, nitrate and sulphate concentrations in surface waters and shallow groundwater
o Salting of roads and paths in winter
o Contaminants originating from sources unrelated to the site (e.g. H-3 and Cs-137 from weapons testing, atmospheric fallout from Chernobyl, contamination from other industries etc.)
o Man-made radionuclides originating from authorised/permitted discharges from the site or from other sites, potentially in the following forms:
� From discharges to air. Local rainfall washout may mean radionuclides are present in surface water or locally recharged groundwater
� From aqueous discharges. Wind-blown ‘sea to land’ transfer of spray/spume may bring discharged radionuclides back on the site.
o Site processes and activities, including the effects of leaks and spills, occurring prior to the chosen baseline date.
10.3 Data validation
In many cases, potential quality control issues with water quality and field monitoring data can be identified in the field at the point of collection. This relies on engaged, knowledgeable and experienced field staff who should, as a matter of course, be encouraged to look for, record and report any deviations from what would normally be expected (Chapter 7). This can be facilitated by regular meetings of the monitoring team during each round of sampling.
Laboratory results should not be accepted at face value, and should be subject to quality checks (‘data validation’) prior to being used, to identify simple errors and inconsistencies. There should be an initial check on receipt of results, as there may be an opportunity to re-run the analysis within sample holding times. Data from

NIGLQ Nuclear Industry Code of Practice for Routine Water Quality Monitoring Page 90
replicate samples and trip blanks etc. should also be reviewed. Further information on quality assurance and quality control is provided in Chapter 11. An example QC check-list is given in Appendix 3.
Validation rules should be documented and form part of the overall QC process under the QA framework. The rules should be formulated to avoid the rejection of data that, though extreme, represent real values. This particularly applies when entering data into computerised systems and the use of macros etc to automatically strip out apparently erroneous results should be avoided. Where data are checked by eye, personnel should be suitably qualified and experienced, and should have an understanding of how the data are derived and what they will be used for. This also provides ‘early warning’ identification of apparently erroneous data.
Individuals responsible for data validation should have access to the full set of data (raw and processed) and previous examples where errors or omissions have been encountered. Available information should include:
• Newly entered data requiring validation
• Original data records
• Sampling programme technical rationale documentation
• QA/QC procedures
• Relevant method statements.
In the event that errors or inconsistencies in the data are encountered, the root cause should be investigated and procedures developed to avoid a repeat.
The level of validation carried out should be proportionate to the objectives of the monitoring programme, but should not be onerous. Simple checks include internal data checks (applying validation tests to a suite of data collected from a single monitoring point) and external checks (applying validation tests by comparison to other related data).
The results should be checked for completeness to ensure that:
• All samples submitted have been subject to the requested analyses specific to each sample
• The analytical methods achieved the required LoDs.
Internal data checks may comprise checks for:
• Simple errors (e.g. transcription errors, incorrect sample ID, missing data)
• Logical checks (e.g. data outside physically possible range)
• Chemical data check. Are the results internally consistent – e.g. do ions balance, and are the expected correlations observed?
• Radioactivity data check. Do the gross alpha/beta activities correlate to specific elevated radionuclides? Is the isotopic ratio consistent with that observed site-wide or feasible based on site practices?
External data checks may comprise checks for:
• Comparison with QC sample analyses (Section 11). Are replicate results within acceptable margins? Was activity/contamination present in the laboratory blank or field blank (if collected)?
NIGLQ Nuclear Industry Code of Practice for Routine Water Quality Monitoring Page 91
• Consistency with field results
• Comparison with historical analytical data from the same sample point. Are the results consistent with previous results (particularly for long-term monitoring)? If not, what has changed, and is it a plausible change?
• Comparison with analyses from similar or nearby sampling points
• Evaluation of other sample attributes, e.g. adherence to sampling protocols.
Errors in reported results, or anomalous readings, can occur as a result of:
• Use of incorrect methodology (e.g. inappropriate use of filtering or incorrect addition of acid to sample)
• Basic laboratory errors (e.g. dilution errors, transcription errors, unit errors and sample switching)
• Cross-contamination due to exposure in transit, storage or laboratory
• Filtering failing to achieve objectives.
10.4 Handling anomalous or erroneous data
If results are outside the expected range they should not be immediately discounted, as they may indicate a new contamination event or change in hydrological or hydrogeological conditions.
Where the data validation process exposes anomalous or erroneous data, additional checks should be undertaken, including cross-checking the data with original field records or laboratory certificates, confirmation and checking with field and laboratory personnel and (if necessary) undertaking repeat measurement or analysis. The QA procedure should incorporate actions to be taken in the event of such occurrences, and a written record of the event and subsequent actions maintained.
Data that are unexpected are not necessarily erroneous and great care should be taken in rejecting data for use. Corroborative data (e.g. gross beta corroborating Sr-90) can assist in making such decisions.
Clearly, due to the time delay between sample collection and data assessment it will not always be possible to undertake repeat measurement or analysis. However, every effort should be made to do so where the data will be used for compliance issues. Clearly this has implications for sample retention.
More Prescriptive Guidance: Laboratories should be required to retain samples until after the data received have been validated by the SLC.
As noted in EA guidance [23], if data are definitively flagged as erroneous after initial validation checks and subsequent investigation, the data should be removed from the main database and the removed record(s) highlighted with an explanatory comment. This will allow a complete and accurate record to be maintained whilst recording any problem data. Any issues should be fed back into the sampling and analytical chain as part of the SLC’s learning process.
10.5 Approach to assessment of routine water quality monitoring data
Assessment of routine water quality monitoring data generally involves three steps:
• Comparison of measured concentrations against defined assessment values. Guidance is given in Section 10.6

NIGLQ Nuclear Industry Code of Practice for Routine Water Quality Monitoring Page 92
• Identification of any outliers. Guidance is given in Section 10.7
• Identification of any trends. Guidance is given in Section 10.8.
The level of assessment will depend on the scale of the problem. In many cases a simple ‘by eye’ evaluation of data will be sufficient to identify outliers and trends, while statistical analysis may be necessary for sites with larger and more complex datasets [23]. The assessment process should allow the SLC to understand water quality trends and the causes and significance of any exceedances of assessment values. It should provide the basis for developing a responsive action plan, which specifies actions to be taken in the event of assessment value being exceeded, or where identified trends suggest such values will be exceeded at some point in the future (see Section 10.9).
10.6 Comparison with assessment values
The first step in assessing the significance of the results is to determine what assessment values should be used. In this NICoP, we use ‘assessment values’ as a catch-all term to refer to any type of concentration value against which water quality may be compared. Assessment values may be selected from a wide range of sources, and may represent ‘limit’14 or ‘compliance’ values that should not be exceeded, or ‘screening’ levels/values intended to represent concentrations at which additional investigation, such as further analysis, should be considered. Values can be set by the regulator or developed by the SLC. Potentially applicable terms which may be encountered are defined in Box 10.2. Note that although widely used outside the nuclear industry, the concepts of ‘Control’ and ‘Trigger’ levels for groundwater as defined for the Landfill Directive [23, 24, 65] are not considered applicable to routine water quality monitoring in general.
As environmental regulation is the responsibility of the devolved administrations in the UK, different regulations apply in England & Wales, Northern Ireland and Scotland. It is not in the scope of this NICoP to advise on the appropriate assessment values to be used under the different regulatory regimes and associated guidance. It is good practice for the SLC to engage with the regulator to get their view on what assessment values are appropriate for water quality at the site.
More Prescriptive Guidance: The SLC should engage with the regulator to get their view on what assessment values are appropriate for water quality at the site.
There is a large amount of information available for non-radioactive aspects of water quality, including values prescribed in statute or regulatory guidance. This information is signposted from this NICoP in Section 10.6.1. As the guidance in this NICoP concentrates on those aspects of water quality monitoring specific to nuclear sites and radioactive contaminants, more detail is given in this document about available assessment values for radionuclides (Section 10.6.2).
14
Note that this use of the word ‘limit’ does not relate to the requirement under the Groundwater Daughter Directive to ‘limit’ entry of non-hazardous pollutants to groundwater.

NIGLQ Nuclear Industry Code of Practice for Routine Water Quality Monitoring Page 93
Box 10.2: Assessment values: definitions of commonly encountered terms
A variety of terminology is used in available guidance. Some commonly encountered terms are defined below.
• Assessment Values: Catch-all term used in this document referring to any type of concentration values against which analytical data may be compared
• Limit values: Concentrations of contaminants that should not be exceeded (e.g. a ‘trigger level’ for contamination of groundwater, in the specific meaning of this term in UK landfill regulation)
• Screening Level/Value: The concentration of a contaminant (or indicator parameter) above which additional investigation, such as further analysis, should be considered (e.g. as applied to radioactivity in drinking water by the World Health Organisation and in UK drinking water quality standards – see Box 10.3)
• Drinking Water Standards (DWS): The UK DWS define ‘prescribed concentrations and values’ (PCVs) which include numerical limits on the concentrations of micro-organisms, chemicals and other ‘wholesomeness’ parameters in drinking water. The PCVs are set to be protective of public health and to ensure water quality is acceptable to consumers. For radioactivity, the UK DWS is not expressed in terms of PCVs for radionuclides but as an ‘indicator parameter’ value of dose, expressed as a Total Indicative Dose of 0.1mSv/year.
• Guideline Value: World Health Organisation term applicable to non-radiological aspects of drinking water quality which “represents the concentration of a constituent that does not exceed tolerable risk to the health of the consumer over a lifetime of consumption”
• Guidance Level: World Health Organisation concentration of a specific radionuclide in drinking water, equivalent to a dose of 0.1 mSv/yr
• Reference Concentration: DEFRA and EC concentration of a specific radionuclide in drinking water equivalent to a dose of 0.1 mSv/yr
• Generalised Derived Limits: NRPB derived concentrations (in drinking water and other media) equivalent to the annual dose limit for members of the public (1 mSv/yr)
• Environmental Quality Standards (EQS): Numerical limits on the concentrations of chemicals, river flow or water level, or measurements of biological communities, breach of which in surface waters will lead directly to firm regulatory action on protection or further investigation and monitoring, depending on the particular standard exceeded.
• Minimum Reporting Value (MRV): Regulator-specified value intended to define the smallest concentration of a contaminant in environmental waters readily discernible using good analytical practice.

NIGLQ Nuclear Industry Code of Practice for Routine Water Quality Monitoring Page 94
10.6.1 Non-radioactive substances
Currently available information for non-radioactive substances includes the following:
• UK Drinking Water Standards (e.g. in Table B of Schedule 1 of the current regulations [37]15)
• WHO Guidelines for Drinking Water Quality [62]
• Environmental Quality Standards [63]
• Minimum Reporting Values (MRV) [64, 65]
• Water Framework Directive [2] and associated daughter directives for surface water [66] and groundwater [67].
Contaminants in groundwater are classified by the environment agencies as either hazardous substances or non-hazardous pollutants, as defined in 2000/60/EC [2] and 2006/118/EC [67].
A list of substances determined as hazardous is published by the environment agencies, and includes all radioactive substances. At the time of writing, this was under review by the Joint Agencies Groundwater Directive Advisory Group (JAGDAG).
For some non-radioactive hazardous substances, minimum reporting values (MRVs) have been published. Statutory levels for many substances in drinking water have been published and there is non-binding guidance on levels for a longer list published by WHO [62].
At the time of writing, published guidance on the assessment of hazardous substances and non-hazardous pollutants in groundwater was available from the EA [21] and SEPA [68] (supported by WAT-PS-10 [20]). UKTAG [69] has also produced updated recommendations on Environmental Standards. The EA’s chemical standards database [63] lists the standards for most substances applicable in England and Wales. Standards for Scotland are listed in supporting guidance [70].
SLCs should always ensure that the assessment values being used are appropriate to the site-specific context.
10.6.2 Radioactive substances
Useful information on potential assessment values for radioactive substances can be found in a variety of sources, including UK Drinking Water Regulations (e.g. [37]), World Health Organisation [62], UK environment agencies [43], the former NRPB [e.g. 71, 72] and UK radioactive substances legislation [73]. A compilation of assessment values is given in Box 10.3. It is important to recognise that most published guidelines and standards for drinking water quality are framed around avoidance of doses to consumers exceeding 0.1 mSv/yr and that this may not be the applicable standard of protection for groundwater.
Screening analysis for gross alpha and gross beta activity can be used as an indicator of radioactive contamination of water16. The UK Drinking Water Inspectorate (DWI) guidance on the implementation of the Water Supply (Water Quality)
15
Although the reference is to English regulations, note that drinking water standards are currently harmonised throughout the UK. They derive from Directive 98/83/EC.
16 As emphasised in Section 5.4, it is recommended that concentrations of all PCoCs are
determined in the early characterisation stages of monitoring, including setting the baseline.

NIGLQ Nuclear Industry Code of Practice for Routine Water Quality Monitoring Page 95
Regulations 2000 in England [42] and in Wales [43] provides screening values for gross alpha and gross beta activity that equate to a cautious estimate of a Total Indicative Dose of 0.1 mSv/yr (the value for this Indicator Parameter in the Water Supply (Water Quality) Regulations [37])17. The same regulations also stipulate that tritium is also an indicator parameter in drinking water, with a statutory ‘specification concentration’ of 100 Bq/L. This is not based on a dose equivalent, and is not a drinking water standard to be complied with, but is intended as a prompt for further investigation and it triggers a requirement for notification. Tritium is described by the DWI [42] as “effectively a screening parameter for the presence of contamination by artificial radionuclides” [in drinking water].
‘Screening levels’ for gross alpha and beta activities are also provided in WHO Drinking Water Guidelines [62], and are also based on avoidance of exceeding a dose equivalent of 0.1 mSv/yr. Exceedance of the screening levels in drinking water should prompt further investigation (e.g. radionuclide-specific analysis and dose calculation). The WHO guidelines also provide ‘guidance levels’ for a number of specific radionuclides, also based on 0.1 mSv/yr, and state that “screening levels and guidance levels are [both] conservative and should not be interpreted as mandatory limits. Exceeding a guidance level should be taken as a trigger for further investigation, but not necessarily as an indication that the drinking-water is unsafe”. Clearly, if WHO guidance levels are being used then specific radionuclides are already being analysed, perhaps because the WHO screening levels for gross alpha and/or beta have been exceeded.
Guidance on which radionuclides should be analysed for if the UK DWI screening levels for gross alpha or gross beta in supplied drinking water are exceeded is given in [42, 43]. This guidance, along with a European Union EURATOM document [41], includes data on ‘reference concentrations’, which are equivalent to 0.1 mSv/yr for specific radionuclides in drinking water. See Box 10.4. These differ from WHO guidance levels (included in Box 10.3) as a result of rounding.
Generalised Derived Limits (GDLs) are available from Public Health England [71]. These are intended for use in the assessment of the effects of routine discharges of radioactivity to the environment for a range of commonly-occurring radionuclides (Box 10.3), and can be used as reference levels where compliance means that relevant dose equivalent limits are not exceeded. GDLs are calculated on the basis of a dose of 1 mSv/yr, but use an implied dose of 0.1 mSv/yr as a ‘reasonable level’ at which further investigation should be triggered [74], i.e. the screening level is equivalent to 10% of the GDL. Further guidance on site-specific assessment is given in [75].
If Reference Concentrations, Guidance Levels or 10% of GDLs should be exceeded in fresh surface water or groundwater, further assessment (for example calculation of Total Indicative Dose [TID] from drinking the water) is recommended, and would be required by law in the case of water intended for use as drinking water. But note that the 0.1 mSv/yr basis for assessment of drinking water may not be the applicable standard of protection for groundwater.
The contribution of each radionuclide to the Total Indicative Dose can be calculated by a sum of fractions approach, using the following formula:
17
Note that gross alpha and gross beta analysis would not be sufficiently sensitive should a lower screening value be set for Total Indicative Dose.

NIGLQ Nuclear Industry Code of Practice for Routine Water Quality Monitoring Page 96
� C�RC��
Where: Ci = the measured concentration of the radionuclide i, and,
RCi = the Reference Concentration (or alternatively the Guidance Level) of radionuclide i that will result in an effective dose of 0.1 mSv/yr.
The Total Indicative Dose will exceed 0.1 mSv/yr if the sum of fractions is greater than one. Note that even if the TID is less than the assessment value (i.e. 0.1 mSv/year for drinking water), this does not necessarily mean it should be considered acceptable. SLCs will need to demonstrate that all practicable measures have been taken to keep doses ALARP.
Groundwater contaminated with radioactivity is not classified as radioactive waste under radioactive substances legislation [73] whilst it remains in place, but it becomes radioactive waste as soon as it is removed from the ground. The exemption levels for radionuclides in high volume low activity aqueous waste are worth noting, and give maximum concentrations in Bq/L for a wide range of radionuclides, based on avoidance of doses exceeding 0.01 mSv/yr for discharges to sea or ‘relevant river or sewer’, taking account of drinking water and other pathways to humans. These values give some indication as to what activity concentrations current legislation considers of little concern. However, these values are not intended for application to groundwater contaminated by radioactivity and the exemption itself is inapplicable to any site with a radioactive waste disposal authorisation/permit (thereby excluding application to a nuclear licensed site), so the values have not been reproduced in this NICoP.

NIGLQ Nuclear Industry Code of Practice for Routine Water Quality Monitoring Page 97
Box 10.3 Examples of potentially applicable assessment values for selected radionuclides
Source Nuclide Drinking
Water Value (Bq/L)
Freshwater Value (Bq/L)
Type Dose
Equivalent
WHO drinking water
guidelines [62]
Gross alpha 0.5 n/a Indicator screening levels
0.1 mSv/yr Gross beta
1,2,3 1.0 n/a
H-3 10,000 n/a
Dose-based nuclide-specific screening levels
(‘guidance levels’)
(See also Box 10.4 for
alternative values of this
type)
0.1 mSv/yr
C-14 100 n/a
Sr-90 10 n/a
I-131 10 n/a
Cs-134 10 n/a
Cs-137 10 n/a
Th-232 1 n/a
U-234 1 n/a
U-238 10 n/a
Pu-239 1 n/a
Am-241 1 n/a
UK DWI [42] screening
values
Gross alpha 0.1 n/a
Indicator screening levels
nominally 0.1 mSv/yr Gross beta 1.0 n/a
UK DWS [37] indicator
parameters
H-3 100 n/a n/a
Total Indicative Dose4,5,6
n/a n/a Dose screening
level 0.1 mSv/yr
NRPB GDLs for drinking
water [71, 72]
H-3 (HTO) 50000 50000
Dose-based, use 10% as
screening levels 1.0 mSv/yr
H-3 (OBT) 30000 n/a
C-14 2000 10
P-32 70 0.04
P-33 300 0.20
Co-58 900 4
Co-60 100 0.50
Zn-65 9 200
Se-75 300 20
Sr-90 50 50
Tc-99 800 n/a
Tc-99m 30000 n/a
Sb-125 60 600
Cs-137 100 2
Th-229 3 n/a
Th-230 8 n/a
Th-234 200 n/a
Np-237 20 n/a
Pu-238, 239, 240 7 each 10 each
Am-241 8 10
Pu-241 300 400
1. Note that gross beta is commonly reported against K-40 or Cs-137. Reporting against K-40 gives higher values (by a factor of the order of 1.7). The WHO and UK DWI do not state which reporting convention is assumed. This ambiguity needs to be borne in mind when assessing gross beta data.
2. Gross beta will not detect low energy beta emitters such as H-3.
3. If the gross beta screening level is exceeded, the contribution of naturally occurring K-40 should be subtracted following determination of total potassium. For each mg/L of potassium, the beta activity due to potassium-40 is 0.030 Bq/L [42].
4. Excluding H-3, K-40, radon and radon decay products.
5. Calculated from measurement of gross alpha and gross beta.
6. Only required if gross alpha and/or gross beta screening values are exceeded.

NIGLQ Nuclear Industry Code of Practice for Routine Water Quality Monitoring Page 98
Box 10.4 Reference concentrations for radionuclides in drinking water [41,43]
Radionuclide1
Reference Concentration (Bq/L)
2
Recommended maximum LoD (Bq/L)
C-14 Carbon 14 240 48
P-32 Phosphorus 32 57 11
P-33 Phosphorus 33 571 114
S-35 Sulphur 35 1050 211
Co-60 Cobalt 60 40 8
Sr-90 Strontium 90 4.90 1
Zr-95 Zirconium 95 144 29
Nb-95 Niobium 95 236 47
Tc-99 Technetium 99 214 43
Tc-99m Technetium 99m 6230 1240
Ru-106 Ruthenium 106 20 3.91
Sb-125 Antimony 125 125 24.9
I-125 Iodine 125 9 1.83
I-129 Iodine 129 1 0.25
I-131 Iodine 131 6.20 1.2
Cs-134 Caesium 134 7.20 1.4
Cs-137 Caesium 137 11 2.1
Ce-144 Cerium 144 26.3 5.27
Pb-210 Lead 210 0.20 0.04
Bi-210 Bismuth 210 105 21.1
Po-210 Polonium 210 0.11 0.02
Ra-226 Radium 226 0.50 0.10
Ra-228 Radium 228 0.20 0.04
U-234 Uranium 234 2.80 0.60
U-238 Uranium 238 3.00 0.60
Th-228 Thorium 228 0.60 0.12
Th-230 Thorium 230 2.80 0.56
Th-232 Thorium 232 3.04 0.61
Pu-239/240 Plutonium 239/240 0.60 0.10
Am-241 Americium 241 0.70 0.10
1. Values in bold are for radionuclides included in the EC drinking water directive draft [41]: Data for reference concentrations are taken from this document.
2. Reference concentration corresponds to a dose of 0.1 mSv to an adult (based on an ingestion rate of 730 l/yr).
10.7 Identifying outliers
An outlier is a result that deviates from the expected range of values. Identification is based on comparison of the measured concentration with historical data at a specific location. The result can be unexpectedly low or unexpectedly high, although it is the latter that tends to get most attention. Outliers may represent a real event, or result from an erroneous measurement.
At the simplest level, outliers may be identified by eye from graphs of time series data, or from simple statistics such as Grubbs’ rule [76] or the Shewhart-Cusum test [77]. For some routine water quality monitoring programmes (e.g. where there are a large number of locations or where there are significant water quality issues), it may be appropriate to carry out more complex statistical analyses, setting, for example:

NIGLQ Nuclear Industry Code of Practice for Routine Water Quality Monitoring Page 99
• Control Levels: In this context18, a control level can be defined as a statistically determined boundary limit. Both upper and lower control levels can be set, to identify data which are considered to be outside the bounds of historically collected data. This enables large changes in measured water quality to be highlighted.
• Data Quality Flags: DQFs are defined to flag data which are considered to be unusual or erroneous for further investigation. A DQF can be applied both to data deemed unusable, and data considered suspect or estimated, which may still be used for some purposes.
The process of identifying outliers focuses attention on unexpected results. Where an outlier is identified, analysis (e.g. re-testing samples) should take place to identify whether it is the consequence of a real event or an error. In the latter case it should be identified as such and removed from the dataset used for trend analysis and interpretation. It is not acceptable to remove a result from the dataset solely on the grounds that the result is unusual. Useful guidance in dealing with outliers is provided by the Environment Agency [78].
10.8 Trend analysis
Analysis of analytical results allows identification of any trends in contaminant concentrations. Trend identification can allow forecasting of probable future contaminant concentrations, and is of particular use where there is the possibility of deterioration in water quality or where measuring the effectiveness of a remediation scheme. Identification and extrapolation of trends provides the SLC with a degree of ‘advance warning’, allowing it to develop and agree programmes of work if necessary to prevent or mitigate against the effects of higher contaminant concentrations.
Trends can be identified through visual examination of time series data or through the application of various statistical methods, which give more detailed information on the rate of change and associated uncertainty. Analysis requires short-term cyclical effects (e.g. diurnal & seasonal) to be distinguished from those which represent long-term change.
Guidance on statistical techniques applicable to the assessment of environmental data is available in a number of existing publications [79,80,81], and further guidance is being developed through the NDA Direct Research Portfolio. The methods presented in these guidance documents should be considered when analysing data obtained from routine monitoring, both to identify unusual or potentially erroneous data and to determine the statistical significance of apparent rising or falling trends. Useful guidance in dealing with results below LoD is provided by the Environment Agency [78].
10.9 Developing responsive action plans
An important part of a water quality monitoring programme is the responsive action plan, which specifies actions to be taken in the event of an assessment value being exceeded, or where identified trends suggest such values will be exceeded at some point in the future.
The action plan should be in a live document and be updated regularly. It should define the processes to be carried out in the event of specific events. For example, a result above an assessment value could lead to:
18
Not the context of ‘control levels’ as defined under the Landfill Directive [23].

NIGLQ Nuclear Industry Code of Practice for Routine Water Quality Monitoring Page 100
• The result being ‘flagged’ in the results database
• The result being ‘flagged’ in the site abnormal events system
• Management action
The action identified should be proportionate and take into account the inherent uncertainty associated with data variability.
When compiling the responsive action plan, it should be remembered that most assessment values are derived to protect human health, and assume that the water from which the sample has been taken is for human consumption. This will not be the case on a nuclear site, and will only rarely be the case downstream/down-gradient of a nuclear site. Consequently, assessment values are generally cautious, and this should be recognised when developing site-specific assessment values (Section 10.6) and when developing the responsive action plan.
Potential actions to be taken in the event of an assessment value being exceeded are summarised below. It is important to recognise that actions should be site-specific and that a record of the decision-making process should be made.
1) Determine validity of data:
a. Consider repeating the analysis on the same sample using the previous analysis method and LoD
b. Consider repeating the analysis on the same sample using an improved LoD, which will reduce the potential for ‘false positives’ that occur close to the LoD. An alternative analysis method may be appropriate to achieve this
c. Consider re-sampling and analysis
2) Collect and review additional data:
a. Consider increasing the monitoring frequency. This is usually a temporary measure
b. Review data and update the CSM if necessary
3) Further assessment:
a. Consider undertaking a higher tier risk assessment to provide less cautious, site-specific estimates of risk
b. Further actions may be developed after completion of this risk assessment
4) Consider remedial options. The possibility of taking immediate management action (e.g. in the context of an assessment value being exceeded at a ‘leak detection’ monitoring point) should be considered in parallel with the above.

NIGLQ Nuclear Industry Code of Practice for Routine Water Quality Monitoring Page 101
10.10 Potential pitfalls
Potential pitfalls associated with data assessment are shown in Box 10.5.
Box 10.5: Potential Pitfalls Potential pitfalls related to data assessment include:
• Failing to allocate appropriate or sufficient resources
• Failing to take into account baseline/background contaminant concentrations and/or natural variability
• Under-estimation of the inherent variability of the results due to combined uncertainties arising from sampling and analysis
• Delayed review of analytical data
• Not specifying, or inappropriately specifying, assessment values (e.g. misinterpreting tritium indicator parameter value in UK DWS)
• Not distinguishing clearly between screening type assessment values and limit/compliance type assessment values
• Lack of responsive action plan
• Over- or under-cautious responsive action plan
• Strict application of drinking water assessment values to groundwater not intended for human consumption
• Not applying statistical tests to time-series analytical data (or using inappropriate tests)
• Inappropriate interpretation of data from indicator measurements
• Inappropriate comparison of data collected using different analytical techniques and/or calibrated against different standards
• Uncritical assessment of anomalous results (which may be due to artefacts)

NIGLQ Nuclear Industry Code of Practice for Routine Water Quality Monitoring Page 102
11 Safety, Quality Assurance & Quality Control
11.1 Safety
Any work that is carried out on a Nuclear Licensed Site will be carried out under a Safe System of Work (SSoW) and authorised under a Permit to Work. Documents under the SSoW are known by various names such as Working Procedures, Standard Operating Procedures, Method Statements, Operating Instructions etc. This documentation also forms part of Quality Control (QC) procedures by providing a consistent and reproducible methodology, which controls errors that may be introduced in the process. It is a legal requirement to implement a SSoW, and such documentation should be approved by a suitably qualified and experienced person. Specific guidance on sampling safety is provided in BS EN ISO 5667-1 [82], BS 5667-4: 1987 [46], BS ISO 5667-6: 2014 [22] and BS ISO 5667-11: 2009 [47].
Sampling should not take place until all documentation has been approved by the site and briefed to field operatives. It is also recommended that field operatives carry out and document a Point of Work (PoW) risk assessment at the start of each working day and at each sampling point to capture and assess any risks which may not otherwise be addressed in the SSoW (e.g. dynamic risks such as weather conditions and risks arising from location-specific hazards).
Field operatives should be strongly encouraged to cease work in the event that they perceive there are unacceptable risks and report any such risks back for assessment and mitigation. Feedback from operational experience should be incorporated into revisions of the SSoW documentation.
11.2 QA/QC definitions
The starting point for the delivery of a fit for purpose routine water quality monitoring programme is the use of standard operating procedures carried out by suitably qualified and experienced personnel. To ensure the objectives of the programme are met, all activities should be undertaken under an overarching Quality Assurance (QA) and Quality Control (QC) framework. QA and QC arrangements are commonly audited both internally and externally to ensure that their requirements are being met throughout the delivery of the work.
Box 11.1: Roadmap – Chapter 11
Outline: This chapter provides guidance on the application of Safety, Quality Assurance & Quality Control procedures to routine water quality monitoring programmes. The information in this chapter does not contain much nuclear- or radioactivity-specific content.
Aims: For the reader to understand:
� The importance of Safety, QA/QC procedures
� Types of procedures to use
� The effect of an inappropriate QA/QC process
Navigation: Key sections for more experienced staff – Section 11.3 (Design phase), Section 11.4 (Sampling phase) and Section 11.5 (Despatch/ Analysis Phase)

NIGLQ Nuclear Industry Code of Practice for Routine Water Quality Monitoring Page 103
QA in this context relates to a system for the planning, implementation, monitoring and evaluation of the various aspects of a work programme. Most sites will have their own QA systems under which staff and contractors are expected to operate, and therefore detailed discussion of QA is not appropriate in this document. A document (called the Project Quality Assurance Plan, Project Management Plan, Project Control Plan or similar) should be produced to describe the systems and procedures by which quality will be assured on the routine water quality monitoring programme. The contents and structure will be specific to the QA system in place, but in general the document should include:
• Organisation of the project team
• Responsibilities of members of the project team
• Design of the monitoring programme
• Procedures for collecting and analysing samples
• Checking arrangements
• Laboratory audits.
It will reference relevant site and local procedures.
It will identify where key information is documented.
QC relates to the precise nature of the work being carried out, regardless of the geographical location or management system. QC essentially covers the activities to be carried out and how to use the results, and includes the inspection, checking and testing requirements necessary to ensure that the requirements of the programme are met. QC procedures also dictate actions, for example determining when there is a requirement to retain a sample, or when a duplicate or ‘blank’ is required. Although QC is a continuous process, it can be broken down into a number of phases as shown in Sections 11.3 to 11.6.
When designing the QC programme, it is helpful to know what can go wrong during the collection and analysis of samples. This allows the QC programme to be more able to detect errors, and possibly to prevent them. Potential artefacts in routine water quality monitoring data are presented in Section 11.4.2.
11.3 Design phase
QA arrangements should cover all aspects of the routine water quality monitoring programme. Documentation relating to QA should include detailed description of the activities to be carried out and actions to be taken. Required documentation will include:
• Method Statements (covering all phases of the work)
• Work Safety Plans (for field works)
• Requirements on qualifications and/or experiences of staff undertaking the work
• Field forms
• Equipment specifications
• Calibration specifications
• Chain of Custody documentation, covering the sampling, despatch and results delivery

NIGLQ Nuclear Industry Code of Practice for Routine Water Quality Monitoring Page 104
• Quality checking documentation, commonly including spot checks of a proportion of the data.
The methodology documentation should be designed to ensure that all samples of a similar type are collected in a consistent manner, which may be subject to QC checking, and to ensure (as far as reasonably practicable) that all samples and subsequent analysis are of a high quality, allowing clear and unambiguous interpretation.
11.4 Sampling phase
11.4.1 Approach to QA and QC
Examples of QC as applied to the sampling process include:
• Collection of relevant field data and observations (additional to the water quality parameters of primary interest), encouraged by the use of suitable field forms
• Taking replicate samples, to investigate analytical precision
• Use of blanks to determine whether the sampling and analysis process has caused samples to become contaminated
• Use of field standards, to ensure calibration of field instruments
Replicate samples may be taken as reserves, and also as part of the laboratory QC process, whereby analytical results for the replicate sample can be used to quantify errors arising from random variation. Field standards are laboratory-prepared water samples with known concentrations of specific analytes, which are used to determine the gain or loss of an analyte. They are of particular use for analytes such as ammoniacal nitrogen, trace metals, TOC and VOCs. Trip blanks (commonly distilled water) are a form of field standard supplied by the laboratory and used to detect systematic and random gain of analytes. Spikes can be used to assess loss of analytes during the sampling, transport and analysis process.
The use of replicate samples, trip blanks and field standards should be appropriate to the aims and scale of the sampling programme. As a minimum it is recommended that a replicate sample is taken for every ten sample locations, and a trip blank/field standard (which can be combined as a single sample) for every sample despatch. Where results from trip blanks and/or replicate samples differ significantly from field samples a full investigation should take place and results from that round of monitoring flagged as potentially incorrect. QC analyses should be carried out throughout the lifetime of the programme, even where the sampling and analysis protocol is tried and tested and no QC issues have arisen to date.
The simplest approach to replicate sampling is to collect duplicates. However, the results from duplicate samples provide no basis for distinguishing between errors and variability, or for establishing a correct result when an error is detected. Triplicate samples provide more information, and may allow a view to be taken on the correct result when the results differ. No QC programme is effective unless the data from the QC samples are reviewed and assessed. If QC data for a batch of samples fail, it may be necessary to reject the batch of results and to re-sample.
The use of chain of custody sheets is essential part of the QA process for ensuring the traceability of samples. Therefore, chain of custody sheets should always be used for samples collected by a routine water quality monitoring programme. The chain of custody process starts with the sampling plan, which dictates what samples to take, from where and when, and what they are to be tested for. Chain of custody

NIGLQ Nuclear Industry Code of Practice for Routine Water Quality Monitoring Page 105
documentation should be initiated when the samples are taken, with a record kept of the activities carried out on each day. It is good practice to develop a form for each sampling location, on which details related to the monitoring point, conditions and samples are recorded. An example form is provided in Appendix 4.
To ensure that potential issues are raised at the earliest opportunity, provision of information from the previous round (e.g. dip, depth to base, colour, odour etc) will allow technicians to immediately place any field measurements they are taking into context and flag up any obvious discrepancies (e.g. a sudden change in depth to base of a borehole) and redo if necessary. It should be noted that even simple slips in the QC process such as not having marked datum points on boreholes can lead to significant difficulties at the time of interpretation. These can, and should, be addressed at the front end of the process (i.e. in the QA arrangements).
Specifications for field measurements should be based on an understanding of tolerable uncertainty for the measurement in question, the method of measurement and the practicality of carrying out the measurement in field conditions. There is little point, for example, in specifying that dip measurements should be accurate and precise to the nearest millimetre, as obtaining data to that level of precision would be extremely difficult in the field and would add little to any subsequent interpretation. Measurement to the nearest centimetre is adequate. If any change to the specification is made (for example, if moving from ‘volume purge’ to ‘low flow purge’ sampling) this should be clearly noted and managed carefully. This will ensure as much continuity as possible in measurement and allow an understanding of any changes to be accounted for in any subsequent interpretation of time series data.
One further aspect of the QA process relates to the sampling and field measurement equipment used. It is important that all this equipment is fit for purpose, as required under the quality arrangements for the project. To ensure this, suitably qualified and experienced people should specify the equipment to be used. In addition, in England and Wales, EA guidance suggests that equipment used for statutory monitoring purposes should be MCERTS certified [83], although as of 2014, MCERTS is limited to non-radioactive pollutants/contaminants. Consideration of MCERTS compliance may be appropriate when selecting any equipment for the routine monitoring programme.
11.4.2 Artefacts in the data
Apparent variation in water quality can result from data quality issues. All data should therefore be subject to extensive quality control checking and data validation prior to being used for the purposes of interpretation (see Section 10.3). Potential causes of error include:
• Errors occurring in the field during sampling, including:
o Taking samples from the wrong locations
o Incorrect or illegible labelling
• Poor quality sample collected in the field, due to:
o Gross contamination of samples (e.g. due to entrained particulates)
o Internally flowing borehole responds to pumping in a variable way
o Incorrect filtration
o Cross-contamination due to use of contaminated equipment

NIGLQ Nuclear Industry Code of Practice for Routine Water Quality Monitoring Page 106
• Changes in the nature of the sample occurring during storage and transport, including those caused by:
o Deterioration of samples (e.g. due to failure to maintain low temperature, use correct preservative or comply with maximum holding time)
o Cross-contamination with other samples (e.g. through leakage or breakage)
o Degradation of sample labelling
• Errors occurring at the laboratory, including those caused by:
o False positives
o Transposing samples/sub-samples due to poor labelling
o Cross-contamination
o Interferences when analysing saline samples
o Dilution errors
o Units errors
o Sample preparation/processing errors (including due to unclear SLC requirements)
11.5 Despatch/Analysis Phase
Up to this point in the process, Quality Control has been entirely in the hands of those planning and carrying out the water quality sampling, and as such a high degree of control can be exercised. Once samples leave the site, external parties are introduced into the process and this should be managed carefully.
The first external party introduced is the courier, which should be suitable for the transport of Class 7 radioactive materials as part of the Carriage of Dangerous Goods Regulations [58]. The courier should also ideally hold ISO 9001 & 14001 accreditation to ensure compliance with quality and environmental standards.
Guidance on selecting the analytical testing laboratory, including quality certification requirements, was presented in Section 5.5. Laboratory procedures and performance specifications for each analysis should also be examined and agreed in writing to ensure they meet with programme requirements. In addition, procedures for sample reception and registration, sample preservation and preparation, reporting and data management (including QC arrangements) should also be agreed in advance. It is good practice for the SLC to perform periodic audits on the analytical laboratories (either directly or via any prime contractor delivering the monitoring programme). Any non-conformances identified should be recorded and the laboratories notified so that they can log these customer-raised non-conformances on their quality management system.
Should the decision be made to replace an incumbent analytical testing laboratory, it is good practice to send duplicate sets of water samples from at least one monitoring round to both the incumbent and the replacement laboratory. This duplication is required to determine whether there is any statistical difference in the analytical data returned and to ensure continuity in time series data. Inter-comparison should continue until the SLC is confident that inter-laboratory differences are not significant. In order to distinguish between inter- and intra-laboratory variation, a carefully

NIGLQ Nuclear Industry Code of Practice for Routine Water Quality Monitoring Page 107
designed protocol is necessary, ideally involving duplicates to each laboratory. An appropriate protocol is given by EURACHEM/CITAC [84].
The use of Chain of Custody documentation extends into the despatch and analysis phase. Chain of Custody documents should be prepared for each sample or batch of samples and should record details of sample preparation, preservation and storage, required analytical schedule, off-site consignment to the testing laboratory and receipt by the testing laboratory. Subsequent to testing, the surplus portions of the samples may be returned to the SLC for long-term archiving, storage or disposal, or may be disposed by the analytical testing laboratory in accordance with UK legislation. The chain of custody document should record these transfers.
Further information on QC is provided by EA [23]. It should be emphasised that it is most profitable to weight QC effort at the start of the programme to eliminate any major errors without significant loss of data.
11.6 Action Phase
Although beyond the scope of this document, the use of a QA programme should extend into any actions carried out as a result of the water quality monitoring programme, including remedial action and modification to the monitoring plan. The results of any actions should feed back into the routine monitoring, which may include increasing or reducing the frequency of monitoring and/or the analytical suite.

NIGLQ Nuclear Industry Code of Practice for Routine Water Quality Monitoring Page 108
12 References 1 HSE (2011). Licence Condition Handbook (October 2011).
2 European Parliament and the Council of the European Union (2000). Directive 2000/60/EC of the European Parliament and of the Council of 23 October 2000 establishing a framework for Community action in the field of water policy (The Water Framework Directive).
3 EA/SEPA (2010). Radiological Monitoring Technical Guidance Note 1. Standardised Reporting of Radioactive Discharges from Nuclear Sites, May 2010, Version 1.0
4 EA/SEPA/FSA (2010). Radiological Monitoring Technical Guidance Note 2. Environmental Radiological Monitoring, December 2010, Version 1.0
5 US EPA (2002). Guidance for Choosing a Sampling Design for Environmental Data Collection, United States Environmental Protection Agency. EPA QA/G-5S, 2002. EPA/240/R-02/005.
6 US EPA (2006). Guidance on Systematic Planning Using the Data Quality Objectives Process. United States Environmental Protection Agency. EPA QA/G-4.
7 United Nations Environment Programme & World Health Organisation (1996). Water Quality Monitoring – A Practical Guide to the Design and Implementation of Freshwater Quality Studies and Monitoring Programmes.
8 UKTAG (2007). UKTAG Task 12(a) Guidance on Monitoring Groundwater (Groundwater Task Team), Version 9 (Public Working Draft).
9 HSE/EA (2000). Memorandum of Understanding between the Environment Agency and the Health and Safety Executive. July 2000.
10 HSE/SEPA (2002). Memorandum of Understanding between the Health and Safety Executive and the Scottish Environment Protection Agency on Matters of Mutual Concern at Licensed Nuclear Sites in Scotland. March 2002.
11 SAFEGROUNDS (2010). The UK regulatory framework for contaminated land on nuclear-licensed sites and defence sites. CIRIA W36.
12 EA (2012). Groundwater Protection: Principles and practice (GP3), November 2012, Version 1.
13 EA (2004). Model procedures for the Management of Land Contamination. Contaminated Land Report 11.
14 EA (2001). Guide to Good Practice for the Development of Conceptual Models and the Selection and Application of Mathematical Models of Contaminant Transport Processes in the Subsurface. National Groundwater & Contaminated Land Centre Report NC/99/38/2.
15 EA (2002). Guidance on the Characterisation and Remediation of Radioactively Contaminated Land.
16 British Standards Organisation (2010). Code of Practice for Site Investigations. BS 5930:1999+A2:2010.
17 British Standards Organisation (2011). Investigation of Potentially Contaminated Sites. Code of Practice. BS10175:2011+A1:2013.
18 NIGLQ (2012). Industry Guidance: Qualitative Risk Assessment for Land Contamination, including Radioactive Contamination. Version 1.1.
19 SAFEGROUNDS (2009). Good Practice Guidance for Site Characterisation, Version 2. CIRIA W30.
20 SEPA (2014). Assigning groundwater assessment criteria for pollution inputs. Position Statement WAT-PS-10-01, version 3.0, August 2014.

NIGLQ Nuclear Industry Code of Practice for Routine Water Quality Monitoring Page 109
21 EA (2011). Horizontal Guidance Note H1 – Annex J3. Additional guidance for
hydrogeological risk assessments for landfills and the derivation of groundwater control levels and compliance limits. GEHO0212BULU-E-E, Version 2.
22 British Standards Organisation (2013). Water Quality – Sampling – Part 6: Guidance on sampling of rivers and streams. BS ISO 5667-6: 2014
23 EA (2003). Guidance on Monitoring of Landfill Leachate, Groundwater and Surface Water, LFTGN02.
24 SEPA (2003). Guidance on Monitoring of Landfill Leachate, Groundwater and Surface Water Version 2, July 2003.
25 National Nonpoint Source Monitoring Program (2008). Surface Water Flow Measurement for Water Quality Monitoring Projects. Technotes 3.
26 British Standards Organisation (2007). Hydrometry – Measurement of Liquid Flow in Open Channels Using Current-Meters of Floats, BS EN ISO 748:2007.
27 British Standards Organisation (1996). Hydrometry – Measurement of Liquid Flow in Open Channels Part 1: Guidelines for selection, establishment and operation of a gauging station. BS 3680-3B:1997.
28 International Standards Organisation (2010). Hydrometry – Measurement of Liquid Flow in Open Channels Part 2: Determination of the stage-discharge relationship. ISO 1100-2:2010.
29 EA (1998). Directorate of Water Management Hydrometric Manual, Volume 34, chapters 1-12.
30 British Standards Organisation (2010). Water quality - sampling. Part 22: Guidance on the design and installation of groundwater monitoring points. BS ISO 5667-22:2010
31 EA (2006). Guidance on the Design and Installation of Groundwater Quality Monitoring Points. Science Report SC020093.
32 CL:AIRE Technical Bulletin 2, Multilevel Sampling Systems, TB2, April 2002
33 McMillan L.A. et al. 2014. Influence of vertical flows in wells on groundwater sampling. Journal of Contaminant Hydrology, 2014.
34 EA (2012). Good Practice for Decommissioning Redundant Boreholes and Wells, LIT 6478 / 657_12. October 2012.
35 Natural Scotland and SEPA, Good Practice for Decommissioning Redundant Boreholes and Wells, 0728_AP 07/10, July 2010
36 Nuclear Decommissioning Authority (2010), Geological Disposal: Radionuclide Behaviour Status Report, NDA Report NDA/RWMD/034, December 2010
37 OPSI (2010). The Water Supply (Water Quality) Regulations 2000. Statutory Instrument 2000 No. 3184.
38 EA (2000). Guidance on the Assessment and Monitoring of Natural Attenuation of Contaminants in Groundwater. R&D Publication 95.
39 EA (2005). The UK Approach for Evaluating Human Health Risks from Petroleum Hydrocarbons in Soils. Science Report P5-080/TR3.
40 TPHCWG (1997). Selection of Representative TPH Fractions based on Fate and Transport Considerations, Volume 3. Amherst Scientific Publishers.
41 European Commission (2012). Council Directive 2013/51/EURATOM of 22 October 2013 laying down requirements for the protection of the health of the general public with regard to radioactive substances in water intended for human consumption.

NIGLQ Nuclear Industry Code of Practice for Routine Water Quality Monitoring Page 110
42 Drinking Water Inspectorate (2010). Guidance on the Implementation of the Water Supply
(Water Quality) Regulations 2000 in England
43 Drinking Water Inspectorate (2010). Guidance on the Implementation of the Water Supply (Water Quality) Regulations 2010 in Wales.
44 Currie, L.A, (1968). Limits for Qualitative Detection and Quantitative Determination. Analytical Chemistry, 40, 1968.
45 International Standards Organisation (2009). Determination of the Characteristic Limits (Decision Threshold, Detection Limit and Limits of the Confidence Interval) for Measurements of Ionising Radiation – Fundamentals and Application). ISO 11929:2009.
46 British Standards Organisation (1987). Water Quality Sampling – Part 4: Guidance on sampling from lakes, natural and man-made, BS 5667-4: 1987
47 International Standards Organisation (2009). Water Quality Sampling – Part 11: Guidance on sampling of groundwaters, BS ISO 5667-11: 2009
48 ASTM (2002). ASTM D6771-02: Standard Practice for Low-Flow Purging and Sampling for Wells and Devices used for Groundwater Quality Investigations. Withdrawn in 2011.
49 USEPA 2010. Low stress (low flow) purging and sampling procedure for the collection of groundwater samples from monitoring wells. EQASOP-GW 001 Region 1. Revision Number 3, January 19 2010. 30pp
50 British Standards Organisation (1997), Measurement of Liquid Flow in Open Channels. BS ISO 748:1997.
51 EA (2003). A Guide to Monitoring Water Levels and Flows at Wetland Sites.
52 EA (2003). An Illustrated Handbook of DNAPL Transport and Fate in the Subsurface, 2003
53 CL:AIRE (2014). An Illustrated Handbook of LNAPL Transport and Fate in the Subsurface, CL:AIRE, London, ISBN-978-1-905046-24-9, 2014
54 Serco Technical Services, Rapid characterisation of contaminated material that does not have a reliable gamma fingerprint. Task 2: Literature Review. Serco Technical Services Report SERCO/TAS/E.003944/Report 002, Issue 1, April 2010. [Report for NDA Direct Research Portfolio, available from [email protected].]
55 Serco Technical Services, Rapid characterisation of contaminated material that does not have a reliable gamma fingerprint. Task 1: Identify the Problem. Serco Technical Services Report SERCO/TAS/E.003944/Report 001, Issue 1, December 2009. [Report for NDA Direct Research Portfolio, available from [email protected].]
56 Standing Committee of Analysts (1996). General Principles of Sampling Waters and Associated Materials 2
nd Edition (Estimation of Flow and Load. Methods for the
Examination of Waters and Associated Materials). HMSO, London.
57 British Standards Organisation (2012). Water Quality. Sampling, preservation and handling of water samples. BS ISO 5667-3:2012.
58 OPSI (2009). Health & Safety: The Carriage of Dangerous Goods and Use of Transportable Pressure Equipment Regulations 2009. Statutory Instrument No. 1348.
59 United Nations Economic Commission for Europe (2013). European Agreement Concerning the International Carriage of Dangerous Goods by Road (ADR).
60 CIRIA (2007). SAFEGROUNDS: Good practice guidance for land quality records management for nuclear-licensed and defence sites. CIRIA W21.
61 NDA (2008). Waste Package Specification and guidance Documentation – WPS/870: Long-term Management of Information and Records: Explanatory Material and Guidance. March 2008, Number 9698928.

NIGLQ Nuclear Industry Code of Practice for Routine Water Quality Monitoring Page 111
62 World Health Organisation (2011). Guidelines for Drinking Water Quality (4
th Edition).
63 EA (2012). Chemical Standards Database. Available from: http://evidence.environment-agency.gov.uk/chemicalstandards/
64 EA (2008). Groundwater trigger levels, minimum reporting values and limits of detection. Fact Sheet, 30 April 2008.
65 EA (2003). Hydrogeological Risk Assessments for Landfills and the Derivation of Groundwater Control and Trigger Levels. LFTGN 01.
66 European Commission (2008). Directive 2008/105/EC of the European Parliament and of the Council, 16 December 2008.
67 European Commission (2006). Directive 2006/118/EC of the European Parliament and of the Council, 12 December 2006.
68 SEPA (2009). Groundwater Protection Policy for Scotland V3 November 2009, Environmental Policy Number 19.
69 UKTAG (2013). Updated Recommendations on Environmental Standards. River Basin Management (2015-21), SRS-2012.
70 SEPA (2013). Supporting Guidance (WAT-SG-53). Environmental Standards for Discharges to Surface Waters.
71 NRPB (1998). Revised Generalised Derived Limits for Radioisotopes of Strontium, Ruthenium, Iodine, Caesium, Plutonium, Americium and Curium. NRPB 9(1), 1-34.
72 NRPB (2005). Generalised derived limits for radioisotopes of Hydrogen, Carbon, Phosphorous, Sulphur, Chromium, Manganese, Cobalt, Zinc, Selenium, Technetium, Antimony, Thorium and Neptunium. NRPB 16(3), 1-43.
73 DEFRA (2011). Guidance on the scope of and exemptions from the radioactive substances legislation in the UK. Guidance Document September 2011, Version 1.0.
74 NRPB (1993). Public exposure: guidance on the 1990 recommendations of ICRP. NRPB, 4(2), 27-41.
75 NRPB (1998). Application of generalised derived limits. NRPB, 9(1), 35-60.
76 Grubbs, F.E. (1969). Procedures for Detecting Outlying Observations in Samples. Technometrics, 11(1), 1-21.
77 Gibbons, R.D. (1999). Use of combined Shewhart-CUSUM control charts for groundwater monitoring applications. Groundwater, 37, 682-691.
78 EA (2012). Water Quality Planning: Codes of Practice for Data Handling. 111_07_SD02 Version 3.
79 USGS (2002). Techniques of Water Resources Investigations of the United States Geological Survey. Book 4, Hydrologic Analysis and Interpretation. Chapter A3: Statistical methods in Water Resources.
80 McBride, G.B. (2005). Using Statistical Methods for Water Quality Management: Issues, Problems and Solutions. Wiley Interscience.
81 Helsel, D.R. (2012). Statistics for Censored Environmental Data using Minitab and R.
82 British Standards Organisation (2006). Water Quality Sampling – Part 1: Guidance on the design of sampling programmes and sampling techniques, BS EN ISO 5667-1: 2006.
83 EA (2010). Performance Standards and Test Procedures for Portable Water Monitoring Equipment, Version 2.1.
84 EURACHEM/CITAC: Measurement uncertainty arising from sampling. A guide to methods and approaches” www.rsc.org/images/EURACHEM1_tcm18-102815.pdf

NIGLQ Nuclear Industry Code of Practice for Routine Water Quality Monitoring Page A1.1
Appendix 1: Example Borehole Quality Assessment. Based on a form provided courtesy of Sellafield Ltd
Decision Rule Number
Quality Characteristic
Decision Rule Notes
1 Screen length A groundwater monitoring point (GMP) with a screen length of greater than xm (to be chosen by site) would not be included in the groundwater monitoring network.
In cases where the screen length is greater than xm (to be chosen by site), but is positioned within a single water-bearing unit a professional judgement can be made that this decision rule may be relaxed.
2 Screen position A GMP with a screen length that connects more than one discrete water bearing unit as defined by the updated conceptual model would not be included in the groundwater monitoring network. This rule also applies to screen lengths less than or equal to xm (see above).
None
3 Silt level A GMP that exhibits a silt level that extends into the screen interval and covers 20% of the screen length would not be included in the groundwater monitoring network.
Note 1: This decision rule will not be relaxed for screen lengths less than or equal to xm (to be chosen by site). Note 2: In cases where the screen length is greater than xm (to be chosen by site), there may be a sufficient water column adjacent to the screen interval that will allow the collection of a representative formation water sample. In these cases, the decision rules addressing sampling screen length and screen position relative to water bearing hydrogeological units will be consulted to support a professional judgement that this decision rule may be relaxed. Other factors to be considered in the application of professional judgement include length of the sample collection kit (bladder pump or bailer) and experience with drawdown during historical sampling.

NIGLQ Nuclear Industry Code of Practice for Routine Water Quality Monitoring Page A1.2
Decision Rule Number
Quality Characteristic
Decision Rule Notes
4 Damaged GMP A GMP that does not allow access to the appropriate sample point depth (e.g. middle of the screen interval) would not be included in the groundwater monitoring network.
Professional judgement would be used to evaluate alternative sampling techniques/kit that could allow access to the appropriate sample point depth.
5 GMP subject to surface water flooding
GMP with identified flooding potential would not be included in the groundwater monitoring network.
Flooding potential should be eliminated through head-works rehabilitation. This rehabilitation can include:
• Incorporating water-tight caps on affected GMPs
• Raising the top of the GMP above the flood level
• Providing surface construction solutions to divert or drain surface water from the head-works
After a monitoring well has been successfully rehabilitated to eliminate its potential to flood, it can be considered for reinstatement into the monitoring well network.
6 Access constraints
Monitoring wells that have a history of not being able to be accessed would not be included in the groundwater monitoring network.
Work with affected Operating Unit to identify options to allow long-term access.

NIGLQ Nuclear Industry Code of Practice for Routine Water Quality Monitoring Page A2.1
Appendix 2: Example borehole maintenance programme. Based on a form provided courtesy of Amec Foster Wheeler
The information below comprises an example borehole maintenance programme developed by AMEC for a UK Nuclear Licensed Site. Use of this or a similar programme will contribute to obtaining fit for purpose samples to meet monitoring programme objectives. Item Details Borehole construction details
• Provide laminated printout of construction details for checking/reference in the field.
• Information should include: Borehole Log, Depth, diameter, number and depth of groundwater monitoring point(s), casing materials and diameter, depth and length of screened section(s), backfill type and thickness, date of construction, height in metres above ordnance datum (m OD).
• Other information for reference should include the nature of the subsurface environment (e.g. location of aquifers and aquitards, standing water level, zones and types of known contamination).
Visual Inspection of Wellhead whenever visited or quarterly
• Check access (vehicular & pedestrian)
• Inspect surface seal/concrete pad
• Check adjacent ground
• Check for protected species/other habitation signs
• Check external wellhead/manhole cover
• Condition of brickwork
• Condition of drainage slot
• Condition of lid
• Condition of lock (lubricate if required)
• Check borehole identification plate (condition and correspondence with monitoring point register)
• Borehole colour video (every 5 years)
Visual Examination of Wellhead whenever visited or quarterly
• Check caps are in place and in good condition
• Check annulus seal is intact, check whether casing has suffered corrosion or degradation where possible.
• Check dip mark OD datum point (where painted ensure mark is clearly visible and does not coat the inside of the casing)
• Ensure reference marks are on both the casing and the grout apron

NIGLQ Nuclear Industry Code of Practice for Routine Water Quality Monitoring Page A2.2
Item Details
Installed Equipment
• Remove, check, calibrate, clean and service (if possible)
• Re-install (use fixing points to secure support cables)
Borehole Dipping
• Dip well for water level before disturbing the water level by
pumping etc. (review maximum and minimum water levels annually or biennially with comparison to the level at the top of the screen intake (note that samples taken where the water level is below the top of the screen may vary from those taken where the water level is above the top of the screen)
• Dip to base of well (minimum annually) & compare with log
• If base of well > lower screen depth then proceed with sampling
• If base of well < lower screen depth (evidence of silting) then consider re-developing by air-lifting
• After re-development, purge and sample
During Sampling
• Record drawdown level where possible and periodically review.
Where boreholes are pumped the water level should be recorded before and after pumping; this can provide an indication of any change in yield, and if the drawdown increases for the same pumping rate, may indicate a blockage around the well screen)
• Provide qualitative estimate of sediment loading
• Turbidity
• Biofouling (IRB, SRB etc) – quarterly
Hydraulic Performance
• Hydraulic Conductivity- every 5 years or when significant sediment has accumulated
• Slug or pump tests – every 5 years followed by redevelopment is necessary

NIGLQ Nuclear Industry Code of Practice for Routine Water Quality Monitoring Page A2.3
Item Details
Post monitoring
• Document visit
• Record changes
• Record maintenance
• Alert relevant stakeholders regarding any maintenance problems noted
• Check analytical data against historical records and identify any statistically significant change(s)
• Consider comprehensive borehole survey if maintenance problems are suspected as a cause of the change(s)
• Compare water levels from all boreholes against others in the same groundwater system (marked departures in trend may reflect poor borehole design or deterioration in the borehole structure)

NIGLQ Nuclear Industry Code of Practice for Routine Water Quality Monitoring Page A3.1
Appendix 3: Example QC Check-List. Provided courtesy of DSRL
This is in addition to checks for the QC samples
Consideration Criteria Elimination Criteria
• Are the values credible?
• Are results internally consistent?
• How do they compare with previous results for the same location, and general expectations?
• Have the correct samples been measured?
• Could the samples have been contaminated?
• Could there be dilution errors?
• Are there unexpected interferences outside the range that the lab has compensated for (most commonly a problem with more saline samples)?
• Have the correct units been used?
• Are there any transcription errors?
Internal Consistency – Points of Reference
• Ion balance error on major ions <10%.
• Ratio Na/Cl in mg/l typically < 0.64.
• Ratio (Ca+Mg)/(Alkalinity + SO4) calculated in equivalents (typically 1 or slightly higher).
• Most abundant cations are Ca and Na, (K and Mg less abundant), most abundant anions are alkalinity, chloride and sulphate.
• Na, K, Mg, Cl, sulphate all have potential seawater origin.
• NO3 or NH3 seldom occur together.
• Expect low Fe and Mn if NO3 is present.
• Some trace metals will usually be present, some will be seldom present. Milligram/litre values of a number of metals will result in visibly coloured samples.
• If organics are present, expect to see breakdown products, e.g.
o TCE + dichloroethenes + vinyl chloride
o TCA + dichloroethane
o Nitroanilines from TNT
• Presence of dichloromethane most likely cross-contamination from analytical lab.
• Bromochloromethanes and bromoform are usually products of chlorination of drinking water.
• Bis (2-ethylhexyl) phthalate often present, including in human fingerprints.
• Petrol range organics include chlorinated solvents.
• DRO and TPH include many things that are not hydrocarbons – they do not represent a specific substance.
• TPH seldom occur singly and usually represent a pattern. Examination of chromatograms will allow determination of whether the pattern is reasonable. For example, diesel is centred on C16, heavy fuel oil around C20.
• Individual PAHs seldom occur singly and usually have a pattern.
• PCBs are unusual in groundwater – their confirmed presence indicates a real contamination problem close to the monitoring point. These substances are highly insoluble and very strongly sorbed.

NIGLQ Nuclear Industry Code of Practice for Routine Water Quality Monitoring Page A3.2
• Concentrations of Cs-137 >0.1 Bq/L, Pu-238,239,240 > 0.001 Bq/L, Am-241 > 0.001 Bq/L are unusual in water as they are strongly sorbed. Values an order of magnitude greater than these are cause for concern.
• As a rule of thumb, in fresh water samples, total β = Cs-137 + 2 × Sr-90 (after Y-90 ingrowth). There may be a laboratory bias but it should be consistent. At higher salinities, gross β will correlate with potassium on the basis that 1 mg/L K = 0.030 Bq/L.
• Total α should bear a relationship to the sum of alpha emitters although Ra-226 may also be present.
• U-234/U-238 activity ratio should be in the range 1-5 for natural U (enhanced over the theoretical 1:1 by α-recoil).
• (Pu-239+240)/Pu-238 ranges from around 10 in international fallout to ~2 in recycled Pu. Determine whether the measured ratios are reasonable, and also where Am-241 fits in fingerprints. Pu-241 will not be detected without Pu-239+240, but the reverse may be true.
• Most natural γ-emitters should be absent in water – expect to see K-40 in higher TDS samples. Other nuclides that may be seen are Pb-212, Bi-212 and Tl-208 in the Th-232 series, and Pb-214 and Bi-214 in the U-238 series. Pb-210 has a high detection limit and there are technical problems with Ra-226 results especially from water.
• H-3 and C-14 are not included in gross-β. Sensitivity to Tc-99 is low.
Comparison with previous data
• Check with previous min, max and median or mean from the same sampling point (easily automated).
• Is the result credible in the context of the local area’s process history?

Not Protectively Marked
NIGLQ Nuclear Industry Code of Practice for Routine Water Quality Monitoring Page A4.1
Appendix 4: Example field form. Based on a form provided courtesy of Amec Foster Wheeler Groundwater Sample Collection Form Site Name Piezo Name Survey Personnel Date: Sample ID1 1 see footnotes Sampling Strategy and Equipment Datum point desc2 Sample Depth (m below datum)3 Sampling equipment & Purge Type4 Sample Type5 CL / GL / TL DB/SC/OTHER………. DBLF NN/DU/FB/TB/OTHER………… 4 if different from datum provided in borehole initial conditions; 5,6,7 see footnotes Sample purge/collection information Time hrs: mins purge-scan no. Groundwater Dip Initial Dip SAMPLE INFO Final Dip Depth to water (mbd) Depth to base (mBGL) Pump dial setting Pumping rate (L/min)

Not Protectively Marked
NIGLQ Nuclear Industry Code of Practice for Routine Water Quality Monitoring Page A4.2
Total volume pumped (m3) Colour / appearance/Odour Water quality measurements (note multiple reasdings will be required if tracking chemical stability of water removed during sampling Use flow through cell? Y/N Temperature oC EC mS/cm pH pH DO mg/l ORP (Ag) mV Turbidity NTU Phenolphthalein Alkalinity (CaCO3 P) mg/l N/A Total Alkalinity (CaCO3 T) mg/l N/A Sample Comments Checkers Comments Name Date QA Checked Footnotes

Not Protectively Marked
NIGLQ Nuclear Industry Code of Practice for Routine Water Quality Monitoring Page A4.3
1 Sample ID A unique identifier for the sample. The start of the sample ID should always begin with the Location ID (eg TCRW), followed by a forward slash "/" , followed by the material the sample was taken from. In this case W= water, followed by a forward slash "/", followed by the date in a DDMMYY format. e.g. a groundwater sample taken from piezometer 6902p1 on the 21
st May 2007, would have the following Sample ID: 6902p1/W/210507
If more than one sample is taken from a piezometer in a day then this may be provided by an additional forward slash "/" , followed by the chronological order the sample was taken in., e.g. e.g. 6902p1/W/210507/1; 6902p1/W/210507/2 etc…. For QC samples associated with a groundwater sample e.g. Duplicates, field blanks, the sample type code (see Note 7 below) should be placed at the end of the sample ID. Thus for a field blank taken during sampling of: 6902p1/W/210507 would be called…6902p1/W/210507/FB For QC samples NOT associated with a particular groundwater sample e.g. trip blanks, the site name should replace the sample ID, and the Sample type code (see Note 7 below) should replace the W. e.g. Sellafield /W/210507/TB Additional notes relating to the nature of the sample should be added in the sample comments.
2 Datum point description
CL = Well completion Cover level, GL = Ground level, TL = top of piezometer liner
3 Sample Depth (m below datum)
DB = Depth of installed dedicated bladder pump, SC = over entire screen, OTHER= e.g. depth of portable low flow pump.
4 Sampling equipment & Purge Type
Sampling Equipment
AP = Anaerobic Micropurging Pump. BN = Bailer with no well purging. BP = Bailer with well purging. CB=Rotary core barrel. DB=Dedicated Bladder Pump. P= Stationary Piston Sampler. PB=Portable Bladder Pump. PG=Portable Gas Sampler. OT=Other, please specify
Purge Type
3WV=3 Well Volumes, LF=Low flow, P=Passive, OT=Other, please specify Appropriate sampling equipment and purging codes should be linked e.g. “DBLF”
5 Sample Type (NN=Normal, DU=Duplicate, FB=Field blank, TB=Trip Blank, OT=Other, please specify