ntpc ltd. - indbank ltd 2.pdf · of vallur thermal power project of the company tamil nadu energy...
TRANSCRIPT
One year Price Chart
India’s biggest utility company, NTPC, was established in 1975 to accelerate
power development in India. NTPC's core business is engineering,
construction and operation of power generating plants. Apart from its major
operation of power production, NTPC has already ventured into consultancy,
power trading, ash utilisation and coal mining. With an electric power
generating capacity of 39,674 megawatts (MW), NTPC has embarked on plans
to become a 75,000 MW company by 2017. In addition, under JVs, seven
stations are coal based while another station uses naphtha, LNG as fuel. The
company has set a target to have an installed power generating capacity of
1,28,000 MW by the year 2032.
Investor’s Rationale
Selling 9.5% stake in state-owned electric utilities company, NTPC is a
key element of the government's plan to reduce the trade deficit to 5.3% of
gross domestic product by the end of March, from 5.8% in FY’12, to avoid a
credit downgrade from global ratings agencies. The sale of 78.33 crore shares,
at the indicative price of `145.96, will fetch the government close to around
`120 bn, making it the biggest divestment in the current fiscal. With the NTPC
sale complete, the total divestment proceeds for FY’13 will touch nearly 22,000
crore. The government had set a divestment target of `300 bn for the fiscal.
Rating agency, Standard & Poor's (S&P) has stated that its rating on
NTPC (BBB-/Negative/--) is not affected by the Indian government's 'offer for
sale' on a part of its stake in the company. Further, the agency expects that the
government will remain NTPC's majority shareholder and the Ministry of Power
to retain administrative control over the board. The government's shareholding
drop in NTPC to 75% from 84.5% will not change the assessment of the
company's 'very strong' link with the government.
NTPC recorded a growth of 21.9% YoY in its standalone bottom-line at
`25.97 bn in Q3FY’13 primarily due to improved capacity addition resulting
higher generation and lower raw material cost. However, topline grew
marginally by 2.9% YoY at `15.77 bn on lower realization at `2.8/unit in
Q3FY’13 from `3.3/unit in Q2FY’13, as fuel cost dropped to `1.8/unit from
`2.0/unit on account of higher usage of domestic coal and lower contribution
of gas projects.
NTPC has got a green signal from the government for settlement of
dues of Delhi Electric Supply Undertaking which provides for payment to be
made by Government of National Capital Territory of Delhi to NTPC of `25.2
bn.
Rating BUY
CMP (`) 148
Target (`) 185
Potential Upside 25%
Duration Long Term
52 week H/L (`) 190.8/137.0
All time High (`) 290.0
Decline from 52WH (%) 22.4
Rise from 52WL (%) 8.0
Beta 0.5
Mkt. Cap (` bn) 1,220.7
Book Value (` bn) 90.2
Promoters 84.50 84.50 - 0
FII 4.39 3.95 0.44 0.08
DII 7.51 7.73 (0.22) 0.6
Others 3.60 3.82 (0.22) (0.68)
Shareholding Pattern
Dec’12 Sep’12 Diff.
Market Data
Y/E FY11A FY12A FY13E FY14E
Revenue (`bn) 576.1 658.9 723.6 814.0
EBIDTA (`bn) 144.4 154.4 167.0 191.2
PAT (`bn) 93.5 98.1 100.9 112.2
EPS (`) 11.3 11.9 12.2 13.6
P/E (x) 13.1 12.4 12.1 10.9
P/BV (x) 1.8 1.6 1.5 1.4
EV/EBIDTA(x) 10.7 10.4 10.0 9.2
RoA (%) 10.3 9.8 9.4 9.5
RoE (%) 13.6 13.1 12.5 12.8
Fiscal Year Ended
February 11, 2013
BSE Code: 532555 NSE Code: NTPC Reuters Code: NTPC.BO Bloomberg Code: NTPC:IN
NTPC LTD.

NTPC commenced units to raise the capacity
NTPC commissioned 2,820 MW generating capacity during FY’12, the highest ever in a year, surpassing
the record of 2,490 MW set in FY11. The capacity addition also includes 1,000 MW generated through its
joint ventures. Going ahead, the country's largest power producer has declared that the Unit 1 of 500 MW
of Vallur Thermal Power Project of the company Tamil Nadu Energy Co., a JV of NTPC and TNEB, is
declared on commercial operation. With this the total commercial capacity of Vallur Thermal Power
Project has become 500 MW and that of NTPC Group will reach to 38,174 MW.
NTPC has been operating its plants at high efficiency levels. Although, the company has 17.75% of the
total national capacity, it contributed 27.40% to the total power generation in FY12 due to its focus on
high efficiency. Further, it has also started its unit 5 of 500 MW of Rihand Super Thermal Power Station.
With this the commercial capacity of Rihand STPS will reach 2,500 MW and that of NTPC Group will be
37,674 MW.
In line with this, the Unit-III of 500 MW of Indira Gandhi Super Thermal Power Project at Jhajjar of Aravali
Power Company (APCPL) a JV of NTPC, Haryana Power Generation Corporation and Indraprastha Power
Generation Co. has been commissioned. With the start of this unit, the total capacity of NTPC group has
become 39,674 MW. With the coming of Unit-III, the total installed capacity of Indira Gandhi Super
Thermal Power Project has become 1,500 MW.
On the other hand, serious issues including Operation and maintenance (O&M) costs and return on
investment have cropped up between NTPC and Ceylon Electricity Board (CEB) over setting up of a 500-
MW power plant in Sri Lanka, which is expected to get solve soon to avoid further delay in
implementation of the project.
Installed Capacity of NTPC Group in FY’12
NTPC has started its 3 key
units namely 500 MW of
Vallur Thermal Power Project,
500 MW of Rihand Super
Thermal Power Station and
Indira Gandhi Super Thermal
Power Project.
Owned by NTPC MW
Coal based projects 28,695
Gas based projects 3,955
Sub-total 32,650
Joint Ventures & Subsidiaries
Coal based projects 2,424
Gas based projects 1,940
Sub-total 4,364
Total 37,014
* With the commissioning of 2,160 MW after FY’12, the installed capacity of NTPC’s Group has become 39,174 MW

Robust capacity addition- move to make unbreakable record
NTPC is India’s largest power generating company and accounts for 18.5% of India’s total installed
capacity as of March 31, 2012. It became a Maharatna company in May, 2010, one of the only four
companies to be awarded this status. NTPC is working on its plans to become a 75,000 MW company
by 2017. During FY12, NTPC has commissioned the highest ever generating capacity in a year of 2,820
MW, surpassing the record of 2,490 MW set in FY11. The capacity addition also includes 1000 MW
made through the joint venture Companies. NTPC Group currently has projects across 18 Indian States
including coal mining projects.
Under the 11th
Plan, NTPC's capacity addition was slower than expected on account of some execution
bottlenecks, as few major projects witnessed contractual and other issues. As NTPC overcomes the
issues pertaining to its large projects, this will lead to front-ended capacity addition in the 12th
Plan.
NTPC is aggressively planning to add capacity of 4,170 MW in FY13, out of which 2,660 MW added
during 9MFY’13, contributed to 24% of total addition in the country. This made the firm to earn total
revenue of $9.1bn and net income of $1.5bn in 9MFY’13. As per the estimate of Central Electricity
Authority's (CEA), NTPC in the 12th
plan period is making moves to attain capacity addition of 14,038
MW. Of this, 1,320 MW is expected over FY13-16, an average capacity addition of 330 MW/year. NTPC
is witnessing an orbit change in capacity addition under the 12th
Plan.
In the current uncertain macro environment, other developers are not likely to start new expansion or
are not capable with (high leverage, lack of PPA/FSA visibility, burden of existing unviable projects,
etc). This problem acts as an icing on cake and provides strong visibility in capacity addition growth for
NTPC over the next decade, making it better placed than other developers. NTPC offers better growth
option in the generation space. Even assuming a recovery in the sector, a new project could take
nearly 5 years for commissioning - a period of growth holiday for several developers, while NTPC
would continue to witness linear growth.
NTPC plans to add capacity of
4,170 MW in FY13, out of
which 2,660MW added during
9MFY’13, contributed to 24%
of total addition in India.
Capacity addition at glance

Demand-Supply scenario and capacity growth to propel generation growth
India’s power sector over past few years has been witnessing macro and micro challenges, with the
country’s power deficit at around 8.5%. The demand for electricity is continuously growing, driven by
high economic growth and boom in rural electrification. However, supply and supply parameters are
unable to run parallel mainly due to a fuel shortage. As per 12th
five year plan, there is a projection
for addition of 1,00,000 MW of new capacity and majority of these projects are coal fired power
plants. Currently, more than 50% of India’s installed generation capacity is coal-based. Over the last 5
years, the demand for coal has been growing at an average rate of 8-9% annually as compared to a 5-
6% increase in domestic production. This has widened the demand-supply gap, leading to growing
dependence on imported coal. In FY’12, the country imported around 100 million tonnes (MT) of coal
(including thermal and coking coal). The demand-supply gap of coal was 161.5 MT in FY’12 and is
likely to touch 185 MT over the next 5 years.
However, concerned over the coal issue, the government has stated that acquisition of coal mines
overseas should be done in an aggressive manner to meet the energy requirements. Further, the
efforts by the ministry have resulted in the acquisition of coal mines in Mozambique by Coal India Ltd
(CIL), while private firms have been acquiring mines in countries such as Australia, South Africa and
South America.
NTPC that uses up to 10% of imported coal to be blended with domestic fuel has imported 16 MT of
coal in FY’13 up from 12 MT in FY12 to meet its requirements. In a move to ease the domestic coal
deficit concern, NTPC has entered into long-term Fuel Supply Agreements with existing suppliers over
and above the coal production from the 6 coal blocks allocated by the Government to the company.
Strategic alliance with CIL provides a competitive edge to NTPC over its competitors.
India’s energy deficit scenario (in bn units)
Over the last 5 years, the demand
for coal has been growing at an
average rate of 8-9% annually as
compared to a 5-6% increase in
domestic production.
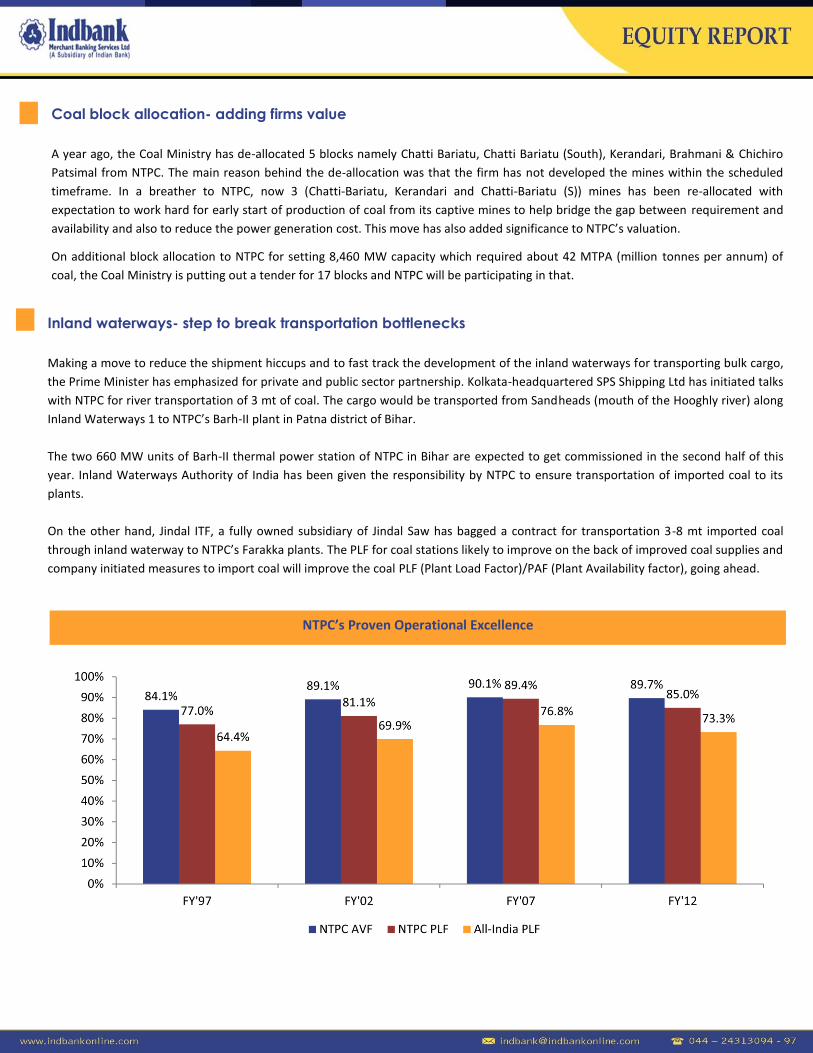
Coal block allocation- adding firms value
A year ago, the Coal Ministry has de-allocated 5 blocks namely Chatti Bariatu, Chatti Bariatu (South), Kerandari, Brahmani & Chichiro
Patsimal from NTPC. The main reason behind the de-allocation was that the firm has not developed the mines within the scheduled
timeframe. In a breather to NTPC, now 3 (Chatti-Bariatu, Kerandari and Chatti-Bariatu (S)) mines has been re-allocated with
expectation to work hard for early start of production of coal from its captive mines to help bridge the gap between requirement and
availability and also to reduce the power generation cost. This move has also added significance to NTPC’s valuation.
On additional block allocation to NTPC for setting 8,460 MW capacity which required about 42 MTPA (million tonnes per annum) of
coal, the Coal Ministry is putting out a tender for 17 blocks and NTPC will be participating in that.
Inland waterways- step to break transportation bottlenecks
Making a move to reduce the shipment hiccups and to fast track the development of the inland waterways for transporting bulk cargo,
the Prime Minister has emphasized for private and public sector partnership. Kolkata-headquartered SPS Shipping Ltd has initiated talks
with NTPC for river transportation of 3 mt of coal. The cargo would be transported from Sandheads (mouth of the Hooghly river) along
Inland Waterways 1 to NTPC’s Barh-II plant in Patna district of Bihar.
The two 660 MW units of Barh-II thermal power station of NTPC in Bihar are expected to get commissioned in the second half of this
year. Inland Waterways Authority of India has been given the responsibility by NTPC to ensure transportation of imported coal to its
plants.
On the other hand, Jindal ITF, a fully owned subsidiary of Jindal Saw has bagged a contract for transportation 3-8 mt imported coal
through inland waterway to NTPC’s Farakka plants. The PLF for coal stations likely to improve on the back of improved coal supplies and
company initiated measures to import coal will improve the coal PLF (Plant Load Factor)/PAF (Plant Availability factor), going ahead.
NTPC’s Proven Operational Excellence

Growth in Generation NTPC vs Rest of India
Witnessed a decent performance in Q3FY’13
NTPC posted a robust growth in its standalone net profit by 21.9% YoY at `25.97 bn in Q3FY’13. The key growth factors contributed in
lifting the bottom line includes the better capacity addition, higher generation and lower raw material cost. Lower employee benefits
expense also helped in pushing the company's quarterly profit higher. The profit from generation business (before computing tax and
interest) grew by 30.6% to `34.03 bn. The gross generation by the company increased by 6.6% YoY to 60.1bn units. Further, higher PAF
at 88.6% (Q2FY’12: 85.3%) for coal-based plants also boosted the bottom line. While, the PAF for gas-based plants fell marginally to
93.8% (Q3FY’12: 94.5%). Coal and Gas PLFs for Q3FY’13 stood at 84.1% and 59% respectively.
NTPC reported a muted performance in its top line, as the revenue grew modestly by 2.9% YoY to `157.75 bn driven by the fall in the
realization from `3.3/unit in Q2FY’13 to `2.8/unit in Q3FY’13, as fuel cost fell to `1.8/unit from `2.0/unit hampered by higher usage of
domestic coal and lower contribution of gas projects. However, in Q3FY’13, total installed capacity increased to 38.2 GW following
commercialization of 0.5GW Rihand STPS and 0.5GW Vallur TPS (JV project with TNEB).
The EBITDA margin improved by 576bps YoY to 25.5% in Q3FY’13, propped up by lower fuel and employee expenses (as % of sales) by
294bps and 7bps YoY to 64% and 4.4%, respectively.
Growth in Installed Capacity NTPC vs Rest of India
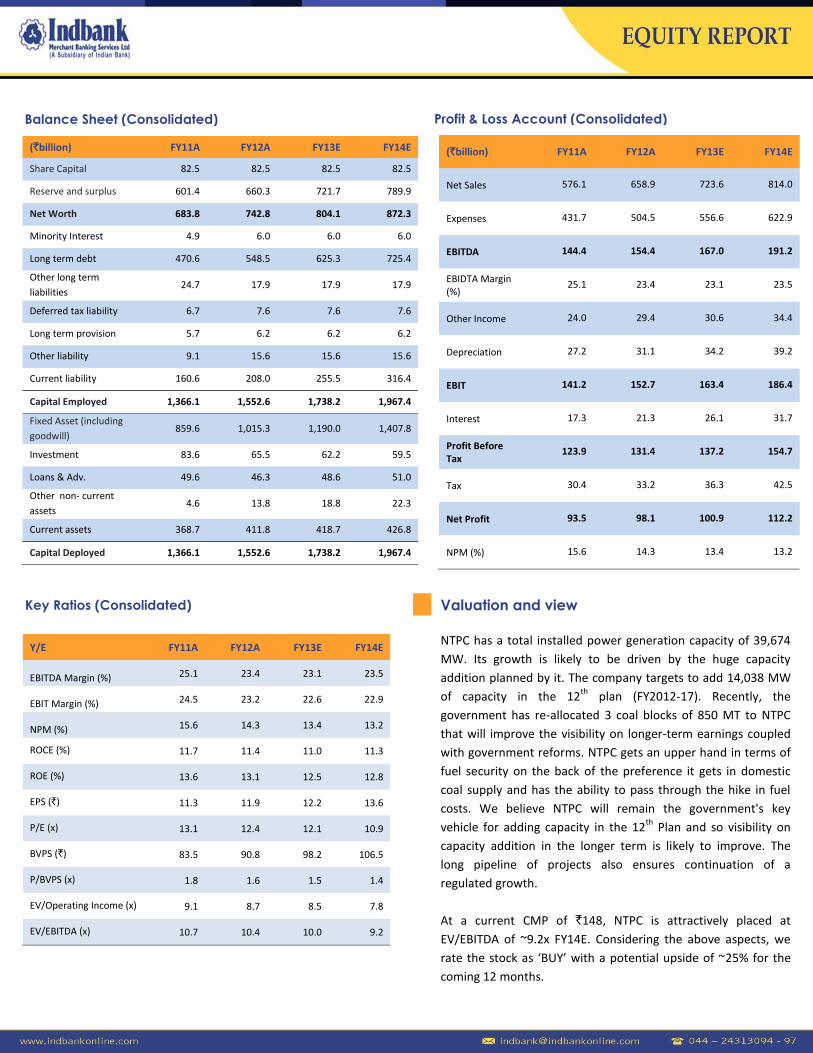
Key Ratios (Consolidated)
Profit & Loss Account (Consolidated) Balance Sheet (Consolidated)
Valuation and view
NTPC has a total installed power generation capacity of 39,674
MW. Its growth is likely to be driven by the huge capacity
addition planned by it. The company targets to add 14,038 MW
of capacity in the 12th
plan (FY2012-17). Recently, the
government has re-allocated 3 coal blocks of 850 MT to NTPC
that will improve the visibility on longer-term earnings coupled
with government reforms. NTPC gets an upper hand in terms of
fuel security on the back of the preference it gets in domestic
coal supply and has the ability to pass through the hike in fuel
costs. We believe NTPC will remain the government's key
vehicle for adding capacity in the 12th
Plan and so visibility on
capacity addition in the longer term is likely to improve. The
long pipeline of projects also ensures continuation of a
regulated growth.
At a current CMP of `148, NTPC is attractively placed at
EV/EBITDA of ~9.2x FY14E. Considering the above aspects, we
rate the stock as ‘BUY’ with a potential upside of ~25% for the
coming 12 months.
(`billion) FY11A FY12A FY13E FY14E
Share Capital 82.5 82.5 82.5 82.5
Reserve and surplus 601.4 660.3 721.7 789.9
Net Worth 683.8 742.8 804.1 872.3
Minority Interest 4.9 6.0 6.0 6.0
Long term debt 470.6 548.5 625.3 725.4
Other long term
liabilities 24.7 17.9 17.9 17.9
Deferred tax liability 6.7 7.6 7.6 7.6
Long term provision 5.7 6.2 6.2 6.2
Other liability 9.1 15.6 15.6 15.6
Current liability 160.6 208.0 255.5 316.4
Capital Employed 1,366.1 1,552.6 1,738.2 1,967.4
Fixed Asset (including
goodwill) 859.6 1,015.3 1,190.0 1,407.8
Investment 83.6 65.5 62.2 59.5
Loans & Adv. 49.6 46.3 48.6 51.0
Other non- current
assets 4.6 13.8 18.8 22.3
Current assets 368.7 411.8 418.7 426.8
Capital Deployed 1,366.1 1,552.6 1,738.2 1,967.4
Y/E FY11A FY12A FY13E FY14E
EBITDA Margin (%) 25.1 23.4 23.1 23.5
EBIT Margin (%) 24.5 23.2 22.6 22.9
NPM (%) 15.6 14.3 13.4 13.2
ROCE (%) 11.7 11.4 11.0 11.3
ROE (%) 13.6 13.1 12.5 12.8
EPS (`) 11.3 11.9 12.2 13.6
P/E (x) 13.1 12.4 12.1 10.9
BVPS (`) 83.5 90.8 98.2 106.5
P/BVPS (x) 1.8 1.6 1.5 1.4
EV/Operating Income (x) 9.1 8.7 8.5 7.8
EV/EBITDA (x) 10.7 10.4 10.0 9.2
(`billion) FY11A FY12A FY13E FY14E
Net Sales 576.1 658.9 723.6 814.0
Expenses 431.7 504.5 556.6 622.9
EBITDA 144.4 154.4 167.0 191.2
EBIDTA Margin (%)
25.1 23.4 23.1 23.5
Other Income 24.0 29.4 30.6 34.4
Depreciation 27.2 31.1 34.2 39.2
EBIT 141.2 152.7 163.4 186.4
Interest 17.3 21.3 26.1 31.7
Profit Before Tax
123.9 131.4 137.2 154.7
Tax 30.4 33.2 36.3 42.5
Net Profit 93.5 98.1 100.9 112.2
NPM (%) 15.6 14.3 13.4 13.2

Disclaimer
@ All Rights Reserved
This report and Information contained in this report is solely for information purpose and may not be used as an offer document or solicitation
of offer to buy or sell or subscribe for securities or other financial instruments. The investment as mentioned and opinions expressed in this
report may not be suitable for all investors. In rendering this information, we assumed and relied upon, without independent verification, the
accuracy and completeness of all information that was publicly available to us. The information has been obtained from the sources that we
believe to be reliable as to the accuracy or completeness. While every effort is made to ensure the accuracy and completeness of information
contained, Indbank Limited and its affiliates take no guarantee and assume no liability for any errors or omissions of the information. This
information is given in good faith and we make no representations or warranties, express or implied as to the accuracy or completeness of the
information. No one can use the information as the basis for any claim, demand or cause of action.
Indbank and its affiliates shall not be liable for any direct or indirect losses or damage of any kind arising from the use thereof. Opinion
expressed is our current opinion as of the date appearing in this report only and are subject to change without any notice.
Recipients of this report must make their own investment decisions, based on their own investment objectives, financial positions and needs of
the specific recipient. The recipient should independently evaluate the investment risks and should make such investigations as it deems
necessary to arrive at an independent evaluation of an investment in the securities of companies referred to in this document and should
consult their advisors to determine the merits and risks of such investment.
The report and information contained herein is strictly confidential and meant solely for the selected recipient and is not meant for public
distribution. This document should not be altered in any way, transmitted to, copied or distributed, in part or in whole, to any other person or
to the media or reproduced, duplicated or sold in any form.
Indbank Merchant Banking Services Ltd.
I Floor, Khiviraj Complex I, No.480, Anna Salai, Nandanam, Chennai 600035
Telephone No: 044 – 24313094 - 97 Fax No: 044 – 24313093 www.indbankonline.com