ntc 2015 - reuse of open & big data for sustainable services for social good
TRANSCRIPT

Big Data and Open Data Reuse
by Nonprofits for the Creation of
Sustainable Social Services
Nonprofit Technology Conference, Austin TX
Wed March 4, 2015 10:30 AM
Schedule: http://sched.co/1z1r
Eval: 15NTCSessionEval?c=1208
Hashtag: #15NTCReuseData

Who We Are – TechSoup Global
March 4 2015Open Data Reuse by Nonprofits #15NTCreusedata2
TechSoup Global is a nonprofit serving
the nonprofit community worldwide.
We have built nonprofit sector capacity through
technology for 25 years.
We are working toward a time when every social benefit
organization on the planet has the technology,
resources, and knowledge they need to operate at their
full potential.

Who We Are
March 4 2015Open Data Reuse by Nonprofits #15NTCreusedata3
• Steve Nagoski - Data Scientist
• Michael Enos - Director of Community and Platform
Who You Are & What You Care About
How do we Sustainably Connect our Information & Insights?
• Stories of Success – Collaboration Panel
• Questions About Open Data & Sustainability
Use #15NTCreusedata & Question Cards & Q&A

Data Reuse by Nonprofits
• Big Data & Open Data Trends
• Open Data Concerns
• Case Study: Balkans Data Academy
• Case Studies: Digital Humanitarians
• Data Science and Machine Learning
• Case Study: Hunger Index
• Sustainability of Open Information Initiatives
March 4 2015Open Data Reuse by Nonprofits #15NTCreusedata4

“The purpose of computing is insight,
not numbers.”
-Richard Hamming, 1961
March 4 2015Open Data Reuse by Nonprofits #15NTCreusedata5
Data Trends – Long Term
“What a computer is to me is it’s the most
remarkable tool that we’ve ever come up with,
and it’s the equivalent of a bicycle for our minds.”
- Steve Jobs, 1990

Big Data Trends - Global
• # of orgs and governments operating “Data Driven” grows every year, instrumenting & collecting broader data to make smarter decisions
• Online connectivity:
─ 350B SMS Messages/mo
─ 1.5T App Messages/mo (Whatsapp)
─ 15T Tweets/mo
─ 30B unique Facebook shares/mo
─ 3B Internet Users worldwide (40%), growing 8% YoY
• Cloud Storage makes storing 100PB/org affordable
─ Facebook, Microsoft, Amazon, Twitter, Thousands more.
─ Millions in the next 2 years
• New Analysis Tools are Efficient at those sizes
March 4 2015Open Data Reuse by Nonprofits #15NTCreusedata6

Open Data Trends - Global
• 2013 : G8 signs Open Data Charter
• 2014 : G20 pledge:
─ advance open data as weapon against corruption
• 2014 : UN recognizes need for “Data Revolution”
Still a LONG way to go
• 8% of participating countries publish spending figures
• 6% publish open data on government contracts
• 3% publish open data on ownership of companies
• Many Open Data initiatives not yet sustaining, growing
─ OpenDataBarometer.org, Jan 2015
March 4 2015Open Data Reuse by Nonprofits #15NTCreusedata7

Open Data Trends - US
• White House hires first Chief Data Scientist @dpatil
• Obama keynotes O’Reilly Strata conference Feb 2015
─ “Understanding and Innovating with Data has the potential to change the way we do almost anything for the better”https://www.youtube.com/watch?v=vbb-AjiXyh0
• 135,000 open govt datasets available at Data.gov
─ Weather, Maps, Healthcare, Political Funding, Census
• Collaboration between NGOs (Why) & Data Scientists (How) & Analysts/Engineers (What) to deliver stronger insights
March 4 2015Open Data Reuse by Nonprofits #15NTCreusedata8

Open Data Concerns - US
• Privacy vs Accountability & Transparency
─ Most open data Anonymous for Privacy Census
Public Services Usage Info
Driving Traffic Patterns
─ Some must be detailed for Accountability Health Inspection Data for Restaurants
Campaign Finance data for Politicians
─ Some we have committed to record for Accountability but have not put collection/access systems in place Police Shootings and/or Deaths Records
Public Access to Police Event Video
March 4 2015Open Data Reuse by Nonprofits #15NTCreusedata9

Open Data Concerns
• Misuse of Open Data and Misinterpretation
• Correlation != Causation
March 4 2015Open Data Reuse by Nonprofits #15NTCreusedata10
“The temptation to form
premature theories upon
insufficient data is the
bane of our profession.”
– Sherlock Holmes
“Torture the data, and it
will confess to anything.”
– Ronald Coase

Data Reuse by Nonprofits
• Big Data & Open Data Trends
• Open Data Concerns
• Case Study: Balkans Data Academy
• Case Studies: Digital Humanitarians
• Data Science and Machine Learning
• Case Study: Hunger Index
• Sustainability of Open Data Initiatives
March 4 2015Open Data Reuse by Nonprofits #15NTCreusedata11

Balkans Data Academy : Why / Why Not?
• 1 week Hackathon in Sarajevo Aug 2014
─ expose Bosnian election data to voters
• Project managed by TechSoup Foundation + Local Civic
Activists ZastoNe https://www.youtube.com/watch?v=BcxgAOCFppY
• Team– 15 people from 7 different Nonprofit Orgs w/
different skills + 1 common goal
• Set up framework for future Data Academies, expand
footprint, enable more local NGOs to expand project
March 4 2015Open Data Reuse by Nonprofits #15NTCreusedata12

Balkans Data Academy : What
• Outcomes – Success!
─ Database & API Created, Open Source Project - Github
─ Data now easy to reload and expand
─ Website Created
─ Introduction Video created
• Next Steps
─ Use for live data in October 2014 Election
─ Collaborate & Train to expand local nonprofit capabilities in
future Academies
March 4 2015Open Data Reuse by Nonprofits #15NTCreusedata13

Digital Humanitarians
Feb 2015, Dr. Patrick Meier
• The Rise of Digital Humanitarians
• The Rise of Big Crisis Data
• Crowd Computing Satellite & Aerial Imagery
• Artificial Intelligence applied to Disaster Response
• Verifying Big Crisis Data – Dealing with False Data
• Dictators vs Digital Humanitarians (Egypt, China, Iran)
http://iRevolution.net http://DigitalHumanitarians.com #DigitalJedis
March 4 2015Open Data Reuse by Nonprofits #15NTCreusedata14

Digital Humanitarians – Haiti Earthquake 2010
March 4 2015Open Data Reuse by Nonprofits #15NTCreusedata15
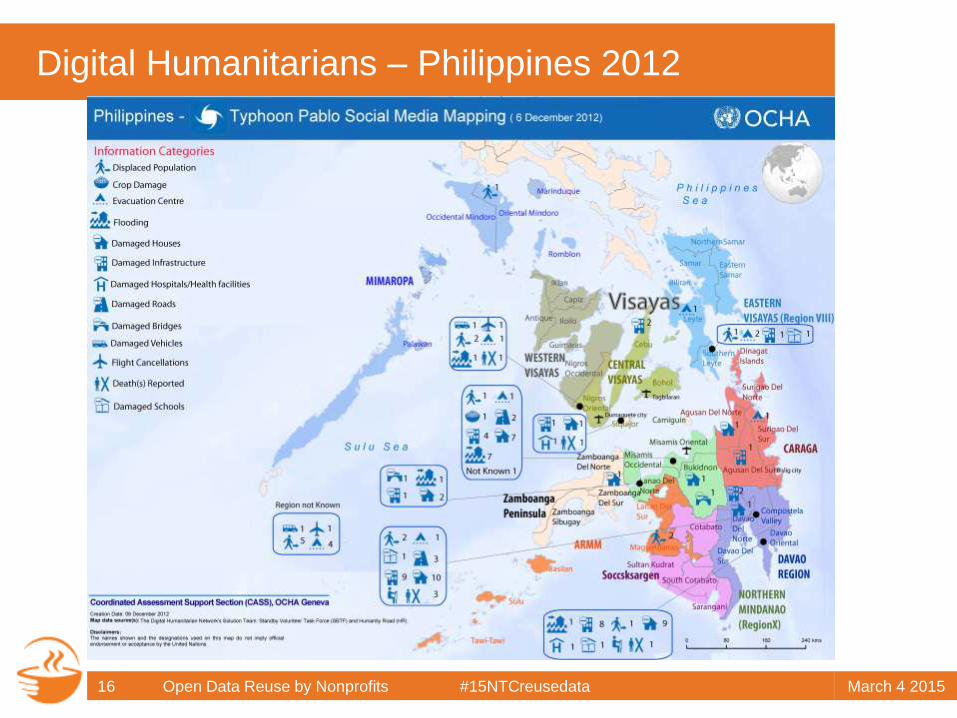
Digital Humanitarians – Philippines 2012
March 4 2015Open Data Reuse by Nonprofits #15NTCreusedata16

HDX – Ebola, West Africa, Feb 2015
March 4 2015Open Data Reuse by Nonprofits #15NTCreusedata17

Resistance to AI / Machine Learning
March 4 2015Open Data Reuse by Nonprofits #15NTCreusedata18
• Oct 2010: Crowdsourcerer vs Muggles
“How Harry Potter Explains Humanitarian Crowd-Sourcing”

What is Machine Learning + AI Today
• Predictive Modeling + Threshold Automation
• Abuse prevention in Financial Svcs, Social Media
– Spam
– Personal/Community Abuse
– Fraud
– AML - Anti Money Laundering
– ATO - Account Take Over detection
• Detecting False Data
• Stitching Many sources to get the truest picture
• Constantly Adjusting, Measuring, Improving– Learning from False Positives, Negatives, most valuable Measures
March 4 2015Open Data Reuse by Nonprofits #15NTCreusedata19

Applying Machine Learning to #OpenData
• Counting Tents in Refugee Camp Satellite Images
• Stitching together area images from UAV cameras
• Translation Services for Global Responses
• Identifying unreliable/false posts in Social Media
• Smart Geolocation with minimal input metadata
March 4 2015Open Data Reuse by Nonprofits #15NTCreusedata20

Data Reuse by Nonprofits
• Big Data & Open Data Trends
• Open Data Concerns
• Case Study: Balkans Data Academy
• Case Studies: Digital Humanitarians
• Data Science and Machine Learning
• Case Study: Hunger Index
• Sustainability of Open Data Initiatives
March 4 2015Open Data Reuse by Nonprofits #15NTCreusedata21

Hunger Index - What problems are we trying to solve?
• Are Food Assistance Providers achieving our goals?
• How do we forecast and communicate the need for food?
• How can food assistance programs make better decisions
about programs and investments.
March 4 2015Open Data Reuse by Nonprofits #15NTCreusedata22
Total Meals
Required
MealsPurchased
Food Assistance
Missing Meals

What is the Hunger Index?
• An aggregate measure of the need for food by the most
vulnerable member of a community.
• An index for comparing performance year-to-year and
region-to-region.
• A measure of how well we are serving those in need in
our community.
• Began in 2007 in Santa Clara and San Mateo Counties,
expanding to Alameda, Sonoma and Santa Cruz Counties
March 4 2015Open Data Reuse by Nonprofits #15NTCreusedata23

Hunger Index Methodology: Components
Scope – Community, Income and Time Range
TMR – Total Meals Required
MP – Meals Purchased
FAP – Food Assistance Provided
TNF – Total Need for Food Assistance
MM – Missing Meals
HI – Hunger Index
• Counties
March 4 2015Open Data Reuse by Nonprofits #15NTCreusedata24

The Hunger Index
March 4 2015Open Data Reuse by Nonprofits #15NTCreusedata25

Hunger Index Methodology: Vulnerable Population
Scope
Geography
Time range
Income Demographics
http://www.census.gov/acs/www/
March 4 2015Open Data Reuse by Nonprofits #15NTCreusedata26

Hunger Index Methodology: TMR
TMR: Total Meals Required
• Households with Incomes < $50K
• Average Household Size– Table B25010
– Santa Clara County 2010 = 2.94 persons/household
• Number of Meals per year =
1095/person/year
March 4 2015Open Data Reuse by Nonprofits #15NTCreusedata27

Hunger Index Example: TMR, Santa Clara County 2010
March 4 2015Open Data Reuse by Nonprofits #15NTCreusedata28
Annual Income HouseholdsMeals Required
(millions)
0 thru $10,000 26,848 86.4
$10,000 to $20,000 38,863 125.1
$20,000 to $30,000 40,182 129.4
$30,000 to $40,000 38,351 123.5
$40,000 to $50,000 40,967 131.9
Total 185,211 596.3

Methodology: Meals Purchased (MP)
• From Consumer Expenditure Survey
–http://www.bls.gov/cex/csxstnd.htm
• No. of Households * Average Annual
Expenditure per household
• Important Correction: Subtract SNAP
purchases. http://www.cdss.ca.gov/research/PG352.htm
• Divide by Cost of a Meal to get Meals
Purchased http://www.cnpp.usda.gov/usdafoodcost-home.htm
March 4 2015Open Data Reuse by Nonprofits #15NTCreusedata29

Example MP Data: Santa Clara County 2010
March 4 2015Open Data Reuse by Nonprofits #15NTCreusedata30
Annual Income
(000)Households
Average Annual Expenditure
on Food
0 thru $10 26,848 $3,189
$10 to $20 38,863 $3,413
$20 to 30 40,182 $4,008
$30 to 40 38,351 $4,883
$40 to 50 40,967 $5,515

Methodology: Food Assistance Provided (FAP)
• Data in different formats normalized to
meals
• Time range
• For SC and SM Counties
– Food Banks, SNAP, WIC, Government School Meal
Programs Senior Nutrition, CACFP
March 4 2015Open Data Reuse by Nonprofits #15NTCreusedata31

Example FAP: Santa Clara County 2010
March 4 2015Open Data Reuse by Nonprofits #15NTCreusedata32
SourceMeals
(millions)
SNAP 81.4
Second Harvest Food Bank 24.7
School meals 21.3
WIC 14.1
CACFP 4.7
Other 1.6
Total (FAP) 147.8

Final Calculations
TNF: Total Need for Food Assistance
TNF = TMR – MP
296.6M = 596.2M – 299.6M
MM: Missing Meals
MM = TNF – FAP
148.8.M = 296.6M - 147.8M
HI: Hunger Index
HI = MM/TNF
0.502 or 50.2%
March 4 2015Open Data Reuse by Nonprofits #15NTCreusedata33

Example Final Calc: Santa Clara County 2010
March 4 2015Open Data Reuse by Nonprofits #15NTCreusedata34
TMR: Total Meals Required 596.2
MP: Meals Purchased 299.6
FAP: Food Assistance Provided 147.8
TNF: Total Need for Food 296.6
MM: Missing Meals 148.8
HI: Hunger Index 0.502

Findings and Implications
March 4 2015Open Data Reuse by Nonprofits #15NTCreusedata35
Analysis
– Compare against
previous year
– Look for major shifts in
components
– Trends
Collateral benefits
– Understanding of need
• Who, where, when
– Understanding of Food
Assistance
• Who, where, when
– Use of data in other contexts
– How is the population,
demographics and economics
changing over time

Findings and Implications
March 4 2015Open Data Reuse by Nonprofits #15NTCreusedata36
How many households are vulnerable and
how much food do they need to be healthy?
Year Households Meals Needed
2010 173,000 564 million
2011 185,000 596 million
Growth 7% 5.7%

Findings and Implications
March 4 2015Open Data Reuse by Nonprofits #15NTCreusedata37
Purchased300
Food Assistance
148.8
Missing Meals 147.8
Santa Clara County 2011596 Million Meals185,000 households
CalFresh55%
Food Bank17%
School meals14%
WIC10%
Other4%
Food Assistance in
Santa Clara 2011Total Food Assistance: 149 million meals

Santa Clara County Hunger Index
March 4 2015Open Data Reuse by Nonprofits #15NTCreusedata38
109.5136.6 147.8
110.4
137.1148.8
0
50
100
150
200
250
300
350
2009 2010 2011
Food Assistance Provided Missing Meals

Santa Clara County Hunger Index 2011
March 4 2015Open Data Reuse by Nonprofits #15NTCreusedata39
• Hunger Index indicates agencies still struggling to
catch up.
• Vulnerable households increased by more than
7% and need grew by over 8%
• Food Assistance grew by just over 8%.
• Most growth: CalFresh and WIC
• 149 million meals missing last year – enough to
feed 136,000 people for one year, more than the
population of Santa Clara.

What does the Hunger Index tell us?
March 4 2015Open Data Reuse by Nonprofits #15NTCreusedata40
• Households are spending less on food and
using more food assistance
• It will be a challenge for food assistance
programs to keep up
• We need to continue to work together to make
a difference

Data Reuse by Nonprofits
• Big Data & Open Data Trends
• Open Data Concerns
• Case Study: Balkans Data Academy
• Case Studies: Digital Humanitarians
• Data Science and Machine Learning
• Case Study: Hunger Index
• Sustainability of Open Data Initiatives
March 4 2015Open Data Reuse by Nonprofits #15NTCreusedata41

Sustainability of Open Data Initiatives
• Sustainability through Collaboration
• Collaboration Panel – share Successes
• Q&A on Open Data opportunities to Panel
• Questions from #NTC15reusedata
March 4 2015Open Data Reuse by Nonprofits #15NTCreusedata42