nsw department of planning & infrastructure...
TRANSCRIPT

NSW DEPARTMENT OF PLANNING & INFRASTRUCTURE
ANNUAL ENVIRONMENTAL
MANAGEMENT REPORT 2012
Centennial Mandalong Mine
For the period 1 January 2012 to
31 December 2012

Annual Environmental Management Report 2012
Page i
TABLE OF CONTENTS
1 INTRODUCTION ............................................................................................................................... 1
1.1 OVERVIEW ......................................................................................................................... 1 1.2 SCOPE ................................................................................................................................ 1 1.3 SUMMARY OF WORKS...................................................................................................... 1 1.4 REGULATORY FRAMEWORK ........................................................................................... 4
1.4.1 Development Consent ................................................................................................... 4 1.4.2 Mining Authorities .......................................................................................................... 5 1.4.3 Other Approvals ............................................................................................................. 5 1.4.4 Authorisations and Exploration Licences ....................................................................... 5
1.5 CONSENT CONDITIONS – AEMR REQUIREMENTS ....................................................... 8
2 COMPLIANCE WITH CONSENT CONDITIONS .............................................................................. 9
2.1 CONSENT CONDITION 105 (I) – COMPLIANCE AUDIT MANDALONG MINE ................. 9 2.2 CONSENT CONDITION 108 – INDEPENDENT ENVIRONMENTAL AUDIT ..................... 9
3 ENVIRONMENTAL MANAGEMENT .............................................................................................. 10
3.1 ENVIRONMENTAL PROTECTION AUTHORITY (EPA) REQUIREMENTS ...................... 10 3.2 NSW OFFICE OF WATER (NOW) REQUIREMENTS (FORMERLY DWE) ..................... 10 3.3 NSW DEPARTMENT OF TRADE AND INVESTMENT – DIVISION RESOURCES
AND ENERGY REQUIREMENTS (FORMERLY NSW I&I ) .......................................................... 10 3.4 LAKE MACQUARIE CITY COUNCIL (LMCC) REQUIREMENTS ..................................... 11
4 OPERATIONS DURING REPORTING PERIOD ............................................................................ 12
4.1 EXPLORATION ................................................................................................................. 12 4.2 MINE PRODUCTION ........................................................................................................ 13 4.3 WASTE MANAGEMENT ......................................................................................................... 15
5 MONITORING ................................................................................................................................. 16
5.1 DEPOSITIONAL DUST MONITORING ............................................................................. 17 5.1.1 Depositional Dust Results ............................................................................................ 18 5.1.2 Data Interpretation ....................................................................................................... 19
5.2 GROUNDWATER MONITORING ..................................................................................... 21 5.2.1 Groundwater Monitoring Results ................................................................................. 21 5.2.2 Data Interpretation ....................................................................................................... 25
5.3 SURFACE WATER MONITORING ................................................................................... 26 5.3.1 Surface Water Monitoring Results ............................................................................... 27 5.3.2 Data Interpretation ....................................................................................................... 28
5.4 METEOROLOGICAL MONITORING ................................................................................ 30 5.4.1 Wind Monitoring Results .............................................................................................. 30 5.4.2 Data Interpretation ....................................................................................................... 33 5.4.3 Rainfall Monitoring Results .......................................................................................... 33 5.4.4 Data Interpretation ....................................................................................................... 33 5.4.5 Evaporation and Temperature Monitoring Results ...................................................... 34 5.4.6 Data Interpretation ....................................................................................................... 34
5.5 NOISE MONITORING ....................................................................................................... 35 5.6 BLAST MONITORING ....................................................................................................... 37 5.7 GREENHOUSE GAS MONITORING ................................................................................ 37 5.8 ADDITIONAL MONITORING ............................................................................................ 39
5.8.1 Mandalong Stream Gauges ......................................................................................... 39 5.8.2 Mandalong Haulage Road ........................................................................................... 39 5.8.3 Wetland Monitoring ...................................................................................................... 40 5.8.4 VAM-RAB Rehabilitation Off-set Monitoring ................................................................ 43
5.9 COMPLAINTS AND INCIDENTS ...................................................................................... 46 5.10 SUBSIDENCE MONITORING .......................................................................................... 47

Annual Environmental Management Report 2012
Page ii
5.10.1 Stream Channel ........................................................................................................... 47 5.10.2 Subsidence Results ..................................................................................................... 48
5.11 NATURAL FEATURES SUBSIDENCE IMPACTS AND PERFORMANCE AGAINST PREDICTED
IMPACTS .......................................................................................................................................... 54
6 COMMUNITY LIAISON ................................................................................................................... 55
6.1 COMMUNITY CONSULTATION ....................................................................................... 55 6.2 SMP CONSULTATION ..................................................................................................... 55 6.3 COMMUNITY SPONSORSHIP ......................................................................................... 55
7 AGRICULTURAL LAND SUITABILITY .......................................................................................... 57
7.1 AGRICULTURAL SUITABILITY CLASSIFICATION ......................................................... 57 7.2 ASSESSMENT OF AGRICULTURAL SUITABILITY ........................................................ 58 7.3 AGRICULTURAL SUITABILITY IMPACT ASSESSMENT ................................................ 58
8 WATER BUDGET ........................................................................................................................... 60
8.1 WATER MANAGEMENT................................................................................................... 60 8.1.1 Water Supply and Use ................................................................................................. 60 8.1.2 Minewater Management .............................................................................................. 61 8.1.3 Groundwater Management .......................................................................................... 61
8.2 WATER BALANCE – MANDALONG SITE ........................................................................ 65
9 REHABILITATION .......................................................................................................................... 68
9.1 BUILDINGS ....................................................................................................................... 68 9.2 REHABILITATION OF DISTURBED LAND ....................................................................... 68 9.3 OTHER INFRASTRUCTURE ............................................................................................ 71 9.4 REHABILITATION TRIALS AND RESEARCH .................................................................. 71
10 ENVIRONMENTAL MANAGEMENT TARGETS AND STRATEGIES .......................................... 74
10.1 SUMMARY OF PREVIOUS TARGETS ............................................................................. 74 10.2 TARGETS FOR 2013 ........................................................................................................ 75 10.3 MINE WATER REDUCTION TARGETS ........................................................................... 75

Annual Environmental Management Report 2012
Page iii
LIST OF TABLES TABLE 1: MANDALONG MINE DEVELOPMENT CONSENT, MINING AND EXPLORATION ...................... 6
TABLE 2 DEVELOPMENT UNIT PRODUCTION METRES JANUARY – DECEMBER 2012 .................... 14
TABLE 3: PRODUCTION TONNES AND SALEABLE TONNES IN 2012 .............................................. 15
TABLE 4: SUMMARY OF MONITORING REQUIREMENTS ............................................................... 16
TABLE 5: DESCRIPTION OF DEPOSITIONAL DUST GAUGES LOCATION .......................................... 17
TABLE 6: LOCATION OF DELTA DEPOSITIONAL DUST GAUGES ...................................................... 17
TABLE 7: SUMMARY OF DEPOSITIONAL DUST RESULTS BETWEEN JANUARY 2012 AND DECEMBER
2012 SURROUNDING MANDALONG MINE ..................................................................... 18
TABLE 8: SUMMARY OF DEPOSITIONAL DUST RESULTS BETWEEN JANUARY 2012 AND DECEMBER
2012 SURROUNDING DELTA ENTRY SITE .................................................................... 18
TABLE 9: SUMMARY OF DEPOSITIONAL DUST RESULTS BETWEEN JANUARY 2012 AND DECEMBER
2012 SURROUNDING THE COORANBONG SERVICES SITE ............................................. 19
TABLE 10: DETAILED DUST MONITORING AND ANALYSIS SHOWING THE ANNUAL ROLLING AVERAGE
AND CHANGE IN DEPOSITION FROM THE PRE-CONSTRUCTION AVERAGE (PCA) FOR DUST
GAUGES DG6, DG8 AND DG9 ................................................................................... 20
TABLE 11: AVERAGE GROUNDWATER QUALITY FOR THE MANDALONG VALLEY FOR THE 12 MONTH
PERIOD FROM JANUARY 2012 TO DECEMBER 2012 (‘AVG’) AND THE LONG-TERM ......... 21
TABLE 12: SUMMARY OF MONITORING LOCATIONS WITH RESPECT TO POSITION WITHIN THE
CATCHMENTS ............................................................................................................ 26
TABLE 13: AVERAGE SURFACE WATER QUALITY FOR THE 12 MONTH PERIOD FROM JANUARY 2012
TO DECEMBER 2012 (‘ANNUAL’) AND THE LONG-TERM AVERAGE (‘LTA’). ..................... 27
TABLE 14: COORANBONG ENTRY– AVERAGE QUALITY OF DISCHARGE WATER DISCHARGED
THROUGH EPA LICENSED DISCHARGE POINT 1 (LDP001) .......................................... 28
TABLE 15: COORANBONG ENTRY –AVERAGE QUALITY OF DISCHARGE WATER DISCHARGED
THROUGH EPA LICENSED DISCHARGE POINT 2 (LDP002) .......................................... 28
TABLE 16: AVERAGE WIND SPEED (METRES PER SECOND) AND MAXIMUM INSTANTANEOUS WIND
SPEED RECORDED AT MANDALONG MINE FOR THE PERIOD JANUARY 2012.................. 30
TABLE 17: RAINFALL (MM) AND NUMBER OF WET DAYS RECORDED AT MANDALONG MINE FOR THE
PERIOD JANUARY 2012 TO DECEMBER 2012. ............................................................. 33
TABLE 18: AVERAGE DAILY EVAPORATION (MM) AND TEMPERATURE DATA FOR THE PERIOD
JANUARY 2012 TO DECEMBER 2012 .......................................................................... 34
TABLE 19: TOTAL GHG EMISSIONS FROM MANDALONG MINE IN 2012 FINANCIAL YEAR ................ 38
TABLE 20: WETLAND TRIGGER ACTION RESPONSE PLAN AND ASSESSMENT ................................. 43
TABLE 21: COMMUNITY ENQUIRIES / COMPLAINTS SUMMARY ....................................................... 46
TABLE 22: SUMMARY OF CONSENT CONDITIONS ......................................................................... 47
TABLE 23 SUBSIDENCE REPORTS 2012 ..................................................................................... 48
TABLE 24: SUMMARY OF PREDICTED AND OBSERVED SUBSIDENCE IMPACTS NATURAL FEATURES 54
TABLE 25: AGRICULTURAL SUITABILITY CLASSIFICATION AND LAND USE ....................................... 58
TABLE 26: SUMMARY OF MONITORING BORE NETWORK ESTABLISHMENT (SOURCE AGE 2013) .... 62
TABLE 27: 2012 WATER BALANCE MODEL (SOURCE GHD 2013) ................................................. 66
TABLE 28: SUMMARY OF TARGETS COMPLETED DURING 2012 ..................................................... 74
TABLE 29: SUMMARY OF TARGETS FOR THE PERIOD JANUARY 2013 TO DECEMBER 2013 ............. 75

Annual Environmental Management Report 2012
Page iv
LIST OF FIGURES
FIGURE 1: LONG-TERM AVERAGE (LTA) AND ANNUAL AVERAGE GROUNDWATER PH ................... 23
FIGURE 2: LONG-TERM AVERAGE (LTA) AND ANNUAL AVERAGE GROUNDWATER EC .................. 24
FIGURE 3: LONG-TERM AVERAGE (LTA) AND ANNUAL AVERAGE GROUNDWATER BOREHOLE ....... 24
FIGURE 4: AVERAGE DAILY WIND DIRECTION RECORDED FOR SUMMER 2012 ............................. 31
FIGURE 5: AVERAGE DAILY WIND DIRECTION RECORDED FOR SPRING 2012 ............................... 31
FIGURE 6: AVERAGE DAILY WIND DIRECTION RECORDED FOR AUTUMN AND WINTER 2012 .......... 32
FIGURE 7: ANNUAL PERCENTAGE OF WIND DIRECTION FOR THE PERIOD OF 2012 ....................... 32
FIGURE 8: WETLAND MONITORING LOCATIONS AND UNDERGROUND WORKINGS. .......................... 41
FIGURE 9: LOCATION OF FLORISTIC SAMPLE PLOTS ................................................................... 45
FIGURE 10: SUBSIDENCE MONITORING LOCATION PLAN ............................................................... 50
FIGURE 11: DEPTH OF COVER LONGWALLS 1-13. ........................................................................ 51
FIGURE 12: VISUALISATION OF SUBSIDENCE TO LW13 ................................................................. 52
FIGURE 13: VISUALISATION OF SUBSIDENCE TO LW13 PROJECTED ONTO THE TOPOGRAPHY ......... 52
FIGURE 14: DIFFERENCE BETWEEN PREDICTED AND ACTUAL SUBSIDENCE ................................... 53
FIGURE 15: GHD WATER BALANCE MODEL 2012 (SOURCE GHD 2013) ....................................... 67

Annual Environmental Management Report 2012
Page v
PLANS
Plan Reference Plan Name
MG10069 Mandalong Mine Surface Facilities, Surface Water Management and Rehabilitation
MG10131 Delta Entry Site Surface Facilities and Water Management
MG10722B Cooranbong Services Site Surface Water Management
MG10815 Mandalong Mine Monthly Production
MG10722D Mandalong Mine Location of Environmental Monitoring Points
MG10722C Delta Entry Site Locations of Environmental Monitoring Points
MG10722E Cooranbong Service Site Location of Environmental Monitoring Points
MG10502 Mandalong Surface Water and Groundwater Monitoring Locations
MG11217 Cooranbong Services Site Rehabilitation
APPENDICES Appendix No. Appendix Name
1 Consent Condition Extracts
2 Bank Guarantee
3 Compliance Audit of Consent Conditions
4 Depositional Dust Monitoring
5 Groundwater Monitoring and Assessment Report
6 Surface Water Monitoring
7 Rainfall Data
8 Noise and Blast Monitoring Report
9 Floodpath Condition Report
10 NSW Office of Water Groundwater Licenses Compliance Report
11 AEMR Photos 2012
12 Wetland Monitoring Reports

Annual Environmental Management Report 2012
Page vi
Document Details Name: Annual Environmental Management Report
Author: Jeff Dunwoodie
Reference:
Review Revision No.
Date Sent Details of Approval
Approved By Approval Date
0 Draft review Paul Williams Feb 2013
1 Final John Turner Feb 2013
Circulation Details
Name Department Copies Circulation Date
Environmental Files MM 2
H Reed DoPI 1
F Hancock NoW 1
M Hartwell EPA 1
Q Espery LMCC 1
M Morris MMCCC 4
G Summerhayes DRE 1
Abbreviations AEMR Annual Environmental Management Report
ANZECC Australia and New Zealand Environment and Conservation Council
Co2-eT Emissions in CO2 equivalent tonnes
Coal Handling Plant CHP
CO2 Carbon Dioxide
CH4 Methane
NOW NSW Office of Water (NOW) (formerly the Department of Environment, Climate Change and Water)
Annual Environmental Management Report 2012
Page vii
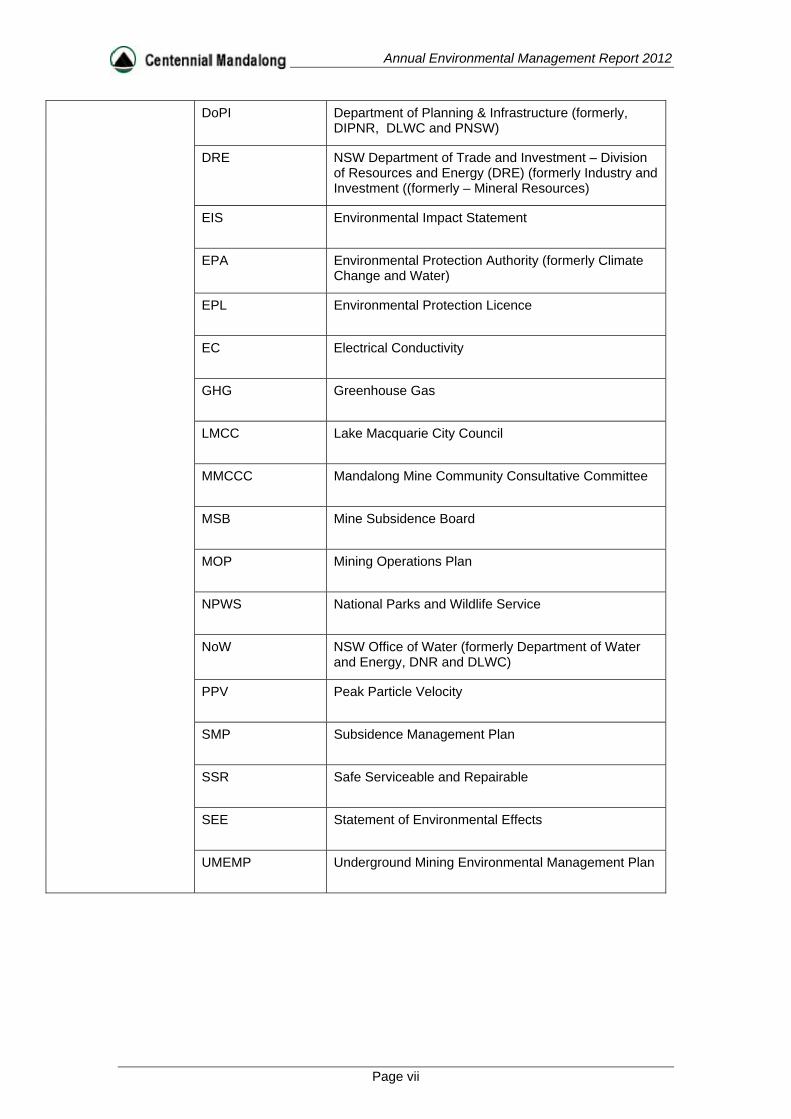
DoPI Department of Planning & Infrastructure (formerly, DIPNR, DLWC and PNSW)
DRE NSW Department of Trade and Investment – Division of Resources and Energy (DRE) (formerly Industry and Investment ((formerly – Mineral Resources)
EIS Environmental Impact Statement
EPA Environmental Protection Authority (formerly Climate Change and Water)
EPL Environmental Protection Licence
EC Electrical Conductivity
GHG Greenhouse Gas
LMCC Lake Macquarie City Council
MMCCC Mandalong Mine Community Consultative Committee
MSB Mine Subsidence Board
MOP Mining Operations Plan
NPWS National Parks and Wildlife Service
NoW NSW Office of Water (formerly Department of Water and Energy, DNR and DLWC)
PPV Peak Particle Velocity
SMP Subsidence Management Plan
SSR Safe Serviceable and Repairable
SEE Statement of Environmental Effects
UMEMP Underground Mining Environmental Management Plan

Annual Environmental Management Report 2012
Page 1
1 INTRODUCTION
1.1 OVERVIEW
Mandalong Mine is owned and operated by Centennial Mandalong (‘Centennial Mandalong’), a subsidiary of Centennial Coal Company Limited (‘Centennial’). Centennial completed the purchase of Powercoal including Mandalong in August 2002. Centennial was purchased by Banpu Public Company Limited (“Banpu”) in October 2010.
The Mandalong Mine comprises the underground workings and surface infrastructure of:
The Mandalong Mine underground workings including a longwall panel and development units and surface infrastructure (formerly the Mandalong Project Site) near Morisset;
The Cooranbong Services Site underground workings and surface infrastructure of the Cooranbong Entry Site; (formerly the Mandalong Operations Site prior to being known as Cooranbong Colliery), near Dora Creek and;
The Delta Entry Site, which encompasses an entry and coal delivery system, near Wyee at the Vales Point Rail Unloader Facility.
Mandalong Mine is a modern underground longwall operation located in the Lake Macquarie area near Morisset west of the F3 Freeway. The Mine is situated approximately 130 km north of Sydney suppling coal to the domestic power and export market. The Mandalong Mine was proposed by Powercoal Pty Ltd after an extensive exploration program. An Environmental Impact Statement (“EIS”) was submitted in 1997 and a Commission of Inquiry (CoI) held in 1998. The Mine was granted development consent (“consent”) DA 97/800, in October 1998. After obtaining consent, Centennial constructed Mandalong Mine site and decline tunnel to access the Mandalong mining area. Longwall mining operations at Mandalong commenced in January 2005. The Mine has approval to extract up to six million tonnes per annum of coal from the West Wallarah Seam using the longwall mining method. Development consent DA 35/2/2004 granted in July 2004 by the NSW DoP approved the construction and operation of the coal handling and clearance system at the Delta Entry Site. Construction of the Delta Coal Clearance System was completed in 2006 (refer to Section 2.3 Construction). The Cooranbong Service Site and Delta Service Site contain coal handling infrastructure, enabling the Mine to process and convey as permitted by their respective development consents up to eight million tonnes of coal per anumm. These sites are maintained under current mine leases as referred to Section 1.4.
1.2 SCOPE
This Annual Environmental Management Report (AEMR) details the progress of environmental management covering Mandalong, Cooranbong Services Site and Delta Entry Site collectively, for the period 1 January 2012 to 31 December 2012. The AEMR has been prepared in accordance with the Mandalong Mine conditions of consent as detailed in Section 1.5 below.
1.3 SUMMARY OF WORKS
Mandalong Mine The majority of construction activities at the Mandalong Mine were completed by the end of 2004 in preparation for the workforce relocating from Cooranbong Colliery. In November 2004 Mandalong Mine became an operating mine site with personnel accessing the Mandalong underground workings via the decline tunnel. Completed facilities at the Mandalong Mine Site (refer to plan MG10069) include:
Surface to underground decline (1 in 8 gradient – 1400 metres in length);

Annual Environmental Management Report 2012
Page 2
Bathhouse and Administration buildings;
Store Warehouse;
Diesel Refuelling Station and Storage Shed;
Machinery Washdown Bay;
Mechanical Workshop;
Equipment and materials storage areas;
Fire Fighting and Emergency Equipment Store;
Compressor Shed;
Electrical Sub-Station;
Mine Fan;
Methane Gas Drainage Plant;
Solcenic Mixing Plant; and
Waste sorting area.
Construction of a car park consisting of an asphalt surface and kerb guttering used for water drainage as shown in plan MG10069 was completed in October 2011. A demountable bathhouse building shown on plan MG10069 was installed on site. Construction of a shed to store stone dust bags attached to the existing main stores building was completed 2011. The remaining storage areas at the rear of the main stores building were concreted to improve access during wet weather for handling bulk equipment. Construction of the skulls and material storage bunkers located adjacent the decline mound was completed in March 2011. Clearing of vegetation for the construction of the VAM RAB unit adjacent to the Mine’s ventilation fan commenced in December 2011 and at the end of 2012 the construction of the VAM RAB facility was approximately 80% completed. The commissioning of the VAM RAB facility is expected to be completed in early 2013. Further detail on the VAM-RAB process and technology is included in Section 5.7 of this document. A consent modification approval was obtained in 2005 to construct multiple enclosed flares planned to be used to reduce fugitive methane GHG emissions from the Mine’s surface gas drainage plant. Civil works for construction of the gas flares commenced in October 2012 with commissioning of the flares expected to commence in early 2013.
Delta Entry Site The Delta entry site consists of the Delta Coal Clearance System and decline tunnel. The Delta coal clearance system conveys coal from the underground mining areas by a 4.5 km long underground conveyor within the coal seam. Coal is then conveyed up the decline tunnel, to the surface at the Delta entry site. At the surface coal is transported by conveyor to the transfer tower and then into the crusher building to be sized. After coal is sized it is then transported by conveyor onto the Wyee overland conveyor and supplied to the Vales Point Power Station. Construction on the above coal conveyor systems was completed by the end of 2005. No further construction occurred at the Delta Entry Site in 2012. Cooranbong Services Site The Cooranbong Services Site consists of a Coal Handling Plant (CHP) and mine support infrastructure which includes decline tunnels, coal stockpiles, conveyors, mine fan, and workshop buildings. The CHP and supporting infrastructure remain in use at Cooranbong to supply coal to Eraring Power Station.
Annual Environmental Management Report 2012
Page 3
Construction of the approved CHP upgrades commenced in June 2009 with the removal of the decommissioned north drift conveyor gantry and drive head buildings. Construction of the CHP upgrades and haul road were completed in May 2010. The CHP and road haulage infrastructure is shown in plan MG11217 and consists of: -
Reclamation of some existing (unused) components for integration into the upgrade.
Installation of new prefabricated aerial conveyor system. The installation of a 1200T truck loading bin. The construction of infrastructure for a nominal 100 000 T ROM stockpile. Upgrade works to the existing CHP (ROM bin) to maximise throughput. The installation of new electrical systems, incorporating energy saving
components. The installation of a Plant Control System, incorporating remote monitoring via
camera systems, and improved diagnostics to reduce plant downtime. Construction of internal road network capable of supporting B-Double haul trucks 100T, 27 m long truck weighbridge. Security fencing. Drainage and water treatment system to contain and manage dirty water from the
new ROM, conveyor and road network. Coal loading and haulage operations from the truck loading bin and 100 000 T ROM stockpile in 2012 were undertaken by Giacci Bros Pty Ltd. Coal handling operations were undertaken by Lainge O’Rourke at the Cooranbong CHP. Coal deliveries to customers in 2012 are described in Section 4.2. Mandalong Haulage Road A 3.5 kilometre section of new private haul road and rail overpass bridge has been constructed immediately north of Cooranbong Service Site and connects with the existing Newstan – Eraring private haul road. The construction of the haul road was largely completed in 2009 with remaining road sections completed by May 2010. The haul road is designed to facilitate the transport of coal from the Mandalong Mine to the Newstan Colliery surface facilities for processing and transport into the export market. The asphalt road surface was removed in 2011 due to potholing and replaced with a new asphalt surface in April 2011. The Mandalong haul road removes significant amounts of coal trucks from using public roads and reduces the noise and dust impacts on the local community. The road is constructed along a horizontal alignment which has been selected to avoid threatened flora species and minimise environmental impact. The construction consisted of stripping topsoil/vegetation to an average depth of 100 mm across the whole site, approximately 260,000 m3 of cut to fill in clay, highly weathered rock, and moderately weathered rock has been carried out to achieve pavement sub-grades and the overall formation levels. Construction plant and equipment for this operation included scrapers, dozers, water cart, 60t excavator and 40t dump trucks, compacting roller, graders and minor equipment. The pavement material has been imported to satisfy the structural requirements of the design life and criteria. The road is sealed with asphalt, line marked and signposted to Australian standards. A new overpass Bridge approximately 33m long, 11m wide has been constructed over the Main Northern Railway to the approved design and methodology of Railcorp. The bridge is a single span concrete structure with precast concrete Super-T girders. A concrete crash barrier has been installed with throw screens to prevent material from entering the rail corridor. The construction includes all footing, pile, column, abutment, girder and all deck works associated with the bridge installation. The bridge works also included the relocation of Railcorp 66kV, 11kV electrical and optic fibre assets within the Railcorp easement. The disturbed areas across the site have been stabilised with topsoil and revegetated where appropriate as described in Section 9.2. Drainage culverts have been installed in four

Annual Environmental Management Report 2012
Page 4
locations to maintain existing creek flows. Several fauna overpass and underpass structures as described in section 5.8.3 have also been included in the construction. Several sediment basins have been installed to manage dirty water from the roadway and clean water diversion drains constructed to intercept water from entering the dirty water system and avoid contamination. The entire western length of the haul road is fenced with fauna friendly security chainmesh fence.
1.4 REGULATORY FRAMEWORK
1.4.1 Development Consent
Mandalong Mine operates under conditions set out in Development Consent (N92/00275), (‘consent’) pursuant to Development Application (LMCC) DA97/800. Mandalong Mine applied to NSW DoP to modify this development consent in October 2008 and the Deputy Director General, Development Assessment (delegate for the Minster of Planning) approved the modification in July 2009 approving: -
production of up to 6 million tonne of Run of Mine Coal per year from Mandalong Mine.
construction and operation of gas engines fuelled by coal mine methane gas with electricity generation capacity of up to 12 MW.
relocation of an approved ballast borehole. updating subsidence conditions to be consistent with the current Subsidence
Management Plan (SMP) process (“Subsidence”) which all underground mining companies in NSW operate within.
Mandalong Mine applied to NSW DoP to modify (MOD5) DA 97/800 under section 96(1A) of the NSW Environmental Planning and Assessment Act (1979) (EP&A) to permit the transport of 400 000 tonnes ROM coal to Eraring Power Station and to relocate (MOD6) the Coal Handling Plant infrastructure at the Cooranbong Service Site to incorporate current engineering and environmental design requirements. Newstan Colliery received approval to DA 73-11-98 (MOD2) to receive, wash, reject emplacement and export coal from Mandalong Mine. On 27 and 30 November 2009 the Director of Major Development Assessment (as delegate of the NSW Minister for Planning) approved these modifications to the Mine’s development consent determining that these works would have minimal environmental impact. The modified consent permits the:-
Temporary transport of an additional 400 000 tonnes of ROM coal between November 2009 and March 2010 from Mandalong Mine via the Cooranbong to Eraring Power Station conveyor.
Stockpiling the coal at Eraring Power station and transport to Newstan Colliery by the private coal haulage road.
Washing, reject emplacement and export of transported coal at Newstan Colliery.
Relocation of the approved Cooranbong CHP infrastructure.
In 2011 the Mandalong Mine sought to modify the consent (MOD7) under section 75W of the EP&A Act to allow for the installation and ongoing operation of a single VAM RAB unit as a demonstration project to examine the performance capability of innovative, locally developed VAM RAB technology. More specifically, the project involves the following:
Installation of a single VAM RAB unit inclusive of VAM capture duct and RAB tower elements, adjacent to the existing Mandalong Ventilation Fans;
Provision of site services to the VAM RAB. This includes an extension of the existing methane gas drainage pipeline to connect to the VAM RAB unit, as well

Annual Environmental Management Report 2012
Page 5
as the provision of power from the gas monitoring switch room and water via pipeline proximate to the plant;
Installation of a fire suppression system for the Motor Control Centre;
Sourcing of fill from either an existing stockpile to the north west of the proposed location of the VAM RAB, or from offsite as required, to establish appropriate foundations for the VAM RAB unit;
Rehabilitation of the existing stockpile area as required, following the sourcing of fill from this stockpile;
Erection of fencing around the VAM RAB;
Minor drainage works to ensure appropriate drainage at the site; and
Increasing the Mandalong Mine Development Consent noise criteria to be consistent with the Project Specific Noise Criteria.
Approval was granted for these activities by the Planning Assessment Commission (PAC) as a delegate Minister for Planning and Infrastructure on 11th November 2011. Civil construction works on the surface pad for the VAM RAB unit commenced in December 2011 and at the end of 2012 the construction of the VAM RAB facility was approximately 80% completed. The commissioning of the VAM RAB facility is expected to be completed in early 2013. An Environmental Assessment (EA) was submitted to the NSW Department of Planning and Infrastructure (NSW DoPI) in May 2012 seeking a modification (MOD8) to the Development Consent DA97/800 to allow an altered pattern of coal distribution from the Cooranbong Entry Site. The Cooranbong Distribution Project proposed to:
Increase the volume of coal permitted to be transported from the Cooranbong Entry Site to Eraring Power Station, via the existing overland conveyor, from two Mtpa to up to 4Mtpa;
Increase the volume of coal permitted to be transported form the Cooranbong Entry Site to Newstan Colliery, via the existing private haul roads, from two Mtpa to up to 4Mtpa; and
Allow for the back haulage of a small volume of middlings (middle quality coal product) from Newstan Colliery to Cooranbong Entry Site for subsequent supply to the Eraring Power Station via the existing overland conveyor.
Approval from the Planning & Assessment Commission (PAC) for this modification (MOD8) to DA97/800 was received on 23 August 2012.
1.4.2 Mining Authorities
The Mandalong Mine holding comprises a number of leases as shown in Table 1 listing the leases within the Mine’s Colliery holding. No changes to the Mining Authorities occurred in 2012.
1.4.3 Other Approvals
The surface holdings at Mandalong Mine and Cooranbong Services & Delta Entry Sites are licensed for the scheduled activity of coal mines under the Protection of the Environment Operations Act (2005) in mine’s Environmental Protection Licence EPL 365. There were no amendments made to EPL 365 by the Environmental Protection Agency in 2012.
1.4.4 Authorisations and Exploration Licences
The Mandalong Mine holding comprises a number of leases. Table 1 sets out the leases within the Mine’s Colliery holding. No changes occurred to the Mining Exploration Licences or Mining Leases in 2012. Mandalong Mine applied to NSW Department of Trade and

Annual Environmental Management Report 2012
Page 6
Investment – Division of Resources and Energy (DRE) to extend the Mining Operations Plan (MOP) for a period of two (2) years from January 2012 to December 2013. DRE agreed to this extended period in recognition of the current transition process to the Rehabilitation and Environmental Management Plan (REMP) under the Mining Amendment Act 2008. The Mine applied for a modification to development consent 97/800 as described in section 1.4.1. A summary of the development consents, mining and exploration lease and licenses held by Mandalong Mine are listed in Table 1.
Table 1: Mandalong Mine Development Consent, Mining and Exploration Leases and Licences
Name Summary Issued By Expiry Date Renewal Procedure
Mining Lease 1443
Mandalong Project Mining Lease – includes some surface land
Dept Trade and Investment - Division Resources and Energy
01/03/2020 Group Manager - Property and Titles
Consolidated Coal Lease 762
Title to Cooranbong Workings includes some surface land – some environmental conditions
Dept Trade and Investment - Division Resources and Energy
13/10/2022 Group Manager - Property and Titles
Consolidated Coal Lease 746 (sublease)
Title for Cooranbong Workings includes some surface land – some environmental conditions
Dept Trade and Investment - Division Resources and Energy
21/12/2028 Group Manager - Property and Titles
Mining Purposes Lease 191
Title to surface land for water tanks at Cooranbong – requires annual environmental management report on anniversary
Dept Trade and Investment - Division Resources and Energy
24/2/2023 Group Manager - Property and Titles
Mining Purposes Lease 329
Title to surface land for old water supply line from Eraring Power Station – requires annual environmental management report on anniversary
Dept Trade and Investment - Division Resources and Energy
4/8/2015 Group Manager - Property and Titles
Mining Lease 1431
Title to surface land for proposed shaft at the back of Morisset
Dept Trade and Investment - Division Resources and Energy
27/5/2019 Group Manager - Property and Titles
Mining Lease 1543
Mining Lease – Mandalong Mine Project
Dept Trade and Investment - Division Resources and Energy
25/11/2024 Group Manager - Property and Titles

Annual Environmental Management Report 2012
Page 7
Name Summary Issued By Expiry Date Renewal Procedure
Mining Lease 1553
Mining Lease Delta Link Project – includes some surface land
Dept Trade and Investment - Division Resources and Energy
07/09/2025 Group Manager - Property and Titles
Exploration Licence 6317
Exploration Licence Mandalong South Project
Dept Trade and Investment - Division Resources and Energy
08/08/2014 Group Manager - Property and Titles
Exploration Licence 4443
Exploration Licence Cooranbong Colliery Area
Dept Trade and Investment - Division Resources and Energy
23/10/2012* Group Manager - Property and Titles
Exploration Licence 4968
Exploration Licence Mandalong Mine
Dept Trade and Investment - Division Resources and Energy
31/07/2012* Group Manager - Property and Titles
Exploration Licence 4969
Exploration Licence Mandalong Mine
Dept Trade and Investment - Division Resources and Energy
31/07/2012* Group Manager - Property and Titles
Exploration Licence 5892
Exploration Licence Mandalong Mine
Dept Trade and Investment - Division Resources and Energy
31/07/2012* Group Manager - Property and Titles
Authorisation 404
Exploration Licence Mandalong Mine
Dept Trade and Investment - Division Resources and Energy
31/07/2012* Group Manager - Property and Titles
Mine Operations Plan (MOP)
Summary of Mining Activities – Mandalong
Dept Trade and Investment - Division Resources and Energy
31/12/13 Mine to apply for Rehabilitation and Environmental Management Plan (REMP) in 2013.
Environmental Protection Licence 365
Permits scheduled activity “mining for coal” and “coal works”.
Environment Protection Authority
Perpetual Requires payment and Annual Return in February each year
Mandalong Mine Development Consent No.N92/00275
Permits development and works to occur in accordance with condition 1.
NSW Department of Planning
October 2020
Requires renewal by October 2020
Note: * Renewal pending

Annual Environmental Management Report 2012
Page 8
1.5 CONSENT CONDITIONS – AEMR REQUIREMENTS
Conditions 105-107 of the Mandalong Development Consent detail the requirements for an AEMR. Condition 15 of the Delta development consent requires an Annual Report to be submitted as part of the Mandalong Mine AEMR. These conditions are provided in Appendix 1. The 2011 AEMR was presented to the Director-General of the DOPI, DRE, LMCC, NOW, EPA and the Mandalong Mine CCC consistent with Consent Condition 106(i). DRE in their letter dated 2 May 2012 found that the AEMR was acceptable for the reporting period and completed a site inspection on 26 April 2012. DoPI in their email dated 3 April 2012 in regard to the 2011 AEMR, did not have any specific requirements for inclusion in the 2012 AEMR. As required by consent condition 105(v) a listing of any variations to approvals during the report period are provided in Section 1.4. There were no other requirements or actions to be addressed relating to the 2011 AEMR from the NSW Office of Water (NoW), DRE or EPA. Consent Condition 24 requires a Land Access, Management and Compensation Security in the form of a Bank Guarantee and that evidence of the Guarantee shall be provided in the Annual Environmental Management Report (AEMR). A copy of the current Bank Guarantee is included in Appendix 2. The remainder of this AEMR specifies the specific consent conditions being addressed at the beginning of each section.

Annual Environmental Management Report 2012
Page 9
2 COMPLIANCE WITH CONSENT CONDITIONS A summary of the compliance with the Mandalong Mine development consent DA97/800 has been determined through a compliance review in accordance with consent condition 105(i). This review applies to the DA 97/800.
2.1 CONSENT CONDITION 105 (I) – COMPLIANCE AUDIT MANDALONG MINE
A compliance review on the performance of the Mandalong Mine against the conditions of consent has been completed. The results of the review are tabulated and displayed in Appendix 3. There are no other statutory approvals relevant to Condition 105(i) requiring a compliance review in 2012.
2.2 CONSENT CONDITION 108 – INDEPENDENT ENVIRONMENTAL AUDIT
The next Independent Environmental Audit of the Mandalong Mine in accordance with consent condition 108 is required to be completed prior to March 31, 2013.

Annual Environmental Management Report 2012
Page 10
3 ENVIRONMENTAL MANAGEMENT The following is a summary of the specific requirements of relevant government departments with respect to the Mandalong Mine, in accordance with condition 105(ii) of the Mandalong Consent. Information is also provided on the Delta Entry Site. The government department requirements are in addition to the legislative requirements and the consent conditions for the Mandalong Mine.
3.1 ENVIRONMENTAL PROTECTION AUTHORITY (EPA) REQUIREMENTS
Mandalong Mine, Cooranbong and Delta Entry Sites – Centennial Mandalong holds EPL 365 under the Protection of the Environment Operations Act 1997 for the Mandalong Mine. The EPA in 2009 conducted an industry wide review of the coal mining EPL’s as required under s78 of the Protection of the Environment Operations Act 1997. The Mine consulted with the EPA on the proposed modifications and as a result the Mine’s EPL (no. 365) was varied in February 2011. Condition A1.2 was varied to be consistent with the modification (MOD 4) of development consent (DA97/800) by way of increasing the fee based activity scale to allow for coal mining and works up to 6 Million tonnes per anumm, consistent with development consent production limit. Changes to the premises details in condition A2 and naming of monitoring locations, condition P1 to be consistent with the premises operations were made to the EPL. The EPA modified condition M2.1 requiring the monitoring of additional water quality analysts from the licensed discharge points (LDP001 & 002) and to conduct an assessment of water quality against ANZECC (2000) after two years of monitoring. The requirement to operate a weather station and monitor weather at Mandalong Mine was incorporated by the addition of condition M7. Monitoring the volume of water discharged from LDP001 was amended to be by an electronic level sensor and continuous logger. Condition L5 was added restricting off site waste, requiring an EPL, from being received at the Mine. Control measures to manage dust from the premises and coal haulage activities were added in condition 3. The changes are consistent with the EPA’s approach to regulating coal mines in NSW. Mandalong Mine has either existing environmental control systems in place or has rectified these to comply with these conditions of the EPL. In December 2011 the EPA issued a separate variation notice for the preparation of a report on the practicability of implementing best practice measures to reduce particle emissions from Mandalong Mine. This condition was applied following consultation with the NSW Minerals Council, to each coal mine with an EPL in NSW as, a result of the EPA commissioned report on “Best Practice Measures to Prevent and or Minimise Emission of Particulate Matter from Coal Mines in the Greater Metropolitan Regions of NSW” (Keystone Environmental Pty Ltd, 2010).
3.2 NSW OFFICE OF WATER (NOW) REQUIREMENTS (FORMERLY DWE)
Mandalong, Cooranbong Services and Delta Entry Sites – NOW (formerly DWE) has not indicated in 2012 there are any additional requirements for environmental management other than the legislative requirement and condition of consent requirements for the reporting period.
3.3 NSW DEPARTMENT OF TRADE AND INVESTMENT – DIVISION RESOURCES AND ENERGY REQUIREMENTS (FORMERLY NSW I&I )
Mandalong, Cooranbong Services and Delta Entry Sites – The NSW DRE in 2012 did not indicate any specific environmental management requirements in addition to the legislative requirements and requirements of the consent conditions for the Mine. DRE in their letter dated 2 May 2012 found that the AEMR was acceptable for the reporting period and completed a site inspection on 26 April 2012.

Annual Environmental Management Report 2012
Page 11
3.4 LAKE MACQUARIE CITY COUNCIL (LMCC) REQUIREMENTS
Mandalong, Cooranbong Services and Delta Entry Sites – LMCC in 2012 did not indicate any specific environmental management requirements in addition to the legislative requirements and those previously agreed to in the Mandalong Haul Road Environmental Management Plans. Actions from the haul road management plans as discussed in Sections 5.8.3 and 9.4.

Annual Environmental Management Report 2012
Page 12
4 OPERATIONS DURING REPORTING PERIOD
4.1 EXPLORATION
Surface Exploration Exploration in 2012 included the drilling of five surface exploration boreholes (CM 108 to 112). Private landowners were notified of exploration drilling well in advance of drilling commencing, with the Mine providing a letter including information on the program and background information on exploration. Further consultation with landowners included discussions to formalise an ‘Access Agreement’ (Forests NSW Occupation Permit HW50477) and any residents within 450m of the proposed drill site were also informed in writing of any drilling activities within the area prior to work commencing. Exploration drill sites were surveyed and developed as described in the Mine’s Exploration Drilling Review of Environmental Factors (GSS 2008). Five surface boreholes (CM 108 to 112) located in Olney State Forest either side of Prickly Ridge Road, were ‘open hole’ drilled until the top of the conglomerate beam, and then cored to a nominal depth of 18m below the floor of the West Wallarah coal seam. This information was used to define the extent of the igneous sill that is known to have intruded the West Wallarah Seam, allowing more accurate mine planning, and to maximise resource recovery. Information on coal thickness, structure, coal quality, gas content and geotechnical characteristics of the seam overburden and floor were also obtained. The surface exploration boreholes were sealed with concrete and rehabilitated in 2012. Drill sites were reseeded to re-establish the native vegetation, or as per the landowner requirements, as described in Section 9.0. Further investigation including surface exploration drilling of these geological features will be undertaken in 2013 to accurately map their location, and will be used to plan future mine layout(s). Work has commenced and private landowner’s notified on the proposal to drill a further 19 exploration sites which are currently being assessed in a Review of Environmental Factors that was submitted to DRE in August 2012. Underground Exploration
A total of 26 inseam roof and floor coring holes were drilled from 13 locations in the Maingate 13 and Maingate 14 gateroad developments. This coring was undertaken to complement the geological information obtained from the 500m spaced surface exploration boreholes. The holes were drilled to depths of 8m up into the roof and down through the remainder of the West Wallarah Seam and the Awaba Tuff to the Fassifern Seam contact. The information was used to refine the geological and geotechnical model of Mandalong mine.
In addition gas drainage holes from Maingate 13 and Maingate 14 were extended to delineate and explore for silica rich dykes in the Longwall 14 panel and the planned Longwall panels 15 and 16. The silica rich dykes cannot be identified from surface magnetic surveys. Therefore inseam drilling is the only option to identify these silica rich dykes. The drilling extended gas drainage holes from Maingate 13 at 25CT to intersect the silica rich dyke in Longwall 15. Further delineation drilling is planned from Maingate 15 gateroad development. A further 2 inseam gas drainage boreholes from Maingate 14 at 8CT and 14CT respectively were extended to further delineate and evaluate the extent of an intrusion throughout longwall block 18. This dyke was previously identified from surface magnetic surveys as it is doleritic in composition. This dyke runs parallel to the longwall axis and is a moderately hard doleritic dyke. Similar dykes have previously been identified from inseam drilling.
Routine gas drainage drilling was also used to derive roof horizon profiles to refine the geological model.

Annual Environmental Management Report 2012
Page 13
Mandalong Southern Extension Project Centennial Mandalong holds an exploration licence EL6317 which adjoins the southern boundary of the existing Mandalong Mining Lease. The exploration programme has approval for fifty-three (53) partly cored boreholes. To date fifty boreholes have been drilled, which completes the exploration for the time being. A comprehensive range of testing and analysis has been undertaken on these boreholes to facilitate mine planning studies. A mine plan has now been determined. The seven nested ground water monitoring bores and a series of vibrating wire piezometers that were installed in 2011 have been monitored throughout the year for water level and water quality. This data along with the information from the continuous groundwater level data loggers within the alluvial monitoring bores has been used for the groundwater impact assessment for the Project. A project application for consent under Part 4 of the Environmental Planning and Assessment Act 1979 was made to the Department of Planning and Infrastructure in January 2012. The Director General’s Requirements (DGRs) for the Project were received on 20 March 2012. The environmental assessments required to meet these DGRs have continued during the later half of 2012. There was no exploration in the areas of the Cooranbong and Delta workings exploration licences in 2012.
4.2 MINE PRODUCTION
The longwall mining method was used at Mandalong Mine to extract coal during the reporting period from the West Wallarah Seam. Plan MG10815 shows the coal extracted from longwall panels and development units for the reporting period. Four continuous miner units operated during the reporting period developing the Maingate and Main Heading roadways for the longwall panels. The majority of coal produced was extracted from the longwall panels with a minor amount of coal produced from the continuous miner units developing the supporting roadways. Run of Mine (ROM) coal production in 2012 was from both Longwall 12 and Longwall 13 and the development of Maingate’s 13, 14, 15 and the continuation of the Main Headings. Longwall 12 commenced production on 3 November 2011 and completed extraction on 4 May 2012. Approximately 2km of the 3km longwall block length was completed during the report period. Longwall 13 commenced production on 18 June 2012 and completed extraction on 26 November 2012. There was no further longwall production for the remainder of 2012, with Longwall 14 scheduled to commence production in February 2013. During 2012, Maingate 13 completed development in May 2012 in preparation for Longwall 13, while Maingate 14 continued development throughout the year. Maingate 14 was developed with three headings to provide an additional roadway for mine ventilation. Two continuous miner units were used to develop the three heading maingate. Maingate 15 commenced production in June 2012 following the completion of Maingate 13 and transfer of mining equipment. The development of Main Headings was ongoing, advancing approximately 500m and completing the roadways required for the installation of Maingate 15 and 16. The development unit production is summarised in Table 2.

Annual Environmental Management Report 2012
Page 14
Table 2 Development Unit Production Metres January – December 2012
Development Panels
January 2012 Finish Date Developed Metres
Maingate 13 1/1/12 28/5/12 2910
Maingate 14 1/1/12 ongoing 11148
Maingate 15 9/6/12 ongoing 3065
Main Headings 1/1/12 ongoing 4027
A summary of the monthly and total annual production in 2012 is detailed in Table 3. ROM production for Mandalong Mine from 1st January 2012 to 31st December 2012 totalled 5,439,986 tonnes. Mandalong Mine produced 5,299,211 tonnes of saleable product coal in 2012. The removal of the ash in the washing process during the production of export coal at Newstan Colliery accounted for the losses of saleable product. During the reporting period 2,144,230 and 1,329,617 tonnes of saleable coal were delivered to Eraring or Vales Point Power Stations. Table 3 indicates the majority of ROM coal produced was delivered to Cooranbong Services site for processing through the coal handling plant before delivery via Eraring’s overland conveyor to Eraring Power Station.
In 2012, the total volume of coal (4,182,565t) transported from the Mandalong Mine to the Cooranbong Services Site was above the tonnage limit in the consent. Centennial Mandalong advised the Department of Planning and Infrastructure of this exceedance on 20 November 2012. Accordingly as a result of this exceedance the Mandalong Mine has implemented the following measures:
Include consent tonnage limits in the Site Business Risk Assessment; and Schedule additional actions within the Compliance database to review production
tonnages at the business planning and marketing stage and regular auditing of production rates to ensure limits are not exceeded.
ROM coal was transported by trucks on the Mandalong private haul road with 2,038,335 tonnes sent to the Newstan Colliery washery. The washed coal was then transported by rail to the port of Newcastle for export.

Annual Environmental Management Report 2012
Page 15
Table 3: Production Tonnes and Saleable Tonnes in 2012
4.3 WASTE MANAGEMENT
Waste oil and greases are stored in tanks and drums within bunded areas for removal by JR Richards for recycling or disposal. Oil water separation is achieved by the use of two hydro-cyclone oil water separators at Mandalong and one at Cooranbong on flows from vehicle work and storage areas and the Wash Down Bays. Hydrocarbon spill kits are inspected weekly by JR Richards and re-stocked as required. Oily rag bins and oil filter bins are also serviced by J. R. Richards on a weekly basis. Office paper and cardboard is collected and recycled by JR Richards on a weekly basis. Metals are collected and stored in steel bins at Mandalong and Cooranbong. Simm’s Metal is contracted to collect the scrap metal. In 2012, a total of 216.6 tonnes of scrap steel was collected by Simm’s Metal. General refuse and non-recyclable materials are sorted and stored in 30m steel bins at Mandalong and Cooranbong. The material was collected by JR Richards for disposal in 2012. In 2012, 459.5 tonnes of refuse material was taken off-site by JR Richards. Of the total waste collected at Mandalong, 75% was recycled including steel, liquid waste, oils, paper and cardboard, filters grease, oily rags and oil filters.
ROM Tonnes
Total Saleable Product Tonnes
Saleable Product to Eraring PS
Saleable to Product
Vales Point PS
Saleable Product to
Export
Jan 2012 595,777 579,364 284,543 128,123 150,364
Feb 2012 574,769 547,575 120,654 127,663 278,117
March 2012 648,231 639,088 219,608 143,470 228,376
April 2012 324,824 309,811 79,672 71,681 193,238
May 2012 60,174 59,820 2,996 53,719 184,869
June 2012 150,618 149,407 89,535 21,527 22,889
July 2012 646,306 619,240 300,381 124,195 103,333
Aug 2012 644,654 627,357 340,616 144,348 180,185
Sept 2012 752,105 745,154 335,360 164,490 250,741
Oct 2012 644,103 628,148 230,859 213,645 152,426
Nov 2012 348,482 344,455 140,006 86,963 238,598
Dec 2012 49,943 49,793 0 49,793 55,199
Total 2012 CY 5,439,986 5,299,211 2,144,230 1,329,617 2,038,335
Annual Environmental Management Report 2012
Page 16
5 MONITORING Mandalong
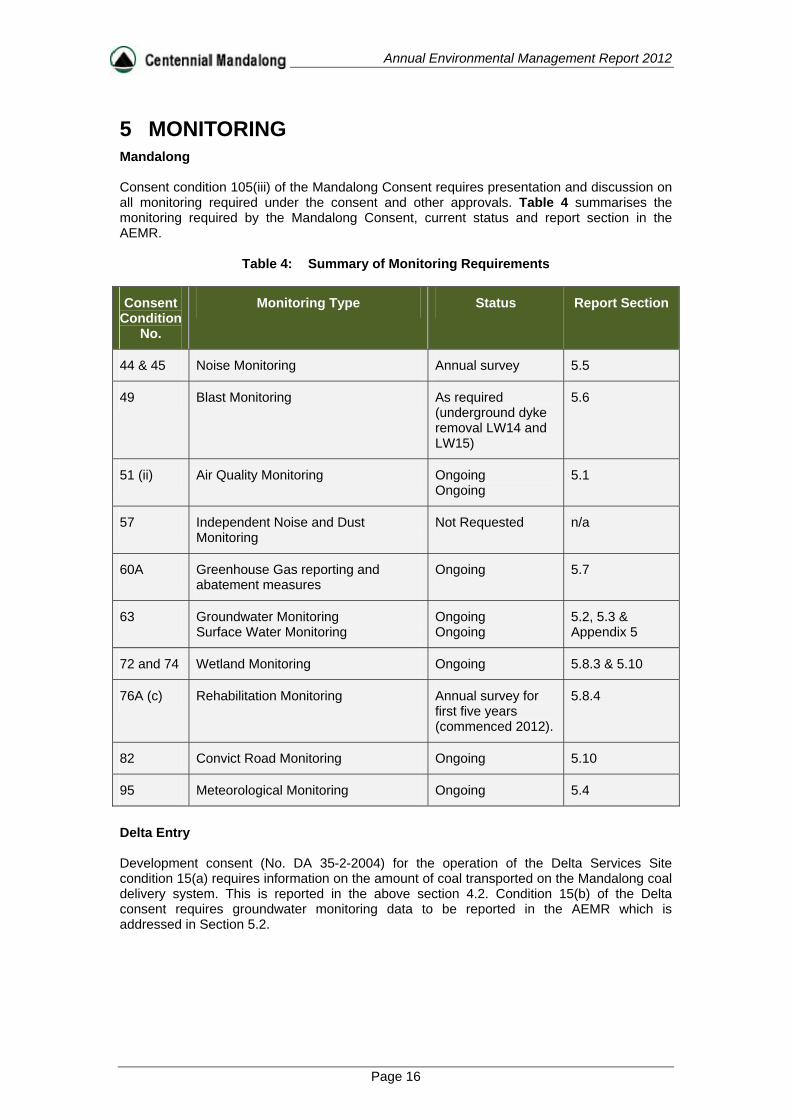
Consent condition 105(iii) of the Mandalong Consent requires presentation and discussion on all monitoring required under the consent and other approvals. Table 4 summarises the monitoring required by the Mandalong Consent, current status and report section in the AEMR.
Table 4: Summary of Monitoring Requirements
Consent Condition
No.
Monitoring Type Status Report Section
44 & 45 Noise Monitoring Annual survey 5.5
49 Blast Monitoring As required (underground dyke removal LW14 and LW15)
5.6
51 (ii) Air Quality Monitoring Ongoing Ongoing
5.1
57 Independent Noise and Dust Monitoring
Not Requested n/a
60A Greenhouse Gas reporting and abatement measures
Ongoing 5.7
63 Groundwater Monitoring Surface Water Monitoring
Ongoing Ongoing
5.2, 5.3 & Appendix 5
72 and 74 Wetland Monitoring Ongoing 5.8.3 & 5.10
76A (c) Rehabilitation Monitoring Annual survey for first five years (commenced 2012).
5.8.4
82 Convict Road Monitoring Ongoing 5.10
95 Meteorological Monitoring Ongoing 5.4
Delta Entry Development consent (No. DA 35-2-2004) for the operation of the Delta Services Site condition 15(a) requires information on the amount of coal transported on the Mandalong coal delivery system. This is reported in the above section 4.2. Condition 15(b) of the Delta consent requires groundwater monitoring data to be reported in the AEMR which is addressed in Section 5.2.
Annual Environmental Management Report 2012
Page 17
5.1 DEPOSITIONAL DUST MONITORING
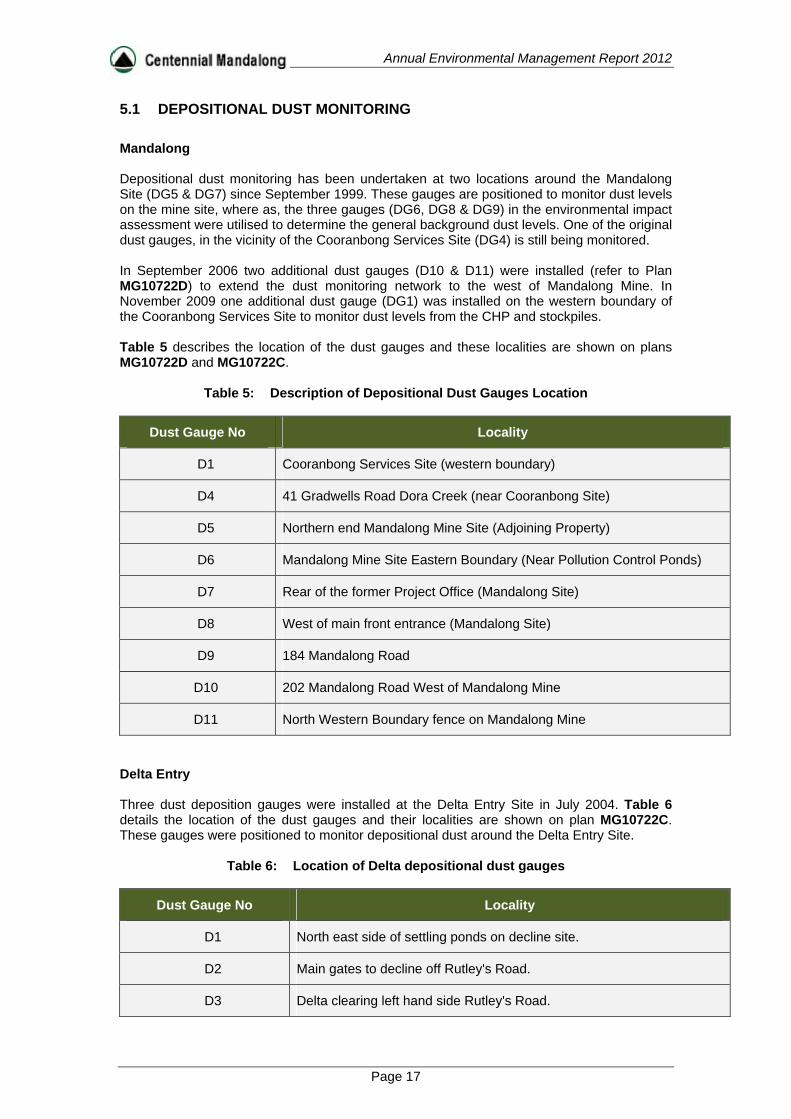
Mandalong Depositional dust monitoring has been undertaken at two locations around the Mandalong Site (DG5 & DG7) since September 1999. These gauges are positioned to monitor dust levels on the mine site, where as, the three gauges (DG6, DG8 & DG9) in the environmental impact assessment were utilised to determine the general background dust levels. One of the original dust gauges, in the vicinity of the Cooranbong Services Site (DG4) is still being monitored. In September 2006 two additional dust gauges (D10 & D11) were installed (refer to Plan MG10722D) to extend the dust monitoring network to the west of Mandalong Mine. In November 2009 one additional dust gauge (DG1) was installed on the western boundary of the Cooranbong Services Site to monitor dust levels from the CHP and stockpiles.
Table 5 describes the location of the dust gauges and these localities are shown on plans MG10722D and MG10722C.
Table 5: Description of Depositional Dust Gauges Location
Dust Gauge No Locality
D1 Cooranbong Services Site (western boundary)
D4 41 Gradwells Road Dora Creek (near Cooranbong Site)
D5 Northern end Mandalong Mine Site (Adjoining Property)
D6 Mandalong Mine Site Eastern Boundary (Near Pollution Control Ponds)
D7 Rear of the former Project Office (Mandalong Site)
D8 West of main front entrance (Mandalong Site)
D9 184 Mandalong Road
D10 202 Mandalong Road West of Mandalong Mine
D11 North Western Boundary fence on Mandalong Mine
Delta Entry Three dust deposition gauges were installed at the Delta Entry Site in July 2004. Table 6 details the location of the dust gauges and their localities are shown on plan MG10722C. These gauges were positioned to monitor depositional dust around the Delta Entry Site.
Table 6: Location of Delta depositional dust gauges
Dust Gauge No Locality
D1 North east side of settling ponds on decline site.
D2 Main gates to decline off Rutley's Road.
D3 Delta clearing left hand side Rutley's Road.

Annual Environmental Management Report 2012
Page 18
5.1.1 Depositional Dust Results
Mandalong
Depositional dust monitoring results are shown in Table 7. The results are presented as:
long-term average;
age (all data since the commencement of monitoring at its present location - Sept 1999 to present);
average during the report period (January 2012 to December 2012); and
Pre-construction average (September 1999 to August 2000). The complete monthly depositional dust results are included in Appendix 4.
* not available. Dust gauges installed after commencing construction.
Table 7: Summary of depositional dust results between January 2012 and December 2012 surrounding Mandalong Mine
Delta Entry
Depositional dust monitoring results are provided in
Table 8. The complete monthly dust monitoring data for Delta are included in Appendix 4.
Table 8: Summary of Depositional Dust Results between January 2012 and December
2012 surrounding Delta Entry Site
Insoluble Solids (Combustible Matter + Ash) g/m2/month
DG1 DG2 DG3
Long Term Average 0.7 0.8 0.6
Average 2012 (AEMR Period) 0.5 0.5 0.5
EPA Dust Deposition Goal 4.0 4.0 4.0
Insoluble Solids (Combustible Matter + Ash) g/m2/month
DG5 DG6 DG7 DG8 DG9 DG10 DG11
Long Term Average 0.9 1.3 1.4 0.9 1.2 1.3 1.2
Average 2012 (AEMR Period) 0.7 1.2 1.1 0.8 0.8 1.9 0.9
Pre Construction Average 0.7 0.8 3.2 0.9 0.9 * *
DECCW Dust Deposition Goal
4.0 4.0 4.0 4.0 4.0 4.0 4.0
Annual Environmental Management Report 2012
Page 19
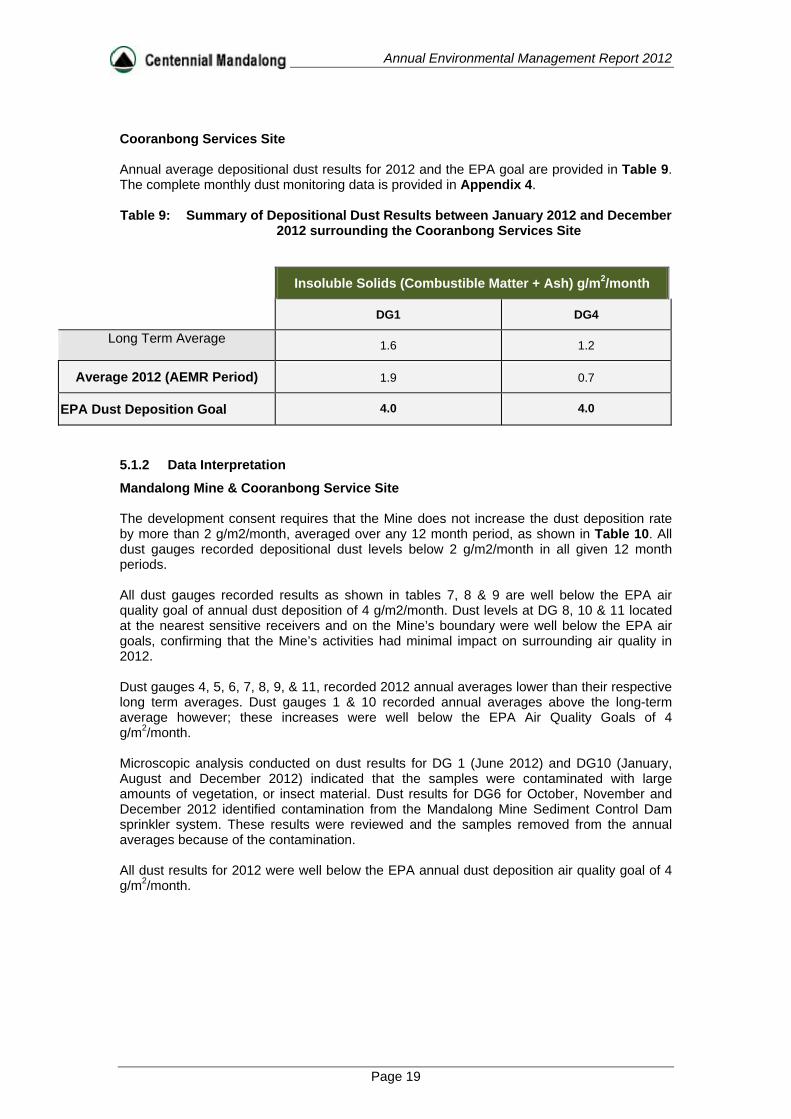
Cooranbong Services Site Annual average depositional dust results for 2012 and the EPA goal are provided in Table 9. The complete monthly dust monitoring data is provided in Appendix 4. Table 9: Summary of Depositional Dust Results between January 2012 and December
2012 surrounding the Cooranbong Services Site
Insoluble Solids (Combustible Matter + Ash) g/m2/month
DG1 DG4
Long Term Average 1.6 1.2
Average 2012 (AEMR Period) 1.9 0.7
EPA Dust Deposition Goal 4.0 4.0
5.1.2 Data Interpretation
Mandalong Mine & Cooranbong Service Site The development consent requires that the Mine does not increase the dust deposition rate by more than 2 g/m2/month, averaged over any 12 month period, as shown in Table 10. All dust gauges recorded depositional dust levels below 2 g/m2/month in all given 12 month periods. All dust gauges recorded results as shown in tables 7, 8 & 9 are well below the EPA air quality goal of annual dust deposition of 4 g/m2/month. Dust levels at DG 8, 10 & 11 located at the nearest sensitive receivers and on the Mine’s boundary were well below the EPA air goals, confirming that the Mine’s activities had minimal impact on surrounding air quality in 2012. Dust gauges 4, 5, 6, 7, 8, 9, & 11, recorded 2012 annual averages lower than their respective long term averages. Dust gauges 1 & 10 recorded annual averages above the long-term average however; these increases were well below the EPA Air Quality Goals of 4 g/m2/month. Microscopic analysis conducted on dust results for DG 1 (June 2012) and DG10 (January, August and December 2012) indicated that the samples were contaminated with large amounts of vegetation, or insect material. Dust results for DG6 for October, November and December 2012 identified contamination from the Mandalong Mine Sediment Control Dam sprinkler system. These results were reviewed and the samples removed from the annual averages because of the contamination. All dust results for 2012 were well below the EPA annual dust deposition air quality goal of 4 g/m2/month.

Annual Environmental Management Report 2012
Page 20
Table 10: Detailed Dust Monitoring and Analysis showing the Annual Rolling Average and Change in Deposition from the Pre-construction
Average (PCA) for Dust Gauges DG6, DG8 and DG9
DG6 DG8 DG9
Date
Monitored Dust
12 Month
Average
Change from PCA
Monitored Dust
12 Month
Average
Change from PCA
Monitored Dust
12 Month
Average
Change from PCA
19/01/2012 0.4 1.7 0.8 0.5 0.5 -0.4 1.5 0.9 0.0
20/02/2012 0.2 1.6 0.7 0.8 0.5 -0.4 1.5 1.0 0.1
20/03/2012 0.6 1.4 0.6 0.2 0.5 -0.4 0.2 0.9 0.0
19/04/2012 1 1.3 0.5 1.7 0.6 -0.3 0.8 1.0 0.0
21/05/2012 1 1.3 0.4 0.1 0.6 -0.4 0.1 1.0 0.0
21/06/2012 1 1.3 0.4 0.6 0.6 -0.3 0.2 0.8 -0.1
23/07/2012 3 1.4 0.6 0.4 0.6 -0.3 0.2 0.8 -0.1
22/08/2012 2.4 1.3 0.4 0.3 0.6 -0.3 0.2 0.8 -0.1
19/09/2012 1 1.2 0.4 1.5 0.7 -0.2 0.6 0.9 -0.1
18/10/2012 * 1.3 0.4 0.9 0.7 -0.2 0.4 0.8 -0.1
19/11/2012 * 1.2 0.4 1.3 0.8 -0.2 1 0.9 0.0
18/12/2012 * 1.2 0.3 0.7 0.8 -0.2 2.7 0.8 -0.1
* Results excluded due to contamination
Delta Entry Average annual depositional dust results for dust gauges DG1, DG2 and DG3 are relatively low. The highest average depositional dust rate for the period was 0.5 g/m2/month for DG 1, DG 2 and DG 3. All 2012 annual depositional dust level averages were below the long term annual average results. All results are well below the EPA air quality goal of 4 g/m2/month and are provided in Appendix 4.

Annual Environmental Management Report 2012
Page 21
5.2 GROUNDWATER MONITORING
Mandalong Groundwater is monitored on a monthly frequency at the groundwater wells shown on the plan MG10502. Delta Construction of the Delta decline tunnel was completed in 2005. No groundwater monitoring was required in 2012 due to water reporting via inseam pumps to the Cooranbong Services Site and is monitored at LDP001.
5.2.1 Groundwater Monitoring Results
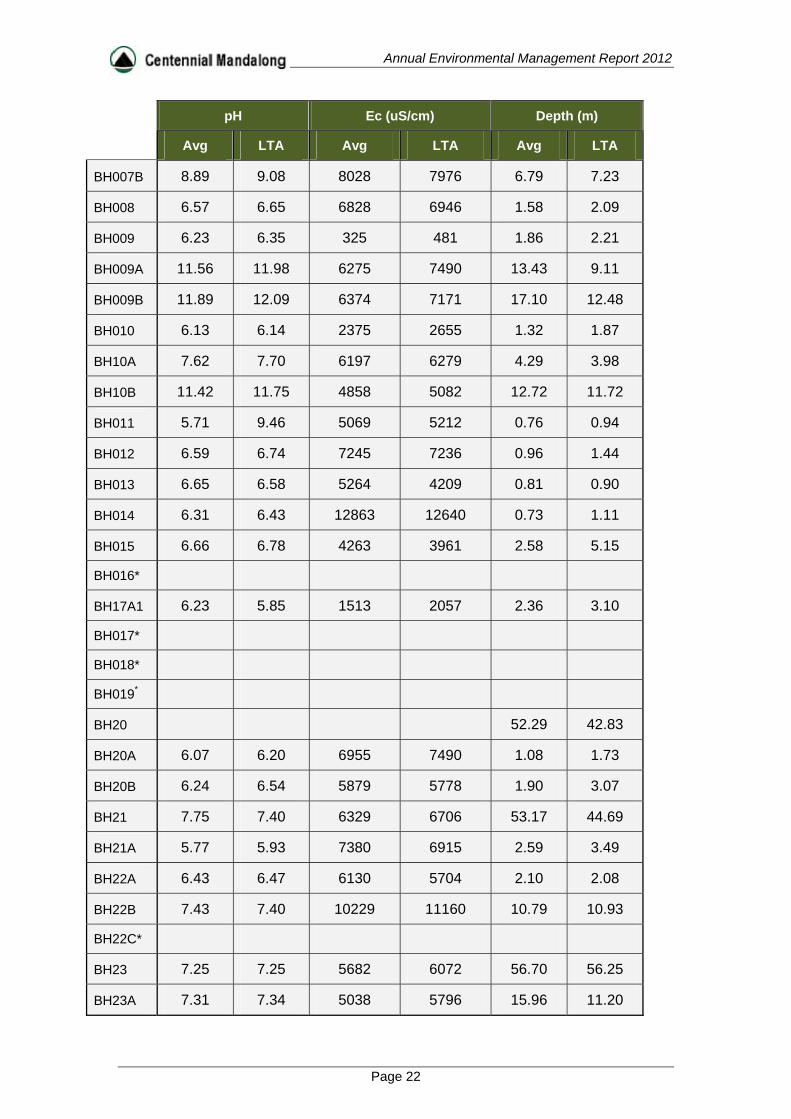
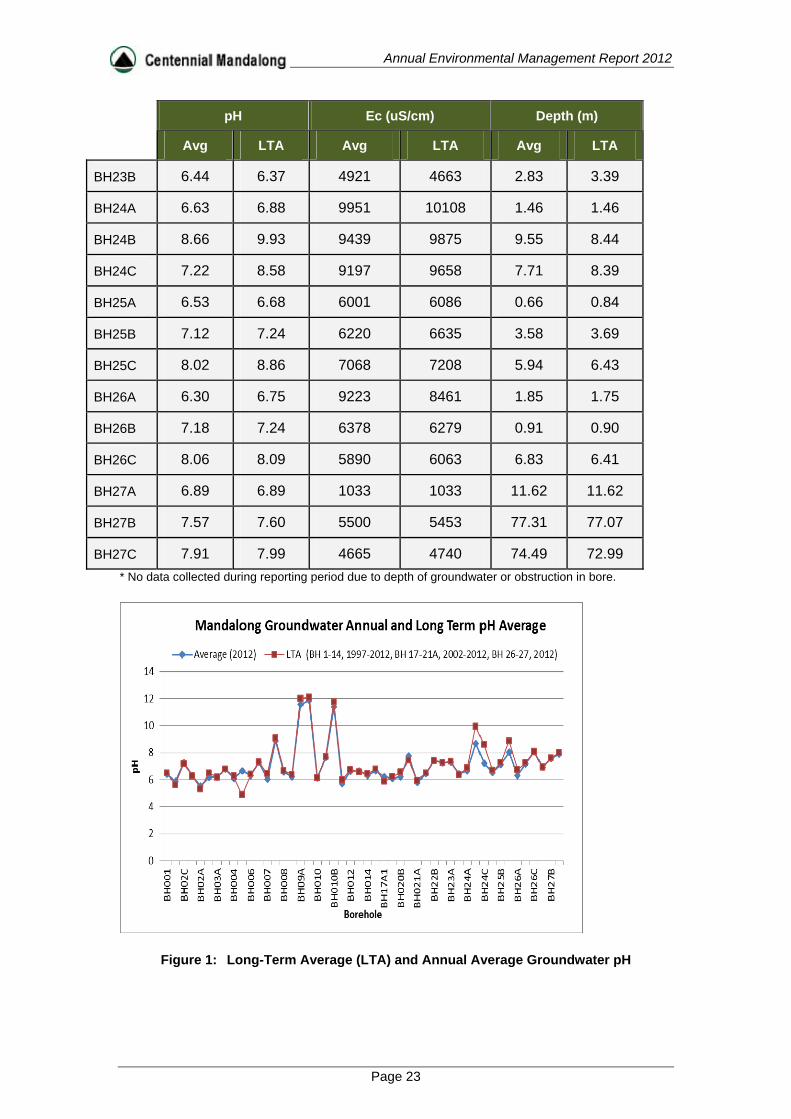
Mandalong The groundwater monitoring results are summarised in Table 11 and Figure 1, Figure 2 & Figure 3. The individual borehole results are provided in Appendix 5. Hydrographs of the groundwater levels and Electrical Conductivity (EC) are included in the AGE report (2013) provided in Appendix 5.
Table 11: Average Groundwater Quality for the Mandalong Valley for the 12 month period from January 2012 to December 2012 (‘Avg’) and the Long-Term
Average (‘LTA’).
pH Ec (uS/cm) Depth (m)
Avg LTA Avg LTA Avg LTA
BH001 6.38 6.46 496 510 3.41 3.52
BH002 5.88 5.63 2821 4523 1.93 2.66
BH002A 7.25 7.15 6313 6070 20.9 19.14
BH002B 6.29 6.26 6696 6684 2.75 3.3
BH002C 5.53 5.33 497 2318 2.18 2.85
BH003 6.16 6.48 3141 3059 3.3 3.55
BH003A 6.17 6.18 6625 6680 2.54 2.9
BH003B 6.77 6.77 8725 9812 18.05 16.06
BH004 6.1 6.24 12771 13257 0.5 0.76
BH005 6.64 4.86 2146 12589 0.98 1.33
BH006 6.32 6.4 4420 4675 2.64 2.81
BH006A 7.29 7.31 7070 7859 9.76 8.47
BH006B*
BH007 6.06 6.42 11665 9830 1.07 1.1
BH007A*
Annual Environmental Management Report 2012
Page 22
pH Ec (uS/cm) Depth (m)
Avg LTA Avg LTA Avg LTA
BH007B 8.89 9.08 8028 7976 6.79 7.23
BH008 6.57 6.65 6828 6946 1.58 2.09
BH009 6.23 6.35 325 481 1.86 2.21
BH009A 11.56 11.98 6275 7490 13.43 9.11
BH009B 11.89 12.09 6374 7171 17.10 12.48
BH010 6.13 6.14 2375 2655 1.32 1.87
BH10A 7.62 7.70 6197 6279 4.29 3.98
BH10B 11.42 11.75 4858 5082 12.72 11.72
BH011 5.71 9.46 5069 5212 0.76 0.94
BH012 6.59 6.74 7245 7236 0.96 1.44
BH013 6.65 6.58 5264 4209 0.81 0.90
BH014 6.31 6.43 12863 12640 0.73 1.11
BH015 6.66 6.78 4263 3961 2.58 5.15
BH016*
BH17A1 6.23 5.85 1513 2057 2.36 3.10
BH017*
BH018*
BH019*
BH20 52.29 42.83
BH20A 6.07 6.20 6955 7490 1.08 1.73
BH20B 6.24 6.54 5879 5778 1.90 3.07
BH21 7.75 7.40 6329 6706 53.17 44.69
BH21A 5.77 5.93 7380 6915 2.59 3.49
BH22A 6.43 6.47 6130 5704 2.10 2.08
BH22B 7.43 7.40 10229 11160 10.79 10.93
BH22C*
BH23 7.25 7.25 5682 6072 56.70 56.25
BH23A 7.31 7.34 5038 5796 15.96 11.20
Annual Environmental Management Report 2012
Page 23
pH Ec (uS/cm) Depth (m)
Avg LTA Avg LTA Avg LTA
BH23B 6.44 6.37 4921 4663 2.83 3.39
BH24A 6.63 6.88 9951 10108 1.46 1.46
BH24B 8.66 9.93 9439 9875 9.55 8.44
BH24C 7.22 8.58 9197 9658 7.71 8.39
BH25A 6.53 6.68 6001 6086 0.66 0.84
BH25B 7.12 7.24 6220 6635 3.58 3.69
BH25C 8.02 8.86 7068 7208 5.94 6.43
BH26A 6.30 6.75 9223 8461 1.85 1.75
BH26B 7.18 7.24 6378 6279 0.91 0.90
BH26C 8.06 8.09 5890 6063 6.83 6.41
BH27A 6.89 6.89 1033 1033 11.62 11.62
BH27B 7.57 7.60 5500 5453 77.31 77.07
BH27C 7.91 7.99 4665 4740 74.49 72.99
* No data collected during reporting period due to depth of groundwater or obstruction in bore.
Figure 1: Long-Term Average (LTA) and Annual Average Groundwater pH

Annual Environmental Management Report 2012
Page 24
0
2000
4000
6000
8000
10000
12000
14000
BH001
BH02C
BH02A
BH03A
BH004
BH006
BH007
BH008
BH09A
BH010
BH010B
BH012
BH014
BH17A1
BH020B
BH021A
BH22B
BH23A
BH24A
BH24C
BH25B
BH26A
BH26C
EcMandalong Groundwater Annual and Long Term Ec
AverageAverage (2012)
Figure 2: Long-term Average (LTA) and Annual Average Groundwater EC
0
10
20
30
40
50
60
70
80
BH001
BH02C
BH02A
BH03A
BH004
BH006
BH007
BH008
BH09A
BH010
BH010B
BH012
BH014
BH17A1
BH020B
BH021A
BH22B
BH23A
BH24A
BH24C
BH25B
BH26A
BH26C
Metres
Borehole
Mandalong Groundwater Annual and Long Term Depth to Water Average
Average (2012) LTA (BH 1‐14, 1997‐2012, BH 17‐21A, 2002‐2012, BH 26‐27, 2
Figure 3: Long-term Average (LTA) and Annual Average Groundwater Borehole Depth (m)

Annual Environmental Management Report 2012
Page 25
Delta Entry
Groundwater monitoring at the Delta site was finalised at the completion of construction in December 2005. No groundwater is discharged at the Delta site. The Delta underground workings are limited to two Maingate roadways therefore, inseam groundwater make is minimal and is pumped via the existing inseam dewatering system to the Cooranbong longwall void area and discharged via LDP001 at the Cooranbong entry site.
5.2.2 Data Interpretation
Mandalong This section discusses the recorded groundwater data. The natural groundwater system shows some variability in quality and depth. The pH ranges from a low of 5.02 in May 2012 at BH011 to a high of 12.17 at BH009A in January 2012 and BH009B in October 2012. The majority of boreholes display an annual pH average very similar to their respective long-term averages. BH05 however showed a difference in the annual average pH as well as EC compared to the long term average with the results further discussed in section 8.1.3.2. The electrical conductivity (analogous to salt content) is characterised by variability. The freshest water (lowest EC) is found at BH002C, with an EC of 125 μS/cm in April 2012. The most saline water was found at BH007, with an EC of 19610 μS/cm recorded in March 2012. These results are relatively consistent with the long-term trend except for BH005 as mentioned previously. The recorded depth is relative to the ground surface. The deepest water is found at BH27B averaging 77.31 m during the report period. The shallowest groundwater is found at BH004, which averaged 0.5m for the reporting period. Figure 3 shows the annual average and long-term average depths are very similar with only minor variations for most boreholes. A discussion on the groundwater results in relation to mining is contained within section 8.1.3.2 of the AEMR and full review of the data in the AGE (2013) report is provided in Appendix 5.
Annual Environmental Management Report 2012
Page 26
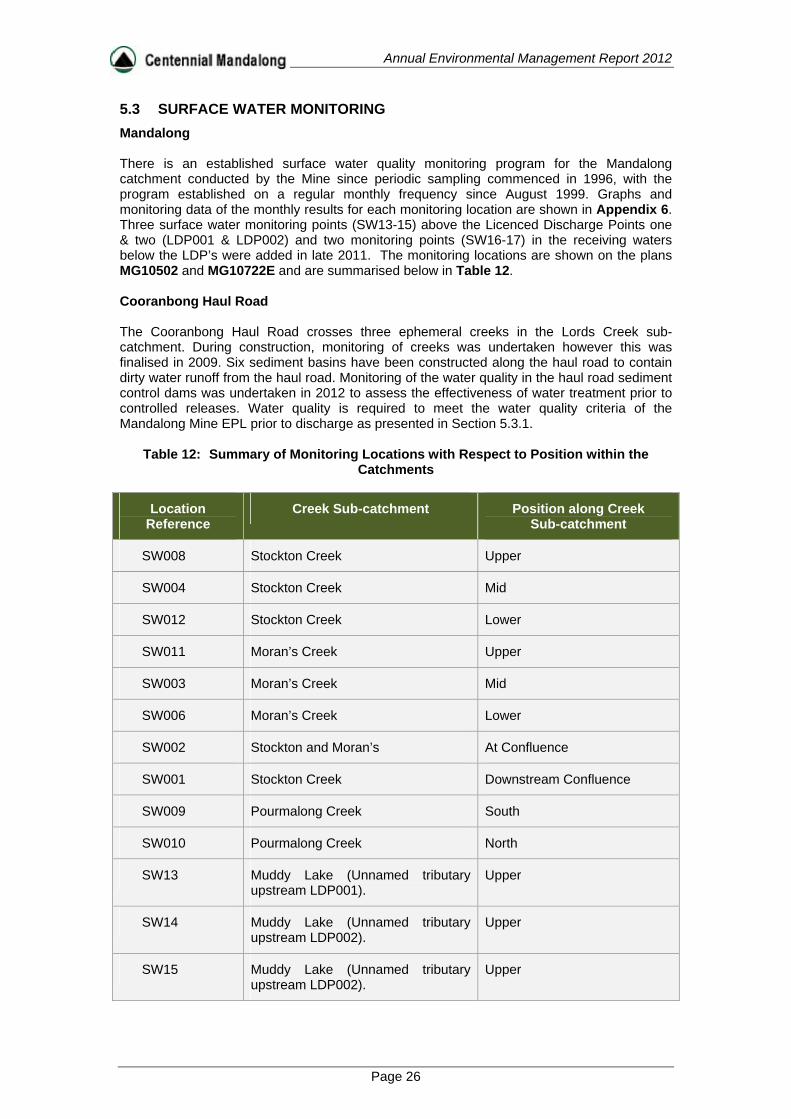
5.3 SURFACE WATER MONITORING
Mandalong There is an established surface water quality monitoring program for the Mandalong catchment conducted by the Mine since periodic sampling commenced in 1996, with the program established on a regular monthly frequency since August 1999. Graphs and monitoring data of the monthly results for each monitoring location are shown in Appendix 6. Three surface water monitoring points (SW13-15) above the Licenced Discharge Points one & two (LDP001 & LDP002) and two monitoring points (SW16-17) in the receiving waters below the LDP’s were added in late 2011. The monitoring locations are shown on the plans MG10502 and MG10722E and are summarised below in Table 12. Cooranbong Haul Road
The Cooranbong Haul Road crosses three ephemeral creeks in the Lords Creek sub-catchment. During construction, monitoring of creeks was undertaken however this was finalised in 2009. Six sediment basins have been constructed along the haul road to contain dirty water runoff from the haul road. Monitoring of the water quality in the haul road sediment control dams was undertaken in 2012 to assess the effectiveness of water treatment prior to controlled releases. Water quality is required to meet the water quality criteria of the Mandalong Mine EPL prior to discharge as presented in Section 5.3.1.
Table 12: Summary of Monitoring Locations with Respect to Position within the Catchments
Location Reference
Creek Sub-catchment Position along Creek Sub-catchment
SW008 Stockton Creek Upper
SW004 Stockton Creek Mid
SW012 Stockton Creek Lower
SW011 Moran’s Creek Upper
SW003 Moran’s Creek Mid
SW006 Moran’s Creek Lower
SW002 Stockton and Moran’s At Confluence
SW001 Stockton Creek Downstream Confluence
SW009 Pourmalong Creek South
SW010 Pourmalong Creek North
SW13 Muddy Lake (Unnamed tributary upstream LDP001).
Upper
SW14 Muddy Lake (Unnamed tributary upstream LDP002).
Upper
SW15 Muddy Lake (Unnamed tributary upstream LDP002).
Upper

Annual Environmental Management Report 2012
Page 27
Location Reference
Creek Sub-catchment Position along Creek Sub-catchment
SW16 Muddy Lake (Unnamed water body 1km downstream Simpson Rd Causeway Crossing)
Mid
SW17 Muddy Lake (North Dora Creek Village)
Lower
5.3.1 Surface Water Monitoring Results
Mandalong Surface water quality is monitored at 15 locations on a monthly or quarterly basis. These locations encompass four different catchment areas. The water is tested for pH, Total Suspended Solids (TSS) and Specific Conductance/Electrical Conductivity (EC). The annual and long-term average (LTA) results are summarised in Table 13.
Table 13: Average Surface Water Quality for the 12 month Period from January 2012 to December 2012 (‘Annual’) and the Long-term Average (‘LTA’).
Site Location Catchment
pH TSS
Specific Conductance
uS/cm
Average LTA Average LTA Average LTA
SW008 Stockton 7.2 5.8 11.2 34.8 1083.5 859.3
SW004 7.1 6.7 11 18.4 905.3 638.2
SW012 6.7 6 22.5 31.8 1957.8 1109.5
SW011 Moran’s 6.6 6.6 15.8 57.9 1047.4 563.8
SW006 6.7 6.6 20.4 17.3 545.6 551.7
SW003 6.6 6.4 10 15.6 572.5 496.8
SW002
Stockton and Moran’s Creek (Confluence) 7 7.0 8.1 15.6 10813.6 15524.7
SW001 7.1 7.2 4.3 12.7 27997.4 31471.3
SW009 Pourmalong 6.8 6.5 10 20.6 401.7 273.9
SW010 6.1 6.2 9.3 19.7 764.3 318.2
SW013 7.1 6.9 21.2 31.8 297.1 323.1
SW014 7.28 7.14 25.1 27.47 454.7 512.42
SW015 Muddy Lake 6.08 6 82.82 81.81 94.82 109.25

Annual Environmental Management Report 2012
Page 28
Site Location Catchment
pH TSS
Specific Conductance
uS/cm
Average LTA Average LTA Average LTA
SW016 8.17 8.1 20.33 20.46 1977.67 1868.23
SW017 8.21 8.09 1107.91 1030.
42 3363.64 3170
Note : Annual averages for SW18 are not provided as sampling commenced in August 2012. Cooranbong Water quality was monitored daily as per the requirements of EPL 365 at Licence Discharge Points (LDP) LDP001 and LDP002 located at the Cooranbong Services site as shown on the plan MG10722E. The water is tested for pH, Total Suspended Solids (TSS) and Oil and Grease (mg/L). The average annual results at LDP001 & 2 are summarised in Table 14 and Table 15. Graphs of the LDP001 & 2 water quality results for these parameters are provided in Appendix 6. In March 2011, the EPA modified the Mine’s licence to include sampling for metals at LDP001 & 2 for the purpose of collecting two years of baseline data and conducting an assessment against ANZECC (2000) water quality guidelines. The Mine continues to monitor metals for the purpose of undertaking this assessment when two years data is available in February 2013. All metal results obtained in 2012 at these locations are provided in Appendix 6. Table 14: Cooranbong Entry– Average Quality of Discharge Water Discharged through EPA Licensed Discharge Point 1 (LDP001)
Average Water Quality Monitoring Required by EPA Licence 365
AEMR Period pH TSS (mg/L) Oil & Grease (mg/L)
LDP001 8.00 1.26 0.07
Table 15: Cooranbong Entry –Average Quality of Discharge Water Discharged through EPA Licensed Discharge Point 2 (LDP002)
Average Water Quality Monitoring Required by EPA Licence 365
AEMR Period pH TSS (mg/L) Oil & Grease (mg/L)
LDP002 7.18 17.02 0.11
5.3.2 Data Interpretation
The results presented in Table 13 are characteristic of the natural conditions of the area, particularly Stockton and Moran’s Creek. Both Stockton and Moran’s creek are the main drainage systems for the Mandalong area. Stockton Creek is located within Mining Area 1 (longwall mining area) while Moran’s Creek is situated outside the current longwall mining area to the south east of the longwall panels.

Annual Environmental Management Report 2012
Page 29
Mandalong Surface waters are tested for pH, Total Suspended Solids (TSS) and Specific Conductance/Electrical Conductivity (EC) and the annual and long-term average (LTA) results are summarised in Table 13. Appendix 6 contains graphs of EC, pH and TSS for each of the surface water monitoring points sampled in 2012. The monitoring sites are sampled each month at SW001, SW002, SW003, SW004, SW006, SW008 SW011, SW012, SW013, SW014, SW015, SW016 and SW017 and quarterly for SW009 & SW010 during this period. The EC (salt content) for the 2012 period shows a relatively consistent level compared to the long-term average. The average EC recorded for sites SW01, SW02, SW06, SW013, SW014 and SW015 this period is lower than the long-term average. The average total suspended solids (TSS) for 2012 are relatively low and are characteristic of natural surface water conditions in creeks. SW015 (Muddy Lake) recorded the highest annual average TSS of 82.82 mg/L in 2012. At sites SW01, SW02, SW03, SW04, SW08, SW09, SW010, SW011, SW012, SW013 and SW014 the 2012 average was lower than the LTA. At the majority of monitoring points, the results showed an annual average pH similar to the long-term average. SW010 and SW015 had the lowest pH average of 6.1 and 6.08 respectively. The highest pH average recorded during 2012 was 7.28 recorded at SW014. Cooranbong Plan MG10722B shows the discharge monitoring points for LDP001 and LDP002. The results shown in Table 14 indicate an average pH 8.00 at LDP001 was slightly higher then the 2011 average pH of 7.98. Average Total Suspended Solids (TSS) at LDP001 of 1.26 mg/L was recorded in 2012. LDP002’s average TSS of 17.02 mg/L, pH 7.18 and low levels of Oil and Grease were similar to the 2011 average (TSS 29 mg/L, pH 7.16, O&G 0.28 mg/L). EPL 365 permits the Mandalong Mine to discharge a maximum of 5 ML/day from LDP001 and exceed this limit when 10 mm rainfall has fallen in the prior 24 hours. The average daily discharge volume of 1.586 ML was recorded at LDP001 in 2012 and the highest daily discharge was 8.027 ML in February 2012 following a 70 mm rainfall over the preceding two days. Surface water runoff from the hardstand area at the Cooranbong Services Site drains to the 5 ML dam as shown in plan MG10722B to provide settling capacity to treat suspended solids. Water runoff from the workshop, hydrocarbon storage areas drain to an oil water separator to remove oily water before entering the dam. Cooranbong Haul Road Monitoring for the surface water in the six sediment control dams on the haul road was conducted to determine compliance with the EPA licence limits prior to discharge. Water was discharged from the sediment basins on 5 occasions in 2012. Prior to discharge the sediment control dams where treated by adding a flocculent to the water to remove suspended solids. Treated water discharged from the sediment control dams ranged in quality from 0mg/L to 49 mg/L TSS and pH 6.8-8.0 in 2012. No oil and grease was evident in any of the discharge events. Water quality in the haul road sediment control dams met the water quality discharge criteria detailed in the Mandalong Mine EPA licence and the Cooranbong Haul Road Surface Water Management Plan.

Annual Environmental Management Report 2012
Page 30
5.4 METEOROLOGICAL MONITORING
An automatic weather station has provided on site meteorological monitoring results since June 1999. The weather station records wind speed and direction, temperature, evaporation and rainfall.
5.4.1 Wind Monitoring Results
Wind speed data is shown in Table 16. Wind speed and direction are shown graphically in, Figure 4, Figure 5 , Figure 6 and Figure 7.
Table 16: Average Wind Speed (metres per second) and Maximum Instantaneous Wind
Speed Recorded at Mandalong Mine for the Period January 2012 to December 2012.
Month
Wind Speed (m/sec)
Average Maximum
January 1.73 2.757
February 1.337 2.334
March 1.381 2.472
April 1.115 2.45
May 0.797 2.244
June 1.008 2.977
July 1.174 2.058
August 1.433 3.264
September 1.517 3.508
October 1.613 3.016
November 1.647 2.528
December 1.820 2.889

Annual Environmental Management Report 2012
Page 31
Figure 4: Average Daily Wind Direction Recorded for Summer 2012
Figure 5: Average Daily Wind Direction Recorded for Spring 2012
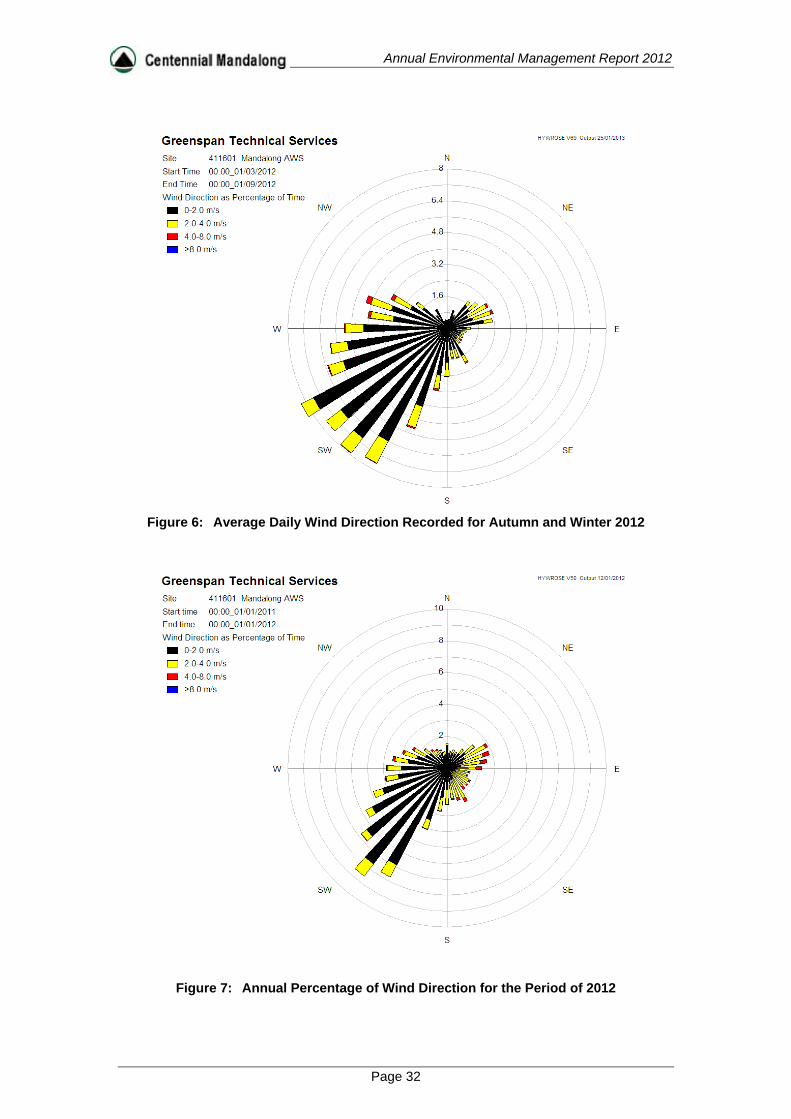
Annual Environmental Management Report 2012
Page 32
Figure 6: Average Daily Wind Direction Recorded for Autumn and Winter 2012
Figure 7: Annual Percentage of Wind Direction for the Period of 2012

Annual Environmental Management Report 2012
Page 33
5.4.2 Data Interpretation
Table 16 indicates the highest daily maximum wind speed (3.57 m/s) occurred in September 2012. The highest average daily wind speed (1.8 m/s) was also recorded during September 2012. Figure 4 indicates that the wind is predominantly from the north east and south west direction for the summer period in 2012. Figure 5 shows that the wind is predominantly from the north east and south west during spring in 2012. Figure 6 indicates that wind from the south west is the most common during Autumn to Winter in 2012. Figure 7 indicates that dominate wind direction for the 2012 period was from the south west.
5.4.3 Rainfall Monitoring Results
The total monthly rainfall data is shown below in Table 17. Monthly rain data recorded at Mandalong Mine’s weather station is tabulated and shown graphically in Appendix 7.
Table 17: Rainfall (mm) and Number of Wet Days Recorded at Mandalong Mine for the
Period January 2012 to December 2012.
Period Month Mandalong Mine
Total Rainfall
2012 January 123.4
February 166.0
March 112.0
April 123.2
May 13.0
June 171.1
July 45.8
August 20.6
September 27.2
October 7.6
November 85.4
December 70.2
Total 965.5
5.4.4 Data Interpretation
A total of 965.51 mm of rainfall was recorded at the Mandalong Mine site during the reporting period. The total annual rainfall for 2012 was less than the total rainfall (1411mm) recorded in 2011. The wettest period was in June 2012 recording 171.1mm.

Annual Environmental Management Report 2012
Page 34
5.4.5 Evaporation and Temperature Monitoring Results
The average daily evaporation rates (mm/day) and maximum and average temperatures are recorded at the Mandalong Mine Meteorological station. Results for the reporting period are shown in Table 18.
Table 18: Average Daily Evaporation (mm) and Temperature Data for the Period January 2012 to December 2012
Period Average Daily Evaporation
(mm)
Minimum Temperature
(deg C)
Maximum Temperature (deg
C)
2012 January 3.51 8.6 37.7
February 2.77 11.7 32.5
March 2.31 9.0 32.6
April 2.054 5.6 29.9
May 0.35 0.3 27.3
June 1.04 -1.1 21.4
July 1.38 0.6 21.1
August 2.82 -2.9 29.7
September 3.22 0.5 31.9
October 3.55 2.1 36.4
November 3.25 5.8 36.2
December 3.45 7.2 36.4
Annual Average
2.5 3.9 31.1
5.4.6 Data Interpretation
The average daily evaporation rates are highest in summer and spring and tend to decrease during autumn and winter. This is consistent with maximum air temperatures. The highest temperature was recorded in January 2012 at 37.7°C. The highest average monthly evaporation of 0.108 m occurred in January 2012.

Annual Environmental Management Report 2012
Page 35
5.5 NOISE MONITORING
Mandalong Mine Annual noise monitoring was conducted to assess operational noise levels compared to the noise limits in the Mine’s consent (condition 44) in accordance with the Noise Monitoring Program (NMP) approved by NSW DoPI (condition 45). The NMP requires the Mine to survey noise from the operational annually. A copy of the report including all monitoring results is provided in the report titled “Mandalong Mine Noise Compliance Assessment” by SLR Consulting (dated 14 November 2012) in Appendix 8. Daytime and night-time attended noise surveys at locations M1, M2 and M3 were conducted during Mandalong shift changes when maximum surface activity occurs and therefore providing a worst case operational scenario. During the M4 attended noise surveys conducted on 18 October 2012, the coal handling plant (CHP) and drift conveyor (loaded with coal) were operating at the Cooranbong Colliery, as well as loading from the stockpiles and road haulage. This also provides a worst case operational scenario for the Cooranbong Colliery Site. Operator attended noise measurements were conducted during the day, evening and night-time periods on 18 October 2012 at monitoring location M1, M2, M3 and M4. Unattended and attended noise monitoring was conducted to assess the noise levels from operations from the Mandalong Mine surface facilities and the Cooranbong Service Site (Cooranbong CHP). Environmental noise loggers were deployed on 18 October 2012 at locations M1, M2, M3 and M4. All unattended monitoring equipment was programmed to continuously record statistical noise level indices in 15 minute intervals including the LAmax, LA1, LA10, LA90 and LAeq.
M1 – Operator Attended Monitoring Location Continuous road traffic noise from the F3 dominated the ambient noise levels during all three attended noise surveys making it difficult to distinguish any Mandalong Mine noise sources. LA90 noise levels were generally above 53 dBA throughout the day time, evening and night-time attended surveys. However, during the evening time period, a single event horn noise was audible from the mine. The estimated mine noise contributions during the evening was an LAeq (15minute) of <30dBA, complying with the consent criteria of 35 dBA LAeq (15minute). The day time and night-time attended noise survey observed several lulls in traffic noise providing LA90 noise levels in the order of 50 dBA. During these periods Mandalong Mine remained inaudible suggesting that any contribution would be at least 10 dBA below the overall LA90 noise level (<40dBA) and likely to be below the consent level (35 dBA LAeq(15 minute) day and night-time) at this location. M2 – Operator Attended Monitoring Location
Continuous road traffic noise from the F3 dominated the ambient noise levels during the daytime attended noise surveys making it difficult to distinguish any Mandalong Mine noise sources. LA90 noise levels were generally above 50 dBA throughout the day time, evening and night-time attended surveys. The daytime attended noise survey observed a single event impact noise from the mine. The estimated mine noise contributions during the day was an LAeq(15minute) of <30dBA. This contribution complies with the consent limit of 37 dBA LAeq(15minute).The evening and night-time attended noise survey observed several lulls in traffic noise providing LA90noise levels in the order of 48 dBA. During these periods Mandalong mine remained inaudible suggesting that any contribution would be at least 10 dBA below the overall LA90 noise level (<38 dBA) and likely to be below the consent level (37 dBA LAeq(15minute) evening and night-time) at this location. M3 – Operator Attended Monitoring Location
Continuous road traffic noise from the F3 dominated the ambient noise levels during all three (3) attended noise surveys making it difficult to distinguish any Mandalong Mine noise
Annual Environmental Management Report 2012
Page 36
sources. LA90 noise levels were generally above 52 dBA throughout the day time, evening and night-time attended surveys. The night-time attended noise survey observed several lulls in traffic noise providing LA90 noise levels in the order of 46 dBA. During these periods Mandalong mine remained inaudible suggesting that any contribution would be at least 10 dBA below the overall LA90 noise level (36 dBA) and likely to be below the consent level (43 dBA LAeq(15minute) day, evening and night-time) at this location. M4 – Operator Attended Monitoring Location The mine contribution during the day time, evening and night-time attended surveys was estimated to be LAeq(15minute) 36 dBA, LAeq(15minute) 37 dBA and LAeq(15minute) 40 dBA respectively. Given the constant nature of the noise sources at the Cooranbong site, this contribution complies with the consent limit of 38 dBA LAeq(15minute) during the day and evening periods. However, a 2 dBA exceeded noise level was measured during the night-time period. SLR noted that the consent criteria are based on the assumption that the coal handling plant and rotary crushing facilities are upgraded with additional cladding. Centennial Mandalong are currently in the process of upgrading these facilities and once this has been completed, SLR predicts that the mine noise source contributions will comply with the consent criteria. Unattended Continuous Noise Monitoring A summary of the results of the unattended continuous noise monitoring is given in Table 7 of Appendix 8 (SLR Report). A graphical daily basis of the unattended ambient noise logger data at M1 to M4 is also included in Appendix 8 as Appendices C1 to C4. The ambient noise level data quantifies the overall noise level at a given location independent of its source or character. The measured ambient noise levels were divided into three (3) periods representing day, evening and night as designated in the consent conditions. Precautions were taken to minimise influences from extraneous noise sources (eg optimum placement of the loggers away from creeks, trees, houses, etc), however not all these sources or their effects can be eliminated. This is particularly the case during the warmer times of year when noise from insects, frogs, birds and other animals can become quite prevalent. Weather data for the survey period was obtained from the nearest Bureau of Meteorology weather station located at Cooranbong, approximately 3 km north of the monitoring locations. Unattended noise data corresponding with periods of rainfall and/or wind speeds in excess of 5 m/s (approximately 18km/hr) were discarded in accordance with Industrial Noise Policy (INP) data exclusion methodology. Summary of Results and Findings SLR Consulting were engaged by Centennial Mandalong to conduct a noise compliance assessment for the Mandalong Mine and Cooranbong Services Site in accordance with the Mandalong Mine Noise Monitoring Program August 2009. Operator attended noise measurements were conducted at the four (4) focus locations surrounding the mine site during the day, evening and night-time period on Thursday 18 October 2012. Measurements were conducted during worst case operational scenarios for both Mandalong and Cooranbong sites in order to capture associated worst case noise levels. Mine operation contributions were found to be within the relevant consent conditions at monitoring locations M1 to M4 with the exception of a 2dBA exceedance during the night-time at location M4. However, it is noted that the consent criteria for location M4 are based on the assumption that the CHP and rotary crushing facilities are upgraded with additional cladding. Centennial Mandalong are in the process of upgrading these facilities and once this has been completed, the mine noise source contributions are predicted to comply with the consent criteria

Annual Environmental Management Report 2012
Page 37
5.6 BLAST MONITORING
Mandalong Blast Monitoring was conducted by SLR (2012) between 28 August 2012 and 8 December 2012 and the results are provided in Appendix 8. Monitoring of ground vibration and over pressure levels was conducted during underground shot firing used to remove a stone and dyke material in longwall panel 14 and 15. A ground vibration monitor was installed on the Centennial property located off Saul Road, situated above the underground dyke. Similarly overpressure and ground vibration monitoring was also installed at the Mandalong Mine, in front of the Mine portal to monitor overpressure and vibration during shot firing. The EPA recommends that blasting overpressure and ground vibration be assessed in accordance with the Australian and New Zealand Environment Council’s (ANZECC) “Technical basis for guidelines to minimise annoyance due to blasting overpressure and ground vibration” (1990). The ANZECC guideline provides the following recommended criteria in relation to blasting overpressure and ground vibration: “Airblast
The recommended maximum level for airblast is 115 dB (Lin Peak)
The level of 115 dB may be exceeded on up to 5% of the total number of blasts over a period of 12 months. However, the level should not exceed 120 dB (Lin Peak) at and time.
Ground Vibration
The recommended maximum level for ground vibration is 5 mm/sec (peak particle velocity (ppv).
The ppv level of 5 mm/sec may be exceeded on up to 5% of the total number of blasts over a period of 12 months. The level should not exceed 10 mm/sec at any time.”
Experience has shown that for almost all sites a ppv of less than 1 mm/sec is generally achieved. It is recognised that it is not practicable to achieve a ppv of this level at all sites and hence a recommended maximum level of 5 mm/sec has been selected. However, it is recommended that a level of 2 mm/sec (ppv) be considered as the long term regulatory goal for the control of ground vibration. Monitored blasting overpressure and ground vibration levels from blasting conducted at Mandalong Mine for the period from 29 August 2012 to 8 December 2012 were found to be: Below the 5 mm/s ground vibration guideline at the nearest potentially affect receiver location. Below the 115 dB (Lin peak) airblast guideline at the nearest potentially affect receiver location.
Delta and Cooranbong Entry Sites There was no blasting carried out at the Delta and Cooranbong Entry sites during 2012.
5.7 GREENHOUSE GAS MONITORING
Consent conditions 60A (i) & (iv) requires Mandalong Mine to monitor greenhouse gas (GHG) emissions and report these in the AEMR. In accordance with Centennial Coal’s standard for

Annual Environmental Management Report 2012
Page 38
GHG reporting the 2012 financial year (FY 1st July 2011 to 30th June 2012), emissions in CO2 equivalent tonnes (Co2-eT) as defined in the National Greenhouse and Energy Reporting Act 2007 are provided in Table 19. Total GHG emission of the 2012 FY period of 1,157,732 Co2-eT is lower than the 2011 FY emissions of 1,324,074 Co2-eT. The majority of GHG emissions in 2012 were caused by fugitive methane contributing to 90 % of all GHG emissions. Methane is liberated from the Mine’s main ventilation fan and gas drainage plant when the coal seam is drained of methane via an underground drainage system to maintain a safe ventilated atmosphere and workings conditions. Mandalong Mine as discussed below is currently working towards GHG reduction measures to abate fugitive methane emissions.
Table 19: Total GHG Emissions from Mandalong Mine in 2012 Financial Year
Emissions Summary (Co2-eT) July 2011 to June 2012 Total
Electricity 53,860
Diesel 3,784
Fugitives - CH4 1,100,089
Fugitives - CO2 0
TOTAL 1,157,732
Greenhouse Gas Abatement Investigations Measures As reported previously in AEMR’s, Centennial Coal is investing in and researching into technologies to reduce fugitive methane GHG emissions from the Mandalong Mine. Both sources of high concentration drainage gas and low concentration ventilation air methane (VAM) are currently vented to atmosphere. A three stage process is planned to address this Greenhouse Abatement. Stage 1 Gas Flares - A consent modification approval was obtained in 2005 to construct multiple enclosed flares planned to be used to reduce fugitive methane GHG emissions from the Mine’s surface gas drainage plant. Civil works for construction of the gas flares commenced in October 2012 with commissioning of the flares expected to commence in early 2013. The construction of the enclosed gas flare plant adjacent to the existing gas plant will assist with abating drainage gas emissions of up to 1,500 litre/sec flow rate. Stage 2 Ventilation Air Methane Regenerative After Burner (VAM RAB) – Approval for a modification to DA97/800 was sought in 2011, to allow for the installation and ongoing operation of a single VAM RAB unit as a demonstration project to examine the performance capability. Approval was granted by the Planning Assessment Commission (PAC) on behalf of the Minister for Planning and Infrastructure on 11 November 2011. Civil construction works on the surface pad for the VAM RAB unit commenced in December 2011 and by the end of 2012 the construction of the VAM RAB facility was approximately 80% completed. The commissioning of the VAM RAB facility is expected to be completed in early 2013. The VAM RAB technology initially proposed for Mandalong includes installation and operation of a single VAM RAB unit as part of a demonstration project to demonstrate capture and abatement of approximately 10 cubic metres per second (m3/s), or one-thirtieth, of the mine’s total VAM. The VAM RAB system overcomes the problem of low concentration methane by directing the ventilation air into a large oxidation vessel, and oxidising the methane to carbon dioxide. This technology is based on well tested coke-oven principles, utilised in the steel industry.

Annual Environmental Management Report 2012
Page 39
This project, undertaken on behalf of the NSW government and the underground coal industry, is co-funded by the Department of Trade and Investment, Regional Infrastructure and Services (DTIRIS) via the NSW Clean Coal Fund (NSW CCF) Stage 3 Gas Engines In July 2009 Mandalong Mine received approval from NSW DoPI to construct and operate multiple methane gas engines to generate electricity. If the generation facility is implemented, power will be supplied to the site and excess power sold to the grid. The flare units will remain available as back-up or for peak gas flows.
5.8 ADDITIONAL MONITORING
5.8.1 Mandalong Stream Gauges
Two stream flow monitors were installed in mid-January 2002 in Stockton and Moran’s Creeks. The monitors are installed in the creek culverts on Deaves and Mandalong Roads respectively.
Repairs were undertaken to the Stockton Creek flow meter and data collection re-commenced in September 2012.
No data was retrievable from the Moran’s Creek logger due to damage in 2011, and this logger will be decommissioned in 2013.
5.8.2 Mandalong Haulage Road
Flora As required by the Mandalong Mine development consent, the haul road alignment proposed in the Mandalong Mine 1998 EIS and the surrounding vegetation was reassessed to identify any potential impacts to threatened flora species. The survey identified the Acacia bynoeana, Grevillea parviflora subsp parviflora and Tetratheca juncea all within the original haul road alignment. As a result of the threatened flora surveys, the haul road alignment was relocated in order to avoid the four small populations of Acacia bynoeana identified, however it was not practical to connect a haul road from the Cooranbong Colliery to the Newstan-Eraring haul road without it resulting in the loss of some Grevillea parviflora subsp parviflora and Tetratheca juncea plants. The potential impacts to the Tetratheca juncea and Grevillea parviflora subsp parviflora as a result of the haul road construction represented only 1.0% and 1.8% of the estimated local population of these two species respectively and was determined not to be a significant impact to the ongoing viability of these two populations. In the circumstance that species of threatened flora could not be avoided, the conditions of consent allowed for the translocation of the plants from the disturbance area. Consequently, all Tetratheca juncea and Grevillea parviflora subsp parviflora identified within the haul road disturbance area were translocated to four separate recipient sites adjacent to the haul road. The monitoring of the translocation research programme was conducted in accordance with the Haul Road Flora and Fauna Management Plan in November 2012. The results of the programme are discussed in Section 9.4. Fauna The haul road design has incorporated six fauna underpasses/creek crossings (three fauna dedicated underpasses) and three fauna overpasses to minimise the impacts of the haul road on fauna movement within the area. Monitoring of these structures commenced in October 2010 by Ecobiological who conducted an ‘Underpass and Overpass monitoring survey’. The second and final survey event was completed by Ecobiological (2011) between March and April 2011 completing the Underpass and Overpass monitoring project.

Annual Environmental Management Report 2012
Page 40
5.8.3 Wetland Monitoring
Condition 74 of development consent for the Mine requires monitoring and management of wetlands in the mining area. The wetlands management and monitoring plan (WMP) approved by LMCC was prepared by Hunter Eco (2008(a)), identifying 8 wetlands for monitoring (Figure 8). Wetlands 1, 2, and 3 are located outside of the subsidence zone and are control sites while the remaining 5 wetlands are within the proposed mining area. In April 2009 a baseline report was prepared (Hunter Eco 2009(b)) which described the status of the wetlands prior to any subsidence having occurred. In 2012 two monitoring rounds occurred in May (Hunter Eco 2012 (g)) and November (Hunter Eco 2012 (h)). The following is a summary monitoring results from the current report “Mandalong Wetlands Monitoring Report” by Hunter Eco (November 2012 (h)), provided in Appendix 12.
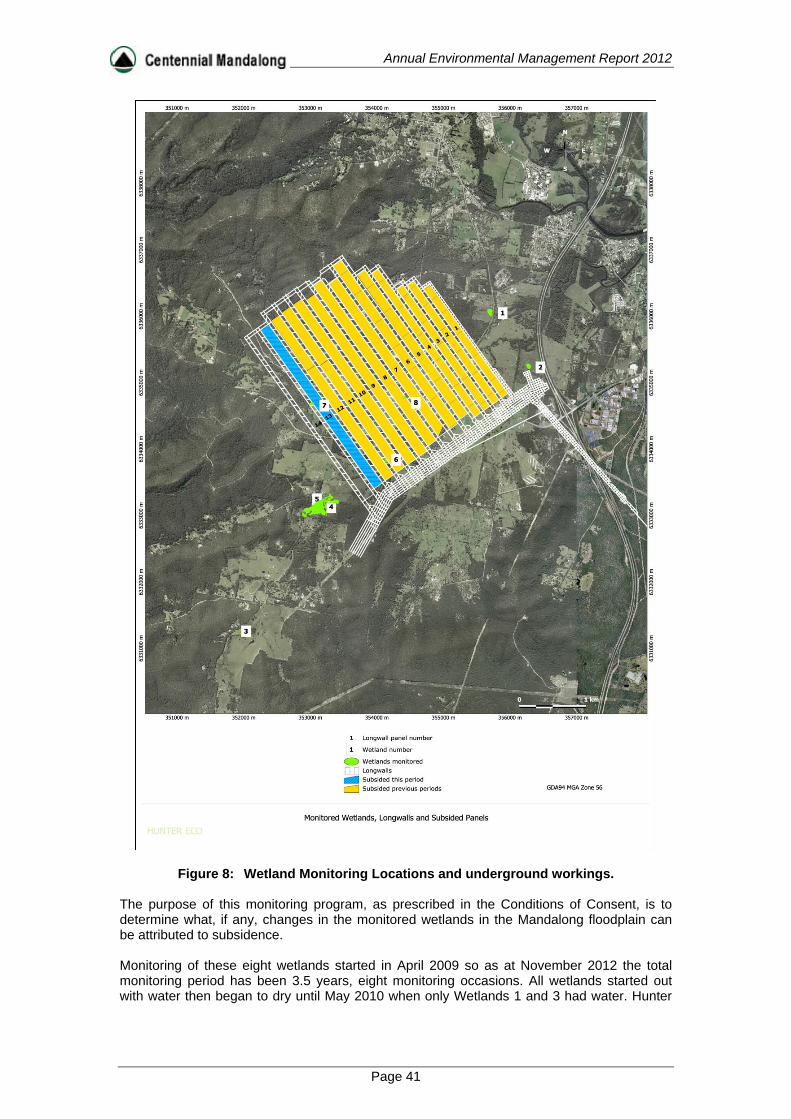
Annual Environmental Management Report 2012
Page 41
Figure 8: Wetland Monitoring Locations and underground workings. The purpose of this monitoring program, as prescribed in the Conditions of Consent, is to determine what, if any, changes in the monitored wetlands in the Mandalong floodplain can be attributed to subsidence. Monitoring of these eight wetlands started in April 2009 so as at November 2012 the total monitoring period has been 3.5 years, eight monitoring occasions. All wetlands started out with water then began to dry until May 2010 when only Wetlands 1 and 3 had water. Hunter
Annual Environmental Management Report 2012
Page 42
Eco (2012(h)) report section 5.2 shows an increasing rainfall trend up to May 2012 after which it has fallen substantially which is now reflected in the low water levels in all wetlands. Clearly these wetlands are dynamic ecosystems with species composition and diversity varying with the amount of available water and seasons. Variable land-use activities also have an influence on the state of the wetlands. Water analysis results continue to be highly variable, showing no trends over time or within or among wetlands. Wetland 6 is located over a pillar between longwall panels 11 and 12 with panel 12 recently subsided. The most noticeable change at this wetland is the change from dry to margin habitat at the beginning of the transect. This change appears to now be a feature of this transect. Wetland 8 has been subject to subsidence for over two years and there is no change in the wetland vegetation and water levels that can clearly be assigned to being an impact of subsidence. Around the middle of 2012, longwall panel 13 was subsided beside Wetland 7 which is located over a pillar between panels 13 and 14.There is no subsidence monitoring through this wetland and it is too soon to detect any impact on the structure of this wetland. When reading the Hunter Eco (2012(h)) report regarding the plant species it is important to be aware of the distinction between occurrence and abundance. The species lists, as in Section 5.1 (Appendix 13), only provide occurrence information and say nothing about how many of any species is present. Abundance information is contained in Section 5.6 (Appendix 13). The data shows that species composition across all wetlands is relatively consistent over time. Few new species were added on this monitoring occasion suggesting that the majority of likely species have been recorded. Weeds are primarily confined to the surrounding dry grassland with no invasion into the aquatic ecosystem (except Isolepis prolifera in Wetland 5). Section 5.1 (Appendix 13) shows that the proportion of weeds to native species over time has reduced significantly for Wetlands 6 and 7 but has remained unchanged for the others. Changes in the amount of the threatened Maundia triglochinoides are interesting with whole local populations disappearing by April 2011 (Wetlands 2 & 6) or substantially reducing in numbers (Wetlands 1 & 4). Since November 2011 a large area of the species has recovered at the south eastern end of Wetland 6, away from the monitoring transect. The extent of this species was much the same in May 2012. Game camera monitoring of Wetland 2 in late November 2011 confirmed deer moving through the wetland on two occasions over two weeks. Camera monitoring of Wetland 6 from late December 2011 to early January 2012 showed considerable deer activity. Camera monitoring of Wetland 7 in February 2012 revealed no deer activity. Herbivory and environmental degradation caused by feral deer is listed as a Key Threatening Process in the NSW Threatened Species Conservation Act 1955. (http://www.environment.nsw.gov.au/determinations/FeralDeerKtp.htm). The impact of deer on wetlands could arise from direct grazing of wetland plants and indirectly by destroying underwater regrowth with continual trampling. Depending on severity, this type of disturbance will add a confounding factor to comparison between wetlands. By November 2012 fencing of the large wetland that contains monitored Wetlands 4 and 5 was complete.

Annual Environmental Management Report 2012
Page 43
Table 20: Wetland Trigger Action Response Plan and Assessment
Trigger Result at November 2012 Response
A steady trend in the decline of water level observed in more than one round for monitoring at monitored wetlands that cannot be explained by rainfall data or upstream agricultural activity.
Water was present in all wetlands.
No further action needed.
A significant increase in the trend of EC levels observed over greater than one monitoring round. AGEC (2008) describe the alluvial aquifer as having substantially elevated EC levels. Any increase in EC in a wetland could be the result of the alluvial aquifer coming into contact with surface water.
EC levels were all within an acceptable range.
No further action needed.
Substantial physical erosion or damage to the wetland soil that cannot be explained by natural or man-made erosion process and is caused subsidence cracking (>200 mm in width).
No erosion or cracking was found
No further action needed
A significant increase in water nutrient levels, particularly N and P that cannot be explained by natural variations in nutrient levels or manmade influences.
Nutrient levels were acceptable.
No further action needed
A steady trend in declining biodiversity observed over a period greater than one monitoring round.
Six wetlands have shown statistically significant declining diversity indices.
See Section 5.5 of Appendix 13 for discussion concluding that this was likely to be within the bounds of natural variation. No subsidence impact was detected.
A landholder submits a complaint that a wetland has changed as a result of subsidence.
No landholder reports had been received.
No further action needed
Source “Hunter Eco 2012 (h)”
5.8.4 VAM-RAB Rehabilitation Off-set Monitoring
Centennial received approval in 2011 (DA97/800 Modification 8) for the trial installation of a ventilation air methane regenerative afterburner unit (VAM-RAB) that would remove and breakdown the exhaust methane. Installation of the VAM-RAM unit and associated gas engines necessitated clearing of some native vegetation. Two endangered ecological communities (EEC) listed in Schedule 3 of the NSW Threatened Species Conservation Act 1995 were included in the areas to be cleared. These were: Swamp Sclerophyll Forest (SSF) on Coastal Floodplains of the NSW North Coast, Sydney Basin and South East Corner bioregions; and River-Flat Eucalypt Forest (RFEF) on Coastal Floodplains of the NSW North Coast, Sydney Basin and South East Corner bioregions

Annual Environmental Management Report 2012
Page 44
Consent condition 76A included a requirement for a 1.25 hectare rehabilitation off-set area to be established on cleared land adjoining the VAM-RAB construction site. These EEC were represented by communities described in the regional vegetation mapping and classification (NPWS 2000) as: MU37 Swamp Mahogany Paperbark Forest (SSF); and MU38 Redgum – Rough-barked Apple Swamp Forest (RFEF). An ecology survey (Hunter Eco 2011) prepared for the VAM-RAB project application described the area to be rehabilitated as mostly dominated by weeds. This being the case, active regeneration was required and this was commenced in January 2012 and completed in March 2012. Further to the requirement to rehabilitate, the consent condition 76A also requires that the progress of the rehabilitation be monitored annually for five years. This monitoring was conducted by Hunter Eco in October and November of 2012 and is described in Section 5.8.4 of this document. The aim of the monitoring program conducted by Hunter Eco was to collect data that would enable a quantitative comparison between the relatively undisturbed communities and the areas being rehabilitated. This is achieved through the collection of floristic data from 400 m2 permanently established plots. The normal plot size is 20 m x 20 m but the dimension can vary depending on the configuration of the available space. Two plots were established in each of the two undisturbed communities and two in each of the two areas being rehabilitated to these communities; eight plots in all. All plots were permanently established with star pickets at each corner and floristic data were collected on 23 and 24 October 2012 and 30 November 2012 (Figure 9). Hunter Eco have found that as expected at this early stage, the habitat in the rehabilitation areas was substantially different to that in the reference areas. Fencing is clearly essential to the success of this rehabilitation to prevent herbivore destruction and it will not only protect the planted species, but also allow the ground cover to regenerate. Fencing of the area and additional planting will be completed at the site in early 2013. Hunter Eco also recommended that weed management works be undertaken within the rehabilitation off-set areas. Removal of tick bush and the spraying of blackberry was undertaken by Hunter Land Management in December 2012 and January 2013.

Annual Environmental Management Report 2012
Page 45
Figure 9: Location of Floristic Sample Plots

Annual Environmental Management Report 2012
Page 46
5.9 COMPLAINTS AND INCIDENTS
Three complaints were received by the Mine from the community during the period January 2012 to December 2012, as described in Table 21 relating to Mandalong Mine.
Table 21: Community Enquiries / Complaints Summary
Mandalong Complaint Log Number
Date Complaint
Logged
Type of Enquiry / Complaint
Comments
4/2012/Mannts1000067 10/02/2012 Resident unable to immediately contact a Centennial representative
Resident requested information from a staff member
4/2012/Mannts1000138 05/06/2012 Mandalong website Mandalong South February 2012 CCC presentation not available on website.
4/2012/Mannts1000072 09/08/2012 Land Management Regarding the electrification of a fence between the complainant’s property and a Centennial property.
On Friday 10/2/12 a landowner contacted the Mine and left a message requesting information from a staff member. The landowner was unable to contact the staff member and lodged a complaint (reference no. 4/2012/Mannts1000067). Staff members were unavailable due to work commitments. A response was provided within 3 hours to the landowner and the information provided later that day. The Mine complied with the complaints handling procedure to respond within 24 hours following an investigation. A landowner registered a complaint (reference no. 4/2012/Mannts1000138) on 5/6/12 stating that the Mandalong South CCC Presentation from the February 2012 meeting was not included with the CCC Minutes posted on the Centennial Website. Mandalong Mine provides a copy of the CCC minutes and associated presentation on the Centennial website as per the commitment made at a CCC meeting in September 2011. Centennial wrote to the landowner to advise that the document was larger than the maximum file size allowed on the website and required the document to be provided in a number of parts. Unfortunately this section of the presentation (CCC Presentation Part 3) was inadvertently omitted by staff when uploaded to the website. The entire document was posted on the website on 6/6/12. A landowner registered a complaint (reference no. 4/2012/Mannts1000072) on 9/8/12 regarding the electrification of a fence between the complainant’s property and a Centennial property, resulting in an electric shock to their child. During negotiations with the complainant prior to the construction of the fence in 2008, it was pointed out by Centennial representatives that the fence would need to be electrified to satisfy their requirement for a plain wire fence, which was agreed by both parties. The fence has since been energised for periods of time since September 2008. In response to the complaint, it was proposed by Centennial to construct an internal electric fence approximately 8m inside the Centennial property boundary and de-energising the boundary fence. Following further discussions with the complainant and Centennial representatives, in lieu of constructing a new internal electric fence, it was agreed that the boundary fence would be re-energised.

Annual Environmental Management Report 2012
Page 47
5.10 SUBSIDENCE MONITORING
In accordance with the conditions of the development consent Mandalong Mine is to undertake a subsidence monitoring program. These are reported in the AEMR as detailed in Table 22.
Table 22: Summary of Consent Conditions
5.10.1 Stream Channel
The condition of floodpaths and stream channels are discussed in the Mandalong Mine “Floodpath Condition Report 2012” in Appendix 9 and should be referred to for further details. The Mine’s development consent requires the condition of major floodpaths be inspected every six months or following a flood event in an area subject to a Subsidence Management Plan (SMP) application. This Floodpath Condition Report (2012) has been developed to compile survey and photographic records of subsidence induced changes to Stockton Creek as per assessment methodology in Section 1.2 (refer to Appendix 9). Appendix 9 assesses the changes to the condition of floodpaths along stream reaches mined beneath by longwall panel twelve and thirteen in 2012 and previously subsided longwall panels one to eleven, identifying the effects of subsidence on the floodpaths. The pre-mining condition of the floodpaths above longwall panels fourteen and fifteen is also documented in this report. On the basis of the information obtained from field surveys the pre mining characteristics of Stockton Creek and the associated tributary in the mining area, are described as having a deep bed, broad stream section with some pre mining erosion on bank areas above longwall panels 4 and 5. Pre-mining stream condition above longwall panels 7 to 10 has stream widths broadening to some 7 to 20 m wide and low bank heights of 0.5 – 2 m. Surveys in June and December 2012 recorded some further minor erosion of stream banks along these stream sections likely to be caused by a combination of stock access exposing soils and concentrated flows scouring the banks. Areas of subsidence induced remnant ponding were also identified. The subsidence levels above longwall panel’s three to six remained unchanged in 2012. The stream condition in 2012 above longwall panels one to three and six, where stock have been excluded, were in a similar condition to that recorded pre mining. No changes to the well established riparian vegetation was found on stream banks and with no further bank erosion. The bank widening and erosion process above longwall panels four and five in Stockton Creek has been occurring prior to mining and for a considerable length of time prior to mining given the large difference in stream widths compared to other stream sections. This erosion process is unlikely to have been caused by subsidence as, the areas of erosion identified prior to mining, were observed in June 2008 to be a result of the concentrated flows on the opposing bank causing further erosion. In addition to areas identified in previous reports, remnant ponding was evident on a Centennial property above longwall panel 11 in 2011 and 2012. The ponding is located on an
Consent Condition AEMR Section
19. Summary, analysis and discussion on subsidence monitoring, effects, impacts & environmental consequences.
Section 5.10.2
63 & 65. six monthly inspection of floodpaths: Summary Section 5.10.1 & Appendix 9
63. Monitoring of groundwater level and quality Section 5.2.2, Section 8.1.4 & Appendix 5
65. Consideration and monitoring of remedial works
Section 9.2
Annual Environmental Management Report 2012
Page 48
area of Redgum Rough-bark Apple Forest and pasture. To date only minor dieback of the vegetation community has occurred and an ecologist is monitoring the area to assess the effects of ponding on this vegetation community. Meetings have been held with the tenant occupying the Centennial property to discuss the works required to remediate the remnant ponding area. At present due to limited impact remediation works are being assessed and may be considered if required by the owner. Discussions with NSW Office of Water were held in 2011 in relation to the Mine’s application for controlled works permits to undertake excavations to alleviate ponding on Centennial owned properties. To date no response has been received from NSW Office of Water on this application. The maximum subsidence levels recorded in 2012 on longwall panels eleven to thirteen are within the predicted range, with the changes in stream grade above these panels similar to pre-existing grades occurring on Stockton creek. All subsidence and stream grade changes are below the anomalous results triggers in the UMEMP therefore, further stream impact assessment or remedial works are not required. Given the unchanged stream condition recorded following mining and the low subsidence levels on Stockton Creek, it is likely that recent subsidence above longwall panel’s twelve and thirteen has had minimal adverse impacts to the stream flow conveyance.
5.10.2 Subsidence Results
Subsidence performance and management has been reported in accordance with Subsidence Management Approval requirements for Longwalls 11 to 14, Conditions 17 and 18. Condition 17 requires Subsidence Management Status Reports to be prepared on a fortnightly basis as well as submitting four monthly reports to the Director, Environmental Sustainability (DRE) and relevant stakeholders, including the Department of Planning and Infrastructure. Condition 18 requires an end of panel report to be provided to DRE within six month of extraction being completed for each longwall panel. Mandalong Mine Development Consent, Condition 18 also requires an end of panel report to be provided to DOPI, Mandalong Mine CCC, DRE, EPA, NOW and any other relevant agency. During 2012 both Longwall 12 and Longwall 13 completed extraction, with the required reports outlined in Table 23. The end of panel report for Longwall 13 is currently being prepared.
Table 23 Subsidence Reports 2012 Report Report Period Date Issued Subsidence Management Status Report No. 25
1 January 2012 to 30 April 2012 May 2012
End of Panel Report Longwall 12 Completion Longwall 12 August 2012 Subsidence Management Status Report No. 26
1 May 2012 to 31 August 2012 September 2012
Subsidence Management Status Report No. 27
1 September 2012 to 31 December 2012 January 2013
Both longwall panels are the same face width of 150m (160m void) and chain pillar width as the previous Longwalls 5 to 11. Table 24 summaries the mining parameters for both Longwall 12 and 13.

Annual Environmental Management Report 2012
Page 49
Table 24: LW 12 & 13 Mining Parameters
Mining Parameters Longwall 12 Longwall 13
Length 2970m 2966m
Face Width 150m 150m
Void 160m 160m
Extraction Height 3.4m to 4.8m 3.4m to 4.8m
Chain Pillar Width (coal)
46m 46m
Cover Range 220m to 260m 220m to 240m
Commenced 3 November 2011 18 June 2012
Completed 4 May 2012 26 November 2012
Coal Extracted 3.0 Million Tonnes 3.0 Million Tonnes
5.10.2.1 Description of impact
The area affected by Longwalls 12 and 13 extends from the foothills of the Watagan Mountains to the Mandalong Valley floodplain. A total of 14 properties were affected by Longwall 12 extraction, including four dwellings, while 13 properties and two dwellings were affected by the extraction of Longwall 13. Infrastructure within the area of mining influence included Sauls Rd, Browns Rd, Mandalong Rd, Telstra communications network and the Ausgrid power supply network. The Subsidence Management Plan predicted a low impact across the area influenced by the extraction of Longwalls 12 and 13. The two private dwellings and five Centennial dwellings were predicted to and remained within safe, serviceable and repairable criteria. Only minor repairs were required on one Centennial owned dwelling to realign house guttering back to a water tank. There were two notifications issued to the Principal Subsidence Engineer (DRE) during the extraction of Longwall 12 for unexpected or greater than expected subsidence. A compression hump developed on Sauls Rd pavement near the centre of the longwall panel. Additional warning signage was erected and road repairs undertaken by Lake Macquarie City Council (LMCC) and the Mine Subsidence Board (MSB) in accordance with the Public Roads Management Plan. Initial cracking to the road pavement occurred at low levels of subsidence (70mm vertical subsidence and -1.5mm/m compressive strain). This low lying area was also subjected to considerable groundswell due to wet weather, with up to 120mm measured six months prior to the extraction of Longwall 12. The second notification was reported to the PSE in May 2012 for damage to the Telstra fibre optic cable within the vicinity of the previously damaged section of Sauls Rd, as discussed above. Telstra monitoring, as per the approved subsidence monitoring programme and Telstra Management Plan indicated a signal loss on a number of optic fibres tested. No alarms were triggered at the exchange or interruption to the service to the eight (8) customers connected to the fibre optic cable. Telstra conducted further testing and replaced the damaged section of cable over Longwall 12 during September 2012. One notification was issued during the extraction of Longwall 13 for damage to a small section of Browns Rd pavement caused by the development of a small compression hump near the centre of the longwall panel. Damage to the pavement was detected during daily

Annual Environmental Management Report 2012
Page 50
visual inspections and repaired in accordance with the Public Roads Management Plan by LMCC and MSB during November 2012. A private dam was also damaged during the extraction of Longwall 13. A linear crack about 5mm wide was observed in the rocky base of the dam. A nearby subsidence line shows peak tensile strains have been in the order of 2mm/m. It has been assessed that the crack is the result of the opening of a joint in the surface rocks and the loss of water is the result of this crack and the lack of clay seal at the base of the dam. The MSB has grouted the crack and is currently installing a clay lining to the base of the dam. The landowner has been provided with a water tank and pump to provide an additional water supply. Subsidence on the section of Convict Road (Brisbane Waters to Wallis Plains Road) above longwall panels one and two remain unchanged in 2012 at 520 mm. No observed subsidence damage has been identified to the road and the area has been fenced and managed as per Heritage Management Plan.
5.10.2.2 Monitoring Results
Subsidence monitoring was completed for both Longwall 12 and 13 in accordance with the approved subsidence monitoring programme. Subsidence surveys were completed on 20 subsidence lines for Longwall 12 and 14 lines for Longwall 13. A number of private dwellings and dams were also monitored. Figure 9 shows the installed subsidence monitoring lines. The largest recorded subsidence over Longwall 12 was 0.63m and 0.57m over Longwall 13. Settlement of Longwall 12 has occurred as expected with the extraction of the adjacent Longwalls 13 and the settlement of the intervening chain pillar. An additional 0.1m to 0.15m of vertical subsidence was recorded.
Figure 10: Subsidence Monitoring Location Plan
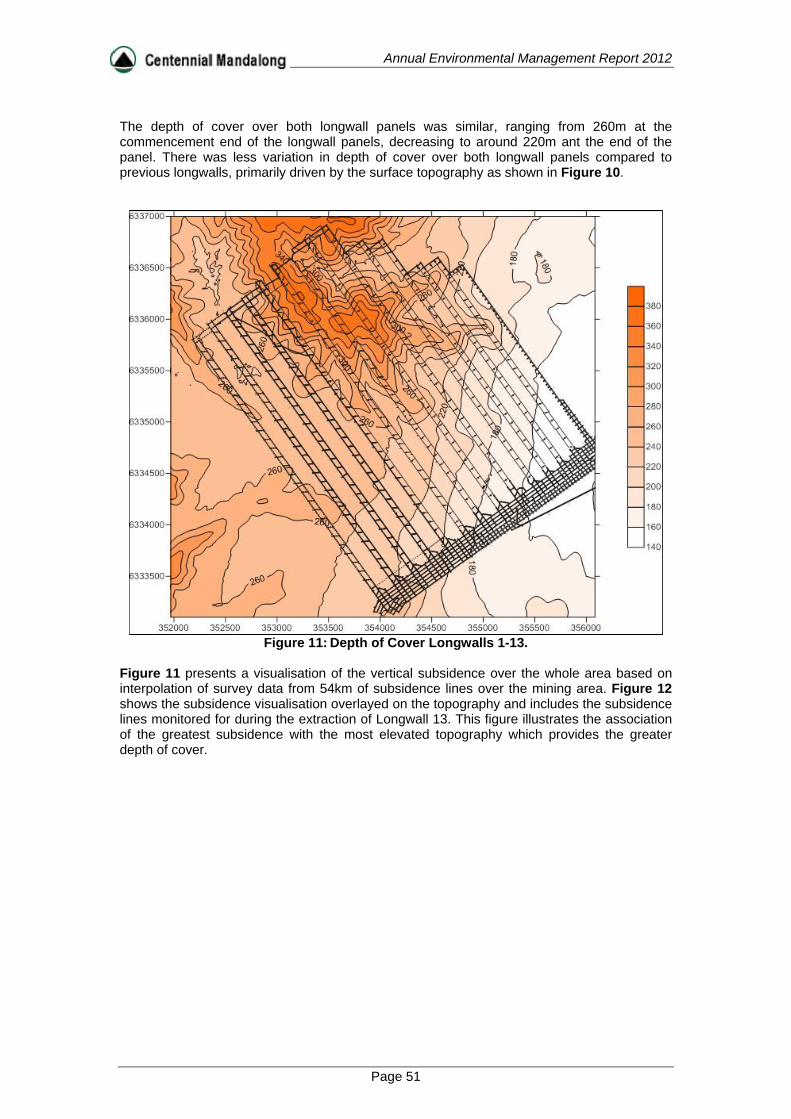
Annual Environmental Management Report 2012
Page 51
The depth of cover over both longwall panels was similar, ranging from 260m at the commencement end of the longwall panels, decreasing to around 220m ant the end of the panel. There was less variation in depth of cover over both longwall panels compared to previous longwalls, primarily driven by the surface topography as shown in Figure 10.
Figure 11: Depth of Cover Longwalls 1-13.
Figure 11 presents a visualisation of the vertical subsidence over the whole area based on interpolation of survey data from 54km of subsidence lines over the mining area. Figure 12 shows the subsidence visualisation overlayed on the topography and includes the subsidence lines monitored for during the extraction of Longwall 13. This figure illustrates the association of the greatest subsidence with the most elevated topography which provides the greater depth of cover.

Annual Environmental Management Report 2012
Page 52
Figure 12: Visualisation of Subsidence to LW13
Figure 13: Visualisation of Subsidence to LW13 Projected onto the Topography

Annual Environmental Management Report 2012
Page 53
5.10.2.3 Performance against Prediction
Subsidence over Longwalls 12 and 13 have generally been within the predicted vertical range of 0.3m to 0.55m during extraction. Consistent with previous results, Longwall 12 maximum vertical subsidence has increased by 0.1m to 0.15m with the settlement of the intervening chain pillar between Longwall 12 and 13. The subsidence prediction for Longwall 12 and Longwall 13 included consideration of the steep seam roll increasing the jointing in the overburden and hence resulting in higher levels of both pillar and sag subsidence. This model is supported by subsidence data. A smaller seam roll has also been encountered at the commencement of the longwall panels, although less steep and less jointing experienced in underground workings. The slightly higher subsidence recorded on Sauls Rd along Crossline 9 over Longwall 12 may be associated with this seam roll (refer Figure 14). There was also slightly higher than anticipated subsidence at the inbye end of Longwall 13. Figure 14 shows the difference between actual and predicted subsidence, where green shading is where actual subsidence is less than predicted and red shading is where actual subsidence is greater than predicted for Longwalls 1 to 13.
Figure 14: Difference between Predicted and Actual Subsidence
Subsidence monitoring along the major Crosslines 2, 3, 5, 8 and 9 and longwall centrelines indicate that Longwalls 1 to 10 remain stable, while less than 30mm of additional subsidence was recorded over Longwall 11. A program to remove subsidence monitoring lines over Longwalls 1 to 4 was approved by the Principal Subsidence Engineer (DRE) and completed in 2012.
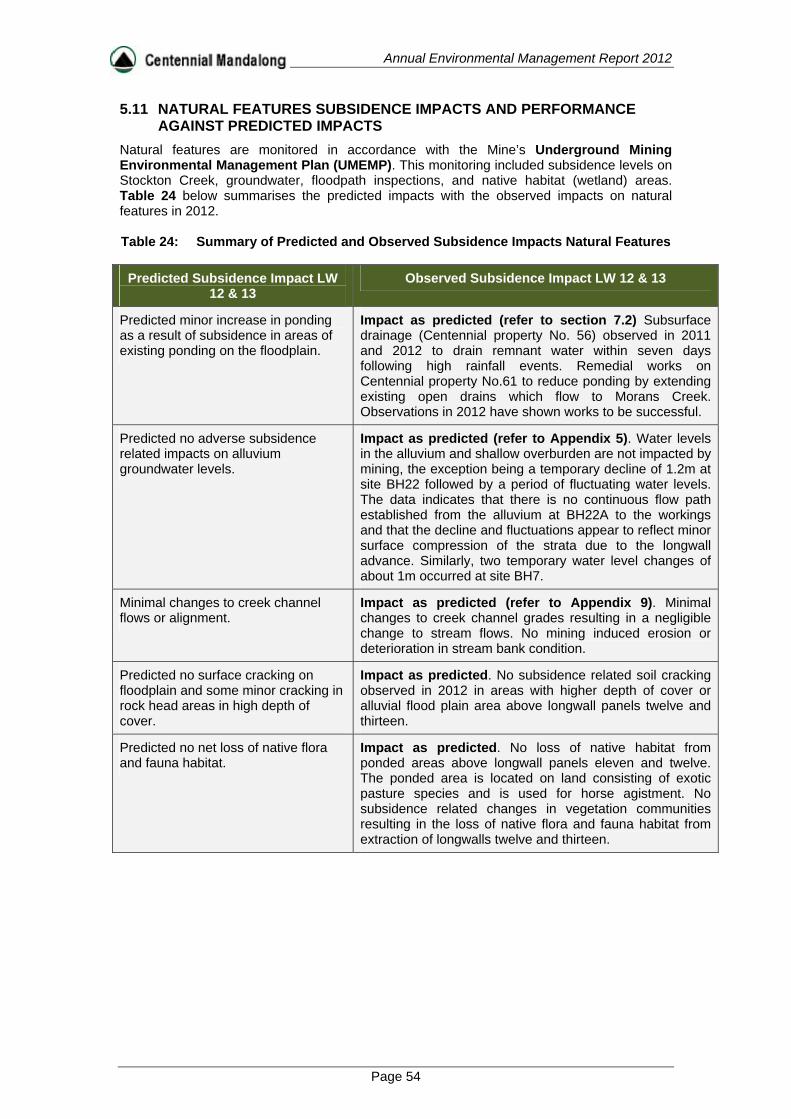
Annual Environmental Management Report 2012
Page 54
5.11 NATURAL FEATURES SUBSIDENCE IMPACTS AND PERFORMANCE AGAINST PREDICTED IMPACTS
Natural features are monitored in accordance with the Mine’s Underground Mining Environmental Management Plan (UMEMP). This monitoring included subsidence levels on Stockton Creek, groundwater, floodpath inspections, and native habitat (wetland) areas. Table 24 below summarises the predicted impacts with the observed impacts on natural features in 2012. Table 24: Summary of Predicted and Observed Subsidence Impacts Natural Features
Predicted Subsidence Impact LW 12 & 13
Observed Subsidence Impact LW 12 & 13
Predicted minor increase in ponding as a result of subsidence in areas of existing ponding on the floodplain.
Impact as predicted (refer to section 7.2) Subsurface drainage (Centennial property No. 56) observed in 2011 and 2012 to drain remnant water within seven days following high rainfall events. Remedial works on Centennial property No.61 to reduce ponding by extending existing open drains which flow to Morans Creek. Observations in 2012 have shown works to be successful.
Predicted no adverse subsidence related impacts on alluvium groundwater levels.
Impact as predicted (refer to Appendix 5). Water levels in the alluvium and shallow overburden are not impacted by mining, the exception being a temporary decline of 1.2m at site BH22 followed by a period of fluctuating water levels. The data indicates that there is no continuous flow path established from the alluvium at BH22A to the workings and that the decline and fluctuations appear to reflect minor surface compression of the strata due to the longwall advance. Similarly, two temporary water level changes of about 1m occurred at site BH7.
Minimal changes to creek channel flows or alignment.
Impact as predicted (refer to Appendix 9). Minimal changes to creek channel grades resulting in a negligible change to stream flows. No mining induced erosion or deterioration in stream bank condition.
Predicted no surface cracking on floodplain and some minor cracking in rock head areas in high depth of cover.
Impact as predicted. No subsidence related soil cracking observed in 2012 in areas with higher depth of cover or alluvial flood plain area above longwall panels twelve and thirteen.
Predicted no net loss of native flora and fauna habitat.
Impact as predicted. No loss of native habitat from ponded areas above longwall panels eleven and twelve. The ponded area is located on land consisting of exotic pasture species and is used for horse agistment. No subsidence related changes in vegetation communities resulting in the loss of native flora and fauna habitat from extraction of longwalls twelve and thirteen.

Annual Environmental Management Report 2012
Page 55
6 COMMUNITY LIAISON
6.1 COMMUNITY CONSULTATION
Mandalong Mine consults with the community through forums such as, the Mandalong Mine Community Consultative Committee and community organised events. Meetings of the Mandalong Mine Community Consultative Committee (CCC) were held in February, June and October 2012. Representatives of the MCA, a Dora Creek community representative, appointed community representatives; relevant government organisations and company representatives attended the meetings. A detailed presentation was provided to attendees at each CCC meeting on the Mine’s production, geological update, subsidence results, environmental monitoring, SMP update and sponsorship. Additional agenda items discussed in 2012 included the Mandalong South Extension Project, the Mine’s exploration drilling, approvals status, VAM RAB project, and Centennial’s land management. Mandalong Mine and Centennial personnel attended the local Morisset Community Festival in 2012 to provide information on Centennial’s operations. The Mandalong Southern Extension Project consulted with the community in 2012 with two newsletters distributed to all landholders within the EL6317. Project presentations have continued to occur at the Mandalong Mine Community Consultative Committee meetings. In May 2012, information sessions were held to discuss the outcomes of the mine planning process and present the mine plan to the community that the Project Team were going to progress detailed studies on.
6.2 SMP CONSULTATION
Extensive community consultation with landowners in the Mandalong mining area is undertaken for the purpose of monitoring and assessing subsidence effects on private properties. The existing community consultation process that is established under the Mandalong Mine Development Consent provides a good foundation to address the requirements under the SMP process. In general, the Mandalong Mine community consultation has included:-
Community consultation in line with the Landowner Communication and Consultation Plan (LCCP).
A review of the LCCP was conducted and a copy provided to MMCCC and Mandalong Community Association for comment.
Individual landowner consultation associated with the PSMP’s and general communication with stakeholders.
Three meetings of the Mandalong Mine Community Consultative Committee (MMCCC) chaired by Milton Morris delivered updates on the status of SMP approvals, subsidence monitoring and management.
Ongoing consultation with relevant stakeholders on the development and implementation of infrastructure Management Plans including Public Roads and Telstra.
One month mining notifications are provided to landowners prior to mining and follow-up meetings are undertaken if required.
Subsidence Management Status reports are completed on a four monthly basis and an End of Panel Report was provided for LW 11 and LW12 in 2012.
6.3 COMMUNITY SPONSORSHIP
Mandalong Mine continues to support the local community through various sponsorship avenues such as:
Sponsorship of the LMCC School Environment Awards.

Annual Environmental Management Report 2012
Page 56
Morisset Agricultural Show (January 2012)
Sponsorship of the Morisset Community Festival (April 2012)
Sponsorship of the Morisset Country Club “Morisset Pro Am Event 2012”.
Sponsorship of Morisset United Soccer Club Team Shirts.
Bahtabah LALC NAIDOC family fun day (July 2012)
Wyee Public School
Sponsorship of the Morisset St. John Vianney Primary School “swale” (drain)
landscaping project.
Funding provided for the Morisset Masonic Lodge hall lighting and kitchen
upgrade.
Sponsorship of Southlakes Business Chamber Christmas Spectacular.
Sponsorship of the Southlakes Carers Community Christmas Lunch.

Annual Environmental Management Report 2012
Page 57
7 AGRICULTURAL LAND SUITABILITY This section details the assessment of changes to agricultural land suitability resulting from the mining operations, including cumulative changes, at the Mandalong Site as required by condition 105(iv) of the Mandalong Consent.
7.1 AGRICULTURAL SUITABILITY CLASSIFICATION
The agricultural suitability and land capability of the Mandalong area was classified in the Environmental Impact Statement titled “Cooranbong Colliery Life Extension Project” (Umwelt 1997). As stated in the EIS (1997) the land areas range from fairly level country in which the majority of the areas have been cleared, to steep heavily timbered country which is not capable of sustaining economically viable agricultural operations. Agricultural land suitability classification is mapped using the definitions in the Department of Urban Affairs and Planning “Rural Land Evaluation Manual”, which classifies land into five different classes, based on the potential productivity of the land in the relevant social and economic context. The agricultural suitability system classifies land in terms of suitability for general agricultural use, including both cropping and pastoral purposes. The Agricultural Suitability of the land in the Mandalong area was assessed in the EIS (Umwelt 1997) to range from class 3 to 5. The majority of the level land at Mandalong has an Agricultural Suitability of 3, suited to grazing and limited cultivation in rotation pasture. The timbered area on level ground and timbered areas on sloping foothills were classified in the EIS with an Agricultural Suitability of 4 and 5 respectively. Agricultural Suitability with a classification of 4 is not suitable for cultivation but is suitable for grazing. These areas tend to be prone to water logging and production of these areas is constrained by the land size. Timbered land with an Agricultural Suitability of 5 in the Mandalong area is not suitable for agricultural production due to major constraints by native vegetation regulation and the costs associated with improving this land to a productive level. To update information in the EIS (Umwelt 1997) nineteen agricultural assessments have been completed on properties during the development of Private Property Subsidence Management Plans (PSMP’s). In 2009 an additional five agricultural surveys were undertaken on private properties located above longwall panels eleven to fourteen for PSMP’s. No further agricultural assessments were required in 2012. The agricultural assessments completed in 2009 concurred with the agricultural suitability classes described in the EIS. Monitoring has confirmed that Longwalls 1 to 10 are stable, recording additional vertical movements in 2012 of less than 20 mm. Tilts and strains have also remained unchanged over these ten longwall panels. Agricultural assessments for the properties above these panels are unchanged from previous AEMR’s and as such are removed from Table 25. The properties situated above the current zone of subsidence in 2012 above longwall panels eleven to thirteen are highlighted in Table 25 and have an agricultural classification ranging from three to five as defined above.

Annual Environmental Management Report 2012
Page 58
Table 25: Agricultural Suitability Classification and Land Use
Property Reference (Number)
Agricultural Suitability
Class Three
Agricultural Suitability Class Four
Agricultural Suitability Class Five
Current Agricultural Land use
115 x Nil
116 x Nil
25 x Horse Agistment
41 x Horse Agistment
Centennial 43
x Horse Breeding
Centennial 57
x Cattle Agistment
Centennial 45
x x Horse
Centennial 44
x x Horse
Centennial 24
x Cattle and Horses
Centennial 27
x Cattle
Centennial 23
x Cattle and Horses
Centennial 26
x x Cattle and Horses
46 x x Horse Agistment
67 x x Nil
40 x x Beef Cattle
48 x Beef Cattle
7.2 ASSESSMENT OF AGRICULTURAL SUITABILITY
Since commencing longwall mining operations, Mandalong Mine has fully extracted longwall panels 1 to 13. No additional subsidence was recorded above longwall panels 1 and 10 (refer to Section 5.10.2) in 2012. As such the agricultural suitability following mining is as reported in previous AEMRs. In 2012, 16 properties were influenced by subsidence movements on longwall panels’ 11 to 13. Of these 16, as highlighted in Table 25, currently use land for agricultural purposes and typically have agricultural land suitability of class three or four. The predominant land use on these properties is recreational/lifestyle, horse breeding and agistment and cattle/horse grazing.
7.3 AGRICULTURAL SUITABILITY IMPACT ASSESSMENT
The agricultural assessments (Neil Nelson Agvice 2009) concluded that the predicted levels of subsidence would not adversely effect stock agistment rates or pasture production from, water loss or inundation. Vertical subsidence levels on longwall panels’ 11 to 13 are generally within predicted maximums. The distribution of subsidence above longwall panels 11 to 13,

Annual Environmental Management Report 2012
Page 59
shown in Figure 13 indicates, subsidence on the floodplain, where the majority of pasture areas are found, ranges from up to 0.60 m. There is little evidence that these relatively low levels of subsidence have impacted on pasture condition, as further discussed below.
A number of private and Centennial owned properties as described in Table 25 were noted as undertaking cattle and horse enterprises. Inspections of these properties were undertaken during surveys to assess the level of subsidence related changes. No significant changes to stock levels occurred as a result of subsidence following the extraction of longwall panels’ 11, 12 and 13 in 2012. The remanent ponding on Centennial’s properties 56, 59 & 61 above longwall panels 5 and 6 are now free draining following works to re-instate and extend existing surface drainage. Use by the tenants for cattle agistment and other activates are now occurring as they did prior to mining. Remnant ponding was observed on limited area above Longwall 7 situated on an existing low lying area of Centennial’s property 56 (south west of Stockton Creek). The area consists of exotic pasture species primarily used for horse grazing. No response has been received from the NSW Office of Water in relation to the controlled works permit submitted in 2010 with a follow up meeting on the application held in 2011. As such no drainage works can proceed within 40 m of Stockton Creek without the approval from the NSW Office of Water. With the exception of some localised inundation on the above mentioned Centennial properties, the low subsidence levels and residual tilts and strains have contributed to maintaining pasture for grazing and stock condition following mining. The observed continuation of existing land use at similar stock rates following mining for small scale agricultural enterprises is attributed to limited surface disturbance. The changes in agricultural suitability are therefore, considered to be negligible to minimal over the mined areas.
Annual Environmental Management Report 2012
Page 60
8 WATER BUDGET This section summaries the water balance analysis prepared by GHD in the report tilted “2012 Water Balance” dated February 2013. In accordance with condition 105 (vi) of the consent the quantity of water used from water storages and details of water discharges from the Mine are discussed below. The Mandalong, Cooranbong and Delta site water management plans can be viewed on plan references MG10131, MG10069 and MG10722B.
8.1 WATER MANAGEMENT
8.1.1 Water Supply and Use
Mandalong is connected to town water and sewer. Potable water for underground use is currently supplied by Hunter Water Corporation (HWC) via a pipeline to Cooranbong and underground to Mandalong Mine. The total potable water used in 2012 was 337 ML. A total of 209 ML was supplied via the Cooranbong Services Site to underground equipment with 5 ML of the total used on the surface within the CHP and bathhouse. Potable water is also supplied by Hunter Water Corporation (HWC) to Mandalong Mine. 128 ML of potable water was supplied to the Mandalong Mine in 2012, with 82 ML used underground by mining operations, 36 ML in the bathhouse and 10 ML used on the surface. The total potable water usage (337 ML) for 2012 is below the water usage in 2011 (392 ML) due to the slight decrease in production in 2012. Potable water was primarily supplied to the longwall and underground equipment (longwall, continuous miners and conveyors) for coolant on motor transmissions and dust suppression. Mandalong Mine Managing runoff from rainfall events is the only surface water management required at Mandalong. Clean water is diverted around the western area of the site. A dam has been constructed to capture this water. Clean water runoff from Mandalong Road, the Freeway on-ramps and the car park has been diverted around the eastern perimeter of the site. Water from all other areas of the surface is considered ‘dirty’ and is directed to sediment control systems. Surface and subsurface drainage directs dirty water to the sediment control system. This system comprises of a Gross Pollutant Trap (GTP), a Sediment Control Dam and a polishing lagoon. Water from the Sediment Control Dam is used for irrigation of surrounding grassed areas as required. An oil water separator on the GPT removes hydrocarbons from potentially contaminated runoff from the fuel/oil, workshop, washdown buildings and equipment yard. Cooranbong Services Site Clean and dirty water systems at the Cooranbong site direct surface runoff as, shown in plan MG10722B to sediment control structures. Water from the hardstand area is directed to the 5 ML dam for treatment before discharge by an overflow culvert at LDP002. A dewatering pump installed in the 5ML in 2012 allowed low water levels in the dam to be maintained. Contaminated water from the workshop, equipment storage and washdown bay areas drain to an oil water separator used to remove hydrocarbons from waste water. Dirty water contaminated with coal fines from the CHP, conveyor gantries and ROM stockpile is directed to dedicated sediment control sumps to remove course fines material. Dirty water is then directed to the large GPT shown on plan MG10722B for further settlement of fines. Treated water from the GPT is then pumped to Settlement Dam 1. Since October 2011 water is pumped from the dams to the Cooranbong underground void by a surface dewatering pump to maintain these at a low level. Settlement Dams 1 and 2 have a capacity of 7.6 ML. A sediment control dam (ROM Stockpile Dam) and GPT were constructed in 2010 to capture and treat contaminated surface water runoff from the 100 000 T ROM coal stockpile.

Annual Environmental Management Report 2012
Page 61
Sediment is captured in the ROM Stockpile Dam prior to flowing via pipeline into Settlement Dam 1 (via the Export Bin Sump). Delta Entry Site Clean and dirty water systems have been constructed at the Delta site. Site runoff also utilises the existing stormwater infrastructure at the Wyee Coal Unloader, which includes clean water diversion drainage and two large dirty water settling ponds (9ML capacity) sufficient to treat contaminated water prior to discharge. Another settling pond (dam one) was constructed down slope of the decline portal for the pre-treatment of dirty water from the Delta site. Sediment in runoff is settled out in dam one prior to discharge into the large 9 ML settlings ponds. Mandalong Haul Road Clean and dirty water are separated along the haul road. Clean water is diverted by drains away from the haul road. Dirty water from the haul road and batters, is captured and treated within 6 sediment basins constructed along the haul road. Dirty water contained within the sediment basins is required to meet specific water quality criteria prior to discharge as discussed in section 5.3.2.
8.1.2 Minewater Management
Mandalong Mine Mine water from the underground workings is pumped to the Cooranbong site for treatment and discharge. Mine water is collected and pumped from working areas through a series of underground tanks. Water from the active mining area is pumped to a temporary settling area to reduce suspended solids. All water is then directed to a goaf (Cooranbong longwall void) area in the north-west of the Cooranbong Entry Site. This void area has a significant storage capacity, and also acts as a primary settlement area for the removal of suspended solids. Dirty water from the Settlement Dams is pumped via existing infrastructure to the Cooranbong void to maintain low water levels. Water in the Cooranbong void is then pumped to the surface through a borehole pump and overland to the Borehole Dam at the Cooranbong Services Site. Water discharges via a surface pipeline directly to LDP001. Delta Site No mine water is discharged from the Delta entry site as, inseam water from the Delta underground headings and decline tunnel is pumped to the existing Mandalong mine water system.
8.1.3 Groundwater Management
8.1.3.1 Groundwater System
Mandalong Mine This section summaries the groundwater monitoring results presented in Appendix 5 as provided in the review undertaken by AGE Consulting Pty Ltd tilted “Mandalong Longwall Mine Groundwater Monitoring Review for AEMR 2012” dated February 2013. This report should be referred to for further detailed information on groundwater monitoring results. An extensive groundwater monitoring network has been developed at Mandalong Mine with monitoring undertaken on many of the bores since August 1997.

Annual Environmental Management Report 2012
Page 62
Table 26 provides a summary of the establishment timeframe and purpose of the network. The bore locations are shown on Drawing No.1 in Appendix 5. Drawing No.1 in the AGE (2013) report illustrates the groundwater monitoring boreholes location in relation to the underground mining areas.
Table 26: Summary of Monitoring Bore Network Establishment (Source AGE 2013)
Bores Established Location Purpose
BH1 – 14 June 1997 Mandalong Valley alluvial
To monitor groundwater levels and quality in the alluvium.
BH15 – 16 February 1998
Private property 1 km south-east of mine
To monitor water levels and the impact of mining on the coal seam.
BH17 – 19 Sept-Oct 2002
Over longwall panels LW4 and LW5
To monitor water levels and the impact of mining on the overburden aquifers.
BH20, 20A, 20B BH21, 21A
October 2003
Nested bores over longwall panels LW1 and LW2
To monitor the impact of mining LW1 and LW2 on the alluvial and overburden aquifers.
BH2A, 2B, 2C BH3A, BH3B
BH6A, BH6B
BH7A, BH7B, BH17A1
BH22, BH22A, BH22B
BH23, 23A, 23B
Sept – Oct 2005
Nested monitoring bores over longwall panels
To provide a broader coverage of monitoring of the impact of longwall mining on the alluvial and overburden aquifers.
BH9A, BH9B, BH10A, BH10B, BH24A, BH24B, BH24C & BH25A, BH25B, BH25C.
May 2010
Nested monitoring bores over longwall panels
To provide a broader coverage of monitoring of the impact of longwall mining on the alluvial and overburden aquifers.
BH26 & BH27 June 2011 Nested monitoring bores.
To provide a broader coverage of monitoring of the impact of longwall mining on the alluvial and overburden aquifers.
There are essentially three groundwater systems in the Mandalong Valley (mine lease area) – alluvial groundwater, bedrock groundwater and overburden/interburden.
The alluvial groundwater is the most important as a usable resource, however there are not many licensed extraction bores within the Valley. The alluvial groundwater is typically recharged from surface infiltration through the sands and upstream recharge. The bedrock groundwater is less important as a usable resource. The permeability of the Narrabeen Group rocks is generally very low, with little groundwater yield. Any water that is localised in joints or fractures is typically of poor quality.

Annual Environmental Management Report 2012
Page 63
In the coal seam itself, the bulk permeability is low with some occasional high permeability zones associated with joints, fracture zones or faults, which results in the seam being a confined aquifer relative to the surrounding strata. Delta Site Groundwater encountered at Delta underground headings is essentially the same as that found in the coal seam at Mandalong Mine and is managed by pumping this water through the existing inseam water management system at Mandalong Mine. Groundwater make at Delta is low to nil given the relatively low permeability of overlying strata and limited opening created by the decline tunnel and main headings in the coal seam.
8.1.3.2 Groundwater Effects
Cooranbong and Delta Sites Water make in the Delta underground workings and decline tunnel was monitored during construction of the Delta Decline tunnel and was finalised at the completion of construction works. Groundwater produced from the Delta Decline tunnel is considered to be low to nil and is pumped via the underground water management system where it is discharged to the Cooranbong Services Site at LDP001.
Mandalong Mine
The review of groundwater results by AGE (2013) presented in Appendix 5 identified that the data indicates that there has been no impact from mining of LW1 to LW13 on the alluvial groundwater levels. The exception being a temporary decline of 1.8 m at site BH22A in December 2009 (Section 5.4), and a second temporary decline in September 2011. Similar minor temporary effects were identified in BH7, the closest bore to BH22, when longwall mining passed the bore.
During 2012, all alluvial bores correlated closely with the Cumulative Rainfall Departure (CRD), indicating there has been no impact by mining. The shallow overburden has been impacted on various levels by mining at most monitoring sites due to bedding parting. Water levels, however, generally stabilised or recovered, especially in bores away from active mining, and there was no change in 2012.
Mining of the longwall panels has, however, resulted in depressurization of the deeper overburden. At these deeper levels, the bedrock has probably been permanently depressurized/dewatered when mining intersected a fault and/or goafing provided hydraulic connection with the mine. While some bores remained dry and water levels in some bores continued to decline, the water levels of others stabilised during 2012.
The data also indicates that the Great Northern Seam to the south of the Mandalong Mine may have been depressurized as a result of mining in the area, but that the deeper Fassifern Seam has not been impacted.
In summary, the monitoring data indicates that although mining has impacted groundwater levels in overburden rocks, there has been no long-term impact, even in faulted areas, on groundwater levels in the alluvial aquifers.
Annual Environmental Management Report 2012
Page 64
8.1.3.3 Groundwater Management
AGE Pty Ltd in the groundwater monitoring review (2013) concluded: An extensive groundwater monitoring network has been established, and a monitoring program implemented at the Mandalong Mine. This program has been established to provide timely warnings of deviations from natural or background levels, so that if necessary, remedial measures and/or management strategies can be put in place. The current monitoring network consists of 45 bores; 20 alluvial monitoring bores, 23 overburden monitoring bores and 2 coal seam monitoring bores. The bores consist of 12 nests of 2 or 3 bores monitoring strata at increasing depth at the same site, and 13 single bore sites. The bores are monitored every month with the water level, EC and pH being measured. The monitoring data has confirmed the Kendorski model and previous assessments of the potential impact of goafing associated with longwall mining on the overlying aquifers, viz: • water levels in the alluvium and shallow overburden are not impacted by mining, the exception being a temporary decline of 1.8 m in Section 5.4, at site BH22 followed by a period of fluctuating water levels. The data indicates that there is a hydraulic connection has not been established from the alluvium at BH22A to the workings and that the decline and temporary declines occur as a result of short-term depressurisation of the dilated zone. Similarly, two temporary water level changes of about 1 m occurred at site BH7; • water bearing overburden strata to depths in excess of 50 m are impacted by compression and dilation of the strata due to the passage of mining along the longwall panel, resulting in an increase or decrease in water level, but without hydraulic connection to the mine. Water levels are expected to recover within this zone over time; • water bearing overburden strata at depths of greater than 90 m below ground level are depressurized/dewatered as a result of hydraulic connection with the longwall panel; and • the coal seam aquifer that is being mined is locally depressurized/dewatered. It is therefore concluded, based on the analysis of the groundwater monitoring data, that there has been no adverse long-term impact on the alluvial aquifers or shallow overburden from longwall mining of panels LW1 to LW13. However, it is acknowledged that dewatering of the goafed zones in addition to the depressurisation of the deeper overburden has occurred as a result of mining. The approved Water Management Plan (WMP) specifies that if the alluvial groundwater data indicate anomalous groundwater behaviour, an assessment of the changes against climatic conditions and further investigation into the occurrence will be undertaken. As stated above the alluvium groundwater boreholes indicate groundwater water levels trend with CRD and there has been no permanent adverse impact recorded in alluvial groundwater monitoring boreholes as a result of mining, other than a temporary decline and recovery observed in BH22 and BH7 in 2010 and 2011. Therefore, no anomalous alluvial groundwater results have occurred requiring a groundwater investigation program and routine monitoring will continue as per the management plan.
8.1.3.4 Groundwater Licensing
A review of the groundwater licences held by Mandalong Mine under Part 5A Water Act 1912 assessed the compliance licence conditions and the results area contained within Appendix 10. Groundwater monitoring licences are held for the purpose of monitoring groundwater levels in the Mandalong Mine lease area. The Mine’s 2012 underground operations water cycle as shown in Figure 15.
Annual Environmental Management Report 2012
Page 65
Mandalong Mine also holds a production licence permitting the extraction of groundwater water from the coal measures encountered during the process of mining. The production licence permits the Mine to dewater the underground coal measures via a submersible dewatering pump located at Cooranbong. The extraction bore entitles the Mine to extract an annual entitlement of 365 ML of groundwater for the period. This mine water is subsequently discharged LDP001 and is monitored as discussed in Section 5.3.1. In 2012, 549 ML was pumped by the dewatering borehole to the surface at the Cooranbong Services Site. Potable water usage in 2012 was 337 ML (imported process water). GHD (2013) estimate the ground water make in 2012 was 712.7ML. Therefore the Mine’s estimated groundwater make extraction is 212 ML (which equals the total extraction from the dewatering borehole minus the site total potable water usage underground) in 2012 is below the licence extraction limit.
8.2 WATER BALANCE – MANDALONG SITE
The 2012 water balance diagram (GHD 2013) for Mandalong Mine is shown in Figure 15. The water balance for 2012 is presented in Table 27. The primary inputs for the water budget are potable water, groundwater, and surface run off as described below. The primary outputs from the water budget are discharged water, water loss in product coal and water to sewer. Potable water is supplied by the HWC to the Cooranbong Services Site and the Mandalong Mine via overland pipes and is consumed underground by the mine equipment. Potable quality water is used underground in mining equipment as; uncontaminated water is required for cooling systems on drive motors, in dust suppression sprays on miners and transfer points. In 2012, 337ML or 0.92 ML per day was supplied underground for use on mining equipment. It is estimated a minor amount of potable water (5 ML) was used on the surface at the Cooranbong Services Site, for surface facilities. GHD’s (2013) water balance model indicates 689.6 ML was discharged in 2012 from the Mandalong Mine, Cooranbong and Delta Services Sites. As shown in Table 27 and Figure 15 this consisted of 26.1 ML from the Mandalong Mine Sediment Control Dam. A total of 642.1 ML was discharged from the Cooranbong Services Site, with 570.5 ML from LDP001, 35.9 ML from LDP002 (5 ML dam) and 35.7 ML from the construction dam (clean water dam). 21.4 ML of surface water run off water discharge from Delta Entry Site dams. The majority of discharged water from the sites is generated from surface water run-off as, shown in Figure 15. The exception being LDP001 which also includes 549.4 ML of water from the underground and 21.1 ML attributed to surface water run off. It is estimated 27.7 ML was pumped from the Cooranbong Settlement Dams to the underground to provide sufficient water storage during rainfall events.

Annual Environmental Management Report 2012
Page 66
Table 27: 2012 Water Balance Model (source GHD 2013)
Transfer in 2012 (ML/yr)
Source
INPUTS
Direct Rainfall and Runoff 200.6 Water Balance Model
Potable Water Supply 336.9 Provided by Centennial
Inflows into Underground Workings 712.7 Hydrogeological Modelling (GHD, 2012b)
TOTAL INPUTS 1250.2
OUTPUTS
Evaporation 22.4 Water Balance Model
Dust Suppression 2.0 Provided by Centennial
Spray Irrigation 18.1 Water Balance Model
Sewage to HWC 37.8 Water Balance Model
Discharge through LDP001 (Cooranbong) 570.5 Water Balance Model
Discharge through LDP002 (Cooranbong) 35.9 Water Balance Model
Discharge from Construction Dam (Cooranbong) 35.7 Water Balance Model
Discharge from Mandalong Mine Access Site 26.1 Water Balance Model
Discharge from Delta Entry Site 21.4 Water Balance Model
TOTAL OUTPUTS 769.9
CHANGE IN STORAGE
Cooranbong Longwall Void 480.5 Water Balance Model
Surface Water Storages -0.4 Water Balance Model
TOTAL CHANGE IN STORAGE 480.1
BALANCE
Inputs – Outputs – Change in Storage 0
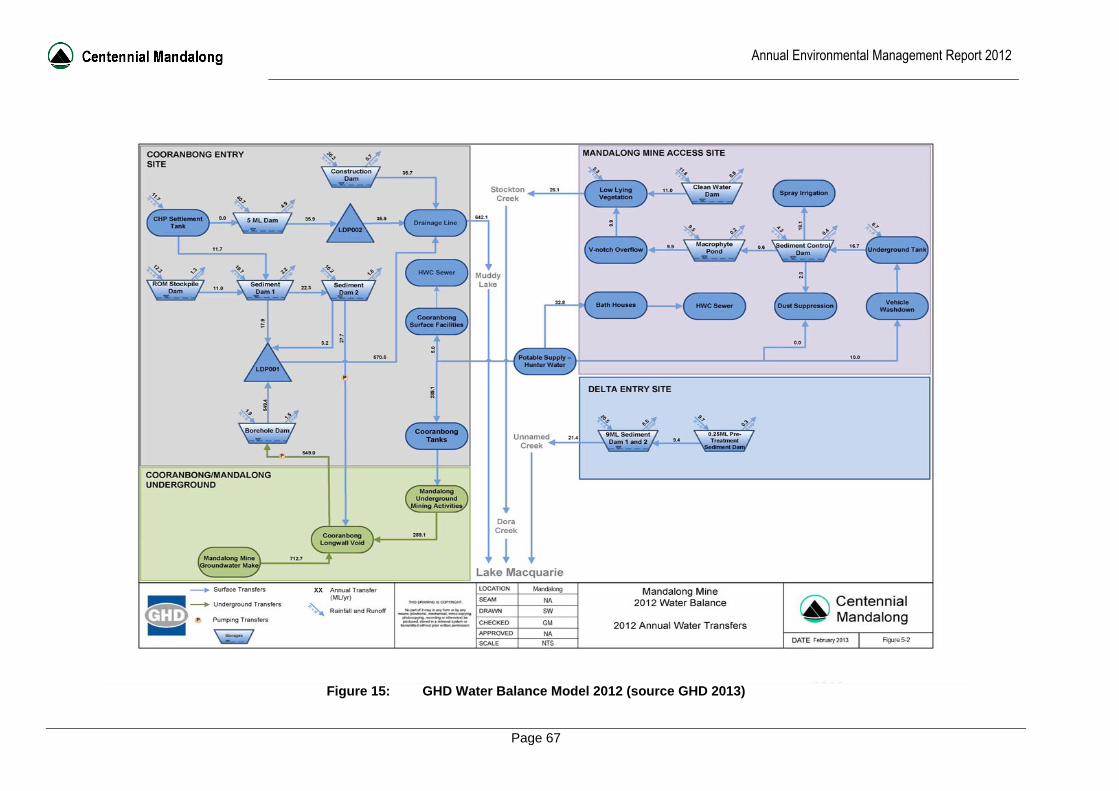
Annual Environmental Management Report 2012
Page 67
Figure 15: GHD Water Balance Model 2012 (source GHD 2013)
Annual Environmental Management Report 2012
Page 68
9 REHABILITATION
9.1 BUILDINGS
Mandalong Mine
Construction of infrastructure discussed in section 1.1 including construction of the VAM-RAB facility and the Gas Flares commenced in 2012 as shown in plan MG 10069. No buildings or infrastructure were removed or decommissioned in 2012.
Delta Entry Site
All buildings at the Delta Entry Site are associated with the coal conveying system and as such are a permanent fixture. The buildings associated with the construction of the site were decommissioned and removed prior to the site being rehabilitated in 2006. No construction or decommissioning of buildings occurred at the Delta Entry Site in 2012 and as such no rehabilitation of buildings was undertaken. Cooranbong Services Site
To ensure continuation of coal handling operations and mine support infrastructure, surface buildings and mine related infrastructure have been retained at the Cooranbong Services Site. The Cooranbong Services Site, CHP and supporting infrastructure were used in 2012 to supply coal to Eraring Power Station and to the Newstan Colliery for export. Other than the removal of infrastructure reported in previous AEMR’s, no other buildings or infrastructure at the Cooranbong Services Site were removed or decommissioned from this site in 2012.
9.2 REHABILITATION OF DISTURBED LAND
Mandalong Mine
The majority of Mandalong Mine site has been rehabilitated following the completion of construction activities in 2005. Rehabilitated sections of the Mine’s surface area are well established and have provided vegetation cover to effectively minimise the potential for erosion. Disturbance activities from the construction described in section 1.3 were largely within the Mine’s existing operating footprint. The new car park and demountable buildings water drainage have been connected into the existing surface water drains. The surface water structures at the Mine have previously been rehabilitated to prevent erosion and are stable. Centennial received approval in 2011 (DA97/800 Modification 8) for the trial installation of a ventilation air methane regenerative afterburner unit (VAM-RAB) that would remove and breakdown the exhaust methane. Installation of the VAM-RAM unit and associated gas engines necessitated clearing of some native vegetation. Two endangered ecological communities (EEC) listed in Schedule 3 of the NSW Threatened Species Conservation Act 1995 were included in the areas to be cleared. These were: Swamp Sclerophyll Forest (SSF) on Coastal Floodplains of the NSW North Coast, Sydney Basin and South East Corner bioregions; and River-Flat Eucalypt Forest (RFEF) on Coastal Floodplains of the NSW North Coast, Sydney Basin and South East Corner bioregions Consent condition 76A included a requirement for a 1.25 hectare rehabilitation off-set area to be established on cleared land adjoining the VAM-RAB construction site. These EEC were represented by communities described in the regional vegetation mapping and classification (NPWS 2000) as: MU37 Swamp Mahogany Paperbark Forest (SSF); and MU38 Redgum – Rough-barked Apple Swamp Forest (RFEF).

Annual Environmental Management Report 2012
Page 69
An ecology survey (Hunter Eco 2011) prepared for the VAM-RAB project application described the area to be rehabilitated as mostly dominated by weeds. This being the case, active regeneration was required and this was commenced in January 2012. Further to the requirement to rehabilitate, the consent condition 76A also requires that the progress of the rehabilitation be monitored annually for five years. This monitoring was conducted by Hunter Eco in October and November of 2012 and is described in Section 5.8.4 of this document. Longwall Mining Area
The surface areas above the completed longwall mining panels are inspected as per the schedules prescribed in the approved Underground Mining Environmental Management Plan (UMEMP) and Subsidence Monitoring Plan (SMP). The UMEMP requires the floodpaths to be inspected every six months or after a flood event (refer to Appendix 9) and the SMP requires surface inspections during surveying of monitoring lines. During the course of these inspections observations are made on the progress of remedial measures implemented to minimise subsidence related effects. The drainage lines constructed to alleviate ponding on a Centennial owned property above longwall panels two and three were inspected and found to be rehabilitated. The drains have been seeded with pasture species which covers up to ninety precent of the drain preventing erosion and as such no repairs were undertaken in 2012. The area disturbed during the construction of subsurface drainage, installed to alleviate remnant ponding above longwall panel six on a Centennial owned property (56) was rehabilitated in October 2009. The area was inspected in 2012 following rainfall events. This confirmed the drains take up to seven days to remove ponded water from the paddock and varies depending on the amount of rainfall and the water level in Stockton Creek. Horses are able to use paddocks and are rotated out in wet conditions similar to other ponded areas of floodplain. This drying period is consistent with other areas of the flood plain which drain or dry out over a similar period. The remanent ponding on Centennial’s properties 59 & 61 above longwall panels five and six are now free draining following works to re-instate and extend existing surface drainage. Use by the tenants for cattle and other activates are now occurring as they did prior to mining. Remnant ponding was observed on limited area above longwall panel seven situated on an existing low lying area of Centennial’s properties in 2011. The area consists of exotic pasture species primarily used for horse grazing. No response has been received from the NSW Office of Water in relation to the controlled works permit submitted in 2010 and the follow up meeting held in 2011, to discuss Centennial’s proposal to construct drains. As such no drainage works can proceed within 40 m of Stockton Creek without the approval from the NSW Office of Water.
Exploration Sites
The five surface exploration drill sites cleared in 2012 (CM 108 to 112) within the Olney State Forest were rehabilitated following the sealing of the boreholes. Existing tracks were utilised to again access to these exploration drill sites where possible and required limited vegetation clearing. An extension to an old logging track was required to gain access to borehole CM109. This track was re-contoured to pre disturbance natural surface levels and seeded. Above ground 20,000 litre drill sumps were used during the drilling process with only a small 500 litre tank dug into ground level. These sumps minimise the drilling fluids interaction with ground and greatly reduce the risk of drill sumps overflowing. The drill sumps where pumped out to remove and dispose of waste water and drill tailings then backfilled to re-instate the natural surface levels. Sites CM 108, 110 and 111 were seeded with native grass species consistent with surrounding areas. Sites CM 109 & 112 were seeded with native grass species and their access track reshaped and seeded. The sites were lightly scarified to de-compact the soils using hand tools. Forests NSW were consulted prior to commencing these works, so that the rehabilitation meet with their land use requirements. All rehabilitation works where completed by December 2012 and inspected by a Forests NSW representative. Ongoing monitoring and maintenance of rehabilitated sites will be conducted in 2013 and reported in the AEMR.
Annual Environmental Management Report 2012
Page 70
Delta
Construction of the Delta coal clearance system was largely completed in 2005 and rehabilitation of the site was completed in 2006. Construction works were separated into two areas (refer to Plan MG10131). Stage one, located west of the existing Delta diversion drain consists of the portal, conveyor and fire fighting tanks. Stage two to the east of this drain consists of a transfer tower, crusher building and conveyors and the temporary topsoil stockpile located near the Delta 9 ML dams. Rehabilitation at the Delta entry site was inspected in 2012 to assess the effectiveness of the works to stabilise disturbed areas onsite. The direct seeding rehabilitation methods used have been successful in establishing a substantial area of the site with pasture and tree groundcover as, shown in plates one and two of Appendix 11. Ground cover on the direct tree seeded areas is approximately ninety percent similar to those recorded in 2011. A high success rate of juvenile tree species has occurred with tree heights in the direct tree seeded area some 2 to 3 metres (as shown in plate two of Appendix 11). Ninety-five percent groundcover has been achieved in rehabilitated pasture seeded areas. The area is slashed to maintain access to infrastructure and as part of the asset protection zone. The rehabilitation methods used on drainage lines have been successful as these are stable and are effective in directing surface runoff to sediment control structures. Plate three in Appendix 11 shows the perimeter drainage lines established with effective erosion protection at the Delta Entry Sites. Cooranbong Services Site
A total of 3.9 hectares have been disturbed from the construction of the upgrades to the CHP and haul road as described in section 1.3 at the Cooranbong Services Site in 2009. Construction activities where completed in May 2010 with all disturbed areas rehabilitated by the contractor (Leighton) shortly after. Other than re-seed a grass area adjacent the Mine fan due to the installation of new potable water tanks, no further rehabilitation works were undertaken in 2012. Mandalong Haul Road
The haul road construction has resulted in approximately 18 ha of disturbance. Of this 3.9 hectares of disturbed land associated with the CHP upgrades (stockpile and conveyor) and haul road are located on Mandalong Mine’s Mining Lease as shown in plan MG11217. 1.25 hectares of disturbed area not occupied with haul road and CHP infrastructure was rehabilitated in 2010. The remaining areas are located on the Awaba Colliery Mining Lease. Of this, nine hectares along the haul road was rehabilitated in 2009 as described in the 2009 AEMR. Six hectares of land will not be rehabilitated as it is occupied by haul road infrastructure. As per the requirement of the Mandalong Haul Road Landscape and Rehabilitation Plan, Global Soil Systems (GSS) in November 2012 audited the rehabilitation on the haul road in the report, ‘Rehabilitation Audit of Cooranbong Haul Road’ (dated November 2012). The audit assessment required the following issues be addressed: -
An assessment of surface and slope stability.
Properties of the soil or root zone media (such as chemistry, fertility and water relations).
Plant community structural attributes (such as cover, woody species, density and height).
Plant community composition (such as presence of desirable species, weeds).
Selected indicators of ecosystem functioning analysis (such as soil microbial biomass). The 2012 audit focused on identifying sites where remedial action or maintenance is required to bring sites to an acceptable standard. The inspection strategy involved two people walking the full length of the Haul Road (one on either side) to address 100% of the disturbed area. In total 15 sites were inspected and recorded an action priority from highest to lowest (1 being highest and 5 being the lowest). The highest 1 priorities include weed control of Acacia saligna at site 8, Bamboo and Pampas Grass weed control at Hussey’s Quarry, and the removal of waste materials dumped by members of the public at the Hussey Quarry. Weed spraying was conducted at site 8 by
Annual Environmental Management Report 2012
Page 71
GSS in January 2013 and at the Hussey Quarry by Hunter Land Management (HLM) in December 2012. The audit provides a useful assessment of baseline rehabilitation completed to date on the haul road following the completion of all construction activities in 2011. In general rehabilitated sections of the haul road are well established and continued growth occurred in 2012. Maintenance and effectiveness of the haul road rehabilitation will be assessed in 2013 and reported in the next AEMR.
9.3 OTHER INFRASTRUCTURE
No other infrastructure was rehabilitated during the reporting period.
9.4 REHABILITATION TRIALS AND RESEARCH
Moran’s Creek Rehabilitation Trials During consultation with local landowners, concerns were raised regarding historical land management practices which have resulted in extensive clearing of native vegetation and severe erosion of creek banks and drainage lines across the valley. The Moran’s Creek Rehabilitation trial was initiated in 2007 to respond to local landowner concerns in particular the historical erosion on Moran’s Creek caused by flood flows and stock accessing creek areas. Local landowner’s sited evidence that excavation of the creek in the 1950’s caused the creek to widen as a result of the creek banks eroding. In November 2007 a trial commenced to rehabilitate a section of Moran’s Creek on a Centennial owned property. The objective of the trial is to assess the effectiveness of direct seeding and tube stock planting to re-establish a native vegetation community on a degraded section of Moran’s Creek. Direct seeding of the trial area commenced in January 2008 with inspections in 2011 and 2012 concluding that the direct seeding method has been successful in establishing tree cover over the majority of the area. Juvenile species including Eucalyptus Tereticornis, E. robusta and Casuarina Glauca (refer to plate four, Appendix 11) have successfully established on the trial area. The trial direct seeding area has been largely successful in re-establishing the native vegetation found along Moran’s Creek. Weed spraying was conducted in 2012 to control Tobacco, Scotch Thistle and Blackberry. The 2000 tube stock planted in November 2008 along the fenced Moran’s Creek rehabilitation corridor are now established along Moran’s Creek with trees heights of up to 1-2 m. (refer to plate five Appendix 11). The rehabilitation site is a reference site for the Catchment Management Authority (CMA) vegetation monitoring report. The monitoring has recorded the baseline vegetation conditions and will evaluate the rehabilitation measures implemented at Moran’s Creek. Translocation Research Program Field investigation for the haul road project has established that the local populations of Grevillea parviflora subsp. parviflora and Tetratheca juncea are so extensive that it would not be possible to avoid the loss of some plants of these species no matter where the haul road was located. Consequently a translocation research programme has been developed in consultation with EPA for the translocation and ongoing monitoring and reporting for the threatened flora species Tetratheca juncea and Grevillea parviflora that would have otherwise been lost as a result of the haul road construction. The main aim of this translocation project is to implement an experimental model that will add to the knowledge base regarding the translocation of these species, building on available information from any previous attempts. The overall experiment will run for 5 years with interim reports prepared at the end of each year and a final report after the 5th year. In January 2010 the first detailed monitoring report was completed by inspection of all sites containing the translocated threatened plant species within and around the haul road. The current report by Hunter Eco “Cooranbong-Awaba Haul Road Threatened Flora Translocation Report” (November 2012 (d)), has established the extensive presence of Grevillea parviflora subsp. pariflora and Tetratheca juncea that has undergone a threatened flora translocation research programme between 27 April 2009 and 6 May 2009.
Annual Environmental Management Report 2012
Page 72
One recipient site for Grevillea parviflora subsp parviflora and three sites for Tetrathea juncea were established which were translocated by methods of an excavator and individual clumping. In January 2010 there were 75 live and a number of dead plants. There were 128 plants present in November 2010, a 70% increase, with these plants being around 10 cm tall. In November 2011 there were 147 plants, just under double the number recorded in January 2010. The plants were around 20 cm tall. In November 2012 there were 136 plants with several flowering. The tallest plants were 65 cm with the average around 40 cm. Thus total plants were slightly down compared with 2010 but plants had approximately doubled in size. Site two presents 81 clumps of individually translocated Tetratheca juncea by hand. This group continues to decline as reported in 2011 and is now down to nine of the originally translocated 81 clumps, and each of the survivors only have a few stems. Previously it was reported that the clumps were being heavily grazed and this may have contributed to the steady decline. Two clumps that were recorded as missing in November 2011 had resprouted. At site 3 also containing Tetratheca juncea, an experimental attempt was undertaken using bulk translocation to rehabilitate a small area of disturbance. Twenty one excavator buckets and additional vegetation were translocated to a site approximately 180m² beside a power line easement where remnants of logs had been burned from clearing with no ground vegetation. In 2012 total clumps remains at 19 and while the clumps are healthy in appearance they are regularly grazed to about 10 cm from ground level. Similarly to site 3, site 4 was an experimental attempt at using bulk translocation of the species with 13 individual excavator buckets and additional vegetation used to translocate these to a site off the haul road in vegetated areas. Grazing was not as evident as during previous surveys, however there were fewer clumps and there were few flowers. The number of collaterally translocated species has increased by one, although again, changes have occurred in the species content at each site. A feature of the current flowering season has been the lack of rain compared with 2011 and this will have had an impact on all of the translocated plants. So far the most significant problem for the translocated Tetratheca juncea has been grazing by herbivores, most likely wallabies. Grevillea parviflora subsp parviflora appear to be now be established as a population. Nest Box Research Program Habitat hollows are an important resource utilised by a variety of forest fauna. The abundance of hollow bearing trees in the Australian context is important for the survival of many endemic species. Many threatened species are obligate users that require the presence of hollows to survive and reproduce. Nest boxes have been installed within the surrounding haul road vegetation communities as part of the offset strategy for the clearing of vegetation and hollow bearing trees required for the construction of the haul road. A research based approach to the installation and monitoring of nest boxes has been developed to more effectively offset the loss of hollow bearing limbs caused by the construction of the private haul road. The Mandalong haul road nest box research program will investigate factors that influence the use of nest boxes and the value that such nest box programs provide as an offset/management tool. Several research questions will be examined experimentally as part of the nest box research programme. These are:
The impact of micro-climate on nest box use and the effect of nest box design (experiment 1). In particular, this will look at the temperature extremes and fluctuations experienced in standard nest box design versus naturally occurring hollows, and examine the effects of varying wall thickness (insulation) on reducing unfavourable microclimatic conditions within the nest boxes.
The effect of nest box placement: does aspect matter (experiment 2). This involves examining the effect of differing aspects on nest box inhabitation. This will also be linked to microclimate within the nest boxes.
Annual Environmental Management Report 2012
Page 73
Examining utilisation rates of nest boxes in areas of varying natural hollow density (experiment 3). This will involve an examination of the density of naturally occurring habitat hollows each experimental quadrat and correlating this to the rate of nest box use.
In January 2010 Ecobiological installed 150 nest boxes distributed across 15 quadrats (10 in each) located alongside the western perimeter of the haul road. The experimental design adopted, allowed each quadrat having four of each single walled nest box type (bat and glider) and one of each double-walled nest box type (bat and gilder). The two double-walled boxes were placed at a northern aspect in all quadrats, and the remaining eight, one of each design, at each aspect. The inspection of all 150 nest boxes was undertaken on the 7th and 8th of June 2012. Nest box usage is recorded in two ways: a) actual use, animal sighted in the nest box; and b) evidence of use which includes relatively recent nests or scats. The total usage of nest boxes in the June 2012 surveys including actual and evidence of usage was 38% (57 of 150 boxes). This included 14% of boxes having an animal present at the time of survey, and a further 24% of boxes having evidence of use. Six species were observed utilising nest boxes during the 2012 winter survey including Squirrel Glider Petaurus norfolcensis, Sugar Glider Petaurus breviceps, Brown Antechinus Antechinus stuartii, Gould’s Wattled Bat Chalinobolus gouldii, Gould’s Long-eared Bat Nyctophilus gouldii, and Peron’s Tree Frog Litoria peronei. Compared to the last 24 months of data, the June 2012 results show an increase of 10.67% in total nest box usage since the summer surveys in January 2012. Compared to the winter surveys in 2011, the total usage rate has increased by 15.33%. A trend has emerged highlighting actual usage only occurring in the winter survey periods. This could indicate that target animals such as Gliders tend to inhabit artificial hollows in the colder months due to better insulation properties. One very exciting find in the winter surveys was a family of Squirrel Gliders Petaurus norfolcensis inhabiting a double thickness north facing box in Q5. A total of four individuals were removed from the box and key measurements were taken to confirm this species. This species is listed as vulnerable under the NSW Threatened Species Conservation Act 1995. This species has never been recorded using nest boxes during the last four surveys. The initial 29 month period has successfully reinforced emerging trends regarding the usage rates of nest boxes in relation to aspect and nest box type first noted in the 2011 winter survey. By the completion of the suggested five year monitoring period, sufficient data will have been collated to provide an informed opinion regarding preferential selection of nest boxes by native fauna species. Bat detection in the 2012 winter surveys has been greater than ever before with 7 boxes containing bats. The installation of infrared motion detector cameras will also allow a realistic measure of bat usage of nest boxes over the next year. The detection of a threatened species, Squirrel Glider, is a significant result for the study, highlighting that this particular species is still utilising the area after the disturbance of the haul road construction. It is also important in regards to nest box design and aspect, as this species was detected within a north facing double thickness box, again supporting the trends so far. Future nest-box use over the next 2-3 years will continue to reveal trends of nest-box take up by hollow using species.

Annual Environmental Management Report 2012
Page 74
10 ENVIRONMENTAL MANAGEMENT TARGETS AND STRATEGIES
This section details the environmental management targets and strategies for the reporting period in accordance with condition 105(viii) of the consent. Targets and strategies for the Delta Entry Site are also provided in this section as part of the overall management of the Mandalong Mine, although this is not specifically required by any condition of consent.
10.1 SUMMARY OF PREVIOUS TARGETS
Several actions were committed for completion during this reporting period. A summary of actions completed during the 2012 period is shown in Table 28.
Table 28: Summary of Targets completed during 2012
Mandalong Mine Site – Planned Action Status
Investigate system to monitor for flow of solcenic fluid from surface tank to U/G borehole
Communications have been installed, with flow meters to be installed in 2013.
Submit modification to consent conditions to increase coal haulage limits
Modification submitted in February 2012 and approved in August 2012.
Undertake spill response refresher training to surface personnel and staff at Mandalong and Cooranbong.
Spill response training completed for all staff in December 2012.
Gas flare tender to be evaluated for contract commitment to design construction and installation
Civil works for the construction of the gas flares commenced in October 2012.
Undertake trial of VAM-RAB At the end of 2012 the construction of the VAM RAB facility was 80% completed.
Delta Entry – Planned Action
None Not applicable.
Cooranbong Site – Planned Action
Investigate use of a dedicated truck wash at the truck turning circle
Installation of the truck wash will be completed in 2013.
Install automation of dust suppression system on stack-out conveyor feeding the stockpile
Completed.
Investigate use of water cannons for localised dust control during loading off the stockpile.
Installation to be completed in 2013.
Investigate automated water treatment systems on Haul Road dams
Trial undertaken in early 2012.
Undertake EPA licence investigation into best practice dust management.
Completed and submitted to EPA in September 2012.
Finalise surface water management improvements
Water management upgrades undertaken in 2012 and scheduled to continue in 2013.
Upgrade of Cooranbong sediment Upgrade completed to Cooranbong 5ML Dam.

Annual Environmental Management Report 2012
Page 75
control structures
Investigate handling and storage of coal sump waste
Completed.
Setup underground inspection at discharge point at 32CT South Intakes
Cooranbong underground void water level now continuously recorded by an ultrasonic level sensor installed in the Cooranbong borehole.
Apply to RFS to establish asset protection zone at Cooranbong
Slashing undertaken along property boundary fence lines at Cooranbong.
10.2 TARGETS FOR 2013
The environmental targets associated with the Mandalong Mine during the next twelve-month reporting period are summarised in Table 29. Some actions were derived from the risk assessment document completed for the DRE Annual Environmental Risk Assessment.
Table 29: Summary of Targets for the period January 2013 to December 2013
Mandalong Mine
Commissioning and operation of Gas Flares
Commissioning and operation of VAM-RAB
Investigate installation of PM10 monitoring equipment.
Cooranbong Services Site
Install a dedicated truck wash at the truck turning circle
Install water cannons for localised dust control during loading off the stockpile.
Finalise Settlement Dam De-watering bore project
Complete upgrade to 5ML Dam.
Install a real-time noise monitoring system
Install a TEOM air quality monitoring system
Complete noise mitigation works for 1200t export bin / truck loading system
Complete cladding upgrades to CHP and rotary breaker building for noise mitigation.
Delta Entry Site
None
10.3 MINE WATER REDUCTION TARGETS
Consent Condition 66 requires the mine to investigate opportunities to reduce mine water discharge at Mandalong and report on such in the AEMR. GHD (2013) model estimated 570.5 ML of water from the underground mine and surface water discharge from LDP001 in 2012 (see Section 8.5 for further details) is slightly lower than the water volume discharged in 2011 (585 ML). Investigations into reducing the mine water discharge by recycling underground mine water were undertaken in 2009 and 2010. These included a water treatment options study and engineering design & feasibility assessments. The preferred option, recycling the underground mine water by treatment in a Reverse Osmosis (RO) plant, was assessed as not feasible for the Mine. The feasibility of the RO plant was limited due to the inability to discharge waste brine generated by the RO plant to receiving waters. Disposal methods, other than the discharge of waste brine, were cost prohibitive and not feasible at this stage. In addition the RO treatment plant was not capable of suppling mining equipment with potable water for 100% of the time as required by operations, due to equipment malfunction and routine maintenance requirements. Given the currently limited options for waste brine disposal and RO treatment plant availability the investigations conclude recycling of underground mine

Annual Environmental Management Report 2012
Page 76
water by an RO treatment, does not at this time, provide a feasible business option to reduce mine water discharges from the Mine. Centennial Coal in 2012 commenced investigations into conventional water treatment and reuse options on a regional basis by undertaking initial collating of water quality and discharge requirements for the Centennial mines in the region.
Annual Environmental Management Report 2012
Page 77
REFERENCES
Australasian Groundwater and Environmental Consultants Pty Ltd, “Mandalong Mine Groundwater Monitoring Review for AEMR 2012”, dated February 2013.
Australia and New Zealand Environment and Conservation Council, “Australian and New Zealand Guideline for Fresh and Marine Water Quality”, dated October 2000.
Centennial Mandalong, “Annual Environmental Management Report 2011”, dated February
2012. Centennial Mandalong, “Centennial Mandalong Mine Flood Path Condition Report 2009”,
dated February 2010. Centennial Mandalong, “Centennial Mandalong Mine Flood Path Condition Report 2010”,
dated February 2011.
Centennial Mandalong, “Centennial Mandalong Mine Flood Path Condition Report 2011”, dated February 2012.
Centennial Mandalong, “End of Panel Report Longwall Panel 12” dated August 2012. Centennial Coal Pty Ltd, “Mandalong South Exploration Project Review of Environmental
Factors“dated October 2009.
GHD Pty Ltd, “2012 Water Balance, Mandalong Mine” dated February 2013. Global Soils Pty Ltd (GSS), “Rehabilitation Audit of Cooranbong Haul Road” dated November
2012.
GSS Environmental Pty Ltd (GSS) “Review of Environmental Factors Mandalong Exploration Drilling Project”, dated December 2008.
Hunter Eco Pty Ltd (a), “Centennial Mandalong Mine Wetland Management Plan”, dated April
2009. Hunter Eco Pty Ltd (b), “Centennial Coal Mandalong Underground Coal Mine Wetland
Monitoring Report April 2010”, dated April 2010. Hunter Eco Pty Ltd (c), “Centennial Coal Mandalong Underground Coal Mine Wetland
Monitoring Report November 2010”, dated November 2010. Hunter Eco Pty ltd (d) “Cooranbong-Awaba Haul Road Threatened Flora Translocation
Report”, dated November 2010.
Hunter Eco Pty Ltd (e), “Centennial Coal Mandalong Underground Coal Mine Wetland Monitoring Report April 2011”, dated April 201.
Hunter Eco Pty Ltd (f) “Mandalong Underground Coalmine Wetlands Monitoring Report
November 2011” dated November 2011.
Hunter Eco Pty Ltd (g), “Centennial Coal Mandalong Underground Coal Mine Wetland Monitoring Report April 2012”, dated April 2012.
Hunter Eco Pty Ltd (h) “Mandalong Underground Coalmine Wetlands Monitoring Report
November 2012” dated November 2012.
Hunter Eco Pty Ltd (i) “VAM-RAB Vegetation Rehabilitation Monitoring” dated November 2012.

Annual Environmental Management Report 2012
Page 78
Keystone Environmental Pty Ltd, “Best Practice Measures to Prevent and or Minimise Emission of Particulate Matter from Coal Mines in the Greater Metropolitan Regions of NSW”, dated 2010.
Seedsman Geotechnics Pty Ltd, Review of Subsidence LW 13, MAND 13-01, February 2013.
SLR Consulting “Mandalong Mine Noise Compliance Assessment” dated November 2012
SLR Consulting, “Blast Monitoring Mandalong Mine August to December 2012” dated December 2012.
Umwelt Australia Pty Ltd – “Environmental Impact Statement Cooranbong Colliery Life Extension Project” dated November 1997.
Page 79
PLANS

Annual Environmental Management Report 2012
Page 80
APPENDICES