nstic state government pilot: michigan department of ... · nstic state government pilot: michigan...
TRANSCRIPT

_________________________________
RTI International is a registered trademark and a trade name of Research Triangle Institute.
December 2016
NSTIC State Government Pilot: Michigan Department of
Health and Human Services
Final Evaluation Report
Prepared for
Trusted Identities Group National Institute of Standards and Technology
100 Bureau Drive Gaithersburg, MD 20899
Prepared by
Troy J. Scott Alan C. O’Connor
RTI International 3040 E. Cornwallis Road
Research Triangle Park, NC 27709
RTI Project Number 0214103

iii
CONTENTS
Section Page
Key Terms and Abbreviations vii
Executive Summary ES-1
1. Introduction 1-1
1.1 The National Strategy for Trusted Identities in Cyberspace ............................ 1-1
1.2 NSTIC State Government Pilots .................................................................. 1-4
1.3 The Partnership Fund for Program Integrity Innovation ................................. 1-4
1.4 Introduction to the MDHHS Pilot ................................................................. 1-5
1.5 Evaluation Objectives ............................................................................... 1-6
2. MDHHS Pilot by the Numbers 2-1
2.1 Knowledge-Based Verification Metrics ......................................................... 2-1 2.1.1 Number of KBV Quizzes Generated ................................................... 2-1 2.1.2 Diversionary Questions and Suppressed Quizzes ................................ 2-3 2.1.3 KBV Quiz Opt-Out Rates .................................................................. 2-4 2.1.4 KBV Quiz Pass Rate ........................................................................ 2-5 2.1.5 KBV-Verified Rate ........................................................................... 2-7
2.2 Multifactor Authentication and Related Metrics ............................................. 2-8 2.2.1 MFA Summary Statistics ................................................................. 2-9 2.2.2 Persistence and Success................................................................ 2-11
3. Pilot Impacts: Program Efficiency 3-1
3.1 Reduced Application Backlog—Month-Level Analysis ..................................... 3-1 3.1.1 Regression Results (Technical Detail) ................................................ 3-2 3.1.2 Discussion and Limitations .............................................................. 3-4
3.2 Reduced Waiting Time for Applicants for Public Assistance—Application-Level Analysis .......................................................................................... 3-6 3.2.1 Survival Models and Results (Technical Detail) ................................... 3-8 3.2.2 Robustness Checks (Technical Detail) ............................................. 3-10
4. Pilot Impacts: Program Integrity 4-1
5. MI Bridges Applicant Survey 5-1

iv
5.1 Key Findings ............................................................................................ 5-1 5.1.1 KBV Experience .............................................................................. 5-2 5.1.2 KBV Participation............................................................................ 5-3 5.1.3 Reasons for KBV Nonparticipation..................................................... 5-5 5.1.4 Federated Login and Multifactor Authentication .................................. 5-6
5.2 Survey Methods and Sample ..................................................................... 5-7
5.3 Survey Instrument and Results .................................................................. 5-8
6. Discussion 6-1

v
FIGURES
Number Page
1-1. Benefits of the NSTIC Identity Ecosystem ......................................................... 1-2 2-1. LexisNexis Transactions, December 2014 to November 2015 .............................. 2-2 2-2. LexisNexis Transactions, August 16 to November 30, 2015 ................................ 2-3 2-3. Unreturned Quiz Rate versus True Opt-Out Rate ............................................... 2-5 2-4. Percentage of Quizzes with at Least One Diversionary Question .......................... 2-6 2-5. KBV Quiz Pass Rates ...................................................................................... 2-7 2-6. KBV-Verified Rates ........................................................................................ 2-8 2-7. Access Mode Success Rates by Week ............................................................. 2-10 2-8. Success Rates by Access Attempt .................................................................. 2-10 4-1. FEE Approval Rates ....................................................................................... 4-2 4-2. Cost Avoided per FEE Investigation ................................................................. 4-3

vi
TABLES
Number Page
1-1. MDHHS Programs: Fiscal Year 2014 ................................................................. 1-6 2-1. Success Rates by Access Mode ........................................................................ 2-9 2-2. Same-Day Outcomes by Access Mode ............................................................ 2-11 2-3. First and Subsequent Same-Day Outcomes by Access Mode ............................. 2-12 2-4. Success Rates by Time Elapsed Since Last Access Attempt ............................... 2-13 3-1. Summary of OLS Regression Results, Month-Level Application Backlog ................ 3-3 3-2. Summary of Reduced Waiting Time Estimates, Application-Level Data ................. 3-8 3-3. Summary of Survival Model Results ................................................................. 3-9 3-4. FAP: Controls for Application Volume ............................................................. 3-11 3-5. FAP: Robustness to Waiting Time Cutoff ......................................................... 3-11 3-6. FAP: Robustness to Fewer Weeks Included ..................................................... 3-12 3-7. FAP: Robustness to Additional Weeks Included ............................................... 3-12 3-8. FAP: Robustness to Model Specification: Means of Controlling for Approval
Status and Day of Week (Fixed Effects versus Stratification), and Proportional Hazards Assumption under Fixed Effects ........................................................ 3-13
3-9. FAP: Robustness to Model Specification: Proportional Hazards Assumption when Controlling for Day of Week with Fixed Effects or Stratification ................. 3-14
3-10. FAP: Robustness to Model Specification: Distributional Assumptions I ................ 3-15 3-11. FAP: Robustness to Model Specification: Distributional Assumptions II ............... 3-15 5-1. Users’ Experience with the KBV Quiz ................................................................ 5-2 5-2. Users’ Perceptions of Security ......................................................................... 5-3 5-3. Correlates of Self-Reported KBV Participation ................................................... 5-4 5-4. Foreknowledge of KBV ................................................................................... 5-5 5-5. Reasons for KBV Nonparticipation.................................................................... 5-6 5-6. Federated Login ............................................................................................ 5-7 5-7. Multifactor Authentication ............................................................................... 5-7

vii
Key Terms and Abbreviations
Applicant Used interchangeably with client and user. The term “applicant” is used especially to refer to a client in the process of applying for benefits (as opposed to accessing their account to change some information or check the status of a benefit they are receiving).
Identity proofer Entity providing identity verification and authentication services to the relying party. In the case of the MDHHS pilot, the identity proofer was LexisNexis.
Bridges MDHHS’s data warehouse, containing information on benefits applications for the various MDHHS programs and how and when applications were resolved.
CI Confidence interval.
Client A customer of MDHHS: a Michigan resident applying for or receiving MDHHS benefits.
Diversionary question On a KBV quiz, a question based on made-up information, to which no correct answer is presented. The client can still answer such a question correctly by selecting “none of the above.”
FEE Front-End Eligibility. The FEE program is a key component of OIG’s efforts. A FEE referral is initiated, requesting a pre-eligibility investigation by an OIG agent, when applications or re-certifications for public assistance contain suspicious or error prone information.
KBV Knowledge-based verification. In the case of this pilot, KBV takes the form of a four-question, multiple-choice quiz, based on information drawn from public records, credit histories, and other sources. The idea is to achieve a level of certainty that a person is who they claim online by having them answer questions to which only they are likely to know the answers. Thus, KBV is a means of identity proofing.
MDHHS Michigan Department of Health and Human Services. http://www.michigan.gov/mdhhs/
MI Bridges Michigan’s integrated eligibility system that supports online enrollment and registration, including eligibility determination, for citizens seeking public assistance from a range of programs, including health care coverage, food assistance, cash assistance, child care, and emergency services.
OIG Office of the Inspector General. OIG is the criminal justice agency responsible for maintaining the integrity of MDHHS programs by detecting fraud and deterring attempted fraud.
MFA Multifactor authentication. MFA adds a layer of security to an online transaction by combining two or more independent credentials. In the case of the MDHHS pilot, clients are asked to provide, in addition to their username and password, a security code sent to their email or mobile device.
MI Bridges MDHHS’s integrated eligibility system that supports online enrollment and registration for citizens seeking public assistance from MDHHS programs.
Relying party In connection with KBV, the relying party is the entity wishing to ascertain whether a person is presenting their own true identity. In the case of this pilot, the relying party is MDHHS.
User Used interchangeably with client and applicant.

ES-1
Executive Summary
In this first-of-its-kind study, RTI International conducted a statewide, in-depth assessment of the Michigan Department of Health and Human Services (MDHHS) pilot of online identity verification for applicants for public assistance (e.g., food assistance, medical assistance, temporary assistance for needy families). The study found that the pilot led to a reduction in application backlogs and reduced average application processing times by about one day for the majority of MDHHS’s largest public assistance programs.
We also evaluated the opinions and perspectives of applicants for public assistance regarding online identity authentication. Our evaluation found that respondents had generally favorable impressions.
MDHHS receives between 165,000 and 280,000 applications for benefits each month, over half of which are submitted online. Under a cooperative agreement with the Trusted Identities Group at the National Institute of Standards and Technology, MDHHS incorporated knowledge-based verification (KBV) and multifactor authentication (MFA) solutions into its online application system to make applying for assistance more secure and efficient for eligible applicants while maintaining program integrity. The pilot was one of a series of pilots to further the National Strategy for Trusted Identities in Cyberspace (NSTIC).
The trend of moving government services online holds the potential to bring greater convenience and efficiency for both citizens and government. But with transactions as sensitive and personal as applying for public assistance, there is keen awareness of issues of privacy, security, identity theft, and fraud. Effective and efficient means of managing identities in cyberspace is key to realizing benefits while mitigating risks.
Using a combination of economic analysis and survey research, RTI analyzed MDHHS’s pilot implementation of the NSTIC, impacts observable in data about MDHHS’s operations, and the opinions of applicants for public assistance on having their identities verified online.
Our evaluation found that the pilot led to an 8% reduction in application backlogs for the Food Assistance Program (FAP) and reduced average application processing times by about a day for four of the five largest MDHHS programs: FAP, Medical Assistance (MA), Temporary Assistance to Needy Families (TANF), and Child Development and Care (CDC). By one measure, reducing application backlogs was equivalent to adding 95 eligibility specialists to help process applications.
These improvements in program efficiency do not appear to have come at the expense of program integrity; no increases in the levels or frequencies of fraud were detected.

1-1
1. INTRODUCTION
Under a $1.3 million cooperative agreement with the Trusted Identities Group at the National Institute for Standards and Technology, the Michigan Department of Health and Human Services (MDHHS) piloted the use of knowledge-based verification (KBV) and multifactor authentication (MFA) solutions with its online application system to make applying for public assistance more secure and efficient for eligible applicants while maintaining program integrity. The pilot was one of a series of pilots funded to further the implementation of the National Strategies for Trusted Identities in Cyberspace (NSTIC).
In the initial 11 months of the MDHHS launch of the KBV—from December 20, 2014 through November 30, 2015—402,630 clients passed a KBV quiz. By the time the pilot concluded, more than 65% of the online applications MDHHS received in a typical week were submitted by applicants whose identity had been verified through KBV, saving MDHHS staff time in processing the applications.
Launched in September 2015, the MFA solution registered 1,280,372 successful logins in its first 17 weeks, an average of 10,851 per day. Of these, 77% used security questions, 14% used an access code sent by text message to a mobile device, and 9% used an access code sent through email.
For this evaluation, we analyzed the impact and pattern of KBV and MFA usage on the efficiency and integrity of MDHHS’s systems. We also surveyed 20,446 MDHHS clients who had the opportunity to answer KBV questions as part of the online application process to acquire insight into clients’ first-hand experience with KBV and their perceptions and opinions about KBV and related online security issues.
1.1 The National Strategy for Trusted Identities in Cyberspace
The NSTIC, also referred to as “the Strategy,” established a framework and plan for the public and private sectors, advocacy groups, and non-profits to collaborate to raise the level of trust associated with the identities of individuals, organizations, networks, services, and devices involved in online transactions.1 The NSTIC envisions an Identity Ecosystem with closely intertwined benefits for individuals, the private sector, and government (Figure 1-1).
It envisions a user-centric Identity Ecosystem, defined as “an online environment where individuals and organizations will be able to trust each other because they follow agreed-upon standards to obtain and authenticate their digital identities—and the digital identities of devices” (http://www.nist.gov/nstic/guiding-principles.html).
1 The vision of the NSTIC is “[i]ndividuals and organizations utilize secure, efficient, easy-to-use and
interoperable identify solutions to access online services in a manner that promotes confidence, privacy, choice, and innovation.” The complete document is available online at http://www.whitehouse.gov/sites/default/files/rss_viewer/NSTICstrategy_041511.pdf.

NSTIC State Government Pilot: Michigan Department of Health and Human Services
1-2
Aspects of the envisioned Identity Ecosystem exist today, including online user authentication using a combination of username, password, and one-time code. These are building blocks that further the strategy—milestones on the pathway to greater trust in cyberspace.
Figure 1-1. Benefits of the NSTIC Identity Ecosystem
Benefits for Individuals • Convenience. Individuals will be able to conduct their personal business online
with less time and effort, without needing as many usernames and passwords. • Privacy. The Identity Ecosystem will enhance privacy by reducing the amount of
identifying information that is collected and transmitted online and protecting individuals from those who would link individuals’ transactions in order to track online activities.
• Security. Stronger authentication will limit unauthorized transactions, and reduced transmission of identifying information will reduce the risk of data breaches and identity theft.
Benefits for the Private Sector • Innovation. The Identity Ecosystem will provide a platform on which new
business models will be developed—just as the internet has been a platform for innovation. It will enable companies to expand their online service offerings, especially in health care and banking.
• Efficiency. By increasing the security of online transactions, lowering barriers to customer enrollment in online services, and enabling companies to expand their online service offering, the Identity Ecosystem will enable companies to realize savings by, for example, reducing reliance on paper-based processes, reducing help-desk costs associated with account management and password maintenance, and reducing liabilities relating to fraud and identity theft.
• Trust. Trusted digital identities will allow organizations to better display and protect their brands online. Participants in the Identity Ecosystem will be more trusted by virtue of their compliance with standards for privacy and security.
Benefits for Government • Constituent Satisfaction. The Identity Ecosystem will enable government to
expand its online service offerings and increase integration among government service providers to coordinate service delivery to constituents.
• Economic Growth. Government support for the Identity Ecosystem will generate innovation in the marketplace that will create new business opportunities and advance U.S. business goals in international trade.
• Public Safety. Increasing online security will reduce cybercrime, improve the integrity of networks and systems, and raise overall consumer safety levels. Enhanced online trust will also provide a platform to support more effective and adaptable response to national emergencies.
Source: National Strategy for Trusted Identities in Cyberspace: Enhancing Online Choice, Efficiency, Security, and Privacy. April 2011. Pp. 17-19. http://www.whitehouse.gov/sites/default/files/rss_viewer/NSTICstrategy_041511.pdf

Section 1 — Introduction
1-3
NSTIC specifies four guiding principles to which the Identity Ecosystem must adhere:
1. Identity solutions will be privacy enhancing and voluntary.
2. Identity solutions will be secure and resilient.
3. Identity solutions will be interoperable.
4. Identity solutions will be cost-effective and easy to use.
The Strategy will only be a success—and the ideal of the Identity Ecosystem will only be achieved—if identity solutions fulfill all of these guiding principles. Achieving them separately will not only lead to an inadequate solution but could also serve as a hindrance to the broader evolution of cyberspace.
The Identity Ecosystem that is emerging aims ultimately to enable internet users to use the same robust online credentials at a variety of sites. 2 They would choose a private-sector online identity provider, be authenticated by that provider, and then be issued online credentials. Instead of submitting personal information to and maintaining unique user accounts and passwords for each place they visit online, websites would accept their third-party credentials and rely on the identity provider to verify that users are, in fact, who they say they are. This authentication method could reduce both users’ and websites’ risks of data breaches and identity theft, all else held equal.
The National Institute of Standards and Technology (NIST) is charged with implementing the Strategy. NIST established the Trusted Identities Group to lead implementation, with a focus on promoting private-sector involvement and engagement; supporting interagency collaboration and coordinating interagency efforts associated with achieving programmatic goals; building consensus on policy frameworks necessary to achieve the vision; identifying areas for the government to lead by example in developing and supporting the Identity Ecosystem, particularly in the Executive Branch’s role as a provider and validator of key credentials and attributes; actively participating within and across relevant public- and private-sector forums; and assessing progress against the goals, objectives, and milestones of the NSTIC.
In implementing the Strategy, the Trusted Identities Group seeks to build on the existing marketplace; encourage new solutions; and establish a baseline of privacy, security, interoperability, and ease of use of trusted digital identity credentials that will improve trust in online transactions while enabling the market in online credentials to flourish.3
2 Ideally, such credentials would not rely on conventional username and password. Microsoft Passport
is one such example. Additional background and examples of FAST ID Online (FIDO) can be found on the website of the FIDO Alliance: https://fidoalliance.org.
3 To further advance the development of the Identity Ecosystem Framework and to build on the existing marketplace in online credentials, NIST has provided financial assistance to the Identity Ecosystem Steering Group (IDESG). The IDESG is the only private-sector organization currently

NSTIC State Government Pilot: Michigan Department of Health and Human Services
1-4
1.2 NSTIC State Government Pilots
The Trusted Identities Group launched the State Pilots Cooperative Agreement Program in 2013 to pilot online identity solutions that embrace and advance the NSTIC vision of the Identity Ecosystem.4 ““With so many individuals depending on state services for day-to-day activities, state governments are uniquely positioned to advance digital identity for large populations,” said Michael Garcia, director of NIST's Trusted Identities Group. “Providing secure, privacy-enhancing, and convenient access to these services is a logical step with overwhelming impact.”5
Identity solutions funded under the pilot must:
1. Enable online access to one or more state, local, or tribal government service(s).
2. Provide for a federated, verified identity that enables MFA and an effective identity-proofing process meeting the risk needs of the service(s).
3. Align with the Identity Ecosystem Framework requirements.
4. Allow for interoperability with other federations in use in the public and private sectors.
Two pilot projects were awarded, one to MDHHS ($1.3 million) and one to the Commonwealth of Pennsylvania ($1.1 million). These two pilots joined more than 20 other pilot projects funded under the NSTIC Pilots Cooperative Agreement Program between 2012 and 2016.6
1.3 The Partnership Fund for Program Integrity Innovation
Funds for the pilots (and for this evaluation) were provided to NIST by the Office of Management and Budget (OMB) Partnership Fund for Program Integrity Innovation. The purpose of the Partnership Fund for Program Integrity Innovation, as set forth on the Fund’s website, www.partner4solutions.gov, is to fund pilot projects and evaluations that test ideas for improving federal assistance programs through the following measures:
▪ Reducing improper payments.
▪ Improving administrative efficiency.
▪ Improving service delivery.
▪ Protecting and improving program access for eligible beneficiaries.
committed to managing the development of the Identity Ecosystem Framework. More information on the IDESG is available at http://www.idecosystem.org.
4 Announcement of Federal Funding Opportunity (FFO) Number 2013-NIST-NSTIC-02: National Strategy for Trusted Identities in Cyberspace (NSTIC) Pilots: Trusted Online Credentials for Accessing Government Services Cooperative Agreement Program. http://www.nist.gov/nstic/20130415-20130411-2013-NIST-NSTIC-02FFO.pdf
5 Personal communication with Alan C. O’Connor, December 14, 2016. 6 Descriptions of the pilot projects funded in the past are available on the NSTIC website at
https://www.nist.gov/itl/tig/pilot-projects.

Section 1 — Introduction
1-5
In line with the OMB Partnership’s interest in promoting novel ideas to improve the delivery of federally funded, state-delivered, public assistance programs, the focus of these pilots is the implementation of trusted online credentials for accessing government services. The pilots are intended to alleviate the challenges states face, as they shift eligibility and enrollment processes online, in developing effective and secure identity verification solutions to support convenient customer access and program integrity across multiple services and agencies.
The scope of this evaluation aligns with the OMB Partnership’s interest in understanding the potential benefits of pilot programs for government entities delivering public assistance, and for the citizens who rely on that assistance. This evaluation explores whether citizens can access benefits for which they are eligible more conveniently and securely (with respect to their personal information), and whether the government entities providing benefits can more accurately and efficiently verify identities and determine eligibility, delivering benefits more effectively as a result.
In addition to documenting for OMB the impacts of the MDHHS pilot, this evaluation aims to inform other stakeholders considering adoption of online identity solutions aligned to the NSTIC, by communicating lessons learned from the MDHHS pilot, contributing to the development of best practices, and framing expectations regarding potential impacts.
1.4 Introduction to the MDHHS Pilot
With the $1.3 million grant, MDHHS piloted the use of online identity verification and authentication solutions with MI Bridges, Michigan’s integrated eligibility system that supports online enrollment and registration for citizens seeking public assistance from a range of programs, including health care coverage, food assistance, cash assistance, child care, and emergency services.
Across its programs, MDHHS serves 3 million clients annually, distributing $3 billion in benefits exclusive of medical assistance (Table 1-1).7 MI Bridges handles more than 1 million online benefits applications per year. MDHHS is staffed by 2,173 full-time equivalents (FTE) in program offices and central administration and 10,953 FTEs in local offices, including 2,561 FTE Eligibility Specialists.8
7 MDHHS Annual Report of Key Program Statistics, FY 2014. Accessed 2/8/2015:
http://www.michigan.gov/documents/dhs/2014_Annual_State_Summary_479168_7.pdf 8 MDHHS FTE Report for the pay period ending September 26, 2015. Accessed 2/18/2015:
http://www.michigan.gov/documents/mdhhs/Section_214_Rpt_6__2015_505772_7.pdf

NSTIC State Government Pilot: Michigan Department of Health and Human Services
1-6
Table 1-1. MDHHS Programs: Fiscal Year 2014
Program Cases Recipients Payments
Family Independence Program (FIP) 64,418 165,786 $158,222,899
Food Assistance Program (FAP) 1,132,889 2,153,240 $2,565,215,918
State Disability Assistance (SDA) 14,034 13,971 $17,303,260
Child Development and Care (CDC) 44,738 80,094 $112,932,157
State Emergency Relief (SER) 133,301 355,574 $78,392,930
Medicaid 1,615,368 2,576,683 —
Total 2,959,203 $2,932,067,163
Note: A recipient may have received a benefit from more than one program. Total number of recipients is the unduplicated total, which counts such recipients only once. The unduplicated total of cases was 1,156,612, not including Medicaid; an unduplicated total of cases across all programs and Medicaid was not reported.
Source: MDHHS Annual Report of Key Program Statistics, FY 2014. Accessed 2/8/2015: http://www.michigan.gov/mdhhs/0,5885,7-339-73970_61179_56550---,00.html
Under the pilot, MDHHS added KBV functionality to MI Bridges. With KBV, information provided by a benefits applicant (the client) is used to identify the person in a database and, drawing on such sources as public records and credit histories, to generate a multiple-choice quiz that only that person would likely be able to pass. Questions might ask the client to identify which of several addresses they had ever or never been associated with or the model year of a vehicle they once owned. The KBV solution, with LexisNexis serving as the identity proofer (i.e., providing identity authentication and verification based on personal attributes in its databases), was launched December 20, 2014.
Also as part of the pilot, MDHHS added MFA functionality to MI Bridges. Specifically, clients are prompted to provide an additional piece of information with their username and password: a security code sent either to their email or mobile device. Clients had the option to bypass MFA and answer security questions they had set up (e.g., mother’s maiden name, name of favorite teacher, or first school attended) in lieu of a second factor. The MFA solution was launched September 26, 2015.
1.5 Evaluation Objectives
Under the NSTIC pilots program, RTI was awarded a cooperative agreement to conduct an independent, third-party evaluation of the MDHHS pilot. The success of the pilot will largely be based on measured impacts on three key outcomes: 1) the efficient and secure enrollment of legitimate applicants for MDHHS services, 2) the ability to deter fraudulent and improper enrollment for MDHHS services, and 3) the ability for MDHHS clients to efficiently and securely review their information and status in MDHHS’s online systems.

Section 1 — Introduction
1-7
This evaluation is organized as follows
▪ Section 2, MDHHS Pilot by the Numbers, reports key metrics summarizing direct client interactions with the KBV and MFA solutions.
▪ Section 3, Pilot Impacts: Program Efficiency, provides analysis of the pilot’s impacts on the efficiency of processing applications, as reflected in application backlogs and the time clients can expect to wait for their applications to be processed.
▪ Section 4, Pilot Impacts: Program Integrity, provides analysis of the pilot’s impacts on the ability of MDHHS to detect and deter fraud.
▪ Section 5, Client Survey, presents the results of survey of 20,446 MDHHS clients, asking about their views and opinions of the KBV.
▪ Section 6, Discussion, concludes with a review of key takeaways and lessons learned.

2-1
2. MDHHS PILOT BY THE NUMBERS
This section provides a summary of the KBV and MFA solutions. Section 2.1 summarizes KBV transactions by their outcomes, looking in particular at the rates at which MDHHS clients elected not to take the KBV quiz (i.e., opt-out of the KBV) and the rates at which those electing to take the KBV quiz succeeded in passing it. Section 2.2 summarizes client transactions by MFA mode (security code either emailed or sent to a mobile device) or MFA bypass (non-MFA security questions) and by their outcomes (success or failure in accessing the account).
2.1 Knowledge-Based Verification Metrics
Clients applying for MDHHS benefits through MI Bridges provide personal information that MDHHS uses to verify their identity and eligibility for benefits. In most cases, this information includes name, address, and date of birth. (Applicants are not required to provide their social security number.)
With the KBV solution, this information is first passed to LexisNexis, which checks the information against its databases to determine whether a matching individual exists, then uses its data to generate a multiple-choice quiz. LexisNexis databases are populated from such sources as public records and various proprietary data sources. Questions might ask the client to identify, for example, which of several addresses they had ever or never been associated with, which of several people they had ever or never lived with, or which of several vehicles they had ever or never owned.
The intent of the KBV is to present a quiz that only the matching individual would likely be able to pass. Assessing the effectiveness of this specific KBV implementation in accomplishing this intent is beyond the scope of this evaluation.
Applications of individuals who take and pass the KBV quiz are flagged as having had their identity verified through LexisNexis. Applicants who opted out of the KBV quiz or who took the quiz and failed are identically flagged as not having been verified. MDHHS staff were instructed to treat non-verified applicants just as they would have any other applicant prior to the pilot. That is, while verified applicants may receive less scrutiny with respect to their identity, non-verified applicants were to have their identities verified by standard protocols that existed prior to the pilot.
2.1.1 Number of KBV Quizzes Generated
From December 20, 2014,9 through November 30, 2015, the total number of transactions hitting LexisNexis services was 1,222,108. In 95% of those transactions, LexisNexis 9 The KBV function was activated December 20, 2014. Problems were identified that prompted
MDHHS to turn off the KBV the same day. The KBV function was reactivated December 30, 2014, and has been continuously active since that date.

NSTIC State Government Pilot: Michigan Department of Health and Human Services
2-2
returned a LexID (i.e., found a matching individual) and generated a KBV quiz. Of the 1,158,451 quizzes generated, 696,053 (60%) had answers submitted back to LexisNexis to score. Out of the remaining 40%, 10,125 (less than 1% of all quizzes generated) were returned after having expired; the rest were not returned at all. See Figure 2-1.
Figure 2-1. LexisNexis Transactions, December 2014 to November 2015
Source: RTI. Underlying numbers are from LexisNexis.
Quizzes not returned at all include two cases. First, the client could have seen the quiz and not answered the questions. This could be because the client opted out—clicking a button to say they wished to bypass the KBV and proceed with their application without completing the quiz—or they simply navigated away from the KBV screen in their browser or closed their browser. Second, the quiz could have been suppressed by MI Bridges (i.e., not shown to the client) because the client had previously passed a KBV quiz (as is discussed later). In these cases, the application was flagged identically to one where the applicant had passed the KBV immediately before submitting the application.
Of the 696,053 quizzes scored, 402,630 (58%) were scored a pass, having at least three correct answers out of a possible four. The overall pass rate is lower than it would have been had not a programming error in the MDHHS software, which caused some clients’ answers to be misrepresented to LexisNexis, gone undetected for the first seven months of the implementation.
After the problem was fixed on August 16, 2015, the pass rate averaged 72%. Pass rates for 2-week periods during this time ranged from 70% to 74% (Figure 2-2).
1,222,108Transactions hitting LexisNexis Services
63,657Transactions with no ID
found (no LexID returned)5%
1,158,451Transactions with ID found
(LexID returned)95%
696,053Quiz returned to
LexisNexis to score60%
462,398Quiz not returned
or expired40%
402,630Pass58%
293,423Fail42%

Section 2 — MDHHS Pilot by the Numbers
2-3
Figure 2-2. LexisNexis Transactions, August 16 to November 30, 2015
356,361Transactions hitting LexisNexis Services
18,960Transactions with no ID
found (no LexID returned)5%
337,401Transactions with ID found
(LexID returned)95%
178,762Quiz returned to
LexisNexis to score53%
158,639Quiz not returned
or expired47%
129,248Pass72%
49,514Fail28%
Source: RTI. Underlying numbers are from LexisNexis.
2.1.2 Diversionary Questions and Suppressed Quizzes
It is sometimes infeasible for LexisNexis to generate four questions with known answers for an individual matching the information provided by the MI Bridges applicant. One such instance would be if the information cannot be resolved to a single matching individual (as in the 5% of cases shown in Figure 2-2 with no LexID returned). Another instance is when an individual’s footprint in LexisNexis databases is not sufficiently large.
In these instances, LexisNexis can generate “diversionary” questions, meaning questions based on made-up information having no correct answer. These questions can be answered correctly by the client by selecting “none of the above” as the answer choice. It is the relying party’s decision whether to present to its clients quizzes with one or more diversionary questions, and whether to allow clients to pass such quizzes (i.e., to be deemed KBV-verified on the basis of a quiz with one or more diversionary questions).
From December 20, 2014, through August 15, 2015, quizzes with at least three out of four correct answers were scored a pass, regardless of the number of diversionary questions they contained. An applicant could have received all diversionary questions, selected “none of the above” for each question, and passed the KBV quiz. Essentially, the system would have erroneously indicated that the identity had been verified.
MDHHS and LexisNexis later resolved this loophole. Beginning on August 16, 2015, quizzes that would have been generated with more than two (i.e., either three or four) diversionary questions were not generated, and in those cases, the client was not presented with a quiz.10
A relying party (like MDHHS) must work with its identity proofer (like LexisNexis) to ensure that software systems interface and work as expected and to ensure that the configuration
10 For example, in the 5% of cases where no LexID was returned, prior to this change the client would
have been presented with a quiz comprised of four diversionary questions; after this change, such cases resulted in no quiz being presented to the client.

NSTIC State Government Pilot: Michigan Department of Health and Human Services
2-4
meets the relying party’s business needs. In this planning and implementation process, one important consideration is the treatment of diversionary questions. Should a quiz having more than some number of diversionary questions be passable, or should it be flagged for special treatment? A second important consideration is how to manage instances when the relying party wishes not to display a quiz to a client. MDHHS, for example, did not display quizzes to clients who had previously passed a quiz.
If the relying party is paying based on the total volume of transactions, it may wish to avoid triggering unnecessary transactions, such as generating quizzes that will not be shown to the client or generating quizzes that the relying party would never treat as having been passed (e.g., quizzes with too many diversionary questions). With programming changes implemented on August 16, 2015, this is exactly what MDHHS did; clients who had passed a quiz previously and clients for whom LexisNexis would be unable to generate at least two nondiversionary questions did not have quizzes generated for them.
2.1.3 KBV Quiz Opt-Out Rates
The rate at which clients elected not to answer KBV quiz questions (i.e., opt-out rate) averaged 22% from January through August 2015. Opt-out rates were initially lower (17% in January and 20% in February), then gradually rose and leveled out at around 25% by mid-summer (Figure 2-2). This trend may be driven to some extent by changing behavior. As clients become more familiar with this new feature, some may decide that for them the cost of their time to answer the questions is not justified by the benefits they perceive in terms of faster processing of their application. But certainly part of this trend is not behavioral but rather is driven by selection. Recall that clients who pass a KBV quiz are not presented with the quiz again, leaving behind a group somewhat more likely to opt out.
Relying parties wishing to track KBV opt-out rates should be cautioned to think carefully about the meaning of metrics reported by the identity proofer and recognize the need to supplement these metrics with their own tracking. There are limits to the amount and type of information the identity proofer can reasonably be expected to provide. In the case of MDHHS, because quizzes generated by LexisNexis and transmitted to MI Bridges were being suppressed by MI Bridges, opt-out rates, when based on LexisNexis metrics, were artificially inflated. To LexisNexis, a suppressed quiz generates the same outcome as a true opt-out: the quiz is not returned to LexisNexis to score. Therefore, true opt-outs and suppressed quizzes were being conflated in the opt-out rate reported by LexisNexis. Not until MI Bridges provided its own metrics tracking true opt-out events, based on data not available to LexisNexis, was the actual opt-out rate known. Figure 2-3 shows the difference between the unreturned quiz rate and the true opt-out rate.

Section 2 — MDHHS Pilot by the Numbers
2-5
Figure 2-3. Unreturned Quiz Rate versus True Opt-Out Rate
Notes: LexisNexis metrics reflect the unreturned quiz rate, in which true opt-outs are conflated with quizzes that MDHHS has suppressed (not presented to the client). When an implementation involves quizzes being suppressed, the relying party should be aware of the implications for accurately tracking the performance of the solution. In this case, the true opt-out rate could only be determined from data captured by MI Bridges. MDHHS provided this data to RTI through the middle of August.
2.1.4 KBV Quiz Pass Rate
Ultimately, after correcting logic and performance issues in MI Bridges, MDHHS clients pass the KBV quiz at a rate of 72%. This is the total number of passed quizzes divided by the total number of quizzes submitted to LexisNexis to score for the period August 16, 2015, through November 30, 2015. During this period, if LexisNexis could not generate at least two nondiversionary questions for a client, no quiz was generated. Quizzes with one or two diversionary questions were still generated and could be passed (as could any other quiz) by answering three or four out of four questions correctly, regardless of the number of diversionary questions contributing to the correct answers.
It is worth noting that the pass rate depends on the type of questions included in the quiz. A relying party may tune the difficulty of quizzes to obtain a higher or lower pass rate. What is lacking however, and what relying parties need to make appropriate decisions, is reliable data characterizing the tradeoff between ease of use for good actors and the effectiveness with which the quiz screens out bad actors. For example, is there an ideal range for pass rates, above which it becomes easy for bad actors to pass and below which good actors are overburdened without much incremental improvement in screening out bad actors? It might be possible even to characterize question types by their ability to present a differential level of difficulty to good and bad actors; the most useful questions are those that are both easy for the correct person to answer and possible for the wrong person to answer only by chance.
Beginning August 16, 2015, two sets of changes were implemented that affected the Lexis KBV pass rate. First, programming changes to the MI Bridges system were made to correct
0%
10%
20%
30%
40%
50%
27-Dec 21-Jan 15-Feb 12-Mar 6-Apr 1-May 26-May 20-Jun 15-Jul 9-Aug 3-Sep
Perc
ent o
f Qui
zzes
Unreturned Quiz RateTrue Opt-Out Rate

NSTIC State Government Pilot: Michigan Department of Health and Human Services
2-6
a problem that had caused answers on some quizzes to be submitted to LexisNexis incorrectly. Second, programming changes to the MI Bridges system were made so that quizzes that would have more than two diversionary questions and quizzes that would be suppressed by MI Bridges (because the client had previously passed a quiz) would no longer be generated by LexisNexis; the programming changes made it so that MI Bridges no longer sent messages to LexisNexis that would result in such quizzes being generated.
From the beginning of the pilot through August 15, 2015, the average KBV pass rate was 54%. Had quizzes with three or four diversionary questions not been presented (removing those from both numerator and denominator as was done from August 16 onward), the pass rate would have been only slightly lower at 53.5%.
The effect of the August 16 changes on the percentage of quizzes generated with at least one diversionary question is shown in Figure 2-4; the rate drops from 4.4% to 3%. The smaller abrupt drop in March coincides with a change made by LexisNexis to the set of question types from which it could draw when constructing quizzes; the types eliminated had been somewhat more likely to be generated as diversionary questions.11
Figure 2-4. Percentage of Quizzes with at Least One Diversionary Question
Notes: Beginning on August 16, 2015, LexisNexis generated no quizzes that would have contained more than two diversionary questions. The smaller abrupt drop in the fraction of quizzes generated with at least one diversionary quiz, in March, corresponds to the removal of some question candidates that were somewhat more likely to be generated as diversionary questions.
Relying parties should consider carefully how to handle quizzes with at least one diversionary question. Although such quizzes make up only a small fraction of the total, they appear substantially easier to pass. From the beginning of the pilot through August 15, the pass rate for quizzes with no diversionary questions was 54% compared with 66% for 11 This report does not disclose operational detail surrounding the number of data elements
LexisNexis has available and the number of these that MDHHS elected to use.
0%
1%
2%
3%
4%
5%
6%
1-Jan 29-Jan 26-Feb 26-Mar 23-Apr 21-May 18-Jun 16-Jul 13-Aug 10-Sep 8-Oct
Perc
enta
ge o
f Qui
zzes
with
at
Leas
t One
Div
ersio
nary
Q
uest
ion

Section 2 — MDHHS Pilot by the Numbers
2-7
quizzes with at least one diversionary question. For August 16 onward, the pass rate for quizzes with no diversionary questions was 72% compared with 91% for quizzes with at least one diversionary question (Figure 2-5).
Figure 2-5. KBV Quiz Pass Rates
Notes: Quizzes with at least one diversionary question are passed at higher rates than quizzes with no diversionary questions.
2.1.5 KBV-Verified Rate
A different KBV success rate is also important to understand for the impact analysis that follows in Section 3: the fraction of online applications linked to a KBV-verified identity. Call this the KBV-verified rate.
Application intake forms processed by MDHHS have a flag indicating whether KBV has verified the applicant’s identity. If the applicant has ever passed a KBV quiz, the flag indicates they have been KBV verified. If the applicant has never passed a KBV quiz (i.e., they have either taken and failed or opted out of every quiz ever presented to them), the flag indicates that they have not been KBV verified.
The KBV-verified rate is based entirely on MI Bridges data and differs from the KBV quiz pass rate, based on LexisNexis data, in two ways:
1. Opt-outs and unreturned quizzes are included in the denominator of the KBV-verified rate, which causes the rate to be (at least initially) lower than the quiz pass rate.
2. Applicants who have previously passed a KBV quiz are included in both the numerator and denominator of the KBV-verified rate, which causes this rate to rise over time and converge toward the quiz pass rate.
Overall, the KBV-verified rate has been lower than the quiz pass rate; it rose from 43% in January to 52% in the first half of August (converging on the quiz pass rate), then, with the programming changes implemented August 16, rose to 65% (Figure 2-6).
0.40
0.50
0.60
0.70
0.80
0.90
1.00
1-Jan 29-Jan 26-Feb 26-Mar 23-Apr 21-May 18-Jun 16-Jul 13-Aug 10-Sep 8-Oct
KBV
Qui
z Pas
s Rat
e
At Least One DiversionaryQuestionNo Diversionary Questions

NSTIC State Government Pilot: Michigan Department of Health and Human Services
2-8
Figure 2-6. KBV-Verified Rates
Notes: The KBV-verified rate includes opt-outs in the denominator and is therefore lower than the KBV quiz pass rate. Because the KBV-verified rate includes in both the numerator and denominator instances of submitted applications where the client had previously passed a KBV quiz, this rate tends to rise over time as the cumulative number of KBV-verified clients rises.
2.2 Multifactor Authentication and Related Metrics
MDHHS launched MFA as part of MI Bridges on September 26, 2015. MFA is an additional layer of security to reduce the risk of unauthorized access to clients’ accounts. It requires the client to provide additional information, in addition to username and password, to access their account. MFA is invoked when a MI Bridges client logs back into MI Bridges to complete a pending application, check the status of a submitted application, or change information associated with their case.
The MFA process generates a temporary security code, which clients may elect to receive either by text or email. Each code may be used up to three times within a short window of time before it becomes invalid. Clients also have the option to opt out of MFA and instead answer security questions (e.g., mother’s maiden name, name of favorite teacher). Clients also have the option of bypassing MFA altogether and accessing their account with only a username and password (i.e., clients may currently opt out of MFA altogether).
Section 2.2.1 reports summary statistics of MFA use over the first 17 weeks of the system’s deployment, from September 26, 2015, to January 21, 2016. During that time, there were 1,280,372 successful logins using MFA or security questions, an average of 10,851 per day. Of these successful logins, 77% used security questions (not MFA), 14% used an access code sent by text message to a mobile device (MFA), and 9% used an access code sent to email (MFA).
Section 2.2.2 looks in detail at a sample of 115,853 clients who first attempted security questions or MFA on or after December 12, 2015, when MDHHS began tracking opt-outs, and summarizes patterns of persistence and success. Of those 115,853 first attempts, 21%
40%
45%
50%
55%
60%
65%
70%
75%
80%
27-Dec 21-Jan 15-Feb 12-Mar 6-Apr 1-May 26-May 20-Jun 15-Jul 9-Aug 3-Sep
Pass
Rat
e
KBA Quiz Pass Rate
KBA-Verified Rate

Section 2 — MDHHS Pilot by the Numbers
2-9
opted out immediately (electing to access their account using only their username and password), 68% selected security questions, 6% selected mobile, and 5% selected email.
This analysis is not an impact assessment of MFA. After all, at this time, MFA is still an optional component of a MI Bridges account login. Rather, by looking at trends in these voluntary MFA transactions, this analysis hopes to inform decisions about moving forward with MFA as a login requirement or giving clients the ability to make it impossible to bypass MFA when accessing their accounts.
2.2.1 MFA Summary Statistics
This section analyzes MFA data for September 26, 2015, to January 21, 2016. Because MDHHS did not track opt-outs until December 12, 2015, the metrics in this section do not address opt-out rates. For consistency, all metrics reported here exclude the MFA opt-out transactions reported on or after December 12.
Out of 1,478,933 MFA login attempts, 76% used security questions and 24% used a security code sent by email or text message. When a security code was sent, 40% went to email and 60% went via text message to a mobile device. Success rates were highest with security questions, at 88%. Success rates with security codes were 81% for email and 85% for text message, although a 90% success rate for text is more representative (Table 2-1).
Table 2-1. Success Rates by Access Mode
Mode Total Attempts Successes Success Rate
Email 142,987 116,180 81%
Text messagea 215,725 182,715 85%
Text, weeks 2–17 196,975 177,198 90%
Security questions 1,120,221 981,477 88%
Total 1,478,933 1,280,372 87%
Percentage of Total
Email 10% 9%
Text message 15% 14%
Security questions 76% 77%
a Text message success rates were only 29% in the first week after MFA was launched; with the first week omitted, the average success rate for all mobile attempts is 90%.
Success rates have improved over time, particularly for security questions (Figure 2-7). These trends are driven at least in part by a tendency for success rates for an individual to improve with the number of attempts that individual makes during return logins (Figure 2-8).

NSTIC State Government Pilot: Michigan Department of Health and Human Services
2-10
Figure 2-7. Access Mode Success Rates by Week
Notes: Success rates increased over time. Week 1 is omitted for mobile.
Figure 2-8. Success Rates by Access Attempt
Notes: Success rates increase with a client’s experience. Client’s first attempts are omitted. Success rates on first attempts are as follows: 80% for email, 79% for mobile, and 77% for security questions. The data point for the 21st attempt also includes all attempts after the 21st.
0.74
0.76
0.78
0.80
0.82
0.84
0.86
0.88
0.90
0.92
0.94
0 2 4 6 8 10 12 14 16 18
Succ
ess
Rate
Week
Email Mobile
Security Question Log. (Email)
Log. (Mobile) Log. (Security Question)
0.60
0.65
0.70
0.75
0.80
0.85
0.90
0.95
1.00
1 3 5 7 9 11 13 15 17 19 21
Succ
ess
Rate
Attempt
Email Mobile Security Question
Log. (Email) Log. (Mobile) Log. (Security Question)
Section 2 — MDHHS Pilot by the Numbers
2-11
2.2.2 Persistence and Success
This section looks in detail at a sample of 115,853 clients who attempted MFA or security questions for the first on or after December 12, 2015, when MDHHS began tracking opt-outs, and analyzes persistence and success.
Of those 115,853 first attempts, 21% opted out immediately (bypassing MFA the first time they encountered it and accessing their account with only their username and password), 68% selected security questions, 6% selected text message, and 5% selected email.
Among the 79% of clients who did not opt out, 81% were successful on their first try, another 3% eventually succeeded using their original mode (email, text message, or security questions), 2% succeeded by a different mode (e.g., initially unsuccessful with email, then successful with mobile or security questions), 11% eventually opted out, and 3% abandoned (i.e., have no successful transaction on the same day as their first).
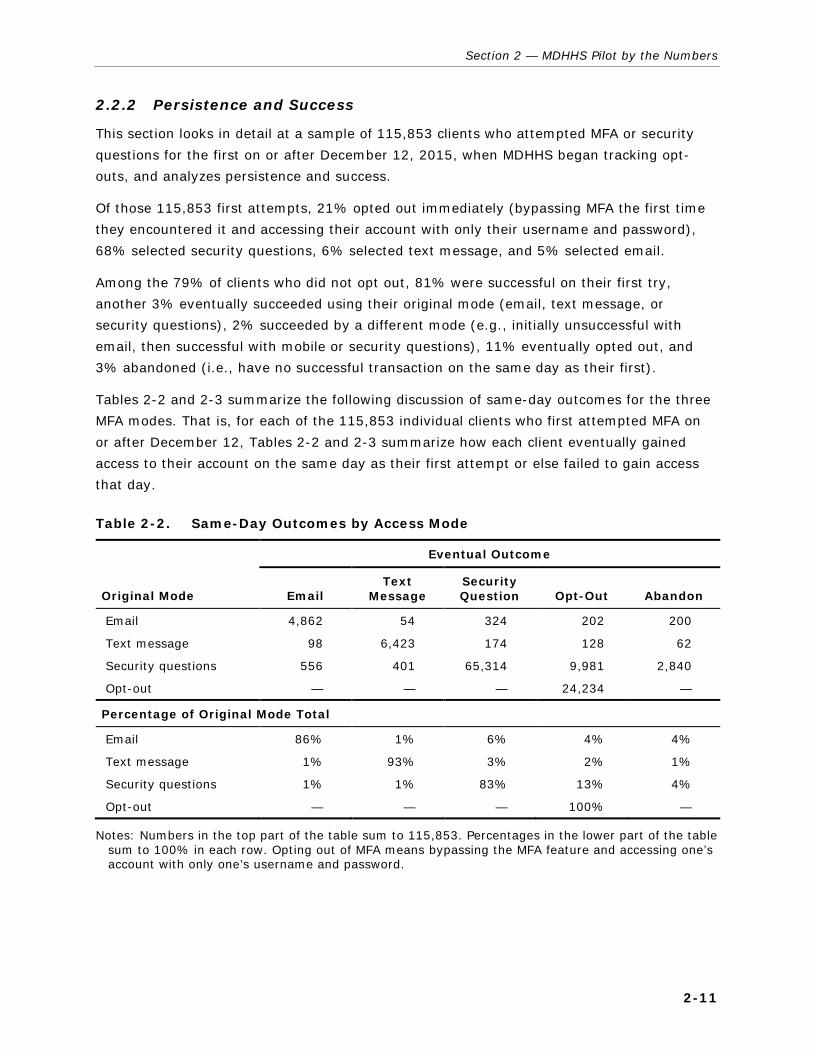
Tables 2-2 and 2-3 summarize the following discussion of same-day outcomes for the three MFA modes. That is, for each of the 115,853 individual clients who first attempted MFA on or after December 12, Tables 2-2 and 2-3 summarize how each client eventually gained access to their account on the same day as their first attempt or else failed to gain access that day.
Table 2-2. Same-Day Outcomes by Access Mode
Original Mode
Eventual Outcome
Email Text
Message Security Question Opt-Out Abandon
Email 4,862 54 324 202 200
Text message 98 6,423 174 128 62
Security questions 556 401 65,314 9,981 2,840
Opt-out — — — 24,234 —
Percentage of Original Mode Total
Email 86% 1% 6% 4% 4%
Text message 1% 93% 3% 2% 1%
Security questions 1% 1% 83% 13% 4%
Opt-out — — — 100% —
Notes: Numbers in the top part of the table sum to 115,853. Percentages in the lower part of the table sum to 100% in each row. Opting out of MFA means bypassing the MFA feature and accessing one’s account with only one’s username and password.

NSTIC State Government Pilot: Michigan Department of Health and Human Services
2-12
Table 2-3. First and Subsequent Same-Day Outcomes by Access Mode
Original Mode
Eventual Outcome in Subsequent Attempts
First Attempt Email
Text Message
Security Question Opt-Out Abandon
Email 4,508 354 54 324 202 200
Text message 6,239 98 184 174 128 62
Security questions 63,738 556 401 1,576 9,981 2,840
Opt-out 24,234 — — — — —
Percentage of Original Mode Totals: First Attempt and Subsequent
Email 80% 31% 5% 29% 18% 18%
Text message 91% 15% 28% 27% 20% 10%
Security questions 81% 4% 3% 10% 65% 18%
Opt-out 100% — — — — —
Notes: Numbers in the top part of the table sum to 115,853. Percentages in the lower right part of the table (not bolded) sum to 100% in each row. For example: 80% of clients who first attempted MFA using email succeeded on their first attempt; of the remainder who required two or more attempts, 31% eventually succeeded with email, 5% succeeded with text message, 29% succeeded with security questions, 18% opted out, and 18% abandoned.
Email. Among the 5% of clients who first elected email, 86% ultimately were successful with email, 1% eventually succeeded with text message, 6% succeeded with security questions, 4% eventually opted out, and 4% abandoned their attempt. Still among this email cohort, 80% were successful in their first attempt. Of the remainder who required two or more attempts, 31% eventually succeeded with email, 5% succeeded with text message, 29% succeeded with security questions, 18% opted out, and 18% abandoned.
Text Message. Among the 6% of clients who first elected text message, 93% ultimately succeeded with text message, 1% succeeded with email, 3% succeeded with security questions, 2% eventually opted out, and 1% abandoned their attempt. Still among this text message cohort, 91% were successful in their first attempt. Of the remainder who required two or more attempts, 28% ultimately succeeded with text message, 15% succeeded with email, 27% succeeded with security questions, 20% opted out, and 10% abandoned.
Security Questions. Among the 68% of clients who first elected security questions, 83% ultimately succeeded in answering security questions correctly, 1% succeeded with text message, 1% succeeded with email, 13% eventually opted out, and 4% abandoned their attempt. Still among this security-question cohort, 81% were successful in their first attempt. Of the remainder who required two or more attempts, 65% opted out, 18% abandoned, 10% eventually succeeded in answering security questions, 4% succeeded with email, and 3% succeeded with text message.

Section 2 — MDHHS Pilot by the Numbers
2-13
For security questions and to a lesser extent for email, but not for text message, success rates decline with the number of days since a client’s most recent MFA attempt (Table 2-4). It seems natural that this trend is seen with security questions, because people’s ability to remember the answers they created deteriorates over time. Perhaps the reason for a similar trend with email is related: if people are using email infrequently, their ability to remember their email password may be an issue. Success rates on the same day as the previous attempt tend to be lower because of clusters of failed attempts; one failed attempt is often followed by at least one more failure before a success.
Table 2-4. Success Rates by Time Elapsed Since Last Access Attempt
Days Since Most Recent Attempt Email Text Message Security Questions
0 72% 87% 84%
1 to 7 87% 94% 95%
8 to 14 85% 92% 88%
15 to 21 85% 93% 83%
More than 21 82% 93% 78%
Notes: For security questions especially, success rates fall as more time elapses since a client’s most recent attempt. Success rates on the same day as the previous attempt tend to be lower because of clusters of failed attempts.

3-1
3. PILOT IMPACTS: PROGRAM EFFICIENCY
The pilot delivered meaningful impacts in program efficiency that are in all likelihood attributable to the KBV functionality implemented by the MDHHS pilot. Section 3.1 presents analysis of month-level data, in which we estimate a statistically significant 8% reduction in the monthly backlog for the FAP. This impact is roughly consistent with a reduction in an applicant’s average waiting time of slightly more than 1 day. Section 3.2 presents analysis based on application-level data, in which we find similar results.
We find significant effects on processing time for three of the four other largest MDHHS benefits programs: MA, TANF, and CDC. (For reasons that will be explained, these effects are limited to the subset of applications processed within 2 weeks.) This implies a significant reduction in processing time for nearly half of all applications MDHHS receives across all programs. For FAP and MA, which together make up over 70% of applications (almost 60% of which are processed within 14 days), we attribute to the pilot a statistically significant reduction in average processing time of about 0.7 days.
It was important to analyze both month-level and application-level data. The month-level analysis compares the months of the pilot with prepilot months; the application-level analysis exploits differences, across days, in the fraction of online applications flagged as having been KBV verified. Therefore, the application-level analysis captures only part of the impact of the pilot: the effect of time saved on applications with a KBV pass. One hypothesized impact of having the KBV as part of the online application process is that applicants, perceiving a more robust screening process, will be motivated to provide more complete and accurate information. This tendency of applicants to change their behavior would operate independently of the number of applicants who passed the KBV on any given day, so it would not be reflected in the application-level analysis. It is therefore not inconsistent to have estimated a slightly smaller impact in application-level data. An estimated 0.7-day reduction in processing time for 60% of applications is within the confidence interval around our estimated 8% reduction (consistent with an across-the-board reduction in processing time of about 1 day) in month-end FAP backlogs; to the extent that the 0.7-day reduction is smaller, it does not necessarily indicate that the month-level analysis overstated the impact; rather, the difference could reflect the additional behavioral impact that would be captured in the month-level but not in the application-level analysis.
3.1 Reduced Application Backlog—Month-Level Analysis
We model the number of month-end pending FAP applications as a function of the volume of applications received during the month, Eligibility Specialist FTE staffing levels, and explanatory variables that capture the effect of the pilot.

NSTIC State Government Pilot: Michigan Department of Health and Human Services
3-2
The analysis is based on monthly data and controls for the volume of new applications received and Eligibility Specialist staffing levels. Specifically, this analysis is based on standard monthly reports, for January 2013 through August 2015, which summarize the volume of new applications received and the number of applications pending at month end. Eligibility Specialist FTE data come from MDHHS Legislative Reports, Bi-Monthly Report on FTE Counts.12
We have 64 observations for 32 months. For each month, from January 2013 through August 2015, we have two observations: one for Cash FAP and one for Non-Cash FAP. Separate intercepts were estimated to account for the difference in the sizes of the two programs. Non-Cash FAP is considerably larger, receiving an average of around 35,000 applications per month in 2015 compared with around 5,000 for Cash FAP (excluding expedited FAP applications).
We estimate that the impact of the pilot has been to reduce the number of month-end pending applications by a statistically significant 8%, after controlling for the volume of applications received and Eligibility Specialist staffing levels. The size of the estimated effect is roughly consistent across four different model specifications. The effect is statistically significant in each of the four ordinary least squares (OLS) regression models: estimated probabilities that the effect of the pilot was not in fact favorable for these two programs ranged from 0.9% to 2.6%. Results of the four regression models are summarized in Table 3-1.
3.1.1 Regression Results (Technical Detail)
Models 1 and 2 include a time trend (t, equal to 1 for January 2013 and iterating to 32 for August 2015). The estimated coefficient on t is not significantly different from zero in either model, and omitting t in Models 3 and 4 does not significantly change the estimated impact of the pilot. All models include a dummy variable, Cash, to account for the difference in the sizes of Cash FAP and Non-Cash FAP.
Models 1 and 3 estimate the effect of the pilot with a dummy variable, Pilot, equal to 1 for the 8 months of the pilot and equal to 0 for the 24 months before the pilot. Because the dependent variable is the natural log of the number of applications pending at month’s end, the estimated slope coefficient on Pilot is the proportional change in the backlog; controlling for the volume of applications and FTE level, the number of pending applications at month’s end is 8.3% lower (Model 1) or 9.0% lower (Model 3) under the pilot.
In Models 2 and 4, we modeled the effect of the pilot as a difference in the effect of application volume on backlogs, estimating that the pilot slightly reduces the percentage change in backlogs in response to a given percentage change in application volume. This
12 These reports are available at http://www.michigan.gov/dhs/0,4562,7-124-5459_61179_8368---
,00.html.

Section 3 — Pilot Impacts: Program Efficiency
3-3
model is attractive because we would expect the pilot to reduce the time required to process each application so that the effect should work through the relationship between the volume of applications and the backlog.
Table 3-1. Summary of OLS Regression Results, Month-Level Application Backlog
Variable Model 1 Model 2 Model 3 Model 4
Month, t –.0050 (.0036) –0.0049 (.0035) — —
Applications 0.801 (.108) 0.801 (.105) 0.786 (.108) 0.786 (.105)
Staff FTE –2.202 (.576) –2.238 (.569) –1.521 (.306) –1.566 (.298)
Cash (1 or 0) –0.463 (.204) –0.469 (.201) –0.492 (.205) –0.496 (.201)
Pilot (1 or 0) –0.083 (.042) — –0.090 (.042) —
Pilot × Applications — –0.0097 (.0042) — –0.0103 (.0043)
Constant 18.95 (4.88) 19.25 (4.80) 13.62 (3.04) 13.98 (2.94)
Percentage change in backlog attributable to pilot
–8.3% –8.2% –9.0% –8.6%
(95% CI) (–16.7%, 0.03%) (–15.5%, –1.00%) (–17.3%, –0.64%) (–16.0%, –1.55%)
Significance level (probability that attributable change is not negative)
0.026 0.013 0.018 0.009
More than 21 64 64 64 64
Notes: Standard errors are in parentheses next to estimates of regression coefficients; 95% confidence intervals (95% CI) are provided for the percentage change in backlog attributable to the pilot. The dependent variable is the natural log of the number of applications pending at month’s end. The independent variables Applications and FTE are also in natural logs, so that the estimated coefficients are elasticities. For Model 1, for example, a 1% increase in the volume of applications leads to a 0.801% increase in the month-end backlog, and a 1% increase in FTE leads to 2.202% decrease in month-end backlog.
The closeness of the estimated impacts in Models 3 and 4 and in Models 1 and 2 gives some assurance that the impact is in fact attributable to the pilot and not to some other factor that coincided with the pilot for which we cannot control.
For Models 2 and 4, the percentage change in the backlog attributable to the pilot was calculated by using the model to predict the backlog for a typical month, first with Pilot equal to 0 (and therefore with Pilot × Applications equal to 0) and then with Pilot equal to 1 (and therefore with Pilot × Applications equal to Applications). For example, average FTE in 2015 is 2,598, and new applications for Cash FAP in 2015 averaged 5,103 per month. Using Model 4, we can predict the month-end backlog as follows:

NSTIC State Government Pilot: Michigan Department of Health and Human Services
3-4
Without the pilot, we would have expected the backlog to be 2,645.7 in a typical month:
exp{0.7863 ln(5,103) − 1.5658 ln(2,598) + 13.975 − 0.4963} = 2,645.7.
With the pilot, the predicted backlog in a typical month is 2,423:
exp{(0.7863 − 0.0103) ln(5,103) − 1.5658 ln(2,598) + 13.975 − 0.4963} = 2,423.0.
The difference attributed to the pilot is 223 fewer pending applications, or 8.79% (note that the percentage change is calculated using the average of 2,645.7 and 2,423.0 as the base):
2(2,423.0 − 2,645.7) (2,645.7 + 2,423.0)⁄ = −0.0879.
To discuss the estimated impact in round numbers, we use the 8% figure. Although Models 3 and 4 give slightly higher estimates, an 8% reduction in application backlogs is certainly defensible under any of the four models.
3.1.2 Discussion and Limitations
For both Cash and Non-Cash FAP, the average month-end backlog is roughly half the number of applications disposed during the month. Therefore, the average waiting time for benefits can be approximated as roughly half a month. Reducing the backlog by 8% would, by the same rough approximation, translate into the same 8% reduction in waiting time, an average reduction of a little more than one day. This may be a small benefit to each applicant, but, multiplied by the number of eligible applicants (in July 2015, for instance, MDHHS approved 3,074 applications for Cash FAP and 21,939 applications for Non-Cash FAP, excluding expedited applications), this would seem to represent a meaningful aggregate benefit.
The impact on waiting time attributable to the pilot has to be coming from a reduction in the average time required to process applications, and additional benefits are associated with these efficiencies, although they are difficult to quantify with the data available. Eligibility Specialist FTE effort is an imperfect measure of the effort directed to processing FAP applications. Eligibility Specialists process other types of applications in addition to FAP, and other types of staff are involved in processing FAP applications. Still, we can get some rough sense of the efficiency impact by dividing the pilot’s impact on backlog by that of FTE:
Using Model 4, a 1% increase in FTE results in a 1.566% reduction in backlogs. The pilot is therefore equivalent to a 5.6% increase in FTE (because 8.8 divided by 1.566 equals 5.62).
Using Model 2, the pilot is equivalent to a 3.7% increase in FTE (because 8.2 divided by 2.238 equals 3.66), or roughly 95 FTE.
One way to look at this is that over the months of the pilot, MDHHS and its clients in effect had the benefit of an additional 95 Eligibility Specialist FTEs. In addition to the reduction in

Section 3 — Pilot Impacts: Program Efficiency
3-5
average waiting time, applicants may also have benefitted from improved customer service as staff, relieved of some of the administrative burden of processing applications, were able to devote more of their attention and energy to providing client service (e.g., connecting clients with community organizations and other resources; helping them to find child care and opportunities for education, training, and employment). Realizing these benefits does not require any additional policy action on the part of MDHHS; with a given level of Eligibility Specialist FTEs, the benefits of reduced waiting time and improved customer service would already have been realized under the pilot.
The estimate of 95 FTEs needs to be interpreted with some caution and awareness of the limitations of the model. Our model looks only at the pilot’s effect on backlogs for nonexpedited FAP. This is appropriate under the assumption that processing (nonexpedited) FAP applications is most likely to be delayed (while other types of applications are prioritized) when intake capacity is strained. Under this assumption, the change observed in the FAP backlog reflects efficiencies in processing other types of applications, and the back-of-the-envelope calculation of the equivalent increase in all Eligibility Specialist FTEs seems reasonable. However, and even if this assumption is sensible, this analysis was not designed to robustly measure the FTE-equivalent effect of the pilot; for one thing, data on Eligibility Specialist FTEs were available only bimonthly (or quarterly for some periods), so we do not have a detailed accounting of how Eligibility Specialist staff members allocate their time, and we do not have a detailed accounting of other (non-Eligibility Specialist) staff time that also contributes to processing FAP applications. The results should be understood with these limitations in mind.
This analysis has two limitations that must be kept in mind, though they are somewhat mitigated by the application-level analysis we conducted in Section 3.2. First, we have not necessarily identified the sole effect of the pilot. Other factors, unaccounted for in the models and unrelated to the pilot, may have contributed to smaller FAP backlogs in the first 8 months of 2015, in which case our estimates would overstate the impact of the pilot. It is also possible that factors unrelated to the pilot could have tended to increase FAP backlogs in 2015, in which case our estimates would understate the true impact of the pilot.13 The closeness of the estimated impacts in Models 3 and 4 and in Models 1 and 2 mitigates this concern somewhat. Recall that in Models 2 and 4, the estimated impact of the pilot works through the effect of application volume on backlogs, reducing the marginal impact of application volume on month-end backlog as is consistent with faster processing. Still, factors coincident with but unrelated to the pilot could have also had such an effect.
Second, with only 32 months of data, the statistical significance of our results is marginal. Setting aside the first limitation, we are saying that the probability of the pilot having zero 13 We suspect that something like this is going on with medical assistance programs; adding 32 MA
observations to our regression models destroyed the results, and running the four models with only the 32 MA observations yields positive coefficients on Pilot and (Pilot × Applications).

NSTIC State Government Pilot: Michigan Department of Health and Human Services
3-6
or unfavorable impact on backlogs is less than 3% in all four models (ranging from 2.6% in Model 1 to 0.9% in Model 4). However, we would like to be able to say with confidence that the pilot had an economically meaningful effect for MDHHS and its clients, and while our estimate of an 8% reduction is statistically different from zero reduction, it is not statistically different from, say, a 4% reduction. The most optimistic model is Model 4, for which the lower bound on a 95% CI on the percentage change in backlog attributable to the pilot is –1.55% (i.e., with Model 4, we estimated a 2.5% chance that the pilot reduced backlog by less than 1.55%).
Both of these concerns are mitigated by the supplementary analysis of application-level data presented in Section 3.2, in which we find quantitatively similar results.
3.2 Reduced Waiting Time for Applicants for Public Assistance—Application-Level Analysis
In a survival (or time-to-event) analysis of MDHHS benefits applications, we find a statistically significant relationship in four of the five largest MDHHS programs between the fraction of online applications that are KBV verified and the processing speed of applications received on a given day.
A higher KBV-verified rate is associated with faster processing for MA, FAP, TANF, and CDC. Only SER showed no significant relationship, and for this program there may be little opportunity for reducing processing times; already 99% of applications are processed within 14 days (Table 3-2).
The data come from two sources. The primary data source is application-level data from the Bridges data warehouse (MH), including program (type of benefit), application date, status date (date the application was approved or denied), and status (approved or denied) for all applications (not only those submitted online). Data on KBV results for online applications come from MI Bridges. MH and MI Bridges data were not merged at the application level. Instead, MI Bridges data were collapsed by application date and program, taking the average KBV-verified rate for applications of a given type received on a given day. These KBV-verified rates were then attached to the MH data. Thus, all applications having the same program and application date have the same KBV-verified rate. Because many if not most online applications submitted on Saturday or Sunday (or a holiday) receive an MH application date on the following Monday, the ideal way to attach KBV-verified rates to Monday applications is not obvious. To make matters simple, the main results omit Mondays. Similar results were obtained with Mondays included, with KBV attached in either of two different ways.
The main analysis of each program is based on the subset of applications processed within 14 days. Results lose significance when applications taking longer than two weeks are included. Presumably, this is because a subset of applications will take a longer time to

Section 3 — Pilot Impacts: Program Efficiency
3-7
process for reasons we cannot observe (they may have been submitted with less complete information, been more complex, or included information that triggered a referral to the Office of the Inspector General [OIG]), and for these applications, the KBV result matters less or not at all. By restricting the analysis to applications processed within 14 days, we are focusing on a subset of more straightforward applications for which the KBV result is more likely to matter.
The main analysis includes 32 days of applications, Tuesdays through Fridays, from July 7 to August 28, 2015. Similar results can be obtained with more weeks, or fewer, but effect size and statistical significance attenuates when many more weeks are included. The probable reason is that much of the useful variation in KBV-verified rate in our data is the result of a technical fix implemented by MDHHS on August 16, 2015. KBV-verified rates increased by 12% to 15% (depending on the program) after the fix. As more weeks prior to the fix are included, more sources of variability in processing time for which we cannot control obscure the effect of the KBV that we are trying to measure. Including fewer weeks throws away days (and so throws away useful variability in KBV-verified rate). Eight weeks does not give the largest estimates of KBV impacts (larger and smaller estimates for each program can be obtained for different subsets of the data) but seems to strike a reasonable compromise between including enough variability in KBV-verified rate and including too much unobserved variability in other factors.
Table 3-2 summarizes the main results for the five largest MDHHS programs, listing the impact attributed to the pilot in terms of reduced waiting time (in days). The smallest impact (pre-August 15) is the estimated difference between a KBV-verified rate of zero (i.e., no KBV quiz) and the average KBV-verified rate for the program from July 7 to August 15. The second impact (post-August 15) is the estimated difference between zero and the higher KBV-verified rate realized after August 15. The highest impact (100% KBV verified) is the difference between a zero and 100% KBV-verified rate, in other words, the estimated difference in waiting time between a situation with no KBV and a situation in which all online applicants have been KBV verified. These five programs represent 96% of all applications received by MDHHS over the 32 days in our sample; MA makes up 44%, FAP 30%, SER and TANF each 9%, and CDC makes up 4%. The KBV had a significant effect on processing time for MA, FAP, TANF, and CDC applications processed within 14 days, a group which covers 48% of all applications received by MDHHS in our 32-day sample.
Note that Table 3-2 extrapolates KBV-verified rates to zero and 100%, which are outside the range observed in our data. For MA applications approved within 14 days, increasing the KBV-verified rate from 45.5% to 58.1% was associated with a reduction in expected waiting time from 1.43 to 1.26 days. For FAP applications approved within 14 days, increasing the KBV-verified rate from 52.5% to 67.4% was associated with a reduction in expected waiting

NSTIC State Government Pilot: Michigan Department of Health and Human Services
3-8
Table 3-2. Summary of Reduced Waiting Time Estimates, Application-Level Data
Program
Reduced Waiting Time (Days)
% Processed within 14 Days Pre-August 15 Post-August 15
100% KBV Verified
MA—Approved 0.7 0.9 1.3 77%
MA—Denied 1.2 1.5 2.4 40%
FAP—Approved 0.7 0.9 1.4 70%
FAP—Denied 0.8 1.0 1.5 35%
TANF—Approved 1.4 1.7 2.4 34%
TANF—Denied 1.4 1.7 2.4 53%
CDC—Approved 1.0 1.2 1.5 32%
CDC—Denied 1.1 1.4 1.8 42%
SER—Approved N.S. N.S. N.S. 99%
SER—Denied N.S. N.S. N.S. 99%
Notes: Reduced waiting time for MA is based on the estimated hazard function for the Healthy Michigan Plan, the largest MA program, representing 47% of applications in our 32-day sample. Estimated impacts for the second-largest program, Low Income Families, which represented another 24% of MA applications were similar (0.8, 0.9, and 1.4 for approved; 1.1, 1.4, and 2.3 for denied). All estimates are based on the hazard function for applications received on a Tuesday. The effect of the KBV was not significant (N.S.) for SER.
time from 4.06 to 3.86 days. Extrapolating to a KBV pass rate of zero, the wait for FAP approvals would be 4.8 days; extrapolating to 100%, the wait would be 3.43 days.
3.2.1 Survival Models and Results (Technical Detail)
The results presented were obtained from Cox Proportional Hazards models for each of the MDHHS programs (stcox in Stata software). Stata calculates a separate hazard function for each stratum in the sample (for instance, our data were stratified by the day of the week an application was received, status [whether the application was approved or denied], and MA subprogram), then calculates the effect of each explanatory variable on that hazard function, assuming that these effects remain the same over time. This would mean for instance that, if we were to take two otherwise similar applications, one submitted on a day with a 67.4% KBV-verified rate and the other on a day with a 52.5% KBV-verified rate, if the first were 5% more likely to be resolved on the first day, it would also be 5% more likely to be resolved on the second day (provided both were still unresolved after the first day), 5% more likely to be resolved on the third day (provided both were still unresolved after the second day), etc.
Proportional Hazards. The assumption of proportional hazards is reasonable in our data, except on day 14 when (by construction) every observation has a hazard rate of 1 (i.e., the probability of being resolved on day 14, conditional on being unresolved after day 13, is

Section 3 — Pilot Impacts: Program Efficiency
3-9
100%). Because the hazard rate is the same for everyone on day 14, the hazard ratio is also 1. This will tend to bias our estimated hazard ratios slightly toward 1 (i.e., toward a covariate having no effect). This tends to make our estimates of the KBV effect somewhat more conservative than they would otherwise be, a shortcoming we are willing to accept. Dropping the assumption of proportional hazards and estimating the same models using streg (which assumes a parametric distribution for the hazard function) gave similar results.
Robust Standard Errors. Errors are likely to be correlated for applications received on the same day. We therefore clustered on application date (in Stata using the vce cluster option) to produce standard errors that are robust to this kind of heteroscedasticity. The vce cluster option adjusts the standard errors on the estimated effects of explanatory variables upward (usually, and certainly in our case), making it more difficult to reject the null hypothesis that a variable (like KBV) had no effect.
Efron Method for Ties. When multiple observations “fail” (i.e., when multiple applications are resolved) at the same time, Stata calculations are based on certain assumptions. When there are a lot of ties, those assumptions matter for the results. We have many thousands of observations spread over 11 possible dates (0 to 14 days, minus two Saturdays and two Sundays), so we have a lot of ties. Although it is slightly slower when used together with the vce cluster option, the Efron method for dealing with ties is more accurate; therefore, we used it.
Table 3-3 provides results of the main models for each of the four MDHHS programs.
Table 3-3. Summary of Survival Model Results
stcox Hazard Ratios
Program
MA FAP TANF CDC
KBV 1.71 (1.04, 2.80) 1.41 (1.13, 1.76) 1.84 (1.38, 2.45) 1.50 (1.00, 2.25)
Benefits 0.944 (0.929,
0.959) 0.952 (0.944,
0.960) 1.033 (1.014,
1.053) 1.015 (0.994,
1.036)
MA_Big 0.86 (0.80, 0.93) — — —
# of applications 64,205 43,454 10,148 4,026
# of days 32 32 32 32
Stratified by:
Status Y Y Y Y
Day of week Y Y Y Y
MA program Y — — —
Notes: Stata proportional hazards (stcox); Efron method for ties. Hazard ratios are reported for KBV, benefits, and MA_Big with 95% CIs in parentheses (based on robust standard errors generated using the vce option in Stata, clustering on the date the application was received).

NSTIC State Government Pilot: Michigan Department of Health and Human Services
3-10
KBV is the KBV-verified rate on the day the application was received. Benefits is the number of benefits included in the application. MA_Big indexes the volume of MA applications on a given day; it is the number of MA applications minus the average number for that day of the week, divided by the standard deviation (e.g., for an application received on a Tuesday when the volume of MA applications was half a standard deviation higher than the Tuesday average, MA_Big = 0.5). Analogous measures of application volume for the other programs did not have significant effects in those models and so were left out.
Hazard ratios are interpreted as follows, using FAP as the example: Take two otherwise similar applications, one submitted on a day when every application had a passed KBV (100% pass rate) and another submitted on a day when no one passed KBV; then, conditional on neither application having been resolved by the end of day T, the first application is 1.41 times more likely to be resolved by the end of day T+1. As discussed above, 0 and 100% KBV-verified rates are outside the range of our data. Comparing an application from a 67.4% day (typical of post-August 2015) to one from a 52.5% day (typical of pre-August 2015), the hazard ratio is about 1.05.
Reduced waiting times (in days), presented in Table 3-2, were calculated as the difference between the predicted waiting times (probability-weighted average of the number of days between 0 and 14 that a person may wait) based on the predicted hazard functions from the model for each program.
3.2.2 Robustness Checks (Technical Detail)
This section provides the results of several robustness checks, using the FAP results. Results are shown controlling for application volume, using different cutoffs for waiting time, including different numbers of weeks, and using parametric survival models (streg) instead of proportional hazards (stcox).
Controls for Application Volume. Controlling for the volume of applications for the two largest programs does not significantly change the estimated effect of KBV. Application volumes do not have a statistically significant effect on waiting time (Table 3-4).
Waiting Time Cutoff. The main analysis of each program is based on the subset of applications processed within 14 days. Results lose significance when applications taking longer than 2 weeks to process are included. Among applications taking 15 to 28 days to process, neither KBV nor benefits has a significant effect. The reason, presumably, is that a subset of applications will take a longer time to process for reasons we cannot observe (they may have been submitted with less complete information, been more complex, or included information that triggered a Front-End Eligibility [FEE] referral), and for these applications, the KBV result matters less or not at all. By restricting the analysis to applications processed within 14 days, we are focusing on a subset of more straightforward

Section 3 — Pilot Impacts: Program Efficiency
3-11
applications for which the KBV result is more likely to matter. Table 3-5 shows the results for different cutoffs.
Table 3-4. FAP: Controls for Application Volume
stcox Hazard Ratios
Model Alternative
Main FAP_Big MA_Big Both
KBV 1.41 (1.13, 1.76) 1.48 (1.20, 1.82) 1.45 (1.14, 1.86) 1.50 (1.19, 1.88)
Benefits 0.952 (0.944,
0.960) 0.952 (0.944,
0.961) 0.952 (0.944,
0.961) 0.953 (0.944,
0.961)
FAP_Big — 1.013 (0.998,
1.027) — 1.011 (0.997,
1.025)
MA_Big — — 0.987 (0.967,
1.008) 0.991 (0.970,
1.013)
# of applications 43,454 43,454 43,454 43,454
# of days 32 32 32 32
Stratified by:
Status Y Y Y Y
Day of week Y Y Y Y
Notes: 95% CIs, in parentheses, based on robust standard errors obtained using the vce option, clustering on application date. An estimated effect is statistically significant if its confidence interval does not span 1.
Table 3-5. FAP: Robustness to Waiting Time Cutoff
stcox Hazard Ratios
Model Alternative
Main (≤14 days)
Processed ≤7 days
Processed ≤21 days
>14 days and ≤28 days
KBV 1.41 (1.13, 1.76) 1.29 (1.10, 1.51) 0.99 (0.69, 1.41) 0.89 (0.67, 1.20)
Benefits 0.952 (0.944,
0.960) 0.959 (0.949,
0.970) 0.951 (0.944,
0.958) 1.00 (0.99, 1.01)
# of applications 43,454 32,831 54,067 23,299
# of days 32 32 32 32
Stratified by:
Status Y Y Y Y
Day of week Y Y Y Y
Notes: 95% CIs in parentheses, based on robust standard errors, clustering on application date.
Weeks Included. The main analysis includes 32 days of applications, Tuesdays through Fridays, from July 7 to August 28, 2015, 6 weeks before and 2 weeks after the August 16 technical fix that gives us much of the useful variation in KBV pass rates. Similar results are

NSTIC State Government Pilot: Michigan Department of Health and Human Services
3-12
obtained when the last 6 or 4 of these 8 weeks are included. When only the week before and the week after the fix are included, the estimated KBV effect is larger and more significant (Table 3-6). As additional weeks prior to the fix are included, effect size and statistical significance attenuate as more sources of variability in processing time for which we cannot control obscure the effect of the KBV that we are trying to measure (Table 3-7).
Table 3-6. FAP: Robustness to Fewer Weeks Included
stcox Hazard Ratios
Model Alternative
Main (weeks 27–34)
Weeks 29–34
Weeks 31–34
Weeks 32–33
KBV 1.41 (1.13, 1.76) 1.48 (1.18, 1.87) 1.42 (1.13, 1.78) 1.76 (1.54, 2.02)
Benefits 0.952 (0.944,
0.960) 0.953 (0.942,
0.963) 0.953 (0.940,
0.966) 0.951 (0.932,
0.970)
# of applications 43,454 31,459 21,686 11,252
# of days 32 24 16 8
Stratified by:
Status Y Y Y Y
Day of week Y Y Y Y
Notes: 95% CIs in parentheses, based on robust standard errors, clustering on application date.
Table 3-7. FAP: Robustness to Additional Weeks Included
stcox Hazard Ratios
Model Alternative
Weeks 25–34
Weeks 24–34
Weeks 23–34
Weeks 22–34
KBV 1.37 (1.07, 1.76) 1.26 (0.96, 1.66) 1.27 (0.98, 1.65) 1.33 (1.02, 1.73)
Benefits 0.955 (0.945,
0.962) 0.953 (0.946,
0.961) 0.956 (0.948,
0.963) 0.957 (0.950,
0.965)
# of applications 51,866 56,947 62,467 67,647
# of days 39 43 47 51
Stratified by:
Status Y Y Y Y
Day of week Y Y Y Y
Notes: 95% CIs in parentheses, based on robust standard errors, clustering on application date.
Proportional Hazards. The assumption of proportional hazards is reasonable in our data, except on day 14 when (by construction) every observation has a hazard rate of 1 (i.e., the chance of being resolved on day 14, conditional on being unresolved after day 13, is 100%). Because the hazard rate is the same for everyone on day 14, the hazard ratio is also 1. This

Section 3 — Pilot Impacts: Program Efficiency
3-13
will tend to bias our estimated hazard ratios slightly toward 1 (i.e., toward a covariate having no effect), having the effect of making our estimates of the KBV effect somewhat more conservative than they would otherwise be. Dropping the assumption of proportional hazards and estimating the same models using streg (which assumes a parametric distribution for the hazard function) gives similar results.
Tables 3-8 and 3-9 compare stcox with streg using the Weibull distribution. The KBV effect is slightly larger and statistically more significant using streg. However, the best stcox model is not directly comparable to a streg model because it stratifies by both status and day of the week; only one stratification variable is allowed with streg. Larger values of model log likelihood [LL(model)] and smaller values of Bayesian and Akaike information criteria indicate a better model fit.
Table 3-8. FAP: Robustness to Model Specification: Means of Controlling for Approval Status and Day of Week (Fixed Effects versus Stratification), and Proportional Hazards Assumption under Fixed Effects
stcox and streg Hazard Ratios
Model Alternative
stcox (z, Pr > |z|)
stcox (z, Pr > |z|)
stcox (z, Pr > |z|)
Weibull (z, Pr > |z|)
KBV 1.412 (3.07, 0.002)
1.411 (3.09, 0.002)
1.504 (4.02, <0.001)
1.606 (5.08, <0.001)
Benefits 0.9522 (–11.19, <0.001)
0.9519 (–11.16, <0.001)
0.9524 (–10.56, <0.001)
0.9529 (–13.49, <0.001)
Status = Approved
— 1.297 (15.36, <0.001)
1.303 (15.93, <0.001)
1.247 (15.60, <0.001)
D_DayOfWeek — — Y Y
# of applications 43,454 43,454 43,454 43,454
# of days 32 32 32 32
Stratified by:
Status Y — — —
Day of week Y Y — —
LL(null) –338,393 –360,644 –420,617 –74,587
LL(model) –338,332 –360,321 –420,221 –74,164
Akaike IC 676,668 720,648 840,454 148,345
Bayesian IC 676,685 720,674 840,506 148,414
Notes: The z statistics (in parentheses with associated p-values) are based on robust standard errors, clustering on application date.

NSTIC State Government Pilot: Michigan Department of Health and Human Services
3-14
Table 3-9. FAP: Robustness to Model Specification: Proportional Hazards Assumption when Controlling for Day of Week with Fixed Effects or Stratification
stcox and streg Log Relative Hazard Coeff.
Model Alternative
stcox (z, Pr > |z|)
stcox (z, Pr > |z|)
Weibull (z, Pr > |z|)
Weibull (z, Pr > |z|)
KBV 0.3444 (3.09, 0.002)
0.4080 (4.02, <0.001)
0.4625 (4.97, <0.001)
0.4740 (5.08, <0.001)
Benefits –0.0493 (–11.16, <0.001)
–0.0487 (–10.56, <0.001)
–0.0486 (–13.59, <0.001)
–0.0483 (–13.49, <0.001)
Status = Approved
0.2599 (15.36, <0.001)
0.2646 (15.93, <0.001)
0.2195 (15.44, <0.001)
0.2207 (15.60, <0.001)
D_DayOfWeek — Y — Y
# of applications 43,454 43,454 43,454 43,454
# of days 32 32 32 32
Stratified by:
Day of week Y — Y —
LL(null) –360,644 –420,617 –74,551 –74,587
LL(model) –360,321 –420,221 –74,000 –74,164
Akaike IC 720,648 840,454 148,021 148,345
Bayesian IC 720,674 840,506 148,116 148,414
Notes: The z statistics (in parentheses with associated p-values) are based on robust standard errors, clustering on application date.
Tables 3-10 and 3-11 compare different distributions in streg. The Weibull model is unambiguously the best, having the largest log likelihood, smallest Bayesian information criterion, and smallest Akaike information criterion.

Section 3 — Pilot Impacts: Program Efficiency
3-15
Table 3-10. FAP: Robustness to Model Specification: Distributional Assumptions I
stcox and streg Log Relative Hazard Coeff.
Model Alternative
stcox (z, Pr > |z|)
Weibull (z, Pr > |z|)
exponential (z, Pr > |z|)
Gompertz (z, Pr > |z|)
KBV 0.3444 (3.09, 0.002)
0.4625 (4.97, <0.001)
0.5030 (4.94, <0.001)
0.4997 (4.52, <0.001)
Benefits –0.0493 (–11.16, <0.001)
–0.0486 (–13.59, <0.001)
–0.0513 (–13.15, <0.001)
–0.0538 (–13.13, <0.001)
Status = Approved
0.2599 (15.36, <0.001)
0.2195 (15.44, <0.001)
0.2378 (14.99, <0.001)
0.2514 (15.27, <0.001)
# of applications 43,454 43,454 43,454 43,454
# of days 32 32 32 32
Stratified by:
Day of week Y Y Y Y
LL(null) –360,644 –74,551 –75,009 –74,841
LL(model) –360,321 –74,000 –74,531 –74,043
Akaike IC 720,648 148,021 149,076 148,109
Bayesian IC 720,674 148,116 149,137 148,204
Notes: The z statistics are based on robust standard errors, clustering on application date.
Table 3-11. FAP: Robustness to Model Specification: Distributional Assumptions II
Accelerated Failure Time Coefficients
Model Alternative
Weibull (z, Pr > |z|)
log normal (z, Pr > |z|)
log logistic (z, Pr > |z|)
exponential (z, Pr > |z|)
KBV –0.4909 (–4.51, <0.001)
–0.7726 (–5.78, <0.001)
–0.7986 (–5.05, <0.001)
–0.5030 (–4.94, <0.001)
Benefits 0.0529 (13.09, <0.001)
0.0781 (13.12, <0.001)
0.0840 (13.23, <0.001)
0.0513 (13.15, <0.001)
Status = Approved
–0.2385 (–13.67, <0.001)
–0.3110 (–13.82, <0.001)
–0.3279 (–12.11, <0.001)
–0.2378 (–14.99, <0.001)
# of applications 43,454 43,454 43,454 43,454
# of days 32 32 32 32
Stratified by:
Day of week Y Y Y Y
LL(null) –74,514 –77,742 –79,202 –75,009
LL(model) –74,006 –77,271 –78,482 –74,531
Akaike IC 148,033 154,565 156,986 149,076
Bayesian IC 148,128 154,660 157,081 149,137
Notes: The z statistics are based on robust standard errors, clustering on application date.

4-1
4. PILOT IMPACTS: PROGRAM INTEGRITY
The Office of the Inspector General (OIG) is the criminal justice agency responsible for maintaining the integrity of MDHHS programs by detecting fraud and deterring attempted fraud. A key component of OIG’s efforts is the Front-End Eligibility (FEE) program. A FEE referral—requesting a pre-eligibility investigation by an OIG agent—may be initiated by MDHHS eligibility staff when applications or re-certifications for public assistance contain suspicious or error prone information. FEE agents investigate and substantiate or refute discrepancies and suspicious activities within ten working days.
FEE investigations may also be initiated by OIG. These OIG-generated FEE referrals are focused primarily on individuals who are already receiving public assistance. OIG has indicated that, because these particular investigations do not involve applications, they would not be affected by the pilot.
The KBV could potentially enhance OIG’s ability to detect and deter fraud by imposing an additional barrier to bad actors appearing as new applicants. Bad actors may be less able to correctly answer enough questions to pass the four-question KBV quiz.
Because the KBV quiz is an optional part of the online application process, its role in deterring bad actors would be rather indirect. Bad actors who know that they are unlikely to pass the KBV quiz may still apply online, opting not to take the KBV quiz, or they may submit a paper application. Or they may apply online, take the quiz, and accept the risk of failing. Recall that failing the KBV quiz subjects the applicant only to the same level of scrutiny that every applicant would have received before the pilot.
One concern would be that bad actors in some cases may be able to pass a KBV quiz as easily as someone applying in good faith. There may, for instance, be reason to expect that a bad actor would be more likely to receive diversionary questions, and we have seen in Section 2.1.4 that quizzes with at least one diversionary question are passed at higher rates (Figure 2-4).
Also worth noting is that misrepresented identity is seldom the issue when an application is denied after completion of an FEE investigation. According to figures provided by OIG, misrepresented identity is an issue in less than 2% of cases where an FEE investigation leads to benefits being denied.
Between 84% and 96% of FEE investigations involve FAP, which generates the highest rate of FEE referrals of any MDHHS program. The number of FAP FEE referrals denied monthly is on average between 4% and 5% of the number of new FAP applications approved. The number of FAP FEE referrals denied annually is typically less than 2% of the average FAP caseload (i.e., the number of cases receiving FAP benefits).

NSTIC State Government Pilot: Michigan Department of Health and Human Services
4-2
Based on data provided by OIG, we can detect no changes, either favorable or unfavorable, in patterns of FEE referrals. The rate at which applications are referred to OIG for FEE investigation does not appear to have changed significantly since the beginning of the pilot. The rate at which referred FEE referrals lead to approvals is lower under the pilot compared with the 24 months prior to the start of the pilot. However, this seems to be a continuation of a trend that began in late 2013 or early in 2014, so attribution to the pilot is unclear (Figure 4-1). Cost avoided per FEE investigation follows a pattern similar to that of FEE approval rate; a trend of improvement beginning in early 2014 continues into 2015 (Figure 4-2).
Figure 4-1. FEE Approval Rates
Notes: Improvements in approval rates beginning in late 2013 or early 2014 continue in 2015.
-
0.100
0.200
0.300
0.400
0.500
0.600
0.700
Appr
oval
Rat
e
FAP FEE Approval Rate Non-FAP FEE Approval Rate
2013 2013 2014 2014 2015

Section 4 — Pilot Impacts: Program Integrity
4-3
Figure 4-2. Cost Avoided per FEE Investigation
Notes: Improvements in cost avoidance follow a trend similar to approvals. Improvements beginning in late 2013 or early 2014 continue in 2015.
OIG has indicated that the improvement in the FEE approval rate is likely driven by OIG-generated FEE referrals, which are not affected by the pilot. These referrals are made in bulk, and lessons learned from one batch are applied to the next to improve outcomes. OIG has indicated that it has observed no impact on fraud that can be identified as a result of the pilot.
Having heard these comments from OIG and having found nothing in the data to contradict them, we are comfortable that the program efficiency improvements described in Section 3 did not come at the cost of program integrity.
-
100.00
200.00
300.00
400.00
500.00
600.00
- 20.00 40.00 60.00 80.00
100.00 120.00 140.00 160.00 180.00
Non
-FAP
Cos
t Avo
ided
($)
FAP
Cost
Avo
ided
($)
FAP Cost Avoided per Investigation Non-FAP Cost Avoided per Investigation
2013 2013 2014 2014 2015

5-1
5. MI BRIDGES APPLICANT SURVEY
This section summarizes results of a survey of 20,446 MI Bridges applicants who had the opportunity to answer KBV questions as part of the online application process. This is the first in-depth analysis of direct feedback from a large number of applicants for public assistance on their experience with a KBV quiz and their perceptions and opinions about KBV and related online security issues. The survey is intended to address the following broad questions:
▪ How comfortable were users with the questions being asked, and did users perceive the questions as a burden? What concerns did users have with the KBV, if any?
▪ Did users appreciate the value of the questions in making the online application process more secure, better protecting their privacy and the security of their personal information?
▪ Would users be interested in other elements of an online Identity Ecosystem, such as federated login (signing in using an email or other account) or MFA (receiving an email or text to confirm online transactions)?
This section also discusses instances where answers to these questions tend to differ in important ways across users of different ages, genders, races, or other characteristics, such as prior experience answering questions about identity online.
Key findings are presented in Section 5.1. Survey methods and the sample are described in Section 5.2. The full survey is presented in Section 5.3, including the survey questions, answer choices, skip logic, and raw response summaries.
5.1 Key Findings
Key findings include the following:
▪ Respondents who answered the KBV quiz questions had generally favorable impressions, with a majority reporting that the questions made sense to them, were not hard for them to answer correctly, and did not make them uncomfortable.
▪ Among respondents who did not answer the KBV questions, the most common reasons given were that the questions were not them (25%), the respondent did not want to take the time to answer (17%), the respondent did not see the questions (17%), the respondent did not want to share personal information (10%), and the respondent did not know or did not want to think about the answers (10%).
▪ Although only 15% of respondents reported knowing beforehand that the KBV questions would be asked as part of the online application process, 57% of these said that knowing this made them feel more secure (40% said it made no difference), and 41% said it made them at least somewhat more likely to apply online (59% would have applied online anyway).
▪ Asked if they would like to be able to access their MI Bridges account using their login for other online services or email accounts, 45% of respondents said yes; 31%

NSTIC State Government Pilot: Michigan Department of Health and Human Services
5-2
said no. Asked if they would like to receive a text or email to confirm their identity before changes are made to their personal information in MI Bridges, 75% of respondents said yes; 16% said no.
5.1.1 KBV Experience
Survey respondents who completed the KBV quiz were asked whether they knew the answers to the KBV questions, whether the questions made sense, how hard the questions were to answer, and how comfortable they were answering them. The majority of respondents gave generally favorable answers, as summarized in Table 5-1.
In all, 52% of respondents gave favorable answers to all four of our survey questions; 82% gave favorable answers to at least three of the questions; 94% to at least 2; and 98% to at least 1.
Table 5-1. Users’ Experience with the KBV Quiz
Question Favorable Unfavorable
Q4. Did you know the answers to the questions? 93% (All or Most)
1% (None)
Q5. Did the questions make sense to you? That is, did they ask about things that applied to you?
90% (Yes)
10% (No)
Q6. How hard was it for you to answer the questions? 66% (Easy/V.Easy)
5% (Hard or V.Hard)
Q9. How comfortable were you answering the questions? 77% (Comf./V.Comf)
7% (Uncomf/V.Unc)
Notes: Section 5.3 summarizes all answers (i.e., raw results) for each question.
Respondents who identified their race as other than White or Black were 9.5% less likely to answer all four questions favorably (95% CI, 6.3% to 12.8%). This group accounted for 12% of respondents and included Asian, Native American, Native Hawaiian, Hispanic, and Other. Black respondents gave favorable answers roughly as often as White respondents.
Older respondents were less likely to answer the questions favorably. Respondents 35 to 54 years old were 7.6% (95% CI, 5.9% to 9.4%) less likely and respondents 55 years or older were 13.3% (95% CI, 10.5% to 16.2%) less likely to give four favorable responses.
Male respondents were 4.4% less likely to answer all four questions favorably (95% CI, 2.5% to 6.3%).
Asked if someone they knew could have answered the KBV questions, 27% said yes; of those, 67% said a parent could have answered the questions, 54% said a sibling, and 41% said an ex-spouse or partner (Table 5-2).

Section 5 — MI Bridges Applicant Survey
5-3
Table 5-2. Users’ Perceptions of Security
Q7. Do you think someone you know could have answered these questions as if they were you, or if they were pretending to be you?
Yes 4,576 (27%)
No 12,515 (73%)
Q8. Who could have answered the questions? Please select all that apply: Number
Percent of 4,576
Father or mother 3,051 67%
Brother or sister 2,450 54%
Ex-spouse or partner 1,899 41%
Current spouse or partner 1,823 40%
Friend 1,787 39%
Some other relative 1,319 29%
Current boyfriend or girlfriend 1,271 28%
Son or daughter 1,176 26%
Roommate 469 10%
Other 192 4%
Notes: The 4,576 respondents who answered “yes” to Question 7 selected a total of 15,437 answers to Question 8, an average of 3.4 selections per respondent.
5.1.2 KBV Participation
Asked if they had answered the KBV quiz questions, 85% of respondents answered that they had. Although survey responses are not the most reliable indicator of the actual KBV participation rate, the survey does allow us to examine the correlation between KBV participation and other factors. Specifically, we found that respondents are more likely to answer the KBV questions if any of the following are true:
▪ They have been a victim of identity theft.
▪ They have previously answered questions about their identity online.
▪ They have heard about the KBV questions before applying for benefits online.
Survey respondents 55 years of older were less likely to answer the KBV questions, answering at a rate of 79% compared with 85% overall, and these three factors above made the most difference in this older demographic (Table 5-3).
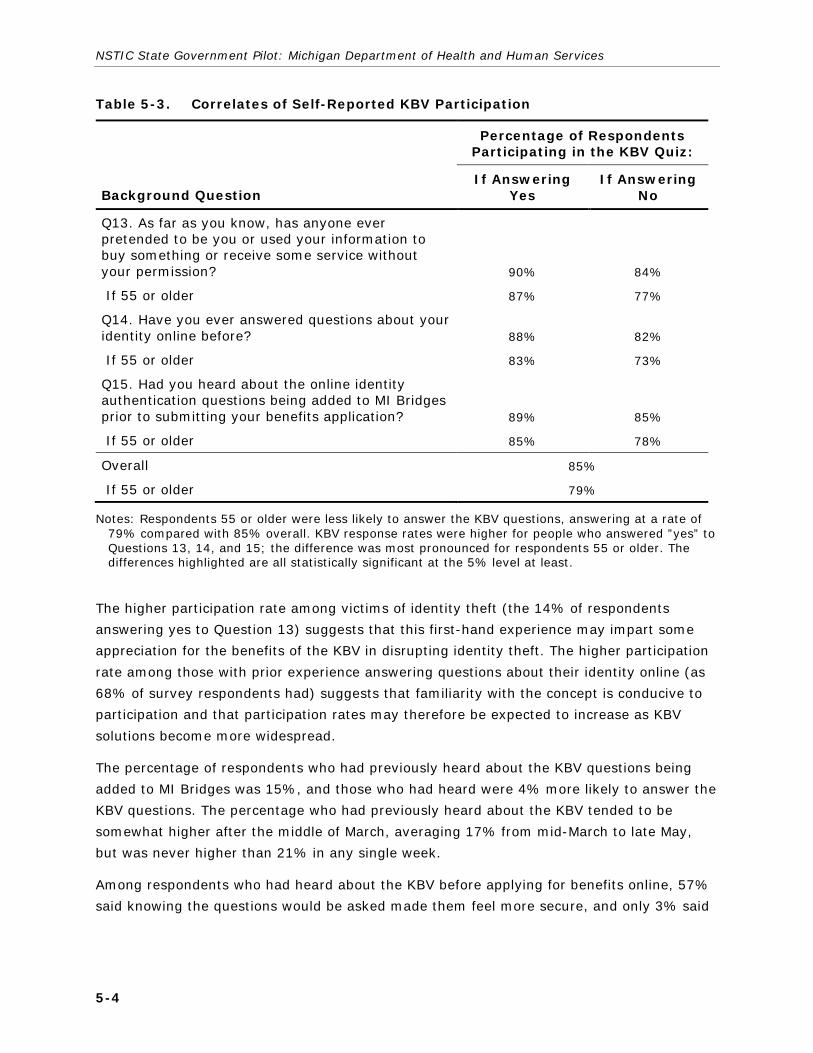
NSTIC State Government Pilot: Michigan Department of Health and Human Services
5-4
Table 5-3. Correlates of Self-Reported KBV Participation
Percentage of Respondents Participating in the KBV Quiz:
Background Question If Answering
Yes If Answering
No
Q13. As far as you know, has anyone ever pretended to be you or used your information to buy something or receive some service without your permission? 90% 84%
If 55 or older 87% 77%
Q14. Have you ever answered questions about your identity online before? 88% 82%
If 55 or older 83% 73%
Q15. Had you heard about the online identity authentication questions being added to MI Bridges prior to submitting your benefits application? 89% 85%
If 55 or older 85% 78%
Overall 85%
If 55 or older 79%
Notes: Respondents 55 or older were less likely to answer the KBV questions, answering at a rate of 79% compared with 85% overall. KBV response rates were higher for people who answered ”yes” to Questions 13, 14, and 15; the difference was most pronounced for respondents 55 or older. The differences highlighted are all statistically significant at the 5% level at least.
The higher participation rate among victims of identity theft (the 14% of respondents answering yes to Question 13) suggests that this first-hand experience may impart some appreciation for the benefits of the KBV in disrupting identity theft. The higher participation rate among those with prior experience answering questions about their identity online (as 68% of survey respondents had) suggests that familiarity with the concept is conducive to participation and that participation rates may therefore be expected to increase as KBV solutions become more widespread.
The percentage of respondents who had previously heard about the KBV questions being added to MI Bridges was 15%, and those who had heard were 4% more likely to answer the KBV questions. The percentage who had previously heard about the KBV tended to be somewhat higher after the middle of March, averaging 17% from mid-March to late May, but was never higher than 21% in any single week.
Among respondents who had heard about the KBV before applying for benefits online, 57% said knowing the questions would be asked made them feel more secure, and only 3% said

Section 5 — MI Bridges Applicant Survey
5-5
it made them feel less secure; 41% said knowing the questions would be asked made them more likely to apply online (Table 5-4).
Table 5-4. Foreknowledge of KBV
Q15. Had you heard about the online identity authentication questions being added to MI Bridges prior to submitting your benefits application?
Yes 3,129 (15%)
No 17,252 (85%)
Q16. Did knowing that these questions would be asked make you feel more or less secure that MI Bridges was protecting your privacy? Number
Percent of 3,129
Less secure 106 3%
Made no difference 1,247 40%
More secure 1,768 57%
Q17. Did knowing that these questions would be asked make you any more likely to submit a benefits application online instead of on paper? Number
Percent of 3,129
No, I was going to apply online anyway. 1,831 59%
A little more likely. 472 15%
Much more likely. 607 19%
I wouldn’t have applied online if it weren’t for the online identity authentication questions. 210 7%
Notes: Of the 3,129 respondents who answered “yes” to Question 15, 3,121 answered Question 16 and 3,120 answered Question 17.
For other program offices considering implementing KBV solutions, our findings suggest that previous knowledge of the KBV can encourage participation. The success of an outreach program could be measured by asking a single question: did the respondent know about the KBV ahead of time? If this question could be presented as part of the online application, after the KBV and before the user submits the application, and if the answer could be captured and attached to the actual KBV response (marked either as “submitted completed quiz” or “opted out”), then the success of an outreach program could be tracked in real time. A program officer would be looking to see a high percentage of online applicants reporting that they had heard about the KBV (messaging received) and that the KBV response rate was significantly higher among those who had heard about the KBV (messaging successful). These two metrics could be tracked in real time as messaging strategies are refined.
5.1.3 Reasons for KBV Nonparticipation
Among survey respondents who did not complete the KBV quiz, 35% started to answer or tried to answer the questions before abandoning, and 65% opted out without trying to
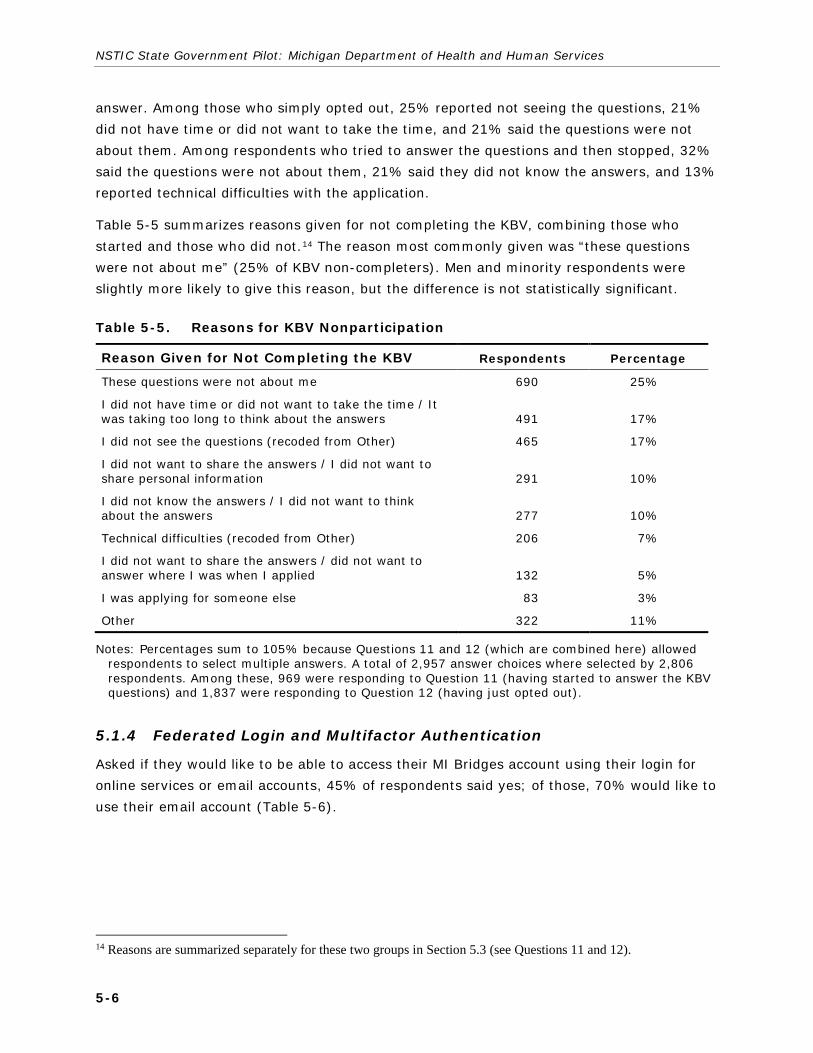
NSTIC State Government Pilot: Michigan Department of Health and Human Services
5-6
answer. Among those who simply opted out, 25% reported not seeing the questions, 21% did not have time or did not want to take the time, and 21% said the questions were not about them. Among respondents who tried to answer the questions and then stopped, 32% said the questions were not about them, 21% said they did not know the answers, and 13% reported technical difficulties with the application.
Table 5-5 summarizes reasons given for not completing the KBV, combining those who started and those who did not.14 The reason most commonly given was “these questions were not about me” (25% of KBV non-completers). Men and minority respondents were slightly more likely to give this reason, but the difference is not statistically significant.
Table 5-5. Reasons for KBV Nonparticipation
Reason Given for Not Completing the KBV Respondents Percentage
These questions were not about me 690 25%
I did not have time or did not want to take the time / It was taking too long to think about the answers 491 17%
I did not see the questions (recoded from Other) 465 17%
I did not want to share the answers / I did not want to share personal information 291 10%
I did not know the answers / I did not want to think about the answers 277 10%
Technical difficulties (recoded from Other) 206 7%
I did not want to share the answers / did not want to answer where I was when I applied 132 5%
I was applying for someone else 83 3%
Other 322 11%
Notes: Percentages sum to 105% because Questions 11 and 12 (which are combined here) allowed respondents to select multiple answers. A total of 2,957 answer choices where selected by 2,806 respondents. Among these, 969 were responding to Question 11 (having started to answer the KBV questions) and 1,837 were responding to Question 12 (having just opted out).
5.1.4 Federated Login and Multifactor Authentication
Asked if they would like to be able to access their MI Bridges account using their login for online services or email accounts, 45% of respondents said yes; of those, 70% would like to use their email account (Table 5-6).
14 Reasons are summarized separately for these two groups in Section 5.3 (see Questions 11 and 12).

Section 5 — MI Bridges Applicant Survey
5-7
Table 5-6. Federated Login
Q18. Would you like to be able to access your MI Bridges account using your login for any online services or email accounts you might have?
Yes 9,177 (45%)
No 6,296 (31%)
Q19. Would you like to be able to access your MI Bridges account using your login for any of the services below? Please select all that apply. Number
Percentage of 9,177
My email address 6,343 69%
Google, Yahoo!, or similar service 3,257 35%
Facebook, Twitter, other social media 898 10%
Not sure 1,222 13%
Notes: The 9,177 respondents who answered “yes” to Question 18 selected a total of 11,720 answers to Question 19. Also, 4,855 respondents (24%) answered “unsure” to question 18.
Asked if they would like to receive a text or email to confirm their identity before changes are made to their personal information in MI Bridges, 75% of respondents said yes; of those, 68% would like to receive an email and 54% would like to receive a text (Table 5-7).
Table 5-7. Multifactor Authentication
Q20. When changing your personal information in MI Bridges, would you like to receive a text or email to confirm your identity before the changes are made?
Yes 15,206 (75%)
No 3,245 (16%)
Q21. How would you like to receive identity confirmation before the changes are made? Please select all that apply. Number
Percent of 9,177
An email 10,341 68%
A text message 8,157 54%
Not sure 218 1%
Notes: The 15,206 respondents who answered “yes” to Question 20 selected a total of 18,716 answers to Question 21. Also, 1,639 respondents (8%) answered “unsure” to question 20.
5.2 Survey Methods and Sample
MI Bridges users were given the option to take the survey during the online application process. After having seen the KBV questions and before submitting their application, users saw the following text:
MDHHS is very interested in what you think about the identity questions on the MI Bridges website, and you’re invited to take a survey to help us learn more. Everyone who completes the survey will be entered into a drawing for a $50 gift card. We have 300 to give away! Your answers will help MDHHS to better

NSTIC State Government Pilot: Michigan Department of Health and Human Services
5-8
serve you and your community. Deciding to take the survey will not affect your application for benefits in any way.
To volunteer to take the survey, a user needed to provide an email address. MDHHS provided RTI with emails of survey volunteers in twice-weekly batches, sending the emails in encrypted files; RTI then sent each volunteer an email containing an invitation to take the survey, a user-specific link to the survey (each link could be used to access the survey only once), and an email address where users could direct any questions about the survey. RTI sent out email invitations on the same day each batch file was received from MDHHS, so users received the survey link one to four days after volunteering.
RTI sent out 99,051 invitations to survey volunteers between December 20, 2014, and June 19, 2015.15 These invitations generated 20,446 complete survey responses.16
5.3 Survey Instrument and Results
This section presents the survey questions, answer choices, skip logic, and response summaries.
1. Where are you taking this survey? At home 15,843 77.6% At someone else’s home 1,090 5.3% At work 1,500 7.3% At a library, school, or community center 651 3.2% At a community organization’s office 99 0.5% Someplace else that has free internet or Wi-Fi 720 3.5% Other [Please specify] 518 2.5%
2. How did you most recently apply for benefits? [Added April 17, 2015]
Using MI Bridges on a computer 4,377 68.5% Using MI Bridges on a smart phone 1,132 17.7% Over the phone 66 1.0% At a DHS office 557 8.7% At a community organization’s office 53 0.8% Other [Please specify] 204 3.2%
3. Did you answer the online identity authentication questions?
Yes [ Question 4] 17,112 85.5% No [ Question 10] 2,906 14.5%
15 The KBV function was activated December 20, 2014. Problems were identified that prompted
MDHHS to turn off the KBV the same day. The KBV function was reactivated December 30, 2014, and has been continuously active since that date. From January through June of 2015, MDHHS received 592,266 MI Bridges applications, based on the July 2015 run of the SS-202-Monthly report.
16 A total of 22,572 surveys were started; 2,126 (9.4%) of those were not completed.

Section 5 — MI Bridges Applicant Survey
5-9
4. Did you know the answers to the questions? I knew the answers to...
All 11,454 67.0% Most 4,503 26.4% Some 938 5.5% None 193 1.1%
5. Did the questions make sense to you? That is, did they ask about things that applied to
you? Yes 15,426 90.4% No 1,642 9.6%
6. How hard was it for you to answer the questions?
Very Hard 116 0.7% Hard 735 4.3% Not hard or easy 5,040 29.5% Easy 5,912 34.6% Very Easy 5,295 31.0%
7. Do you think someone you know could have answered these questions as if they were
you, or if they were pretending to be you? Yes [ Question 8] 4,574 26.8% No [ Question 9] 12,508 73.2%
8. Who could have answered the questions? Please select all that apply.
Current Spouse or partner 1,823 39.8% Current Boyfriend or girlfriend 1,271 27.8% Ex-spouse, partner, boyfriend or girlfriend? 1,899 41.5% Father or mother 3,051 66.7% Son or daughter 1,176 25.7% Brother or sister 2,450 53.5% Some other relative 1,319 28.8% Friend 1,787 39.1% Room-mate or someone else who lives with you every now and then
469 10.2%
Other [Please specify] 192 4.2% 9. How comfortable were you with answering the questions?
Very comfortable 5,989 35.0% Comfortable 7,145 41.8% Not comfortable or uncomfortable 2,821 16.5% Uncomfortable 797 4.7% Very uncomfortable 343 2.0%
[ Question 13]
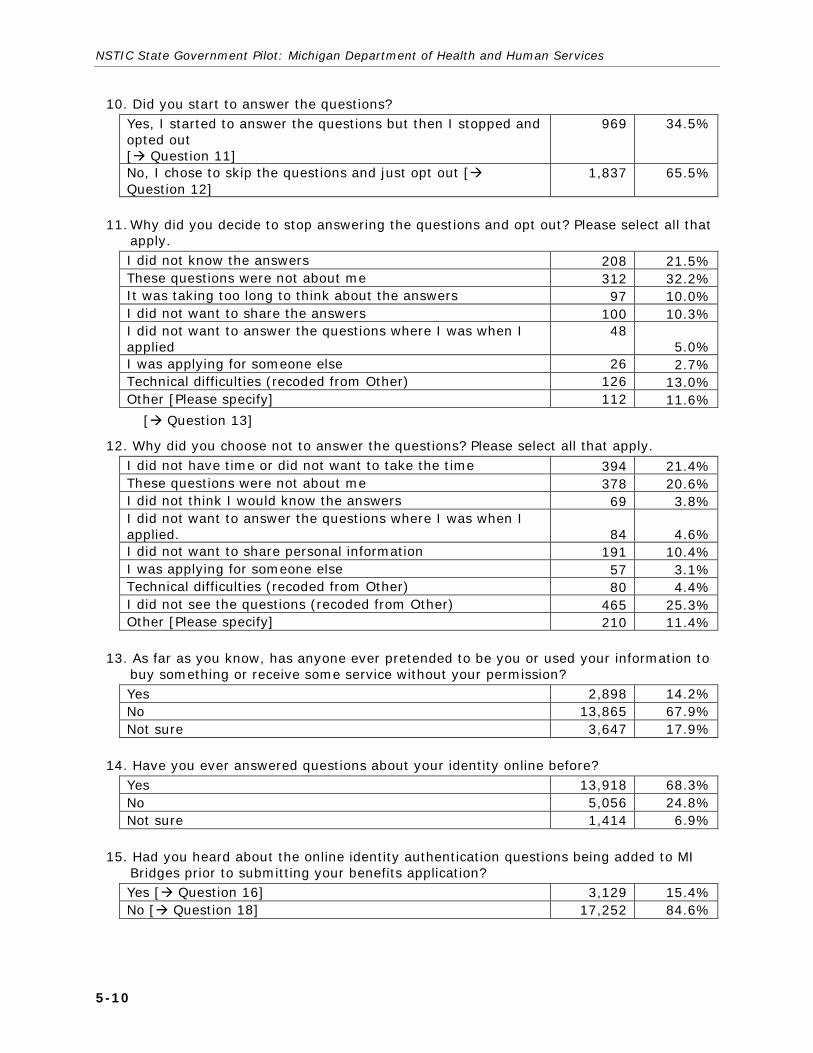
NSTIC State Government Pilot: Michigan Department of Health and Human Services
5-10
10. Did you start to answer the questions? Yes, I started to answer the questions but then I stopped and opted out [ Question 11]
969 34.5%
No, I chose to skip the questions and just opt out [ Question 12]
1,837 65.5%
11. Why did you decide to stop answering the questions and opt out? Please select all that
apply. I did not know the answers 208 21.5% These questions were not about me 312 32.2% It was taking too long to think about the answers 97 10.0% I did not want to share the answers 100 10.3% I did not want to answer the questions where I was when I applied
48 5.0%
I was applying for someone else 26 2.7% Technical difficulties (recoded from Other) 126 13.0% Other [Please specify] 112 11.6%
[ Question 13]
12. Why did you choose not to answer the questions? Please select all that apply. I did not have time or did not want to take the time 394 21.4% These questions were not about me 378 20.6% I did not think I would know the answers 69 3.8% I did not want to answer the questions where I was when I applied. 84 4.6% I did not want to share personal information 191 10.4% I was applying for someone else 57 3.1% Technical difficulties (recoded from Other) 80 4.4% I did not see the questions (recoded from Other) 465 25.3% Other [Please specify] 210 11.4%
13. As far as you know, has anyone ever pretended to be you or used your information to
buy something or receive some service without your permission? Yes 2,898 14.2% No 13,865 67.9% Not sure 3,647 17.9%
14. Have you ever answered questions about your identity online before?
Yes 13,918 68.3% No 5,056 24.8% Not sure 1,414 6.9%
15. Had you heard about the online identity authentication questions being added to MI
Bridges prior to submitting your benefits application? Yes [ Question 16] 3,129 15.4% No [ Question 18] 17,252 84.6%

Section 5 — MI Bridges Applicant Survey
5-11
16. Did knowing that these questions would be asked make you feel more or less secure
that MI Bridges was protecting your privacy? Less secure 106 3.4% Made no difference 1,247 40.0% More secure 1,768 56.6%
17. Did knowing that these questions would be asked make you any more likely to submit
a benefits application online instead of on paper? No, I was going to apply online anyway. 1,831 58.7% A little more likely. 472 15.1% Much more likely. 607 19.5% I wouldn’t have applied online if it weren’t for the online identity authentication questions.
210 6.7%
18. Would you like to be able to access your MI Bridges account using your login for any
online services or email accounts you might have? Yes [ Question 19] 9,177 45.1% No – I would not want to do this [ Question 20] 5,770 28.4% No – I don’t have any of these types of accounts [ Question 20]
526 2.6%
Not sure [ Question 20] 4,855 23.9% 19. Would you like to be able to access your MI Bridges account using your login for any of
the services below? Please select all that apply. Google, Yahoo!, or similar service 3,257 35.5% Facebook, Twitter, or another social media account 898 9.8% My email address 6,343 69.1% Not sure 1,222 13.3%
20. When changing your personal information in MI Bridges, would you like to receive a
text or email to confirm your identity before the changes are made? Yes [ Question 21] 15,206 74.9% Yes, but I don’t have a cell phone or email address [ Question 22]
217 1.1%
No – I would not want to do this [ Question 22] 3,245 16.0% Not sure [ Question 22] 1,639 8.1%
21. How would you like to receive identity confirmation before the changes are made?
Please select all that apply. A text message 8,157 53.6% An email 10,341 68.0% Not Sure 218 1.4%

NSTIC State Government Pilot: Michigan Department of Health and Human Services
5-12
22. Age 18-24 4,125 20.2% 25-34 7,217 35.3% 35-54 7,156 35.0% 55+ 1,919 9.4%
23. In which county do you live?
Genesee 1,212 6.0% Ingham 851 4.2% Kalamazoo 638 3.1% Kent 1,544 7.6% Macomb 1,552 7.6% Oakland 1,636 8.0% Washtenaw 715 3.5% Wayne – INSIDE DETROIT 2,227 10.9% Wayne – OUTSIDE DETROIT 1,946 9.6% Other 8,032 39.5%
24. Are you male or female?
Male 4,162 20.4% Female 16,258 79.6%
25. Are you of Hispanic or Latino origin or descent?
Yes 1,105 5.4% No 19,249 94.6%
26. What race or races do you consider yourself to be? Please select all that apply.
White (Caucasian) 14,396 70.4% Black or African American 5,155 25.2% Asian 325 1.6% American Indian or Alaska Native 668 3.3% Native Hawaiian or Other Pacific Islander 66 0.3% Hispanic 833 4.1% Other [Please specify] 512 2.5%

6-1
6. DISCUSSION
The MDHHS pilot implemented a KBV solution that has been used to verify the identities of more than 402,630 benefits applicants. Now on more than 65% of the online applications MDHHS receives the applicant has been identity verified by KBV before an Eligibility Specialist sees the application. Our analysis suggests that the time this saves Eligibility Specialists has appreciable impacts: 8% reduction in application backlogs (the number of applications pending at the end of a month) and a roughly one-day reduction in the time it takes to approve or deny an application.
These impact assessments come with several caveats, as discussed in Section 3. The 8% reduction in backlogs is based on monthly data for FAP only. This estimated reduction in backlogs is roughly equivalent to a one-day reduction in processing time. A separate analysis of application-level data supports this conclusion and extends it to nearly half of all MDHHS benefits applications: Survival time analysis finds a statistically significant reduction in processing time for the subset of FAP, MA, Cash Assistance (TANF), and CDC applications that are processed within 14 days. Estimated reductions in waiting time range from 0.9 days to 1.7 days depending on the program and whether the application is eventually approved or denied. For FAP, for example, we estimated 0.9 days faster approvals and 1.0 days faster denials.
There is reason to consider these estimates and their levels of statistical significance to be conservative. The data forthcoming from MDHHS did not allow us to link KBV outcomes and application processing outcomes (approval or denial, processing time) at the application level. We were also not able to obtain data on processing outcomes for online applications only; all processing outcomes data used for this analysis were all inclusive, with no way to distinguish online from paper applications. The results obtained are therefore based on improvements in average processing times for all applications, only a subset of which were exposed to the “treatment” of KBV identity authentication. This subset could have been at most 36% of the applications represented in our data: Roughly 55% of MDHHS applications are made online, and at most 65% of online applications were KBV verified. The actual impact on processing times of online applications—and perhaps especially online applications that were KBV verified—would probably have been larger than the average impacts we estimated for all applicants.
Worth noting also is that the 8% impact estimates are based on 8 months of the pilot when KBV quiz pass rates, and therefore also the percentage of online applications flagged as having been identity verified by KBV, were artificially low because of a programming problem with MI Bridges that caused answers to some questions to be transmitted incorrectly to LexisNexis for scoring. When the problem was fixed on August 16, the rate at which quizzes were scored as passed jumped from 55% to 74%, and the percentage of MI Bridges applications flagged as KBV verified jumped from 52% to 65%. Had this problem

NSTIC State Government Pilot: Michigan Department of Health and Human Services
6-2
been resolved at or near the beginning of the pilot instead of 8 months in, estimates of the impact of the pilot would presumably have been greater.
The month-level analysis that yielded estimates of an 8% reduction in backlogs controlled for Eligibility Specialist staffing levels, and having done so also enables us to describe the impact of the pilot in terms of an equivalent increase in staffing levels. Using Model 2 (from Section 3.1), the pilot is equivalent to a 3.66% increase in FTE (because the 8.2% impact attributed to the pilot divided by the 2.238% impact attributed to a 1% increase in FTE is equal to 3.66); 3.66% of 2,561 FTEs is roughly 95 FTEs.
One way to look at this is that over the months of the pilot, MDHHS and its clients in effect had the benefit of an additional 95 full-time Eligibility Specialists. Valuing each of those 95 staff at $42,000 per year, which is at the lower end of the compensation range for MDHHS Eligibility Specialists, the benefits of the pilot come to $3,990,000. This compares favorably with the $1.3 million cost of the pilot. Consider also that Model 2 gives the smallest such figure; Model 3 (Model 4) gives a staffing-equivalent impact 1.6 times (1.5 times) as large.
That the pilot could generate a benefit-to-cost ratio of at least 3 in such a short time, even based on a rather narrow notion of its benefits, not taking into account any reduction in risks of data breaches or identity theft, should be sufficient to deem the pilot a success.
To replicate Michigan’s success with deploying KBV for identity verification as part of online application for public benefits, other states will want to carefully manage a number of factors, from client messaging, to choice of identity proofer, to working with that identity proofer on the tuning of the KBV solution. We saw, for example, that applicants passed quizzes with at least one diversionary question at higher rates than they did quizzes with no diversionary questions; how to treat such quizzes is an important decision for a relying party.
Although our survey found generally favorable reactions to the KBV among MDHHS clients, other states should expect some instances where vulnerable members of a benefits-eligible population will experience anxiety as a result of the KBV. Comments submitted by respondents to our survey describe instances of KBV questions referencing by name ex-partners with whom the respondent had been involved in domestic violence situations and children who had died. These do not appear to be more than isolated incidents, but the emotional pain caused to those applicants is something to be thoughtfully weighed against the marginal benefit of including KBV question types in which names can appear. In public assistance settings, it may be appropriate to exclude these question types.