nrel/tp-670-43053 wind supply curves june 2008 · wind supply curves . david kline, donna...
TRANSCRIPT

A national laboratory of the U.S. Department of EnergyOffice of Energy Efficiency & Renewable Energy
National Renewable Energy Laboratory Innovation for Our Energy Future
A GIS Method for Developing Wind Supply Curves David Kline, Donna Heimiller, and Shannon Cowlin
Technical Report NREL/TP-670-43053 June 2008
NREL is operated by Midwest Research Institute ● Battelle Contract No. DE-AC36-99-GO10337

A GIS Method for Developing Wind Supply Curves David Kline, Donna Heimiller, and Shannon Cowlin
Prepared under Task No. WF1F.1020
Technical Report NREL/TP-670-43053 June 2008
National Renewable Energy Laboratory1617 Cole Boulevard, Golden, Colorado 80401-3393 303-275-3000 • www.nrel.gov
Operated for the U.S. Department of Energy Office of Energy Efficiency and Renewable Energy by Midwest Research Institute • Battelle
Contract No. DE-AC36-99-GO10337

NOTICE
This report was prepared as an account of work sponsored by an agency of the United States government. Neither the United States government nor any agency thereof, nor any of their employees, makes any warranty, express or implied, or assumes any legal liability or responsibility for the accuracy, completeness, or usefulness of any information, apparatus, product, or process disclosed, or represents that its use would not infringe privately owned rights. Reference herein to any specific commercial product, process, or service by trade name, trademark, manufacturer, or otherwise does not necessarily constitute or imply its endorsement, recommendation, or favoring by the United States government or any agency thereof. The views and opinions of authors expressed herein do not necessarily state or reflect those of the United States government or any agency thereof.
Available electronically at http://www.osti.gov/bridge
Available for a processing fee to U.S. Department of Energy and its contractors, in paper, from:
U.S. Department of Energy Office of Scientific and Technical Information P.O. Box 62 Oak Ridge, TN 37831-0062 phone: 865.576.8401 fax: 865.576.5728 email: mailto:[email protected]
Available for sale to the public, in paper, from: U.S. Department of Commerce National Technical Information Service 5285 Port Royal Road Springfield, VA 22161 phone: 800.553.6847 fax: 703.605.6900 email: [email protected] online ordering: http://www.ntis.gov/ordering.htm
Printed on paper containing at least 50% wastepaper, including 20% postconsumer waste

Acknowledgments
The authors gratefully acknowledge the Climate Change Division of the Environmental Protection Agency (EPA) for its support in this phase of the Climate Technology Partnership, and the previous phases that provided its foundation. The United Nations Development Programme provided support to China Hydropower Engineering Consulting Company (CHECC) for their role in this work. The project would have been impossible without the strong collaboration of the Chinese team from CHECC and allied institutions, led by Shi Pengfei and including Wang Jixue, Yang Chengbing, and Yang Xifeng. The wind resource data developed by the Solar and Wind Energy Resource Assessment project, which was sponsored by the United Nations Environment Programme, was also a critical element. Any errors contained in this report are the sole responsibility of the authors.
i

ii
Table of Contents Acknowledgments ........................................................................................................................................ i Table of Contents ........................................................................................................................................ ii Introduction .................................................................................................................................................. 1 Project Overview.......................................................................................................................................... 1 Methodology ................................................................................................................................................ 1 Implementation of the Analysis ................................................................................................................. 4
Wind Resources .........................................................................................................................4 Exclusions ..................................................................................................................................5 Cost Measured at the Wind Farm ..............................................................................................6 Point of Measurement ................................................................................................................6 Cost of Energy Delivered to the Existing Grid ..........................................................................6 Impact of Terrain on Installed Capacity ....................................................................................7 Resulting Geospatial Supply Curve ..........................................................................................8 The Value of the Geospatial Supply Curve .............................................................................10
Applicability of this Approach to Wind Power Planning in China ........................................................ 11 Building on this Effort ............................................................................................................................... 11
Improving Underlying Data .....................................................................................................11 Adding Analysis Capabilities ..................................................................................................12 Coordinating with Chinese Counterparts .................................................................................13

Introduction
This report describes work conducted by the National Renewable Energy Laboratory (NREL) as part of the Wind Technology Partnership (WTP) sponsored by the U.S. Environmental Protection Agency (EPA). This project has developed methods that the National Development and Reform Commission (NDRC) intends to use in the planning and development of China’s 30 GW of planned wind capacity. Because of China’s influence within the community of developing countries, the methods and the approaches here may help foster wind development in other countries. Project Overview
NREL has worked closely with its counterpart, the China Hydropower Engineering Consulting Company (CHECC), in developing this analysis and planning methodology. The work has also been coordinated with the Energy Bureau of NDRC to ensure that the results fit their planning purposes. The analysis provides a geographic and economic assessment of wind resources in the Zhangbei region, which yields a “geospatial supply curve” or GSC. The GSC gives not only the wind supply curve—supply price as a function of quantity supplied—but also the geographic locations that correspond to any given point on the supply curve. The GSC can answer three key questions regarding the planning of new wind capacity in Zhangbei: (1) How much wind power is available at or below a given price? (2) Conversely, given a desired level of installed capacity, how much will the delivered energy cost? (3) Which locations can supply energy at or below a given price? The answers to these questions provide a foundation for a more comprehensive regional planning framework that would address additional infrastructure, planning, and policy questions. Because it has been accepted as a planning methodology by the NDRC Energy Bureau, the GSC can play an important role in supporting China’s planned 30 GW of additional wind power. Methodology
This section describes the methodology developed for use in this study, its implementation, and the adjustments that were made because of limitations in the available data. The goal of this method is to produce the geospatial supply curve (GSC), which has two parts. The first part is a standard supply curve, giving the supply available within the Zhangbei region at any given price (or, conversely, the marginal price for a given level of supply from Zhangbei).1 The second element, the geospatial portion, is a geographic information system (GIS) that associates a map with each point on the supply curve. The map shows the GIS cells that are included at that level of supply. Equivalently, the map shows all the locations that can deliver energy at or below the corresponding price. 1 The supply curve is expressed in units of installed nominal capacity. The GIS system contains data that could also be used to calculate the annual energy generation at any given level of supply. Annual generation will vary with the level of supply, since the capacity factor decreases as the supply increases and less favorable sites are included.
1

Figure 1 presents an overview of the methodology used to develop the GSC. The right column shows the geographic inputs; the left column describes the technical, economic, and finance inputs; and the middle column provides a conceptual overview of the flow of the calculations. Note that the shapes of the boxes distinguish between types of variables. The boxes with curved edges describe quantities that are considered “maps,” i.e., they have a value for each “cell” or geographic grid point. The boxes with all straight edges represent other kinds of data, or calculation processes. The analysis was originally intended to proceed as follows: The calculations begin by combining the wind power data with the power curve of the wind turbines to calculate the capacity factor of a turbine, hypothetically located at each cell. Together with cost and finance parameters, those capacity factors determine the levelized cost of energy (LCOE) at each cell, without accounting for any transmission costs (“local LCOE”). Information on how the transmission cost depends on the location of the cell, together with and other parameters, determines the cost, including transmission cost (“LCOE delivered to the grid”). In the final step, the GIS software aggregates the map data to develop the GSC. The methodology described above and illustrated in Figure 1 is an idealized version of what was actually carried out. As described in Section IV, data availability limited the analysis. The shaded portions of Figure 1 indicate calculations omitted because of the data limitations. Accordingly, the supply curve presented below represents the local LCOE rather than the LCOE delivered to the grid.
2

Calculation process
Other input or output
data
Data or results in map form
Wind speed data
LCOE delivered
to grid
Turbine power
curve data
Capacity factors
Local LCOE
Aggregate across all
cells
Turbine cost and finance
data
GIS DATA Calculated Results
Technical and Economic Data
Terrain data
Legend
Map results
Supply curve results
Exclusion zones
Transmission cost data
Figure 1. Overview of Methodology
3

Implementation of the Analysis
This section provides more detail on the implementation of the methodology described above and presents the results. It also describes the data sources and the adaptation of the methodology because of the limited data available. Wind Resources The wind resource information used in this study was developed by NREL with input from the CHECC, as part of the Solar and Wind Energy Resource Assessment (SWERA) project in 2005.2 A detailed report of the data and methodology used to create the wind resource assessment is available on the SWERA Web site at http://swera.unep.net. The wind resource is represented as annual wind power density (W m-2) or, equivalently, wind power class at 50 m above ground, with a spatial resolution of 1 km2. Zhangbei’s wind resource distribution is shown in Figure 2.
Figure 2. Wind Resource Distribution in Zhangbei
This analysis considered only resource levels of class 3 and higher. The resource information was divided into four subclasses for each wind power class to allow for finer delineation of wind capacity factor and separation of cost (see Table 1).
2 SWERA was sponsored by the United Nations Environmental Programme.
4
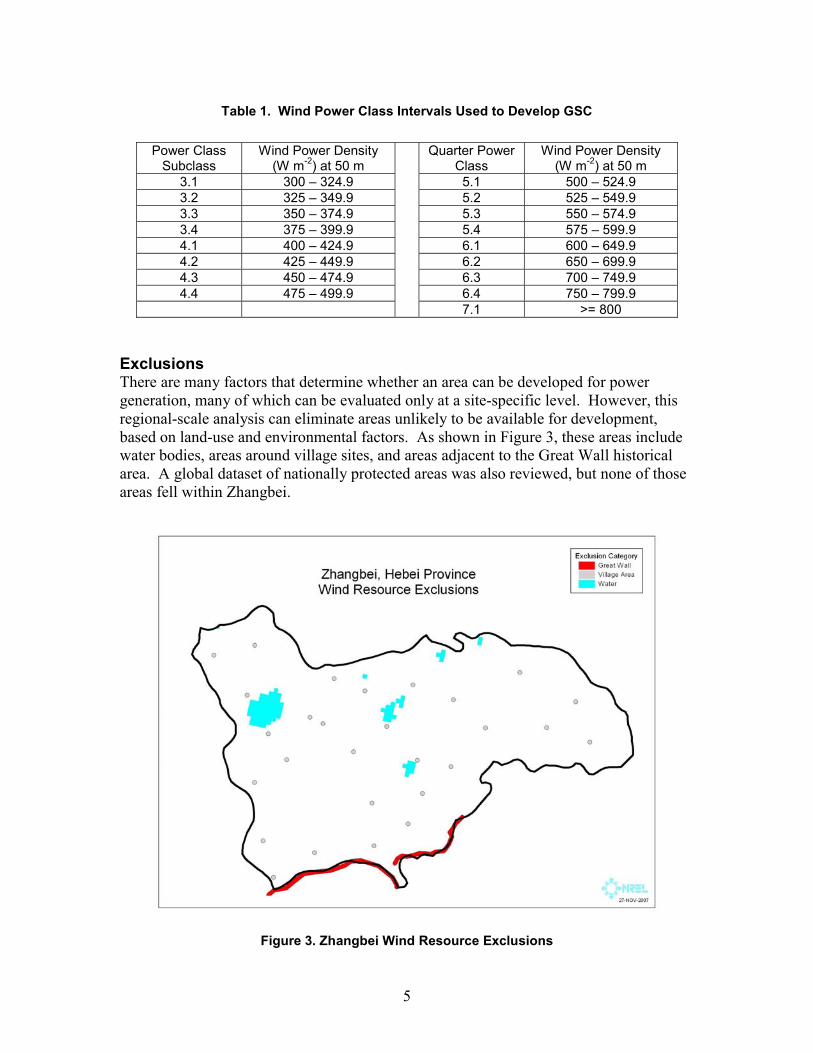
Table 1. Wind Power Class Intervals Used to Develop GSC
Power Class
Subclass Wind Power Density
(W m-2) at 50 m Quarter Power
Class Wind Power Density
(W m-2) at 50 m 3.1 300 – 324.9 5.1 500 – 524.9 3.2 325 – 349.9 5.2 525 – 549.9 3.3 350 – 374.9 5.3 550 – 574.9 3.4 375 – 399.9 5.4 575 – 599.9 4.1 400 – 424.9 6.1 600 – 649.9 4.2 425 – 449.9 6.2 650 – 699.9 4.3 450 – 474.9 6.3 700 – 749.9 4.4 475 – 499.9 6.4 750 – 799.9
7.1 >= 800 Exclusions There are many factors that determine whether an area can be developed for power generation, many of which can be evaluated only at a site-specific level. However, this regional-scale analysis can eliminate areas unlikely to be available for development, based on land-use and environmental factors. As shown in Figure 3, these areas include water bodies, areas around village sites, and areas adjacent to the Great Wall historical area. A global dataset of nationally protected areas was also reviewed, but none of those areas fell within Zhangbei.
Figure 3. Zhangbei Wind Resource Exclusions
5

Other areas that should be excluded were discussed, but were not identified in this analysis because the data were not available. Those exclusion areas include nationally designated croplands and mining areas. Modifying the exclusions used in the analysis could be accomplished quickly if data becomes available in a GIS-compatible format. Cost Measured at the Wind Farm The analysis assumes development of the Zhangbei prospect areas by private developers, as is contemplated in current plans. (In fact, concessions already have been sold to private concerns for some parts of Zhangbei.) Current policy calls for the wind farm developers to supply power to the national grid at a feed-in tariff determined during the bidding process. To model this policy regime, the cost at the wind farm is determined by solving for the feed-in tariff that will yield an agreed-upon internal rate of return (IRR) to the private developer. The value used here is a nominal IRR of 8% per annum, calculated on the after-tax cash flow to the developer. The required feed-in tariff was obtained by iteration in a spreadsheet model of after-tax annual cash flow under applicable Chinese tax rules, which was developed by CHECC. The cost of energy at the wind farm is calculated for each wind power subclass, for each of the four types of turbines and for the average of all four turbines. Point of Measurement The cost of energy from new capacity on an electric grid depends on where the cost is measured, because it depends on the transmission facilities that need to be added. A full consideration of the issues involved in estimating those costs is beyond the scope of this effort. Cost of Energy Delivered to the Existing Grid The original plan for this effort called for a relatively simple approach to the transmission cost question that would estimate the cost “delivered to the transmission system.” Such an estimate begins with a levelized cost of energy at the wind farm, i.e., including only the capital cost of the turbine and its annual operating cost without any incremental transmission costs. As mentioned above, the cost is represented by the required feed-in tariff. The cost of energy at each point on the map is then increased as a function of the distance to the existing transmission line and the cost per MW-mile to connect to it, which may depend on the terrain. However, data limitations prevented this analysis from developing a model that would give that cost as a function of distance and terrain. Accordingly, the price shown on the supply curve is simply the cost measured at the wind farm, described above.3
3 All wind locations in Zhangbei are located less than 50 km (30 mi.) from the existing 110 and 220 kva transmission lines. Accordingly, the corresponding cost of connecting to the grid is expected to be relatively small. As briefly mentioned above, the complete consideration of required transmission system additions would impose further complexities and data requirements. That analysis would require considering upgrades to the existing high-tension transmission system, which would in turn require an understanding of the capacity available on that system.
6

Impact of Terrain on Installed Capacity The amount of installed wind capacity that can be placed in a given area will be influenced by factors such as terrain, land use, pattern of wind direction (particularly of higher-speed events), and the turbines used. This analysis assumed a base density level of 5 MW of installed capacity per km2. This assumption represents a 10-rotor-diameter by 5-rotor-diameter turbine spacing across the entire area not excluded. At the suggestion of CHECC, the base installed capacity was varied as a function of the terrain slope and land-cover pattern that may impact development (see Table 2). The slope of each 1 km2 area was calculated using global digital elevation data. The density of turbines is generally a decreasing function of slope. In Zhangbei, the slope values range from 0-10%, and the installed capacity was set using the values in Table 2. The higher slopes occur along the southern border of Zhangbei, in higher wind class areas.
Table 2. Impact of Land Slope on Wind Turbine Density
Percent Slope
Installed Capacity
(MW km-2) 0 – 3 5 3 – 5 3 5 – 10 2.5
The land-cover pattern in Zhangbei is predominantly crop or grasslands, with a small area of shrub land. At the suggestion of CHECC, areas designated as crop or grasslands were modified to be 80% available and forested areas are assumed to be 50% available. Shrub lands were given an intermediate value of 65% availability. These calculations resulted in installed wind capacity values between 2 and 4 MW km-2 for areas that were not completely excluded earlier. This distribution (see Figure 4) becomes the foundation for constructing the GSC.
7
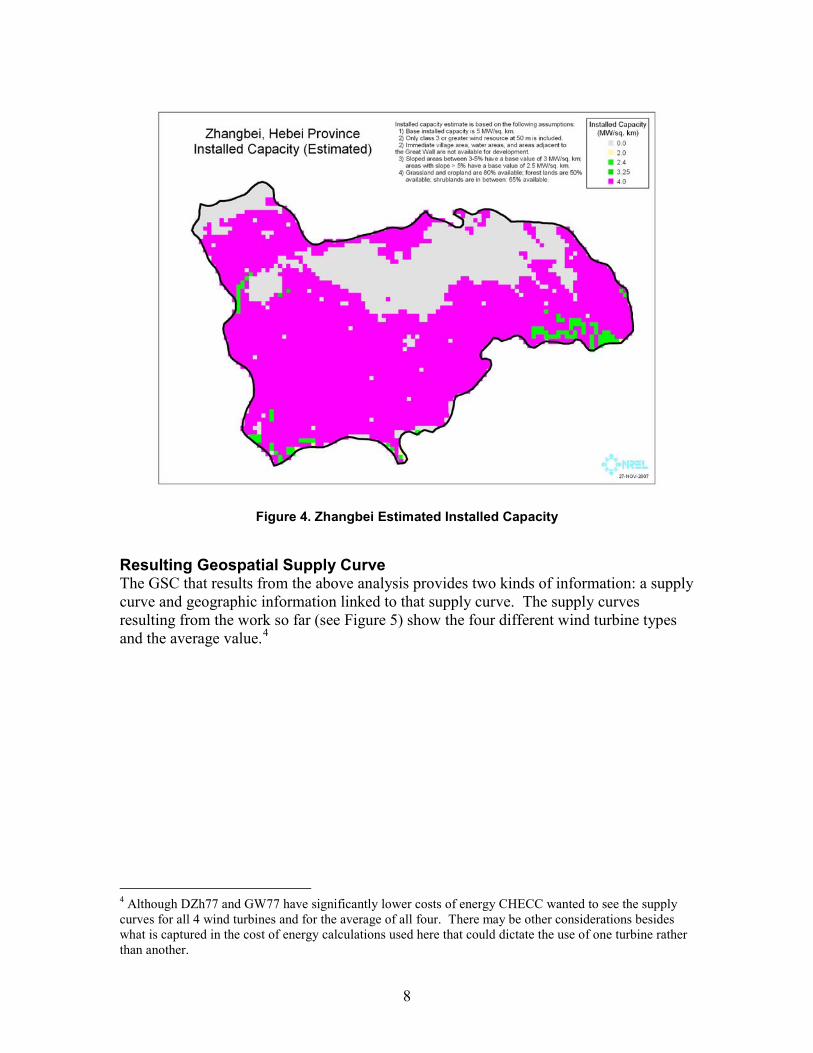
Figure 4. Zhangbei Estimated Installed Capacity
Resulting Geospatial Supply Curve The GSC that results from the above analysis provides two kinds of information: a supply curve and geographic information linked to that supply curve. The supply curves resulting from the work so far (see Figure 5) show the four different wind turbine types and the average value.4
4 Although DZh77 and GW77 have significantly lower costs of energy CHECC wanted to see the supply curves for all 4 wind turbines and for the average of all four. There may be other considerations besides what is captured in the cost of energy calculations used here that could dictate the use of one turbine rather than another.
8

Available Wind Supply Curve - Zhangbei
0.200
0.300
0.400
0.500
0.600
0.700
0.800
0.900
1.000
0 2 6,000 8,000 10,000 12,000
Installed Capacity (MW)
Tarif
f with
VA
T (y
uan
per k
Wh)
GE77DZh77S64GW77Turbine Avg
,000 4,000
Figure 5. Zhangbei Available Wind Supply
The geographic information is illustrated in Figure 6. Consider one point on the DZh77 supply curve, showing that 2,400 MW are available at a price of 0.5 Yuan/kWh ($.067/kWh) or less (indicated by arrow in Figure 5).5 The GIS portion of the analysis shows the locations that supply the wind power for that point on the supply curve. For any point on the supply curve, the GIS software can be used to develop a map analogous to Figure 6, showing which locations supply the power corresponding to that quantity and price. When linked to the geographic information shown in Figure 6, the supply curve becomes the geospatial supply curve.
5 The quantity referred to here as “price” is actually the required feed-in tariff, as described above.
9

Figure 6. Zhangbei Locations Supplying Power
The Value of the Geospatial Supply Curve The ability of a GIS to spatially represent and relate different datasets enables development of the geospatial supply curve. The evaluation of potential installed wind capacity is based on terrain, land-use, and exclusion factors that are independent of the wind resource distribution. The cost of energy for an individual site depends on the wind resource. Integrating these components by spatially cross-referencing the quantity and the cost provides the data used to build the supply curve. Using a GIS system in this way also provides a mechanism for modifying the supply curve to account for other factors that may modify the cost, especially those that are spatial in nature such as distance to transmission lines, distance to load centers, proximity to hydropower resources, and local taxes or incentives. Building the supply curve within a GIS provides flexibility for viewing the cost information related to the different GIS components. The costs can be summarized by power class, by land-use category, or other criteria. It can focus on smaller regions, or be aggregated to represent larger regions. Overall, it is a flexible mechanism for building a supply curve.
10

Applicability of this Approach to Wind Power Planning in China
The geospatial supply curve methodology provides the economic basis for planning the development of wind prospect areas such as Zhangbei. The Energy Bureau of NDRC intends for CHECC to integrate an enhanced version of this methodology into a comprehensive framework for addressing the regional planning issues required to implement China’s plans for 30 GW of new wind installations by 2020. NDRC’s planned use of the methods developed here represents the most important contribution of this effort. It also affords the opportunity to continue to work with CHECC and NDRC to refine the methodology and broaden the scope to address additional regional planning issues. In discussions about the design of this effort, NDRC requested that the methodology be broadened cover all the regional planning issues that need to be addressed in pursuing the 30 GW goal. Shortly before the time of this writing, NDRC asked that a refined version be applied to a 10 GW project in Gansu Province. CHECC will be responsible for refining the methodology to apply it in Gansu and disseminating it so that provincial government officials and others can apply it to development plans for many additional wind prospect areas. As in the United States, responsibility for new electricity projects in China is shared between the national and provincial governments. The provincial governments will have some input regarding the location of wind parks within their provinces, and will also be responsible for some of the infrastructure requirements, such as new roads. In addition, added transmission capacity will have to be coordinated with the China State Grid Corporation and other entities responsible for the national grid. The methodology developed during this project provides an economic and geographic foundation for extensions that would address the planning and analysis requirements of both the provincial governments and the grid operators. NREL hopes to continue its collaboration with CHECC to build on the basic geospatial supply curve to meet those requirements, as described in Section VI. Building on this Effort
As stated earlier, the NDRC plans to use this method as the basis for analysis of many other wind provinces, and for support to provincial stakeholders in assessing and addressing additional regional planning issues. The work to date provides a valuable proof-of-concept, but refinements and enhancements will be necessary to fully address NDRC’s requirements for a regional planning methodology. Those refinements and enhancements are considered next. Improving Underlying Data The geospatial supply curve developed in this project is based on the following sources: wind resource data developed by NREL and Chinese partners; wind turbine cost and
11

performance data provided by CHECC; and geographic information that includes the locations of roads, existing transmission lines, and exclusion zones where wind farms cannot be sited, also provided by CHECC.6 The geographic data contains the most significant gaps and approximations that should be addressed in future refinements and extensions. Most importantly, the transmission system data available for this analysis was adequate only for a limited representation of the costs of additional transmission infrastructure, as discussed in Section IV. Enhanced data on location, capacity, and loading characteristics of the existing grid system will be necessary for the next stages of this analysis. There is also no consideration in the current analysis for road infrastructure requirements, because the data on the existing road network was inadequate. Finally, the information on excluded areas could be improved, particularly in the areas of land use and officially designated cropland. The wind data used here is appropriate to support this level of analysis, because it was developed in accordance with generally accepted international standards for regional-scale wind resource assessment as part of SWERA. Other prospect areas, such as Gansu, may require additional wind resource assessment. In addition, project developers will want to conduct their own more detailed resource studies for micro-siting of turbines and for refining the economic analysis—those studies need not be conducted by the public sector. Chinese partners may want to update the cost data underlying the cost-of-energy calculations, or even the algorithm for the calculation. Those updates are easily incorporated into an updated geospatial supply curve at any time. Adding Analysis Capabilities In extending the capabilities of the current methods, to address more of the requisite regional planning issues, the most important element relates to the handling of transmission infrastructure costs; as mentioned above, the transmission data available to this effort this were quite limited. One capability that CHECC mentioned as desirable is the inclusion of pumped storage to help level the wind supply, reducing its variability. It would be not be difficult to incorporate such an option and to compare the cost with and without pumped storage. However, effectively evaluating the benefits of pumped storage would require a much richer model of both transmission cost and load flow on the transmission system. Both the data and the approach to those models would require close cooperation with the China State Grid Corporation, which operates the grid. A refined analysis will also require seasonal and diurnal wind resource profiles to compare to hydropower deployment. The strategy for enhancing the representation of transmission could be organized around a series of scenarios, each of which would correspond to a point on the geospatial supply curve. Given the point on the supply curve, the GIS portion would detail the locations of 6 Exclusion zones include national parks and historical zones such as the Great Wall, cropland, water bodies, and developed areas.
12

13
the wind farms contributing to the indicated supply. From that basis, load-flow modeling or other techniques would provide estimates of the costs of new transmission infrastructure. Further extensions could estimate the ancillary costs related to large wind farms, due to additional spinning reserve requirements and other requirements of grid integration. Coordinating with Chinese Counterparts Building on the present effort will require careful coordination with a much broader range of Chinese partners, including NDRC, the China State Grid Corporation, provincial planning officials, provincial energy regulators, and wind farm developers. It would be best to continue the work in the same mode pursued to this point: developing methods and techniques jointly with Chinese partners and developing an independent capacity in the Chinese counterpart organizations.

F1146-E(12/2004)
REPORT DOCUMENTATION PAGE Form Approved OMB No. 0704-0188
The public reporting burden for this collection of information is estimated to average 1 hour per response, including the time for reviewing instructions, searching existing data sources, gathering and maintaining the data needed, and completing and reviewing the collection of information. Send comments regarding this burden estimate or any other aspect of this collection of information, including suggestions for reducing the burden, to Department of Defense, Executive Services and Communications Directorate (0704-0188). Respondents should be aware that notwithstanding any other provision of law, no person shall be subject to any penalty for failing to comply with a collection of information if it does not display a currently valid OMB control number. PLEASE DO NOT RETURN YOUR FORM TO THE ABOVE ORGANIZATION.1. REPORT DATE (DD-MM-YYYY)
June 2008 2. REPORT TYPE
Technical Report 3. DATES COVERED (From - To)
4. TITLE AND SUBTITLE
A GIS Method for Developing Wind Supply Curves 5a. CONTRACT NUMBER
DE-AC36-99-GO10337
5b. GRANT NUMBER
5c. PROGRAM ELEMENT NUMBER
6. AUTHOR(S) D. Kline, D. Heimiller, and S. Cowlin
5d. PROJECT NUMBER NREL/TP-670-43053
5e. TASK NUMBER WF1F.1020
5f. WORK UNIT NUMBER
7. PERFORMING ORGANIZATION NAME(S) AND ADDRESS(ES)National Renewable Energy Laboratory 1617 Cole Blvd. Golden, CO 80401-3393
8. PERFORMING ORGANIZATIONREPORT NUMBER NREL/TP-670-43053
9. SPONSORING/MONITORING AGENCY NAME(S) AND ADDRESS(ES)
10. SPONSOR/MONITOR'S ACRONYM(S)NREL
11. SPONSORING/MONITORINGAGENCY REPORT NUMBER
12. DISTRIBUTION AVAILABILITY STATEMENT National Technical Information Service U.S. Department of Commerce 5285 Port Royal Road Springfield, VA 22161
13. SUPPLEMENTARY NOTES
14. ABSTRACT (Maximum 200 Words) This report describes work conducted by the National Renewable Energy Laboratory (NREL) as part of the Wind Technology Partnership (WTP) sponsored by the U.S. Environmental Protection Agency (EPA). This project has developed methods that the National Development and Reform Commission (NDRC) intends to use in the planning and development of China’s 30 GW of planned wind capacity. Because of China’s influence within the community of developing countries, the methods and the approaches here may help foster wind development in other countries.
15. SUBJECT TERMS NREL; David Kline; Donna Heimiller; Shannon Cowlin; China; geographic information system; GIS; Wind Technology Partnership; WTP; U.S. Environmental Protection Agency; EPA; Nation Development and Reform Commission; NDRC; wind resources; Zhangbei; China Hydropower Engineering Consulting Company
16. SECURITY CLASSIFICATION OF: 17. LIMITATION OF ABSTRACT
UL
18. NUMBER OF PAGES
19a. NAME OF RESPONSIBLE PERSON
a. REPORT Unclassified
b. ABSTRACT Unclassified
c. THIS PAGE Unclassified 19b. TELEPHONE NUMBER (Include area code)
Standard Form 298 (Rev. 8/98) Prescribed by ANSI Std. Z39.18