nrel - solar radiation modeling and measurements for renewable energy applications - data and model...
TRANSCRIPT
8/2/2019 NREL - Solar Radiation Modeling and Measurements for Renewable Energy Applications - Data and Model Quality
http://slidepdf.com/reader/full/nrel-solar-radiation-modeling-and-measurements-for-renewable-energy-applications 1/18
Solar Radiation Modeling andMeasurements for RenewableEnergy Applications: Data andModel Quality
Preprint
March 2003 • NREL/CP-560-33620
D.R. Myers
To be presented at the International Expert Conferenceon Mathematical Modeling of Solar Radiation and Daylight—Challenges for the 21
st Century
Edinburgh, Scotland September 15–16, 2003
National Renewable Energy Laboratory
1617 Cole BoulevardGolden, Colorado 80401-3393
NREL is a U.S. Department of Energy LaboratoryOperated by Midwest Research Institute • Battelle • Bechtel
Contract No. DE-AC36-99-GO10337

8/2/2019 NREL - Solar Radiation Modeling and Measurements for Renewable Energy Applications - Data and Model Quality
http://slidepdf.com/reader/full/nrel-solar-radiation-modeling-and-measurements-for-renewable-energy-applications 2/18
NOTICE
The submitted manuscript has been offered by an employee of the Midwest Research Institute (MRI), acontractor of the US Government under Contract No. DE-AC36-99GO10337. Accordingly, the USGovernment and MRI retain a nonexclusive royalty-free license to publish or reproduce the publishedform of this contribution, or allow others to do so, for US Government purposes.
This report was prepared as an account of work sponsored by an agency of the United Statesgovernment. Neither the United States government nor any agency thereof, nor any of their employees,makes any warranty, express or implied, or assumes any legal liability or responsibility for the accuracy,completeness, or usefulness of any information, apparatus, product, or process disclosed, or representsthat its use would not infringe privately owned rights. Reference herein to any specific commercialproduct, process, or service by trade name, trademark, manufacturer, or otherwise does not necessarilyconstitute or imply its endorsement, recommendation, or favoring by the United States government or anyagency thereof. The views and opinions of authors expressed herein do not necessarily state or reflectthose of the United States government or any agency thereof.
Available electronically at http://www.osti.gov/bridge
Available for a processing fee to U.S. Department of Energyand its contractors, in paper, from:
U.S. Department of EnergyOffice of Scientific and Technical InformationP.O. Box 62Oak Ridge, TN 37831-0062phone: 865.576.8401fax: 865.576.5728email: [email protected]
Available for sale to the public, in paper, from:U.S. Department of CommerceNational Technical Information Service5285 Port Royal RoadSpringfield, VA 22161phone: 800.553.6847fax: 703.605.6900email: [email protected] ordering: http://www.ntis.gov/ordering.htm
Printed on paper containing at least 50% wastepaper, including 20% postconsumer waste
8/2/2019 NREL - Solar Radiation Modeling and Measurements for Renewable Energy Applications - Data and Model Quality
http://slidepdf.com/reader/full/nrel-solar-radiation-modeling-and-measurements-for-renewable-energy-applications 3/18
1
Solar Radiation Modeling and Measurements for Renewable Energy
Applications: Data and Model Quality
Daryl R. Myers
National Renewable Energy Laboratory
1617 Cole Blvd Golden CO 80401
ABSTRACTMeasurement and modeling of broadband and spectral terrestrial solar radiation is important for theevaluation and deployment of solar renewable energy systems. We discuss recent developments in the
calibration of broadband solar radiometric instrumentation and improving broadband solar radiation
measurement accuracy. An improved diffuse sky reference and radiometer calibration and characterization
software and for outdoor pyranometer calibrations is outlined. Several broadband solar radiation model
approaches, including some developed at the National Renewable Energy Laboratory, for estimating direct beam, total hemispherical and diffuse sky radiation are briefly reviewed. The latter include the Bird clear
sky model for global, direct beam, and diffuse terrestrial solar radiation; the Direct Insolation Simulation
Code (DISC) for estimating direct beam radiation from global measurements; and the METSTAT
(Meteorological and Statistical) and Climatological Solar Radiation (CSR) models that estimate solar
radiation from meteorological data. We conclude that currently the best model uncertainties are
representative of the uncertainty in measured data.
1.0 Introduction
Just as the fossil fuel based energy industry relies on exploration and proven
reserves for discovery and economic support of energy markets, the renewable energy
sector depends upon the assessment of resources for planning and selling their energy
production technology. For solar-based renewable energy technologies such as solar thermal or photovoltaic conversion systems, the basic resource or fuel available is solar
radiation. Colle et al.,[1] have shown that uncertainty in life cycle savings for solar
thermal and photovoltaic (PV) systems are linearly correlated with uncertainty in solar
resource data.Assessment of the solar resource for these technologies is based upon measured
data, where available. However, the sparse distribution in space, and particularly over time, of measured solar data leads to the use of modeled solar radiation as the basis for
many engineering and economic decisions. Measured and modeled solar radiation have
attendant uncertainties. Most solar radiation models rely on measured data for their development or validation, and often the uncertainty or accuracy of that measured data is
unknown. Below, we identify the major components of uncertainty in measured solar
radiation data and characterize solar radiation modeling in general with respect to
uncertainties reported in the literature.
2.0 Solar Instrumentation Calibrations and Measurements
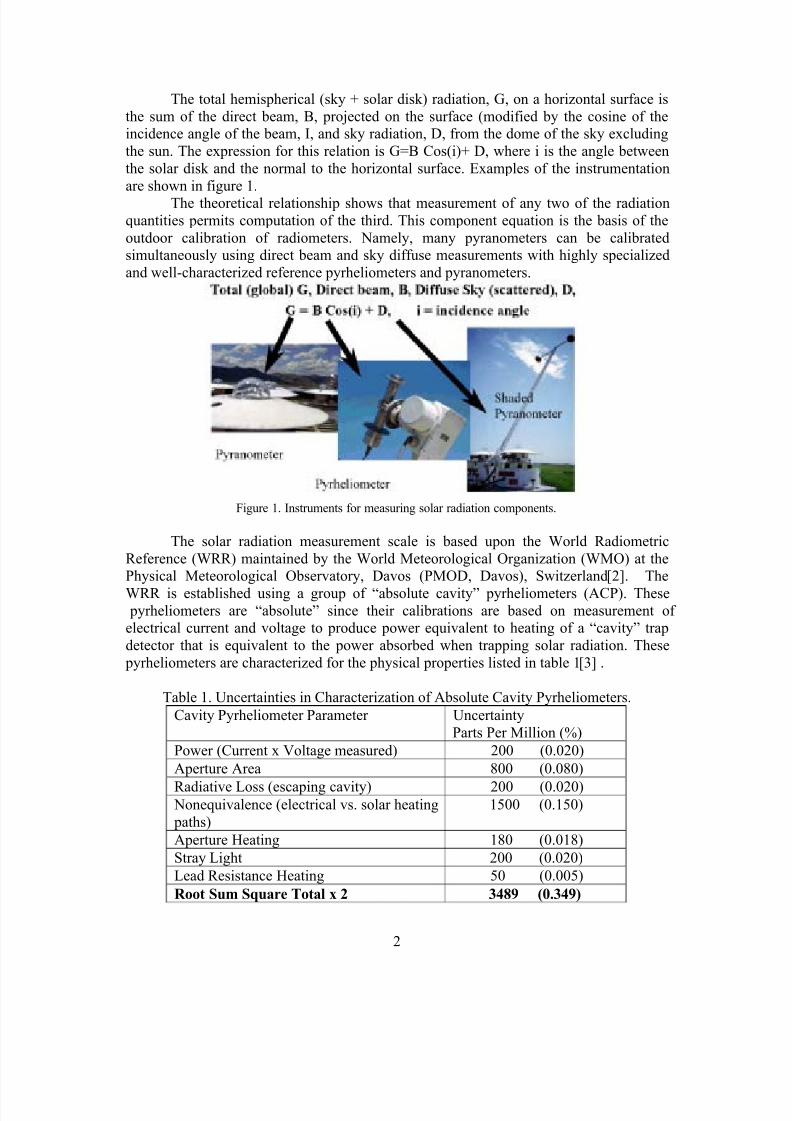
Terrestrial solar radiation measurements are based on pyranometers that respond
to radiation within a 2-pi steradian (hemispherical) field of view, and/or pyrheliometers,
narrow field of view instruments (5.8° to 5.0°) that measure the nearly collimated (i.e., parallel rays) radiation from the 0.5° diameter solar disk and a small part of the sky.
Hemispherical sky radiation can be measured by shading a pyranometer with a disk
located to subtend the same angular field of view as a pyrheliometer.
8/2/2019 NREL - Solar Radiation Modeling and Measurements for Renewable Energy Applications - Data and Model Quality
http://slidepdf.com/reader/full/nrel-solar-radiation-modeling-and-measurements-for-renewable-energy-applications 4/18

8/2/2019 NREL - Solar Radiation Modeling and Measurements for Renewable Energy Applications - Data and Model Quality
http://slidepdf.com/reader/full/nrel-solar-radiation-modeling-and-measurements-for-renewable-energy-applications 5/18
3
As shown in table 1, the overall uncertainty in the WRR scale is 0.35%. Working
reference cavity pyrheliometers used by solar radiation calibration laboratories arecompared outdoors with pyrheliometers embodying the WRR, resulting in an additional
0.1% transfer uncertainty. Working reference cavity radiometers are used as the reference
against which to calibrate both pyranometers and pyrheliometers used in the field. Thusthe uncertainty in the reference irradiance direct beam component measured with aworking reference ACP is 0.45%, or about 5 W/m2 at 1000 W/m2 direct irradiance.
The sky radiation component during an outdoor calibration requires characterizing the
responsivity of a reference pyranometer for the shaded, measurement[4] . The classical procedure for determining this responsivity is the shade/unshade technique. The
pyranometer under test is periodically shaded and unshaded with a disk subtending the
same solid angle as the field of view of the ACP. Assuming the pyranometer detector hasa perfect Lambertian response (directly proportional to the cosine of the incidence angle
of the radiation), the difference between the shaded and unshaded signals from the test
pyranometer is proportional to the vertical component of the direct beam radiation
measured with the ACP. Procedures for acquiring shade/unshade calibration data aredescribed in the American Society for Testing and Materials Standard E-913[4] . Figure
2 is a typical measurement sequence for such a calibration. Time period A is a 30-minute
stabilization period. Period B is 20 to 30 time constants (1/e, or 63% of final steady-statevalues) for the instrument response.
Figure 2. Classic schematic timing diagram for shade/unshade pyranometer calibration sequence.
Period C is 60 time constants for the instrument response. During period M at
least three readings of instrument shaded or unshaded response and the direct-beam
irradiance, are recorded. The mean incidence (zenith) angle and ACP data during themeasurement periods M are used in computing the B x cos(i) terms.
During such a characterization, additional sources of uncertainty may be present.
Thermopile-based pyranometers rely on the temperature difference between junctions of dissimilar metals in contact with a surface that absorbs solar radiation ("hot"
junctions) and reference, or "cold" junctions, that do not receive any solar radiation. In
Figure 3, the top unit is an example of an "all-black" sensor pyranometer. The bottom
unit has thermopile hot junctions in contact with a black absorbing surface and the
B
C
M
A

8/2/2019 NREL - Solar Radiation Modeling and Measurements for Renewable Energy Applications - Data and Model Quality
http://slidepdf.com/reader/full/nrel-solar-radiation-modeling-and-measurements-for-renewable-energy-applications 6/18
4
Figure. 3. All-black (top unit) and black-and-white thermopile pyranometers under
tracking shading disks.
reference cold junctions under a white surface
absorbing little shortwave solar radiation, anexample of a "black-and-white" sensor unit.
Pyranometers with all-black receivers
are rarely in thermal equilibrium outdoors.
Thermal energy is exchanged among theabsorbing sensor, dome, and sky. These
exchanges result in a net negative thermal
offset, Woff, in the thermopile voltage signal[5]. Black-and-white pyranometer thermal offsets
are smaller as all junctions see the same
thermal environment. Figure 4 is a plot of all- black (PSP) detector (lower line) and a black-
and-white detector (upper line) clear-sky
diffuse irradiance at NREL. The 20 W/m²
difference is approximately constant for clear-
sky conditions throughout the year, and it is thevalue of Woff in the following section on
uncertainty. The Woff for the black-and-whiteunits is about 2 W/m². We note that the thermal
offset is site dependent, depending upon the
thermal environment for the climate where theradiometer is deployed.
Figure 4. Black-and-White (top line) and all-black sensor clear sky diffuse irradiance demonstrating 20
W/m² thermal offset in all-black pyranometer on a clear day. The all-black unit has a faster time response.

8/2/2019 NREL - Solar Radiation Modeling and Measurements for Renewable Energy Applications - Data and Model Quality
http://slidepdf.com/reader/full/nrel-solar-radiation-modeling-and-measurements-for-renewable-energy-applications 7/18
5
Figure 5 shows the distribution of night-time themal offsets (an indicator of the
approximate magnitude of thermal offsets) for all-black sensors in a continental climate(at NREL, Golden Co) and a desert environment (12 station network in Saudi Arabia)
compared with night-time offsets for a black-and-white sensor.
Figure 5. Distribution of annual average night-time thermal zero-offsets for all-black sensors in a
continental (NREL) and a desert (12 station Saudi Arabian Network) climate. Black-and-white offset
distribution for comparison.
Using an all-black sensor pyranometer in conjunction with an ACP to compute a
reference hemispherical irradiance will lead to a low reference irradiance, and hence ahigher responsivity (output per irradiance unit) for the calibrated instruments. Since
calibration factors for computing irradiance are the recipricol of responsivity (irradiance
unit per output unit), most radiometers calibrated in recent years can be expected to haveunderestimated global irradiance on the order of 5 W/m2 to 20 W/m2 on clear days, (often
considered the easiest to model).
3.0 Solar Radiometer Response Characterization
Using the high accuracy ACP and well characterized reference pyranometer tocalibrate pyranometers for measuring hemispherical radiation, we find that the responseof each individual pyranometer is not flat, nor even representative of a make or model of
radiometer [6] . Figure 6 displays responsivities as a function of incidence angle (left) and
time of day (right). From such data, usually a single responsivity, or calibration factor
(say, at 45° incident angle) is selected for use with a data logger or for computing themeasured irradiance. Thus through part of the day, like a stopped clock which is correct
twice a day, the radiometer underestimates or overestimates the radiation when the single
calibration factor is applied. Note the range of responsivities for this instrument is +/-3.5% for incidence angles between 30° and 70°, with respect to 45°. This corresponds to
–35 W/m2 error at midday with respect to 1000 W/m2 clear day signal) and +15 W/m2

8/2/2019 NREL - Solar Radiation Modeling and Measurements for Renewable Energy Applications - Data and Model Quality
http://slidepdf.com/reader/full/nrel-solar-radiation-modeling-and-measurements-for-renewable-energy-applications 8/18
6
Figure 6. Pyranometer cosine response curve as function of incidence angle and time of day. Morning data
is "top" leg, afternoon data the "bottom" leg in left panel.
error in the morning or afternoon, with respect to a reasonable irradiance of 400 W/m2
at
those times.Pyrheliometers measuring the direct beam also show instrument responsivities,
varying by typically 1.5% to 2.0%, when mapped out during comparison with an ACP.The responsivities vary with metorological and possibly atmospheric conditions, even on
clear days, as shown in figure 7. For a 1000 W/m2 signal this amounts to irradiance errors
of 15 to 20 W/m2
when a single calibration factor is applied to compute the directradiation.
Figure 7. Variation in responsivity of normal incidence pyrheliometer calibrated by direct comparison with
absolute cavity radiometer. Variations are correlated with temperature, aerosol optical depth, wind speed
and wind direction.
If pyranometer data and pyrheliometer data are calibrated against an appropriatereference irradiance (i.e., black-and-white reference diffuse radiometer and ACP), and
responsivity correction curves are applied, the lowest uncertainty that can be approached
in any of the measured data is on the order of 1% of full scale (=1000 W/m2), of +/- 10
W/m2, as can be seen in the 0.5% spread of responsivity defining the characteristic curves
in figures 6 and 7, in addition to the 0.5% “base uncertainty” in the reference irradiance.

8/2/2019 NREL - Solar Radiation Modeling and Measurements for Renewable Energy Applications - Data and Model Quality
http://slidepdf.com/reader/full/nrel-solar-radiation-modeling-and-measurements-for-renewable-energy-applications 9/18
7
Table 2 shows uncertainty components for each individual responsivity
calculated, and typical uncertainty for measured data derived from using a singlecalibration “constant”[6] .
Table 2. Uncertainty components and combined uncertainty for solar radiometer
responsivities, and typical uncertainty limits for radiometric data obtained by using asingle calibration “constant”. Sensor Pyranometer Pyrheliometer
Uncertainty
Components
Uavg = Mean of base uncertainties (%)
Ustd = Standard deviation, base
RSmax = Highest responsivity (all data)
RSmin = Lowest responsivity (all data)
RS = Mean responsivity @ 45°
Urad = [ Uavg2 + (2 • Uavg ) 2 ]1/2
E+ = 100 • (RSmax – RS) / RS
E – = 100 • (RS – RSmin) / RS
Ustd = Standard deviation, base uncertainties
RSmax = Highest responsivity (all data)
RSmin = Lowest responsivity (all data)
Uavg = Mean of base uncertainties (%)
RS = Mean responsivity @ 45°
Range = 100 • (RSmax – RSmin) / RS
Combined
Uncertainty
U95+ = +(Urad + E+)
U95 – = –(Urad + E – )
U95 = [ Uavg2 + (2 • Ustd) 2 + (Range/2) 2
]1/2
Typical
Values
(30°<Z<70°)
+2.5 % – 10.0 %
of FULL SCALE = 1000 W/m2
=> +25 W/m2
to –100 W/m2
± 2.5 %
of FULL SCALE = 1000 W/m2
=> +25 W/m2
to -25 W/m2
Errors between +25 W/m2
to –100 W/m2
are possible in pyranometer data, and +/-25 W/m2 errors in pyrheliometer data can occur under clear sky conditions. Under near
isotropic conditions, or partly cloudy conditions, the errors will be less. These
instrumental errors are important only if modeling instantaneous, subhourly, or hourly
data, or daily profiles. Analysis of annual totals of corrected and uncorrected data hasshown differences of less than 0.1% in the result[7].
This exercise in radiometric metrology and uncertainty analysis shows that part of the root-mean-square or bias errors between hemispherical model validation data sets andmodels is contibuted from the instrumentation, and are not all due to model difficiencies.
4.0 Radiation Models for Solar Technology Applications
In the light of the above revelations concerning measurement data, we here describe the
needs of the solar technology community, and model approaches to meet those needs.
4.1 Technology Needs
Design of solar thermal and PV conversion systems require several types of data. Themain categories of data often requested by users are shown in table 3. As mentioned in
the introduction, uncertainty in economic analysis of solar energy systems is directly
proportional to the uncertainty in solar resource data. Colle et al.[1] show that the relative
uncertainty in life cycle savings is especially sensitive in cases of high capital cost or lowauxiliary energy cost. Many technologies depend on resources on a tilted surface.
However, tilt conversion models (such as that of Perez et al.[33]) generally begin with
resources on a horizontal surface, the most commonly measured and modeled parameter.

8/2/2019 NREL - Solar Radiation Modeling and Measurements for Renewable Energy Applications - Data and Model Quality
http://slidepdf.com/reader/full/nrel-solar-radiation-modeling-and-measurements-for-renewable-energy-applications 10/18
8
Table 3. Data formats requested by solar energy system designers and planners.
Type of Data
Time
Resolution Application
Hemispherical, vertical surface, cardinal dir. Seasonal/Daily Glazing energy balance (energy or power)
Illuminance, vertical surfaces, cardinal dir. Seasonal/Daily Daylighting
Hemispherical tilt Monthly/Annual Fixed Flat Plate
Hemispherical tracking Monthly/Annual Tracking Flat Plate
Direct normal Monthly/Annual Focusing/concentrating systems
Sunshape (disk+circumsolar) variation Varies Concentrating tracking collector
Monthly mean daily total Monthly/Daily Sizing and design specification, economics
Monthly mean Monthly Sizing and design specification, economics
Daily profiles Hourly System simulation modeling and rating
8760 Hourly data for year hemispherical
and/or directHourly System simulation, economic analysis
(multiple years for min/max performance)
10 to 30 year hourly power Hourly Performance and economics,system lifetime
Daily profiles power Sub Hourly System responses to clouds, etc.
At NREL, efforts to meet the need for hourly data have resulted in the Bird Clear Sky Model[8] and extensions to the METSTAT and CSR models of Maxwell[9, 10] .
METSTAT calculates radiation components from METeorological input parameters,
using empirical correlations to produce radiation estimates that have, on a monthly basis,
STATistical properties (moments, kurtosis) close to those of measured radiation data. Tomeet the need for monthly mean data, the NREL Climatological Solar Radiation (CSR)
model was developed. The CSR uses METSTAT algorithms with monthly mean inputs
derived from satellite products to produce estimates of monthly mean radiation on a 40km grid. For annual means of direct and hemispherical hourly data, the METSTAT
model has mean bias differences ranging from - 15% to + 15%, with mean of the absolute
value of the MBD for 33 sites in the US of 5.2% for the direct beam and 3.0% for hemispherical[11] . For the CSR model, mean of absolute value of bias differences
between modeled and measured hemispherical data annual mean monthly daily totals for
eight stations in Egypt was 1.0%, and mean random differences were 9.0%. A summaryof other model approaches and current estimates of their accuracy are compared with the
uncertainty in measured data in the following sections.
4.2 Sunshine Fraction and Hemispherical Solar Radiation
Much solar radiation data is available as a percent of available sunshine, or
sunshine duration, or hemispherical data on a horizontal surface. Many models for converting sunshine duration to hemispherical radiation and for converting hemispherical
data on a horizontal to tilted surface have been developed. The former rely on the
“Angstrom” relation, H/Hclear = a*(1-a)*S where H is hemispherical radiation on a
horizontal surface, and Hclear is a clear sky limit for hemispherical radiation, S issunshine fraction (of total possible) and a is a site dependent empirical constant. Hclear

8/2/2019 NREL - Solar Radiation Modeling and Measurements for Renewable Energy Applications - Data and Model Quality
http://slidepdf.com/reader/full/nrel-solar-radiation-modeling-and-measurements-for-renewable-energy-applications 11/18
9
is sometimes replaced with the extraterrestrial radiation on a horizontal surface, Ho, and
the relation is written as H/Ho = a + b*S. Many papers have been written on thesecorrelations. Gueymard et al.[12] give a detailed review of this approach, and the
problems arising from instrumental measures of S and seasonal and climate variability.
Improved Angstrom type models result in mean bias (MB) and root-mean-square
(RMS) differences from mean daily total observed radiation of –2% and 6% (-55 Wh/m
2
and 166 Wh/m2), respectively, at 10 MJ (2770 Wh/m2) and -11% and 16% (- 397 Wh/m2
and 577 Wh/m2), respectively, at 13 MJ (3610 Wh/m2). Note how these results are about
a factor of 2 to 4 larger than typical instrumental uncertainties in table 2 above, for measured hemispherical radiation.
A 1988 International Energy Agency repor t[13] on the validation of solar
radiation models declared “There is little to recommend sunshine based models. Eventhough the Angstrom equation can be easily tuned to a location’s climatic conditions by
simple regression, it requires the existence of radiation data in the first place to produce
the prediction equation…”
4.3 Direct Solar Radiation Models
Direct beam (pyrheliometer) data is sparse because of the added expense of therequired solar tracking equipment. The direct beam is also the fundamental starting point
for many solar radiation models. Modeling of the direct beam seems to be considered a
bit more straightforward than modeling of diffuse or global radiation. However, the samefactors complicating the modeling of diffuse or global radiation also affect the direct
beam. Absorbing and scattering processes in the atmosphere redistribute energy out of
the direct beam into the diffuse, and consequently into the total hemispherical radiation.
There are two approaches to modeling direct beam irradiance: models based on physical principals, and models for converting (or extracting) direct beam data from hemispherical
data.
Direct beam models based on physical principles apply cataloged absorption andscattering data, spectrally or as parameterized transmittance functions (for ozone,
atmospheric gases, water vapor, and molecular or Rayliegh scattering), to the
extraterrestrial direct beam spectral radiation.
4.3.1 Direct Beam from First Principles
“First principles” models of direct beam are actually spectral models, relying on
modification of the extraterrestrial direct beam spectrum by spectral absorption
parameters or coefficients. Examples are the so-called “line-by-line” or LBL models[14-
16] . An example is Fast Atmospheric Signature Code (FASCODE) developed by the Air Force Geophysical Laboratory (AFGL)[13]. These models are for narrow bandwidth
regions and require significant computational resources and storage space. LBL models
access databases, such as HITRAN[17] consisting of quantum parameters for manymolecular species (more than one million spectral lines). LBL models are too complex
and specialized for discussion here.
Less complex spectral “band” models are simplified LBL models as describedin[13]. Band models represent groups of absorption lines as transmittance functions of

8/2/2019 NREL - Solar Radiation Modeling and Measurements for Renewable Energy Applications - Data and Model Quality
http://slidepdf.com/reader/full/nrel-solar-radiation-modeling-and-measurements-for-renewable-energy-applications 12/18
10
parameters such as absorber concentration, pressure, and absorption coefficients.
MODTRAN (Moderate Resolution) and LOWTRAN (Low Resolution) developed byAFGL are popular, commercially available band models. “Low” resolution corresponds
to 20 wavenumbers (0.2 nm at 300 nm to 32 nm at 4000 nm) and “moderate” resolution
corresponds to two wavenumbers (0.02 nm at 300 nm to 3 nm at 4000 nm).
These models can address complex scenarios, including clouds, fog, smoke, manychoices of standard and user defined aerosol properties, atmospheric structure for up to
33 different layers, and extraterrestrial spectra. They are designed to compute
atmospheric transmittance between two points on or above the earth’s surface. The manycombinations of input parameters and their interaction require a great deal of
understanding by the user. Interpretation of the results is daunting as well.
Simpler spectral models are based on parameterizations of transmittance andabsorption functions for basic atmospheric constituents. These usually are molecular,
Rayliegh, ozone, water vapor, and aerosol transmittances. An extraterrestrial spectrum is
modified by the product of transmittance coefficients or functions and the path length and
geometry to produce the transmitted solar spectral distribution. There spectral resolution
is generally lower (on the order of nanometers) than that of complex models.SPCTRAL2, the simple spectral model of Bird[18], SEDES2 (derived from
SPCTRAL2)[19] and the Simple Model for Atmospheric Transmission of Sunshine(SMARTS2) of Gueymar d[20] represent this approach, after Leckner[21] . SEDES2 is a
modified version of SPCTRAL2 where cloud cover and measured broadband global
irradiance is used to modify the clear sky SPCTRAL2 model for use under cloudy skies.These models require fewer input parameters. They are useful for engineering
applications requiring less accuracy and resolution than complex models. MODTRAN
and SMARTS2 have been shown to agree to within better than 2%[19]. Integrated
spectral results from both have been used as benchmarks to evaluate the performance of broadband models.
4.3.2 Direct Beam Broadband Parameterization
Simple broadband models for clear sky atmospheric transmission of the direct
beam are based on the product of broadband extraterrestrial beam radiation and “bulk transmittance” functions. A chapter by Davies in a 1984 IEA report[22] describes these
models, of the form B=Bo e-a/m = Bo*T, where a is an absorption coefficient, m the air
mass. The exponential term represents a bulk transmittance (T) derived from Rayliegh(Tr), Ozone (To), water (Tw), aerosol (Ta), and mixed gas (Tg) transmittances. A more
common form of this approach is to apply the individual transmittances multiplicatively,
as in B= Bo*Tr*Ta*Tw*To*Tg. Davies[23] states that the “main uncertainty in
computing beam irradiance in either [of these forms] rests in defining appropriate valuesof Ta”.
Gueymard[24] reviewed 22 direct beam transmission models. He compared
model results with the SMARTS2 spectral direct beam model results as a reference. For 19 of the models, the MBE in the DNI estimate ranges from –11% to + 12% and the
RMSE differences ranged from 3% to 21% for mean irradiance of 423.4 W/m2. For 17 of
the models, the MBE was < 10%, and for 13 of the models, the RMSE was less than

8/2/2019 NREL - Solar Radiation Modeling and Measurements for Renewable Energy Applications - Data and Model Quality
http://slidepdf.com/reader/full/nrel-solar-radiation-modeling-and-measurements-for-renewable-energy-applications 13/18
11
10%. These represent bias and random errors of less than 45 W/m2, or about twice the +/-
25 W/m2
measurement uncertainty for pyrheliometers in table 2.Bird and Hulstrom[25] described five models, (Lacis and Hansen[26]; Atwater
and Ball[27]; Watt [28]; Hoyt[29]; and Davies and Hay[30]) and a variant of his own (the
“Bird” clear sky model mentioned above) that generate direct and hemispherical
radiation. Bird reported typical differences among the various model-derivedhemispherical radiation and a theoretical model references (BRITE Monte Carlo radiative
transfer code[31]) ranging from 7% to 10% for total irradiance levels between 1100
W/m2
and 200 W/m2
. This amounts to differences of 20 W/m2
to 100 W/m2, comparable
with pyranometer uncertainties of 25 W/m2 to 100 W/m2 in table 2.
4.3.3 Direct Irradiance from Conversion Models
A second approach to obtaining direct beam estimates is to convert existing
hemispherical data to direct beam irradiance. This is most generally done by developing
relationships between clearness indices (ratios of measured to extraterrestrial values of
radiation) denoted by Kt, after Liu and Jordan[32] . Sometimes other climatological or meteorological parameters (temperature, humidity, or cloud cover information) are also
used to augment the clearness index approach. Empirical correlations of diffuse to globalratios and diffuse to direct radiation can also be used to try and reduce errors in
computing hemispherical radiation from estimates of direct and diffuse radiation,
especially under non-clear skies. The Perez Anisotropic Diffuse Model[33] is anextensively validated model to convert hemispherical data on a horizontal surface to
hemispherical data on tilted surfaces by computing diffuse on the tilted surface.
Perez and Stewart, 1986[34]; Perez et al., 1990[35]; Perez et al., 1992[36]
reviewed the performance of global (on a horizontal surface) hemispherical to direct beam conversion models . In Perez et al., 1990[33], MBE of -50 to + 30 W/m2 and
RMSE of 85 W/m2 to 100 W/m2 for three different models are shown. The authors state
that the Maxwell DISC model performed the best, with the smallest MBE (25 W/m2) andRMSE (85 W/m2) under all conditions. In Perez et al., 1992[34] the authors reviewed five
models for deriving direct beam from hemispherical data. They evaluated performance
against measured data from 18 sites in the U.S. and Europe, again with typical bias errorsin the range of 25 W/m2 and RMSE errors on the order of 80 W/m2 – 100 W/m2.
Table 4 summarizes reported model uncertainties surveyed above, as well as more
recent work with satellite-based estimates of hemispherical radiation; which have rather larger bias and random components of error, as might be expected. For comparison
purposes, the table begins with typical estimated measurement data uncertainties.
5.0 Conclusion: Models Can Only Be Proven as Good as the Data
Comparing the highly summarized results above with the measurement
uncertainty reported in table 2, we conclude that at the beginning of the 21st
century,current solar radiation models and measurements are rather comparable, with absolute
measurement uncertainties on the order of 25 to 100 W/m2 in hemispherical measured
data, and +/-25 W/m2
in direct beam measured data. Many models are available for

8/2/2019 NREL - Solar Radiation Modeling and Measurements for Renewable Energy Applications - Data and Model Quality
http://slidepdf.com/reader/full/nrel-solar-radiation-modeling-and-measurements-for-renewable-energy-applications 14/18
12
estimating direct beam with bias errors of less than 50 W/m2 and random (model) errors
of less than 100 W/m2.
The challenge for solar radiation misprints and models in the 21st century is to
reduce the uncertainty in measured data, as well as develop more robust models (i.e.,
fewer input parameters and smaller residuals, under a wider variety of conditions). The
immediate remedy in the field of measurements is to apply appropriate detailedcorrections to measured data, using functions developed from the individual response
curves of instruments, as shown in figure 6 and 7. The long-term preference is for more
accurate instrumentation with better geometrical and temperature response. In any case,models developed or validated on the basis of existing measured data are limited, at best,
to the measurement uncertainties quoted above.

8/2/2019 NREL - Solar Radiation Modeling and Measurements for Renewable Energy Applications - Data and Model Quality
http://slidepdf.com/reader/full/nrel-solar-radiation-modeling-and-measurements-for-renewable-energy-applications 15/18
13
Table 4. Summary of quoted uncertainties for various broadband solar radiation modelsreviewed in the literature.Radiation
Component
Reference/Model Bias Random Comments
All sky Direct MEASURED DATA 2% 1% (about
responsivitycurve)
Single (mean)
responsivity
All SkyHemispherical
MEASURED DATA 10% 1% (aboutresponsivity
curve)
Singleresponsivity @
45° reference
Direct and
Hemispherical
All sky
Maxwell 1998 Metstat[9] 5.2% (Direct)
3.0 %
(Hemispherical)
8%-10% Annual Mean
daily total;
33 U.S.measurement sites
Direct andHemispherical
All sky
Maxwell CSR[10] 1.0 % 7.0% Monthly meandaily total 8
Egyptian
measurement sites
Hemispherical Gueymard/Angstrom[12] -2% + 15% Annual meandaily total 2
models, 3Canadian sites
Direct, Clear Sky Gueymard Direct
Transmit (personal
Comm.)
+/- 10% +/- 10% Mean of 17 best
out of 22 models;
reference
SMARTS2
spectral
integrations
Hemispherical,Clear Sky
Bird & Hulstrom /Hemispherical[25]
7% - 10% Mean of 5 models,Reference BRITE
spectral
integrationsDirect fromHemispherical,
all sky
Perez 1990Conversion[35]
5% 8.5% Mean of 3 GH->DNI conversions
Direct from
Hemispherical,all sky
Perez 1992
Conversion[36]
3% 8.5% 5 models; 18 US
& European sites
All sky
Hemispherical
from satellite
Skartveit, et al. 1998[37] 2.3% 11% 5 models ; 4
European sites
All Sky
Hemispherical
Gul et al. 1998[38] 5.0% 8.0 % 3 models, ref 1000
w/m2; 12 UK
stations
All SkyHemisphericalfrom Satellite
Zelenka et al. 1999[39] 12%-15% 20% 31 Swiss, 12 USmeasurementstations
Hemispherical
on inclined
surfaces
converted todirect
Redmund et al. 1998[40] 10%-20%
(Hemispherical)
64 Swiss stations;
stochastic time
series estimation

8/2/2019 NREL - Solar Radiation Modeling and Measurements for Renewable Energy Applications - Data and Model Quality
http://slidepdf.com/reader/full/nrel-solar-radiation-modeling-and-measurements-for-renewable-energy-applications 16/18
14
References
[1] Colle S, De Abreu, SL, Ruther R. Uncertainty in economic analysis of solar water heating and
photovoltaic systems. Solar Energy, 2001. 70(2): p. 131-142.[2] WMO. Omm no. 8 guide to meteorological instruments and methods of observation. 5th ed. Omm. Vol.
No. 8. 1983, Geneva, Switzerland: Secretariat of the World Meteorological Organization.
[3] WMO. International pyrheliometer comparison viii. Working Report No 188 1996 WorldMeteorological Organization.
[4] ASTM. Astm 913-82 method for calibration of reference pyranometers with axis vertical by the shading
method. 1997 American Society for Testing and Materials.
[5] Dutton EG, Michalsky JJ, Stoffel T, Forgan BW, Hickey J, Alberta TL, Reda I. Measurement of broadband diffuse solar irradiance using current commercial instrumentation with a correction for
thermal offset errors. Journal of Atmospheric and Oceanic Technology, 2001. 18(3): p. 297-314.
[6] Myers DR, Stoffel TL, Wilcox S, Reda I, Andreas A. Recent progress in reducing the uncertainty in
and improving pyranometer calibrations. Journal of Solar Energy Engineering, 2002. 124: p. 44-50.
[7] Wilcox S, bin Mahfoodh M, Al-Abbadi N, Alawaji S, Myers D. Improving global solar radiationmeasurements using zenith angle dependent calibration factors. in Forum 2001 Solar Energy, ThePower to Choose. 2001. Washington D.C: American Solar Energy Society.
[8] Bird R E, Hulstrom R L. A simplified clear sky model for direct and diffuse insolation on horizontal
surfaces, seri/tr-642-751. Golden, CO: Solar Energy Research Institute (now National RenewableEnergy Laboratory), 1981.
[9] Maxwell EL. Metstat-the solar radiation model used in the production of the national solar radiationdata base (nsrdb). Solar Energy, 1998. 62(4): p. 263-279.
[10] Maxwell EL, George RL, Wilcox SM. A climatological solar radiation model. in 1998 Annual
Conference- American Solar Energy Society. 1998. Albuquerque, NM: American Solar Energy
Society.
[11] NREL. Final technical report national solar radiation data base (1961-1990), nrel/tp 463-5784.Golden, CO: National Renewable Energy Laboratory, 1995.
[12] Gueymard C, Jindra P, Estrada-Cajigal V. A critical look at recent interpretations of the angstrom
approach and its future in global solar radiation prediction. Solar Energy, 1995. 54(5): p. 357-363.
[13] IEA. International energy agency validation of models for estimating solar radiation on horizontal
surfaces. 1988: Atmospheric Environment Service (Now Environment Canada).
[14] Anderson G P, et al. Modtran2: Suitability for remote sensing. in Atmospheric Propagation and
Remote Sensing. 1993: Society of Photo-Optical Instrumentation Engineers.[15] Anderson GP, et al. History of one family of atmospheric radiative transfer codes. in Passive Infrared
remote Sensing of Clouds and the Atmosphere II. 1994: Society of Photo-optical Instrumentation
Engineers.
[16] Anderson GP, et al. Reviewing atmospheric radiative transfer modeling: New developments in high
and moderate resolution fascode/fase and modtran. in Optical Spectroscopic Techniques andInstrumentation for Atmospheric and Space Research II. 1996: Society of Photo-OpticalInstrumentation Engineers.
[17] Rothman LS, et al. The hitran molecular spectroscopic database and hawks (hitran atmospheric
workstation): 1996 edition. J. Quant. Spectrosc. Radiat. Trans., 1998. 60: p. 665-710.
[18] Bird RE. A simple, solar spectral model for direct-normal and diffuse horizontal irradiance. Solar
Energy, 1984. 32(4): p. 461-471.[19] Nann S Riordan C. Solar spectral irradiance under clear and cloudy skies: Measurements and a
semiempirical model. J. Appl. Meteorol., 1991. 30: p. 447-462.[20] Gueymard C. Parameterized transmittance model for direct beam and circumsolar spectral irradiance.
Solar Energy, 2001. 71(5): p. 325-346.
[21] Leckner B. The spectral distribution of solar radiation at the earth's surface—elements of a model. Solar Energy, 1978. 20: p. 143-150.
[22] IEA. International energy agency handbook of methods of estimating solar radiation. 1984 The
Swedish Meteorological and Hydrological Institute.

8/2/2019 NREL - Solar Radiation Modeling and Measurements for Renewable Energy Applications - Data and Model Quality
http://slidepdf.com/reader/full/nrel-solar-radiation-modeling-and-measurements-for-renewable-energy-applications 17/18
15
[23] Davies J A, Models for estimating incoming solar irradiance, in Handbook of methods for estimating
solar radiation. 1984, Swedish Meteorological and Hydrological Institute: Norkopping, Sweden. p. 85-
106.[24] Gueymard C. Detailed assessment of accuracies achievable in broadband direct transmittance and
irradiance predictions with moderate- and high-performance models. Solar Energy, 2003. (Submitted,
Dec 2002).
[25] Bird R E, Hulstrom R L. Direct insolation models, seri/tr-335-344. Golden, CO: Solar Energy
Research Institute (now National Renewable Energy Laboratory), 1980.
[26] Lacis A L, Hansen J E. A parameterization of absorption of solar radiation in the earth's atmosphere. Journal of Atmospheric Science, 1974. 31: p. 118-133.
[27] Atwatter M A, Ball JT. A numerical solar radiation model based on standard meteorological
observations. Solar Energy, 1978. 21: p. 163-170.
[28] Watt D. On the nature and distribution of solar radiation, hcp/t2552-01. Washington, DC: U.S.
Department of Energy. 1978.
[29] Hoyt DV. A model for the calculation of solar global radiation. Solar Energy, 1978. 21: p. 27-35.[30] Davies JA, Hay JE. Calculation of the solar radiation incident on a horizontal surface. in Proceedings,
First Canadian Solar Radiation Data Workshop. 1979: Canadian Atmospheric Environment Service
(now Environment Canada) Downsview, ON.
[31] Blättner WG, et al. Monte carlo studies of the sky radiation at twilight. Appl. Opt., 1974. 13: p. 534-
537.
[32] Liu BYH, Jordan RC. The interrelationship and characteristic distribution of direct, diffuse, and totalsolar radiation. Solar Energy, 1960. 4: p. 1-19.
[33] Perez R, Stewart R, Arbogast R, Seals R, Scott J. An anisotropic hourly diffuse radiation model for
sloping surfaces: Description, performance validation, site depenency evaluation. Solar Energy, 1986.36(6): p. 481-497.
[34] Perez R, Stewart R. Solar irradiance conversion models. Solar Cells, 1986. 18: p. 213-222.[35] Perez R, Seals R, Zelenka A, Ineichen P. Climatic evaluation of models that predict hourly direct
irradiance: Prospects for performance improvements. Solar Energy, 1990. 44(2): p. 99-108.
[36] Perez R, Seals R, Ineichen P, Zelenka A, Maxwell EL. Dynamic global-to-direct irradiance
conversion models. ASHRAE Transactions, Research, 1992. 3578(RP-644): p. 354-369.
[37] Skartveit A, Olseth JA, Tuft ME. An hourly diffuse fraction model with correction for variability and
surface albedo. Solar Energy, 1998. 63(3): p. 173-183.[38] Gul MS, Muneer T, Kambezidis HD. Models for obtaining solar radiation data from other
meteorological data. Solar Energy, 1998. 64(1-3): p. 99-108.[39] Zelenka A, Perez R, Seals R, Renne R. Effective accuracy of satellite-derived hourly irradiances .
Theoretical Applied Climatology, 1999. 62: p. 199-207.
[40] Redmund J, Salvisberg E, Kunz S. On the generation of hourly shortwave radiation on tilted surfaces.
Solar Energy, 1998. 62(5): p. 331-344.

8/2/2019 NREL - Solar Radiation Modeling and Measurements for Renewable Energy Applications - Data and Model Quality
http://slidepdf.com/reader/full/nrel-solar-radiation-modeling-and-measurements-for-renewable-energy-applications 18/18
REPORT DOCUMENTATION PAGE Form Approved
OMB NO. 0704-0188
Public reporting burden for this collection of information is estimated to average 1 hour per response, including the time for reviewing instructions, searching existing data sources,gathering and maintaining the data needed, and completing and reviewing the collection of information. Send comments regarding this burden estimate or any other aspect of thiscollection of information, including suggestions for reducing this burden, to Washington Headquarters Services, Directorate for Information Operations and Reports, 1215 JeffersonDavis Highway, Suite 1204, Arlington, VA 22202-4302, and to the Office of Management and Budget, Paperwork Reduction Project (0704-0188), Washington, DC 20503.
1. AGENCY USE ONLY (Leave blank) 2. REPORT DATE
March 20033. REPORT TYPE AND DATES COVERED
Conference Paper Preprint
4. TITLE AND SUBTITLE
Solar Radiation Modeling and Measurements for Renewable Energy Applications: Dataand Model Quality; Preprint
6. AUTHOR(S)
D.R. Myers
5. FUNDING NUMBERS
PVP3.7401
7. PERFORMING ORGANIZATION NAME(S) AND ADDRESS(ES)
National Renewable Energy Laboratory1617 Cole Blvd.Golden, CO 80401
8. PERFORMING ORGANIZATIONREPORT NUMBER
NREL/CP-560-33620
9. SPONSORING/MONITORING AGENCY NAME(S) AND ADDRESS(ES) 10. SPONSORING/MONITORING AGENCY REPORT NUMBER
11. SUPPLEMENTARY NOTES
12a. DISTRIBUTION/AVAILABILITY STATEMENT
National Technical Information ServiceU.S. Department of Commerce5285 Port Royal Road
Springfield, VA 22161
12b. DISTRIBUTION CODE
13. ABSTRACT (Maximum 200 words) Measurement and modeling of broadband and spectral terrestrial solar radiation is important for the
evaluation and deployment of solar renewable energy systems. We discuss recent developments in the calibration of broadband solar
radiometric instrumentation and improving broadband solar radiation measurement accuracy. An improved diffuse sky reference and
radiometer calibration and characterization software and for outdoor pyranometer calibrations is outlined. Several broadband solar
radiation model approaches, including some developed at the National Renewable Energy Laboratory, for estimating direct beam, total
hemispherical and diffuse sky radiation are briefly reviewed. The latter include the Bird clear sky model for global, direct beam, and
diffuse terrestrial solar radiation; the Direct Insolation Simulation Code (DISC) for estimating direct beam radiation from global
measurements; and the METSTAT (Meteorological and Statistical) and Climatological Solar Radiation (CSR) models that estimate solar
radiation from meteorological data. We conclude that currently the best model uncertainties are representative of the uncertainty in
measured data.
15. NUMBER OF PAGES 14. SUBJECT TERMS
Modeling; broadband; spectral terrestrial solar radiation; calibration; solar radiometricinstrumentation 16. PRICE CODE
17. SECURITY CLASSIFICATIONOF REPORT
Unclassified
18. SECURITY CLASSIFICATIONOF THIS PAGE
Unclassified
19. SECURITY CLASSIFICATIONOF ABSTRACT
Unclassified
20. LIMITATION OF ABSTRACT
UL
NSN 7540-01-280-5500 Standard Form 298 (Rev. 2Prescribed by ANSI Std. Z
29