nrel-general mechanical design of 2 blade turbine hub
DESCRIPTION
Paper published by NREL on the mechanical design of a 2 bladed wind turbineTRANSCRIPT

The Mechanical Design,Analysis, and Testing of aTwo-Bladed Wind Turbine Hub
June 2002 � NREL/TP-500-26645
J. Cotrell
National Renewable Energy Laboratory1617 Cole BoulevardGolden, Colorado 80401-3393NREL is a U.S. Department of Energy LaboratoryOperated by Midwest Research Institute •••• Battelle •••• Bechtel
Contract No. DE-AC36-99-GO10337

National Renewable Energy Laboratory1617 Cole BoulevardGolden, Colorado 80401-3393NREL is a U.S. Department of Energy LaboratoryOperated by Midwest Research Institute •••• Battelle •••• Bechtel
Contract No. DE-AC36-99-GO10337
June 2002 � NREL/TP-500-26645
The Mechanical Design,Analysis, and Testing of aTwo-Bladed Wind Turbine Hub
J. CotrellPrepared under Task No. WER2.1460

NOTICE
This report was prepared as an account of work sponsored by an agency of the United Statesgovernment. Neither the United States government nor any agency thereof, nor any of their employees,makes any warranty, express or implied, or assumes any legal liability or responsibility for the accuracy,completeness, or usefulness of any information, apparatus, product, or process disclosed, or representsthat its use would not infringe privately owned rights. Reference herein to any specific commercialproduct, process, or service by trade name, trademark, manufacturer, or otherwise does not necessarilyconstitute or imply its endorsement, recommendation, or favoring by the United States government or anyagency thereof. The views and opinions of authors expressed herein do not necessarily state or reflectthose of the United States government or any agency thereof.
Available electronically at http://www.osti.gov/bridge
Available for a processing fee to U.S. Department of Energyand its contractors, in paper, from:
U.S. Department of EnergyOffice of Scientific and Technical InformationP.O. Box 62Oak Ridge, TN 37831-0062phone: 865.576.8401fax: 865.576.5728email: [email protected]
Available for sale to the public, in paper, from:U.S. Department of CommerceNational Technical Information Service5285 Port Royal RoadSpringfield, VA 22161phone: 800.553.6847fax: 703.605.6900email: [email protected] ordering: http://www.ntis.gov/ordering.htm
Printed on paper containing at least 50% wastepaper, including 20% postconsumer waste

I
AcknowledgmentsI thank Sandy Butterfield, Jim Johnson, and Lee Fingersh for their invaluableexpertise, enthusiasm, and guidance on the hub design. I acknowledge MurelO�Neal�s skill in supervising the construction of the hub and willingness toincorporate my numerous design changes. I thank my academic advisor,William F. Weldon, for his expertise, advice, and support, and I acknowledgeScott Larwood�s and Allyson Turk�s help in proofreading my many drafts.
Presented to the faculty of the Graduate School of the University of Texas atAustin in partial fulfillment of the requirements for the degree of Master ofScience in Engineering, The University of Texas at Austin, December 1997.

II
AbstractResearchers at the National Wind Technology Center (NWTC) in Golden,Colorado, began performing the Unsteady Aerodynamics Experiment in 1993 tobetter understand the unsteady aerodynamics and structural responses ofhorizontal-axis wind turbines. The experiment consists of an extensivelyinstrumented, downwind, three-bladed, 20-kilowatt wind turbine. In May 1995,I received a request from the NWTC to design a two-bladed hub for theexperiment. For my thesis, I present the results of the mechanical design,analysis, and testing of the hub.
The hub I designed is unique because it runs in rigid, teetering, or independentblade-flapping modes. In addition, the design is unusual because it uses twoservomotors to pitch the blades independently. These features are used toinvestigate new load reduction, noise reduction, blade pitch optimization, andyaw control techniques for two-bladed turbines.
I used a methodology by G. Phal and W. Bietz to design the hub. The hub meetsall the performance specifications except that it achieves only 90% of thespecified teeter range.
In my thesis, I focus on the analysis and testing of the hub body. I performedsolid-mechanics calculations, ran a finite-element analysis simulation, andexperimentally investigated the structural integrity of the hub body. Both thepredicted and experimental results indicate that the hub body is structurallyadequate.

III
Table of ContentsTable of Contents ................................................................................................ IIIList of Tables ........................................................................................................VList of Figures..................................................................................................... VI
Chapter 1. Introduction ........................................................................................11.1 The History and Present State of Wind Energy.........................1
1.1.1 Description of Modern Wind Turbines...............................21.1.2 Two-Bladed vs. Three-Bladed Designs ..............................4
1.2 The Need to Design an Experimental Two-Bladed Hub...........51.2.1 The Unsteady Aerodynamics Experiment ..........................5
1.3 Project History and Scope .........................................................6
Chapter 2. Design of the Hub ..............................................................................82.1 Clarification of the Task Phase..................................................8
2.1.1 Problem Statement and Scope ............................................82.1.2 Design Specifications .........................................................9
2.2 Conceptual Design Phase ........................................................122.2.1 Hub Body Solution Principles ..........................................142.2.2 Pitch Actuator Solution Principles....................................202.2.3 Cone Angle Linkage Solution Principles..........................222.2.4 Teeter-Bearing Solution Principles...................................222.2.5 Thrust-Bearing Solution Principles ..................................232.2.6 Teeter Damper Solution Principles...................................25
2.3 Embodiment and Detailed Design Phases ...............................28
Chapter 3. Predicted Strength of the Hub Body.................................................293.1 Wind Turbine Input Loads ......................................................293.2 Strength-of-Materials Calculations .........................................34
3.2.1 Simplifying Assumptions .................................................343.2.2 Analytical Calculations for the Flapwise Load Case ........363.2.3 Analytical Calculations for Lead-Lag Load Case .............43
3.3 Finite-Element Analysis ..........................................................473.3.1 FEA Meshing and Modeling Assumptions.......................483.3.2 Input Loads .......................................................................503.3.3 Finite-Element Analysis Results.......................................51
3.4 Comparison of Analytical and Finite-Element Results ...........53

IV
Chapter 4. Experimental Results .......................................................................544.1 Experiment Setup ....................................................................54
4.1.1 Load Application ..............................................................574.1.2 Data Acquisition ...............................................................584.1.3 Test Procedure ..................................................................59
4.2 Discussion and Comparison of the Flapwise Load Case Results .....................................................................................60
4.2.1 Hard-Link Mount Observations........................................604.2.2 Teeter-Pin Observations ...................................................614.2.3 Hub Body Observations....................................................62
4.3 Discussion and Comparison of the Lead-Lag Load CaseResults.....................................................................................65
4.3.1 Teeter-Pin Observations ...................................................654.3.2 Hub Body Observations....................................................65
Chapter 5. Conclusions and Recommendations.................................................695.1 Design Methodology ...............................................................695.2 Analysis and Testing ...............................................................715.3 Future Work.............................................................................72
Appendix A. Hub Body Experiment Data...........................................................73Bibliography ........................................................................................................78

V
List of Tables
Table 2.1. Hub Specifications List. .....................................................................10Table 2.2. Hub Components and Their Functions...............................................13Table 3.1. List of Primary Calculations Performed on the Hub. .........................29Table 3.2. Hub Reactions Resulting from Aerodyanmic and Inertial Loads.......31Table 3.3. Parameters Used to Calculate the Lift on Each Blade........................32Table 3.4. Load Relationships for the Flapwise Load Case. ..............................37Table 3.5. Input and Reaction Forces for the Hub Body Flapwise Load Case...38Table 3.6. Geometric Properties for the Cross Sections of Interest.....................40Table 3.7. Loads and Stresses Due to the Flapwise Load Set. ............................43Table 3.8. Load Relationships for the Lead-Lag Load Case. ..............................44Table 3.9. Input and Reaction Forces for the Hub Body Analytical Analysis for
the Lead-Lag Load Case. ....................................................................45Table 3.10. Load and Stress Calculation Summary for the Lead-Lag Load Case
Analytical Analysis. .........................................................................47Table 3.11. Summary of Results for the Analytical Analysis. ...........................47Table 3.12. Summary of Results for the Numerical Analysis. ...........................52Table 3.13. Comparison of the Analytical and Numerical Stress Values. ..........53Table 4.1. Dial Gauge Locations for the Lead-Lag and Flapwise Experimental
Tests...................................................................................................59Table 4.2. Flapwise Stiffness Values for the Hub Body......................................64Table 4.3. Structural Stiffness Values for the Hub Body during Lead-Lag
Loading. ..............................................................................................67

VI
List of Figures
Figure 1.1. Horizontal-axis and vertical-axis wind turbines . ..............................2Figure 1.2. Horizontal-axis wind turbine configurations. ....................................3Figure 1.3. Schematic of the AWT-26 nacelle and rotor......................................4Figure 2.1. The Unsteady Aerodynamics Experiment........................................12Figure 2.2. Two-bladed hub concept variant. .....................................................14Figure 2.3. Drawings of the center-clamping and box-style body principles. ....16Figure 2.4. Load paths through the box-style and center-clamping body solution
principles..........................................................................................17Figure 2.5. Photograph of the pitch actuation system. .......................................21Figure 2.6. AWT-26 teeter-bearing assembly. ...................................................24Figure 2.7. Centered thrust-bearing adjuster principle used in the final design. 25Figure 2.8. Teeter damper mechanism for the AWT-26 machine. .....................26Figure 2.9. Telescoping guide for the teeter dampers. .......................................27Figure 3.1. Hub body reaction terminology........................................................30Figure 3.2. Worst-case aerodynamic scenarios. .................................................33Figure 3.3. Simplified hub body model. .............................................................36Figure 3.4. Free-body side view and front view for the flapwise load case. ......37Figure 3.5. Free-body, shear, and bending moment diagrams of the web for the
flapwise load case. ...........................................................................39Figure 3.6. Web sections of interest for the analytical calculations. ..................40Figure 3.7. Approximate geometry of cross section C-D. ..................................41Figure 3.8. Approximate geometry of cross section A-B. ..................................41Figure 3.9. Approximate geometry of cross section E-F....................................42Figure 3.10. Free-body front view for the lead-lag case......................................44Figure 3.11. Free-body diagram of the web for the lead-lag load case................46Figure 3.12. Loads and boundary conditions for the finite-element analysis. .....50Figure 3.13. Von Mises stress plot for the flapwise load case. ...........................51Figure 3.14. Von Mises stress plot for the lead-lag load case. ............................52Figure 4.1. Photograph of the experiment setup................................................55Figure 4.2. Close-up photograph of the flapwise test configuration. ................55Figure 4.3. Close-up photograph of the lead-lag test configuration. .................56Figure 4.4. Photograph of the test stand. ...........................................................57Figure 4.5. Photograph of a hard-link mount. ...................................................60Figure 4.6. Predicted and experimental deflections for the flapwise load case.62Figure 4.7. Predicted and experimental deflections for the lead-lag load case. 66

1
1. IntroductionIn this thesis, I describe the design, analysis, and testing of an experimental, two-bladed, teetering, wind turbine hub. In this chapter, I present a brief history ofwind turbine technology, an overview of modern wind turbines, and adescription of the design problem.
1.1 The History and Present State of Wind Energy
Humans have been developing wind turbines for more than 2000 years.According to D.J. De Renzo in his book Wind Power: Recent Developments, thefirst wind turbines were most likely simple vertical-axis mills used to grind grainin Persia around 200 B.C. By the 11th century A.D., windmills had spreadthroughout the Middle East, and by the 13th century, returning Crusadersintroduced the technology to Europe [1].
By the 14th century, the Dutch had the leading windmill technology. The Dutchused windmills extensively to drain the marshes and lakes of the Rhine Riverdelta. In the 16th century, Holland began building wind-powered paper mills, oilmills, and sawmills.
By the early 20th century, windmills were used extensively throughout the worldto pump water in rural areas. This mode of water pumping is still importanttoday for those in developing countries and for those living beyond the reach ofpower lines.
In the early 1980s, wind energy development in modern countries focused ongenerating electricity from centralized arrays of wind turbines called wind farms[2]. The high oil prices resulting from the U.S. oil crises in the late 1970s madewind farms feasible. As a result, the U.S. wind industry grew at anunprecedented rate. However, at the end of that decade, the oil crises eased andU.S. tax exemptions expired, causing the wind turbine boom to subside.
Recently, the wind industry has begun to boom again, and wind energy hasbecome the fastest-growing energy source. According to Paul Gipe, in 1996more than 25,000 wind turbines worldwide generated more than 7 terawatt-hours(TWh), or roughly 1% of the world�s annual electricity demand. By the year2000, wind energy generation is expected to increase 60% to 11 TWh [3].

2
New engineering technologies have decreased the installed price of wind energyfrom 35 cents per kilowatt-hour (kWh) in 1980 to less than 5 cents per kWhtoday [4]. Although gas-fired turbines can produce electricity for roughly 2.5cents per kWh, the future of wind energy remains bright [5]. Newmanufacturing techniques, materials, and improved engineering technologiescontinue to decrease the cost of wind energy. In addition, large developingcountries such as India and China have made commitments to renewable energysources that hold great promise for the future of wind energy.
1.1.1 Description of Modern Wind Turbines
�Wind turbines,� �wind systems,� or �wind machines� are accepted terms fordevices that extract power from the wind and produce mechanical or electricalpower [6]. The term �wind turbine� is often reserved for machines that userotors as wind energy collectors.
Wind turbines are classified as horizontal-axis (HAWTs) or vertical-axisturbines (VAWTs) (see Figure 1.1.) Nearly all wind turbines manufacturedtoday are horizontal-axis. Vertical-axis machines have been plagued with blade-fatigue problems. In addition, the rotors on VAWTs are typically lower thanthose of HAWTs. The latter positioning presents a disadvantage because thevelocity of the wind decreases near the ground.
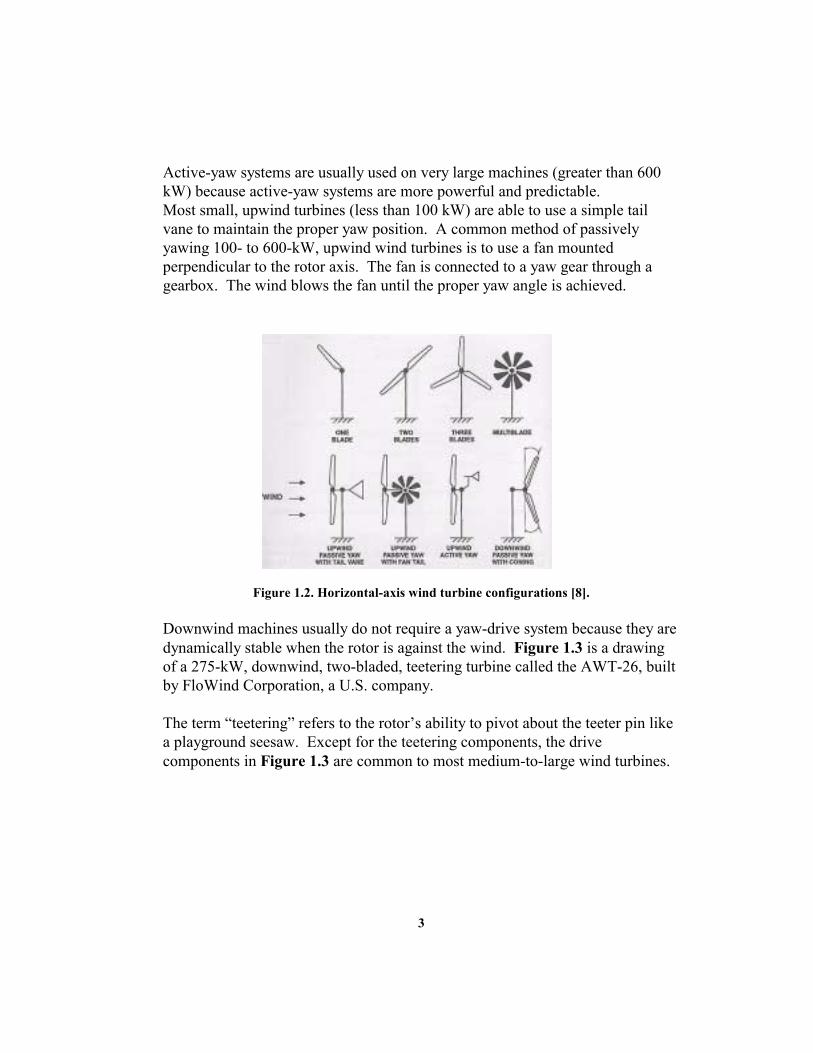
Most HAWTs have two or three blades. The blades can be oriented upwind ordownwind of the tower (see Figure 1.2). Horizontal-axis wind turbines areactively or passively yawed to face the rotor into the wind. Active-yawmachines use a wind direction sensor and yaw motor to position the rotor.
Figure 1.1. Horizontal-axis and vertical-axis wind turbines [7].
3
Active-yaw systems are usually used on very large machines (greater than 600kW) because active-yaw systems are more powerful and predictable.Most small, upwind turbines (less than 100 kW) are able to use a simple tailvane to maintain the proper yaw position. A common method of passivelyyawing 100- to 600-kW, upwind wind turbines is to use a fan mountedperpendicular to the rotor axis. The fan is connected to a yaw gear through agearbox. The wind blows the fan until the proper yaw angle is achieved.
Figure 1.2. Horizontal-axis wind turbine configurations [8].
Downwind machines usually do not require a yaw-drive system because they aredynamically stable when the rotor is against the wind. Figure 1.3 is a drawingof a 275-kW, downwind, two-bladed, teetering turbine called the AWT-26, builtby FloWind Corporation, a U.S. company.
The term �teetering� refers to the rotor�s ability to pivot about the teeter pin likea playground seesaw. Except for the teetering components, the drivecomponents in Figure 1.3 are common to most medium-to-large wind turbines.

4
Figure 1.3. Schematic of the AWT-26 nacelle and rotor [9].
The generator, yaw assembly, and nacelle cover (not shown) are mounted to themainframe atop the tower. The gearbox increases the angular velocity of thelow-speed shaft to the synchronous speed of the generator. The disk brake on thehigh-speed shaft is used to stop the rotor for maintenance or emergencypurposes. Although the AWT-26 has a fixed-blade pitch, many other turbinescontrol blade pitch to regulate power.
1.1.2 Two-Bladed vs. Three-Bladed Designs
The most successful large turbine configurations are three-bladed upwinddesigns built primarily by European manufacturers. These turbines use a winddirection sensor and a yaw motor to rotate the rotor into the wind. TheseEuropean turbines tend to rotate at slower velocities and are much more massivethan U.S. machines.
U.S. designers tend to pursue lighter, downwind, two-bladed machines in anattempt to use materials more efficiently. Using two blades rather than threeoffers a significant material and weight savings. A mid-sized turbine, such asthe Zond 750-kW Z-46, uses three blades, which typically weigh from 6000 to8000 lb each. Using fewer blades also allows designers to use lightercomponents such as the low-speed shaft, mainframe, and tower.

5
Another advantage of two-bladed turbines is that the teetering motion greatlyreduces uneven loads on the blades due to �tower shadow.� Tower shadow isthe increase in air turbulence as the wind flows around the tower. On downwindmachines, tower shadow causes uneven loads on the blades as they rotate pastthe tower. Positioning a rotor downwind is advantageous because the blades canbe coned downwind away from the tower. Coning the blades balances thecentrifugal forces on the blades with the thrust from the wind.
Additional weight and cost savings can be made on a two-bladed, downwindrotor by making it a free-yaw machine. The latter eliminates the weight and costof a yaw-drive mechanism. However, the behavior of such machines is oftenhard to predict. Some two-bladed, downwind designs have been known to�walk upwind�; that is, the machine yaws until it faces upwind.
A major disadvantage of two-bladed machines is that they are noisier. Themachines must be run faster than three-bladed machines to produce the sameamount of energy, and the faster rotor speeds increase blade noise. In addition,some downwind machines produce a �thumping� sound as the blades passthrough the tower shadow. Many proponents of three-bladed machines arguethat a three-bladed rotor is not only quieter but also more aesthetically pleasingbecause the rotors are more symmetric. These noise and aesthetic issues can bevery important for turbines placed in high-visibility areas.
1.2 The Need to Design an Experimental Two-Bladed Hub
Wind turbine manufacturers can typically only afford to invest in short-termwind energy research that yields quick results (i.e., in less than five years). Mostlong-term wind energy research is performed at national research laboratoriesand universities. The National Wind Technology Center (NWTC) in Golden,Colorado, is a research facility responsible for much of the long-term windenergy research in the United States. The NWTC is a branch of the NationalRenewable Energy Laboratory (NREL), which is a not-for-profit laboratory thatspecializes in performing and managing renewable energy research for publicand private clients [10].
1.2.1 The Unsteady Aerodynamics Experiment
One of the principal research activities at the NWTC addresses the unsteadyaerodynamics and structural response of horizontal-axis wind turbines. To

6
achieve this purpose, researchers at the NWTC have been performing theUnsteady Aerodynamics Experiment for the past 10 years. The experimentconsists of a three-bladed, downwind, 10-meter-diameter, 20-kW wind turbinethat has been modified and extensively instrumented. The instrumentationincludes a special set of blades, one of which was instrumented with 155surface-pressure taps. The data from the turbine are collected by an extensiveinstrumentation and data acquisition system, which simultaneously records 248channels of data using a personal computer in a control room at the base of thetower. The data acquisition system is fastened to a boom off the front of theturbine. A video camera and lights are also mounted on the boom, and there is acamera mounted at the root of one blade [11].
A massive amount of data on three-bladed turbines has been acquired for theUnsteady Aerodynamics Experiment. However, a comprehensive database for atwo-bladed machine remains to be completed.
1.3 Project History and Scope
In May of 1995, NREL scientists Sandy Butterfield and Jim Johnson offered mean NREL fellowship to work with NWTC engineers on the design of a two-bladed hub to be installed for the Unsteady Aerodynamics Experiment. The hubwas unique because it could be run in rigid, teetering, or independent blade-flapping modes. In addition, the proposed design was unusual because it wouldpitch the blades independently.
Butterfield and Johnson wanted to run the hub as a rigid, two-bladed machine tocompare data (such as wind inflow, power production, tower structural modes,and aerodynamic structural responses of the rotating blades) to data from a three-bladed machine. In addition, they sought to use the teetering and flapping modeswith the independent blade pitch feature to investigate new load reduction, noisereduction, blade pitch optimization, and yaw-control techniques.
Because I had to return to the University of Texas (UT) at Austin to begingraduate school in the fall, my appointment at NREL to design the hub wouldonly last three months. My project responsibilities included: (1) establishingreasonable input loads, (2) designing and modeling the hub, and (3) specifyingthe hub hardware, such as the pitch motors and bearings. The expected result ofmy efforts was a set of working drawings and a list of vendor-purchasedcomponents that engineers at the NWTC could use to build the hub.

7
The hub construction and testing were not originally included in the scope of mytasks because of the brevity of my appointment. However, after the summer of1995, the NWTC hired me to coordinate the construction and testing of the hubwhile I attended graduate school at UT. The testing and construction of the hubbegan in April 1996 at UT in Austin and continued through July 1996.
At the time of this writing, engineers at NREL are instrumenting and installingthe hub for the Unsteady Aerodynamics Experiment at the NWTC. No field-testing has occurred yet. Thus, for this thesis, I did not describe the installation,instrumentation, or field-testing of the hub.

8
2. Design of the HubI used a methodology based the Phal and Bietz design. This methodology,which is presented in their book Engineering Design: A Systematic Approach,provides a rational, systematic strategy for solving design problems [12]. Themethodology has four major phases: (1) clarification of task, (2) conceptualdesign, (3) embodiment design, and (4) detailed design. I followed the Phal andBietz methodology whenever possible; however, time and resource constraintsforced me to tailor the methodology to my needs.
2.1 Clarification of the Task Phase
The first step in the Phal and Bietz methodology is to clarify the task; theobjective of which is to identify the problem and collect information on therequirements and constraints necessary to solve the problem. These requirementsand constraints are then compiled in a specifications list. The list is usedthroughout the design process to establish priorities needed to make designdecisions.
2.1.1 Problem Statement and Scope
Although the problem was described in the introduction of this thesis, theproblem and scope are summarized below for continuity with the Phal and Bietzdesign methodology.
Problem: Design a two-bladed hub for the Unsteady AerodynamicsExperiment, which features independent blade-pitch adjustment and can be runin the rigid, teetering, or flapping modes.
Scope of Design: My initial design responsibilities were primarily limited to thedesign, analysis, and structural bench-testing of the hub. NREL engineer LeeFingersh designed the electrical system components, such as the servomotor,servo controller, and data acquisition equipment. Only the hub was to bemodified. The NWTC requested I use the nacelle, pitch shafts, blades, andboom from the three-bladed rotor.
Scope of Testing: My project included only structural testing. The NWTC wasresponsible for field-testing the hub.

9
Scope of Construction: One prototype hub assembly and one fully operationalhub assembly were required to be built. The design was not intended to bemass-produced. The NWTC was responsible for designing and mounting thedata acquisition instrumentation on the hub.
2.1.2 Design Specifications
After discussing the design requirements with Butterfield and Johnson, I draftedthe specifications list presented in Table 2.1. The first column of Table 2.1 liststhe design requirements and the second column lists the quantification for eachrequirement. A description of each requirement and quantification followsTable 2.1.

10
Geometry Specifications: As listed in Table 2.1, the hub had to be mounted ona vintage WS33 wind turbine built in the 1980s by Grumman Aerospace. TheNWTC planned to remove the three-bladed hub on the turbine and replace itwith the two-bladed hub.
The two-bladed hub had to be compatible with the custom-built blades on theUnsteady Aerodynamics Experiment. The Unsteady Aerodynamics Experimentuses a standard Grumman WS33 hub, but the pitch shafts were modified to fitthe custom blades.
Table 2.1. Hub Specifications List
Requirement QuantificationGeometryFit on a Grumman Aerospace WS33 turbine Not applicableFit instrumented blades used on the UnsteadyAerodynamics
Not applicable
Rotor diameter Same diameter as the three-bladed hub(396 in +- .5 in)
OperationDesign for a five-year life 500 hrs of operating timeRun at same rpm as three-bladed hub 72 rpmWithstand hurricane wind conditions 144 mph windsProvide a rigid operating mode 0° of playProvide a teetering operating mode 10° to -10° teeter rangeAllow the machine to be modified at a later date torun in a flapping operating mode
10° to -10° flap range per blade
Allow manual cone angle adjustments 10° to -10° per blade from the nominal cone angle of3.42°
Allow an active cone angle adjustment system to beinstalled at a later date
Not applicable
Allow for 120° independent pitch angle adjustment 30°/sec, 92 ft-lbf per blade, .5° backlashProvide generic mounts for teeter damper designs Not applicable
Data acquisitionAllow flap angle and teeter angle monitoring within .05° resolutionAllow for pitch angle monitoring within .1° resolutionProvide a mounting location for the primary dataacquisition system (the boom)
Not applicable
Time Designed within 3 monthsPermitted cost of the design and construction Approximately $100,000

11
The diameter of the two-bladed rotor was required to be within .5 in of the three-bladed rotor when coned at the same angle (3.42°). This similarity permits easycomparison of the two-bladed data with the three-bladed data.
Performance Specifications: The Unsteady Aerodynamics Experiment turbineis used solely for research purposes. The turbine is run only with an operatorpresent. Lee Fingersh estimated that the three-bladed hub had been run for only50 hours in the past three years. In light of this estimate, the specification thatthe two-bladed hub be designed to withstand 500 hours of operation over fiveyears is conservative.
The NWTC site has seasonal winds at speeds upwards of 100 miles per hour(mph). Butterfield requested that the hub be designed to withstand hurricane-force winds of 144 mph. Butterfield requested that the hub be designed so that itcould be modified at a later date to run with independently flapping blades.
The NWTC required that the hub have generic mounts for teeter dampers so thatthe different dampers could be tested. In addition, the generic mounts werenecessary to give the NWTC the option to install an active blade-flapping systemor to run the turbine as a rigid two-bladed machine.
The blades were required to have a 120° pitch-angle adjustment. Furthermore,the pitch actuators needed to provide 92 ft-lbf of torque at angular velocities upto 30° per second on each blade. This angular velocity is high compared to thatof most wind turbines. For example, in the three-bladed UnsteadyAerodynamics Experiment, the rotor pitches the blades at approximately 10° persecond [13]. The motivation for specifying these fast velocities was to have thepotential to actively adjust the pitch angle during turbine operation to reduce theeffects of turbulent wind loads.
The three-bladed hub has a 3.42° cone angle. (Each blade is rotated downwind3.42° from the rotor plane of rotation.) Coned blades are used to balance themoment created by the centripetal load on the blades with the moment caused bythe wind. The Unsteady Aerodynamics Experiment data indicate that, at 3.42°,these moments cancel at wind speeds of approximately 20 mph. TheSpecifications required that the two-bladed hub cone angle be manuallyadjustable over a range of 10° to -10° from the nominal cone angle of 3.42°. Inaddition, engineers at the NWTC wanted the option to install a system at a laterdate that would adjust the cone angle while the turbine is operating.

12
Data Acquisition Specifications: The NWTC engineers planned extensiveinstrumentation for the hub. They requested that I leave room to mount opticalencoders used to measure the blade-flap angles and the blade-pitch angles. Inaddition, I had to provide a means for them to mount a 353-lb tripod boom tohold the data acquisition system, video camera, and lights (see Figure 2.1)[14].
Figure 2.1. The Unsteady Aerodynamics Experiment.
Cost Specifications: NREL needed only one fully operational two-bladed hub.This task was small relative to the Unsteady Aerodynamics Experiment budget.Thus, extensive cost calculations were deemed unnecessary. The total budgetfor the design labor, materials, and construction was approximately $100,000,which did not include the cost of installing and testing the turbine.
2.2 Conceptual Design Phase
I began the conceptual design of the hub by identifying the function(s) of eachhub component (see Table 2.2). The next step was to create solution principlesfor each function. According to Phal and Bietz, solution principles are possiblemethods of performing a function [15]. For example, the function of the pitchactuation system is to rotate the pitch shaft. For this function, I decided to use alinear mechanical actuator, a linear hydraulic actuator, or a servomotor.
Data acquisition Boom structure
Camera

13
Table 2.2. Hub Components and Their Functions
After finding solution principles for each function, the next step in the Phal andBietz methodology is to systematically combine these principles to create one ormore concept variants. A concept variant is a solution to the overall problem. Idid not have time to investigate all possible combinations of solution principlesas recommended by Phal and Bietz. Instead, I used a system of elimination andpreference to create one concept variant. This concept variant is presented inFigure 2.2. I describe the solution principles, their selection, and the resultingconcept variant in the following sections.
Hub Component FunctionsHub body Transfers the loads from the blades and dampers to the low-
speed shaft; positions the barrels, teeter dampers, and hardlink
Pitch actuation system Rotates the pitch shafts to the desired blade-pitch angleCone angle control system Maintains the desired cone angleTeetering hinge and bearings Provides an axis for teetering or flappingThrust-bearing adjuster Locates the hub body on the teeter pinTeeter damper mounts Provides mounts for the teeter dampers, teeter hard link,
and flap actuators

14
Figure 2.2. Two-bladed hub concept variant.
2.2.1 Hub Body Solution Principles
I refer to the main load-bearing assembly as the hub body. The primary functionof the hub body is to transfer the loads from the blades to the low-speed shaft.The hub body also provides a mount for the teeter dampers, hard link, and boom.My goal for the hub body was to design an easily manufactured structure thatcould withstand high wind loads and be readily modified to fit differentinstrumentation.
My highest priority was to ensure that the hub would be rigid enough towithstand the specified loads. Thus, the primary criterion I used to evaluate thehub body principles was what Phal and Bietz called the �principle of direct andshort force transmission path.� This principle states the following: �If a force or
Pitch actuation system
Hub body
Teeter damper
Boom Boom mount
Pitch angle encoder
Teeter angle encoder
Thrust -bearing adjuster
Low-speed shaft
15
moment is to be transmitted from one place to another with the minimumpossible deformation, then the shortest and most direct force transmission path isthe best� [16]. This principle helped ensure that I chose a structure thatminimized the use of materials and deformation of the hub.
The secondary criterion I used was �modification flexibility,� which refers to thedegree a component can be modified after construction. For example, a hubbody that accepts several different types of teeter damper mechanisms, or whichprovides many faces to attach instrumentation, has a high degree of modificationflexibility.
The final criterion I used to qualify principles was the ability to manufacture thedesign. I eliminated hub solution principles that the NWTC could not feasiblymake and I gave preference to designs that were easily fabricated. For example,weldments were preferred to castings because the materials and equipmentrequired to make a weldment were readily available.
The specifications required that the two-bladed hub use the same blades, pitchshafts, and pitch-shaft-bearing assemblies in the same positions as the three-bladed hub. To create solution principles for the hub body, I drafted a scaledrawing that included only these components in their proper positions. I thenused the drawing to sketch methods of transferring the wind loads to the low-speed shaft. I reviewed and modified these sketches with Sandy Butterfield andJim Johnson to help eliminate impractical solutions, modify existing principles,and derive other solution principles.
I divided the hub body solution principles into two categories: the �center-clamping body� principles and the �box-style body� principles (see Figure 2.3).The distinguishing feature of the box-style body is that the low-speed shaftattaches to a box that holds the teeter pin at each end. In the center-clampingbody principle, the teeter pin is clamped to the low- speed shaft at the center ofthe teeter pin.

16
Figure 2.3. Drawings of the center-clamping and box-style body principles.
2.2.1.1 Box-Style BodyThe box-style body principle was appealing because it had many flat faces toattach instrumentation and was easily fabricated. It also provided an easy mountfor the boom on the front of the box. The barrels, teeter pin, and teeter damperswere also relatively easy to mount.
The box-style principle was the first practical hub body principle Johnson,Butterfield, and I created. Although the box-style body principle adequatelyfulfilled the specifications, it had an indirect load path that resulted in a heavyand bulky design.
Box-style hub
Center-clamping hub
Hardlink
Barrel
�Tuning fork�Web plates Cheek plate

17
The load path in this principle originates at the blades, runs through each barrel,into the teeter pin, and around each plate to the low-speed shaft (see Figure 2.4).Because I was adhering to the Phal and Bietz �principle of direct and short forcetransmission path,� I decided to design a body with a lighter, more efficientmeans of transferring the loads from the teeter pin to the low-speed shaft.
Figure 2.4. Load paths through the box-style and center-clamping body solution principles.
Box-style hub
Center-clamping hub
18
2.2.1.2 Center-Clamping Body
The next practical principle developed was the center-clamping body principle.In this principle, the hub clamps the teeter pin at the teeter pin center. Theprimary reason I chose this configuration, rather than the box-style principle,was that it resulted in a more direct load path. In the center-clamping principle,the loads originate at the blades, travel through the barrel to the hub body, intoeach end of the teeter pin, and down the center of the hub directly to the low-speed shaft. This load path is more rigid in transmitting the rotor operatingtorque and the braking and gravity loads.
I considered several construction methods to build the center-clamping principle.The strongest construction would most likely have been a casting. A castingwould have allowed a direct load path with no sharp transitions. This cost couldnot be justified because only one hub would be built.
Another construction option was to build a weldment. I determined that aweldment could be made nearly as strong as a casting but at a reasonable cost.In the weldment design, I tried to position a plate in each of the primary loaddirections. The side webs on the hub body, or what I termed �web plates� (seeFigure 2.3), transfer the moments in the rotor plane directly to the teeter pin andresist the centripetal loads. I strengthened the webs against buckling by welding�tuning forks� to them. The tuning forks also help transfer loads to the teeter-bearing housings and resist the bending moments that are out of the rotor plane.
I briefly considered variations on the plates principle. The principle I mostseriously considered used mechanical steel tubing in place of the web plates,with the idea that a thick- walled tube would be resistant to any buckling towhich the plates might be subjected. The tube would also have better resistedthe torsion loads from teeter impacts. I chose not to develop this variationbecause it would have been difficult to miter the mechanical steel tubing to theteeter pin and the barrels.
One principle that I overlooked during conceptual design was machining theentire hub from billet aluminum using computer numerically controlled (CNC)machines. This idea was suggested to me at the end of the design process by themachine shop manager at The University of Texas Center for Electromechanics,Murel O�Neal.

19
O�Neal believed that milling the entire assembly from one piece might be easierand cheaper than machining, jigging, and welding the many plates. Anotheradvantage was that a billet structure would have resulted in a stiff geometry verysimilar to that obtained from the casting principle. The structure might have hadstrength advantages over a casting in that it could be have been made from high-strength aluminum. In addition, the less-dense aluminum would have permittedthe use of a high moment of inertia structure without a severe weight penalty.One disadvantage of using aluminum is that it is more difficult to weld.Therefore, any field modifications to the hub that required welding would behard to make. Despite this disadvantage, I felt this fabrication technique was aviable option that should be considered in future designs.
I encountered a difficulty with the center-mounting hub principle halfwaythrough the embodiment design stage. The difficulty stemmed from myassumption that the boom could be mounted on the hard link, the rigid linkbetween the two barrels used when running the turbine in a teetering mode (seeFigure 2.4). During the conceptual design stage, I overlooked the fact thatmounting the boom on the hard link makes a variable coning system nearlyimpossible to implement. In light of this discovery, I decided that the boommust mount rigidly to the low- speed shaft off the end of the teeter pin cap.
Although mounting the boom off the teeter pin cap alleviated the variable coningsystem conflict, this new mounting location created a new problem: the samebolts used to mount the teeter pin also had to support the boom. This additionalload on the teeter pin cap bolts reduced the safety factor against exceeding thebolt-clamping force from ten to five. These bolts are critical because the entirerotor and boom will fall off if they fail.
The size of the teeter-pin cap bolts could not be increased because the spacebetween the barrels was relatively small. This space was limited by the rotordiameter constraint. So, to prevent a catastrophic failure of the teeter-pin bolts, Ispecified that high-strength bolts (above Society of Automotive Engineers[SAE] Grade 8) be used to fasten the teeter cap. In addition, I specified that thebolt strain be measured with a micrometer during installation to ensure properpre-load. I also specified that the bolt lengths be measured at specified intervalsto ensure that the pre-load is maintained.
If I had anticipated this change earlier in the design process, I could have takenseveral actions. One option would have been to use a longer teeter pin, which
20
would have allowed me to use a longer teeter-pin cap with more bolts in it. Ialso could have requested that the NWTC allow me to increase the rotordiameter 1 inch. The larger rotor diameter would have permitted me to uselarger teeter-pin cap bolts. Finally, I could have developed the box-style bodyfurther before committing to the center-mounting hub. The box-style body wasmuch more conducive to mounting the boom.
2.2.2 Pitch Actuator Solution Principles
The specifications required that the blade-pitch system rotate each bladeindependently with 92 ft-lbf of torque at 15° per second. One common methodof pitching blades is to drive a rod from the nacelle through the center of thelow-speed shaft. The linear motion of the rod is converted to rotational motionof the blades via a linkage at the base of each blade. The three-bladed hub onthe Unsteady Aerodynamics Experiment uses this push-rod system. However,this system was not suitable for the two-bladed hub because the teetering andblade-flapping motions complicated the push-rod linkage design.
Another method of pitching the blades is to use actuators mounted on the hub topitch the blades. The actuators are usually hydraulic or electromechanical. Theprimary advantages of hydraulic systems are that they are easy to regulate andare capable of producing large pitching moments. A disadvantage is that thehydraulic equipment, such as pumps, regulators, and actuators, must all bemounted on the rotating hub. Thus, only large wind turbines have room to usehydraulics.
I decided not to use a hydraulic system to pitch the blades because I did not havespace to mount the hydraulic equipment on the hub. In addition, the cost andcomplexity of a hydraulic system was difficult to justify for such a small windturbine.
An electromechanical actuator was much easier to fit. I decided to use a .75 ft-lbf (peak) servomotor and spur gear assembly mounted at the base of each bladefor pitch actuation (see Figure 2.5). In addition to the 4:1 spur gear ratio, Iattached a 100:1 gear head to each servomotor. The resulting 400:1 gear ratioshould output a peak torque on the blades of roughly 300 ft-lbf at speeds up to68° per second with less than .3° of backlash. This predicted performanceexceeds the torque specifications threefold and the backlash and speedspecifications roughly twofold.

21
Servomotors were chosen rather than simpler DC motors because of their self-correcting ability. That is, if one of the motors is forced from a specified angularposition, the servo controller senses the error and signals the motor to return tothe specified position.
Gear head Spur gears Eccentric adjuster Pitch encoder gear Blade
Figure 2.5. Photograph of the pitch actuation system.

22
2.2.3 Cone Angle Linkage Solution Principles
The three-bladed hub has a 3.42° cone angle (each blade is rotated 3.42° fromthe rotor plane of rotation). The specifications required that the two-bladed hubcone angle be manually adjustable over a range of 10° to -10° from the nominalcone angle of 3.42°. In addition, the NWTC wanted the option to later install asystem to adjust the cone angle actively and a system to flap the bladesindependently.
The simplest way to manually adjust the cone angle was to install a link betweenthe two barrels. I called this link the �hard link.� The length of the hard linkdetermines the cone angle. The link is made from a turnbuckle with rod ends ateach end so that the angle would be easy to adjust manually. The two-bladedhub can be positioned at cone angles -9° to 23° from the plane of rotation.Beyond this range, the hub body impacts the low-speed shaft or the boommount.
The hard link is designed so that the turnbuckle can be replaced with a hydraulicor electromechanical actuator. Inserting an actuator into the hard link allows theconing angle to be adjusted while the turbine is running. To run the turbine in anindependent blade-flapping mode, the hard link can be removed and the damperscan be replaced with actuators.
I designed the hard link to accommodate a 10,000-lbf force sensor. The forcesensor will help measure the thrust loads on the blades. In addition, the forcesensor data will help size actuators for the active coning and independent blade-flapping systems. Based on Unsteady Aerodynamics Experiment data, Ianticipate the force sensor will measure approximately 2000 lbf in 45-mphwinds.
2.2.4 Teeter-Bearing Solution Principles
Needle bearings, bronze journal bearings, and composite bearings have all beenused as teeter bearings on previous machines. Needle bearings often wear outprematurely on wind turbines because the teeter angles are too small to rotateeach needle bearing one full revolution. As a result, the bearings do not receiveadequate lubrication, which causes premature bearing failure.

23
I chose to use filament-wound, composite GAR-MAX bearings made byGarlock Bearings, Inc. GAR-MAX bearings have a bearing surface liner ofwound poly-tetrafluoroethylene (PTFE) and high-strength fibers encapsulated byan epoxy resin. The PTFE liner permits the bearings to be run without oil orgrease. I chose to use GAR-MAX bearings because Garlock claims that they aresuperior in applications �where the relative motion is not sufficient to promotecirculation of the oil or grease used with more conventional bearings� [17]. Inaddition, GAR-MAX bearings are designed for high-load, low-speedapplications in which shock loads are encountered. Shock loads may be inducedin the teeter bearings during teeter impacts.
The teeter bearings have a 2-in inside diameter. Each half of the hub uses one 3-in-long bearing and two 2-in-long bearings. The load each bearing will besubjected to in 45-mph winds is roughly 800 lbf. The pressure resulting fromthis load is very small (160 psi) compared to the dynamic capacity of thebearings (20,000 psi). The manufacturer predicted the bearings will last 2500hours without lubrication if they are properly sealed from contaminates such assand and dust and 600 hours in light dust conditions. According tospecifications, the hub should last 500 hours. I chose not to seal the bearingsbecause of the complexity the seals would add.
2.2.5 Thrust-Bearing Solution Principles
The thrust bearings support the hub when the blades are positioned horizontally.I considered two principles for the thrust-bearing adjuster. The pre-load on thethrust bearings could either be adjusted from the end or from the center of theteeter pin. The �end-adjuster� principle is used on the AWT-26 design (seeFigure 2.6). On the AWT-26, the thrust bearing on each side of the hub isforced against the end of the teeter pin with the end cap. In this manner, the hubposition is fixed on the teeter pin.

24
Figure 2.6. AWT-26 teeter-bearing assembly [18].
I chose to use a variation of the end-adjuster principle (see Figure 2.7). Mydesign uses thrust-bearing adjusters, which are metal rings tapped for ten 3/8-in-diameter set screws. The set screws press against the teeter pin cap to force theinboard journal bearing housings outboard. When the hub is positioned asshown in Figure 2.7, the weight of the hub and both blades (roughly 650 lbf)rests on the inboard thrust bearing, which lies on the upper adjuster.
Although neither thrust-bearing adjuster principle has a significant advantage, Ichose to implement the center adjuster principle. I chose this principle so that Icould mount an optical encoder on each end of the teeter pin to monitor theblade-flap angle.
End cap
Thrust bearing
Shim
Blade
Teeter bearing
Teeter shaft
Teeter housing

25
Thrust-bearing adjusters
Thrust bearings Teeter-pin cap Inboard journal-bearing
Figure 2.7. Centered thrust-bearing adjuster principle used in the final design.
In my design, the surface area of each thrust bearing is 3.387 in2. Thus, the peakpressure in the thrust bearings is approximately 200 pounds per square inch(psi). The thrust bearings are made from SAE 1018 steel discs. They weregreased during installation. According to Mark�s Standard Handbook forMechanical Engineers, 2000 psi is a safe pressure for hardened-steel collars onbronze rings during intermittent service [19]. Although I used greased, SAE1018 steel rings instead of bronze, the pressure on the rings is an order ofmagnitude lower than 2000 psi. Thus, I anticipate the SAE 1018 steel bearingswill withstand the 500-hour life specification.
2.2.6 Teeter Damper Solution Principles
The specifications called for a teeter damper mount, which is compatible with avariety of dampers. These mounts permit the NWTC to test different dampers.We considered using oil-filled dampers and elastomeric dampers. I chose to useelastomeric dampers made by Jarret Inc. because they are more compact anddurable than oil-filled dampers.

26
The generic damper mounts were also designed to give the NWTC the option toinstall an active flapping system or a rigid link in place of the dampers. The linkwould enable the hub to be run as a rigid two-bladed machine.
The AWT-26 machine has a solidly mounted teeter damper, which is activatedthrough a sliding motion (see Figure 2.8). Experience with the AWT-26machine has shown that the side loading of the teeter damper piston should beavoided if possible because it causes premature damper failures.
Figure 2.8. Teeter damper mechanism for the AWT-26 machine.
In my design, I used pins to support the damper at each end. Using pins at eachend minimized the damper side loading because they limited loading to tensionand compression.
To pin the damper at each end, I designed a telescoping guide for the damper.The damper guide I designed is presented in Figure 2.9. On one side of theguide, the damper fits inside a stainless-steel tube with an outside diameter of3.5 in. The other side of the guide consists of a 4-in ID bronze journal bearinginserted into an aluminum sleeve. The Jarret damper impacts a 10,000-lbf
Teeter axis
Low-speed shaft
Teeter damper
Hub body
Blade

27
button force sensor that is mounted to the end of the aluminum sleeve. Thebutton force sensor will measure the magnitude of the teeter impacts. Iestimated the magnitude of the teeter impacts using a numerical simulation codecalled YAWDYN. Using this code, I predicted that the most severe teeterimpact will result in 7120 lbf of compression on the damper.
My main concern when designing the telescoping guide was to ensure that itwould not cock when it was fully extended. To prevent the guide from cocking,I designed the guide so that the journal bearing and stainless-steel tube had asmuch overlap as possible when the guide was fully extended. In addition, Ipositioned the damper assembly so that its cylindrical axis is tangent to theteetering motion of the hub when the guide is fully extended. As an addedprecaution, I had the inside diameter of the journal bearing and the outsidediameter of the stainless-steel tube precision-ground to ensure the slidingsurfaces are round and that they have a minimum running clearance (0.0013 in).
Bearing housing
Button force sensor
Stainless guide
Damper
End cap
End cap
Figure 2.9. Telescoping guide for the teeter dampers.

28
2.3 Embodiment and Detailed Design Phases
In the embodiment design stage, the designer develops the chosen conceptvariant. The steps of embodiment design include creating and selectingpreliminary layouts, refining the preliminary layouts to form detailed layouts,and then evaluating the detailed layouts against the technical and economiccriteria. The details of the embodied design are then finalized in the detaileddesign stage so that production of the part may begin.
I only had enough time to make one preliminary layout. I drafted anorthographic drawing of the selected concept variant using AutoCAD R12. Iused this layout to perform analytical calculations on the strength andperformance of the hub. For example, I calculated the necessary diameters ofbolts, the thickness of the plates on the hub body, and the size of the blade-pitchservomotor.
Once I was confident that the chosen concept would work, I developed acardboard model of the hub body. This model was extremely useful inreviewing my work with Butterfield, Johnson, and Fingersh, allowing us toidentify changes that would increase the strength of the hub body, the ability tomanufacture the hub body, and the ability to instrument the hub.
After I made these changes, I spent one week performing analytical stress andstrain calculations on the hub body and its components. (The results of thesecalculations are presented in Chapter 3.) After confirming the structuralintegrity of the hub body, I drafted working drawings and presented the design tothe entire NWTC.
I oversaw the construction and testing of the hub prototype at The University ofTexas at Austin Center for Electromechanics under the supervision of professorWeldon. The prototype was used to correct errors in the working drawings andtest the structural integrity of the hub before constructing the final assembly.The results of this testing are presented in Chapter 4.

29
3. Predicted Strength of the Hub Body
The hub components and systems I analyzed are listed in Table 3.1. In thisthesis, I focus on the hub body because it was the most difficult component toanalyze. I predicted the structural integrity of the hub body during the conceptualdesign phase using closed-form analytical calculations. After the hub was built,I performed a numerical finite-element analysis as an academic exercise. I didnot perform the numerical analysis during the conceptual design phase because Ihad little experience with finite-element analysis software then.
In this chapter, I present the analytical (closed-form) and numerical (finite-element analysis) results for the hub body. Section 3.1 describes the loads Iused in the analyses. Section 3.2 presents the analytical results, and Section 3.3presents the numerical results. I compare the numerical and analytical results inSection 3.4.
Table 3.1. List of Primary Calculations Performed on the Hub
3.1 Wind Turbine Input Loads
I considered aerodynamic, inertial, and gravitational effects on hub body. Theloads these effects have on the hub are generally referred to as thrust load, radialload, lead-lag moment, and flapwise moment (see Figure 3.1). The load cases Iconsidered and the induced loads are presented in Table 3.2. The derivations ofthese loads are discussed below.
System Calculations PerformedTeeter pin Analytical stress calculationsAdapter, teeter pin cap, servomotor capbolts
Analytical stress calculations
Pitch shaft Analytical stress calculationsHub shaft Analytical stress calculations Damper plates Analytical and numerical calculationsTeeter pin journal bearings Analytical lifetime calculationsHub body Analytical, numerical, and experimental
calculationsBoom mount Analytical stress calculationsDamper and hard-link bolts Analytical and experimental stress calculations

30
Figure 3.1. Hub body reaction terminology.
Thrust load
Flapwise moment
Lead-lag moment
Radial load

31
Table 3.2. Hub Reactions Resulting from Aerodyanmic and Inertial Loads
The blades and hub together weigh approximately 650 lb. Thus, the gravitationalloads were negligible compared to the aerodynamic and inertial loads. Theaerodynamic loads produced the largest hub reactions; therefore, they were usedas the primary design loads. Aerodynamic loads are caused by airflow and itsinteraction with the stationary and moving parts of a wind turbine. Themagnitudes of the aerodynamic loads depend on factors such as the rotationalspeed of the rotor, average wind speed, turbulence, air density, and theaerodynamic shape of the wind turbine components.
Sandy Butterfield requested that the hub be designed to withstand steady windsof 144 mph when parked. I multiplied the load resulting from this extremecondition by a 1.4 safety factor at Butterfield�s request. This calculation resultsin a thrust load of 1907 lbf on each blade (see Equation 3.1 and Table 3.3).
Hub Reaction Aerodynamic Load Scenarios Inertial Load Scenarios
Bladesparked,
yaw=90°,144-mph
wind(lead-lag
load case)
Bladesparked,yaw=0°,144-mph
wind(flapwiseload case)
One bladefeathersduring
operation(pitch-failure
load case)
Data fromthree-bladed
huboperating
in45-mphwinds
Centripetalforce at90 rpm
Emergencystop
Teeterimpact
Flapwisemoment perblade (ft-lbf)
- 17957 - 3333 - 1000 8900
Lead-lagmoment perblade (ft-lbf)
17957 - 17957 3333 - - -
Torque on thehub (ft-lbf)
- - 17957 - - 2000 -
Thrust on eachblade (lbf)
1907 1907 1907 300 - - -
Radial force oneach blade (lbf)
- - 3370 3370 3370 3370 -
Hard link tensionor compression
- 24911 - - - - -
32
Table 3.3. Parameters Used to Calculate the Lift on Each Blade
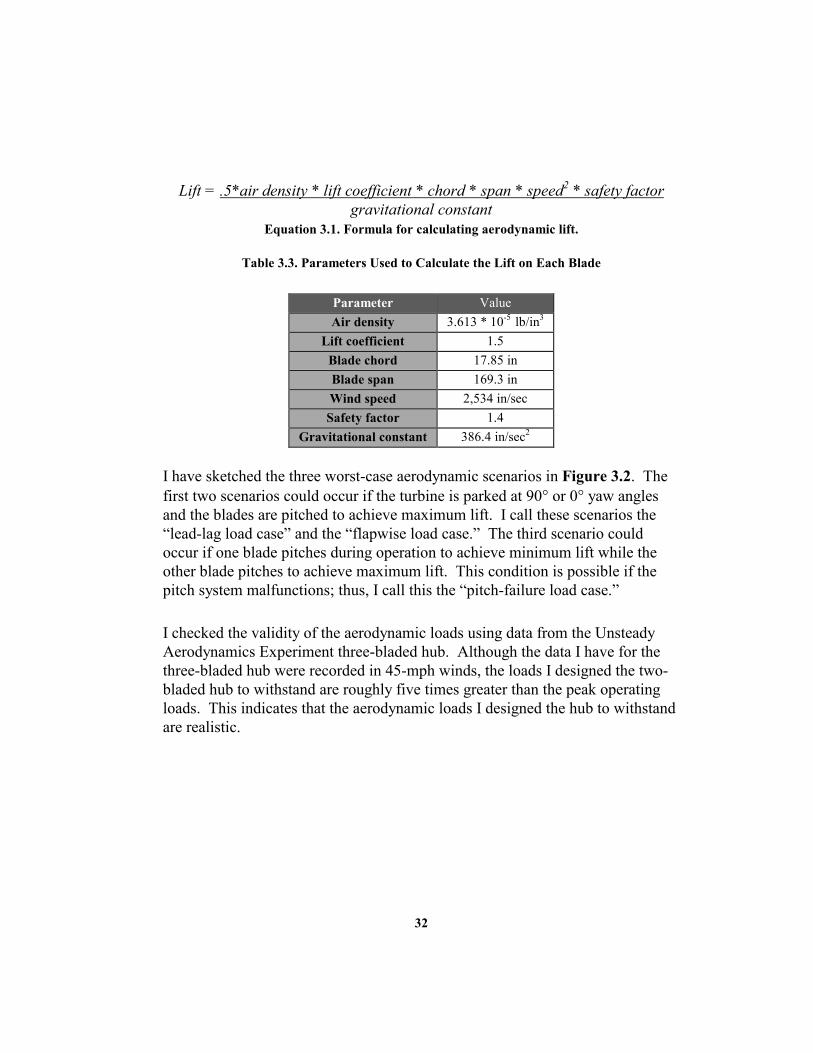
I have sketched the three worst-case aerodynamic scenarios in Figure 3.2. Thefirst two scenarios could occur if the turbine is parked at 90° or 0° yaw anglesand the blades are pitched to achieve maximum lift. I call these scenarios the�lead-lag load case� and the �flapwise load case.� The third scenario couldoccur if one blade pitches during operation to achieve minimum lift while theother blade pitches to achieve maximum lift. This condition is possible if thepitch system malfunctions; thus, I call this the �pitch-failure load case.�
I checked the validity of the aerodynamic loads using data from the UnsteadyAerodynamics Experiment three-bladed hub. Although the data I have for thethree-bladed hub were recorded in 45-mph winds, the loads I designed the two-bladed hub to withstand are roughly five times greater than the peak operatingloads. This indicates that the aerodynamic loads I designed the hub to withstandare realistic.
Lift = .5*air density * lift coefficient * chord * span * speed2 * safety factorgravitational constant
Equation 3.1. Formula for calculating aerodynamic lift.
Parameter ValueAir density 3.613 * 10-5
lb/in3
Lift coefficient 1.5Blade chord 17.85 inBlade span 169.3 inWind speed 2,534 in/secSafety factor 1.4
Gravitational constant 386.4 in/sec2

33
Figure 3.2. Worst-case aerodynamic scenarios.
The inertial loads I considered result from the centripetal force on the blades, thetorque on the rotor, and braking during an emergency stop. The operating speedof the three-bladed hub is 72 rpm. I calculated the effect of the centripetal loadsby assuming that the rotor was in an over speed condition operating at 90 rpm.Each half of the rotor weighs roughly 295 lb (each blade weighs 158 lb) and thecenter of gravity for each half lies 48.5 in from the center of the rotor. Theresulting centripetal load is 3370 lbf per blade.
The loads from an emergency stop result from the disk brake. The disk brakeexerts 2000 ft-lbf on the rotor. This torque is transmitted to the blades. Iassumed that each blade was subjected to one-half of this torque.
Estimating the magnitude and frequency of teeter impacts was extremelydifficult because so many factors were involved (such as wind speed, windturbulence, the amount of free teeter, blade design, and hub design), and I foundno research documentation on the subject.

34
I estimated the magnitude of the teeter impacts using a numerical simulationcode called YAWDYN. I had little time to learn the intricacies of YAWDYNor run extensive case studies. Thus, the flapwise moment in Table 3.2 is only arough, conservative estimate of the peak teeter impact. YAWDYN predictedthat the most severe teeter impact occurs at a yaw angle of 45° with no teeterdamping in 144-mph winds. The result of this impact was a flapwise bendingmoment of 8900 ft-lbf, which causes 7120 lbf of compression on the damper.
3.2 Strength-of-Materials Calculations
In this section, I present the strength-of-materials calculations (or analyticalcalculations) I performed to determine the effects of the design loads. Theaerodynamic loads were used as the design loads because they produce thelargest forces on the hub. Of the aerodynamic loads, the most problematicforces are the flapwise and lead-lag bending moments. The lead-lag load caseand the pitch-failure load case have the same lead-lag bending effect on the hub.Because of this similarity, I only discuss the results of the flapwise load case andlead-lag load case.
The design loads subject the hub body to uni-axial, bi-axial, and tri-axialstresses. I used the maximum-shear-stress theory to determine when thesestresses will cause the hub to fail. The maximum-shear-stress theory predictsthat if the three principal stresses are ordered σ1 > σ2 > σ3, then yielding occurswhen either the difference between σ1 and σ3 exceeds the material yield strengthor the shear stress exceeds half of the material yield strength [20]. Themaximum-shear-stress theory was good for my design purposes because it isquick and easy to use. Furthermore, the maximum-shear-stress theory is aconservative predictor of failure.
3.2.1 Simplifying Assumptions
In this section, I present the simplifying assumptions I used for the analyticalcalculations. I discuss the assumptions below and display the model in Figure3.3.
Assumption 1) I assumed the hub was symmetric about the Z-X plane. Thehub body actually consists of a small web, a large web, andthree journal-bearing housings. The small web is attached to

35
one journal bearing housing and the large web is attached to theother two housings. My simplified model assumed that the twowebs were identical. This assumption was conservative becauseit resulted in higher stress values.
Assumption 2) I assumed that the teeter-pin axis was on the same Y-Z plane asthe barrel centerline axis. On the prototype and final assembly,the X coordinate of the teeter-pin axis is actually positioned 2 indownwind of the barrel axis. Thus, on the prototype, the websare slanted so that they reach from the teeter pin to the top ofthe barrel. By assuming the teeter pin axis was on the same Y-Zplane as the barrel centerline, I could position the tuning forksvertically as in Figure 3.4. This was not a conservativeassumption because it reduced the stress values in the hub.However, it was necessary to simplify the numerical model. Imade this assumption in this analysis so that I could comparethe analytical results with the numerical results.
Assumption 3) I conservatively assumed that the teeter pin, hard-link, blades,pitch-shaft, bearing housings, and barrel were rigid. On the realhub, the deflections of these components lessen the loads on thehub body.
Assumption 4) I assumed the magnitude of buckling was negligible because theplate members are relatively short compared to their width.
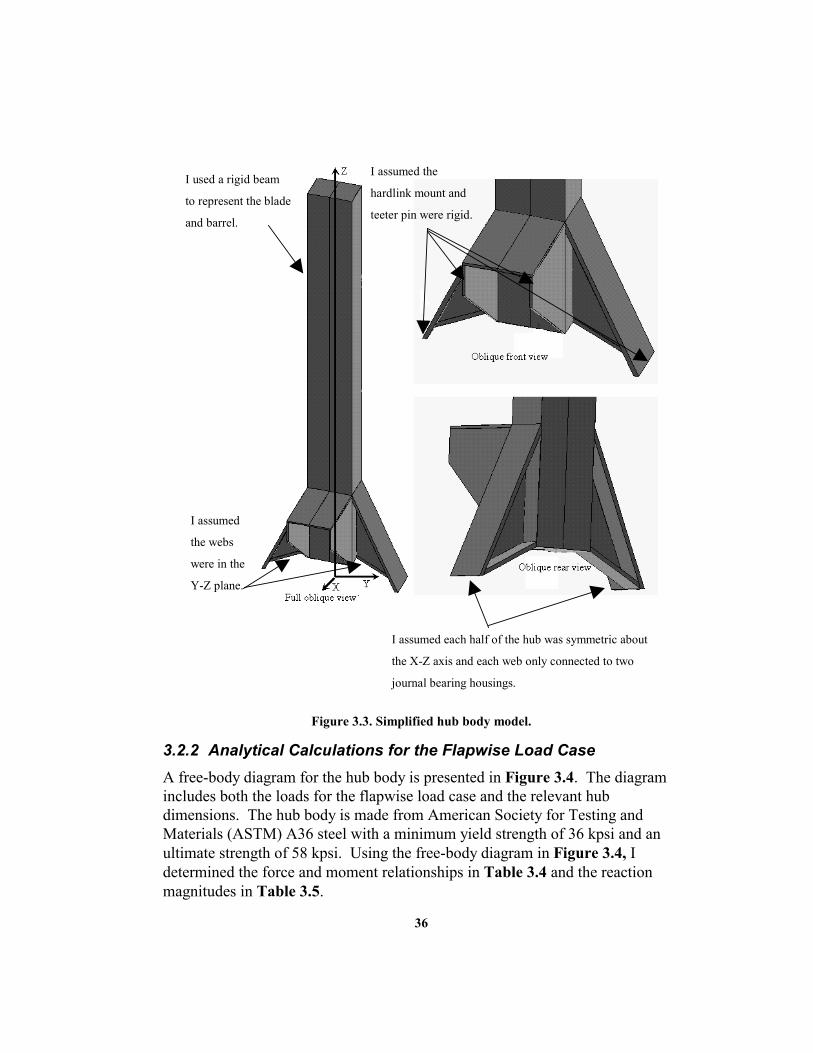
36
I used a rigid beam
to represent the blade
and barrel.
I assumed the
hardlink mount and
teeter pin were rigid.
I assumed each half of the hub was symmetric about
the X-Z axis and each web only connected to two
journal bearing housings.
I assumed
the webs
were in the
Y-Z plane.
Figure 3.3. Simplified hub body model.
3.2.2 Analytical Calculations for the Flapwise Load CaseA free-body diagram for the hub body is presented in Figure 3.4. The diagramincludes both the loads for the flapwise load case and the relevant hubdimensions. The hub body is made from American Society for Testing andMaterials (ASTM) A36 steel with a minimum yield strength of 36 kpsi and anultimate strength of 58 kpsi. Using the free-body diagram in Figure 3.4, Idetermined the force and moment relationships in Table 3.4 and the reactionmagnitudes in Table 3.5.

37
Figure 3.4. Free-body side view and front view for the flapwise load case.
Table 3.4. Load Relationships for the Flapwise Load Case
Action Relation (lbf)Summing the moments about the Y-axis Rhz = 9.74 Fwind
Summing the moments about the X-axis Rtza = Rtzb
Summing the moments about the Z-axis Rtxa = Rtxb
Summing the forces in the X direction Fwind= Rtxa + Rtxb
Summing the forces in the Z direction Rhz = Rtza + Rtzb

38
Table 3.5. Input and Reaction Forces for the Hub Body Flapwise Load Case
From the reactions presented in Table 3.5, it is apparent that the horizontal loadsand reactions Rtxa, Rtxb, and Fwind are small compared to the vertical loads andreactions Rtza, Rtzb, and Rhz. Thus, I neglected the effect of the reactions Rtxa andRtxb. Furthermore, because the barrel was assumed to be a rigid structure, I onlyinvestigated the stresses in the webs. I have drawn a free-body, shear, andbending moment diagram for the webs in Figure 3.5.
Input Load orReaction
Force (lbf)
Fwind (thrust on one blade) 1907Rtxa 953Rtxb 953Rtza 9288Rtzb 9288Rhz 18576

39
Figure 3.5. Free-body, shear, and bending moment diagrams of the web for theflapwise load case.
Figure 3.6 depicts the areas of concern in the web. I calculated the shearstresses and bending moments at each of the sections. I analyzed section E-Fbecause the bending moment is highest at that location. I analyzed section A-Bbecause the section modulus there is smaller than at section E-F; however, thebending moment is still relatively high. I analyzed section C-D because thetensile forces from reaction Rtza act on a very small area at that section. Thegeometric properties for cross sections A-B, C-D, and E-F are summarized inTable 3.6. I have drawn the sections A-B, C-D, and E-F in Figure 3.7, Figure3.8, and Figure 3.9 on the following pages.

40
Figure 3.6. Web sections of interest for the analytical calculations.
Table 3.6. Geometric Properties for the Cross Sections of Interest
Area(in2)
Area Moment of Inertia (I)(in4)
c(in)
Section Modulus(in3)
Section A-B 3.575 18.86 5.335 3.535Section C-D 2.250 0.58 1.500 0.387Section E-F 4.050 46.08 6.945 6.635

41
.375
.250
3.000
.4.00
X
Y
Figure 3.7. Approximate geometry of cross section C-D.
.375
.250
3.25
.4.000
Neutral axis
2.5
2.314
Z
X
Figure 3.8. Approximate geometry of cross section A-B.
0

42
Figure 3.9. Approximate geometry of cross section E-F.
The shear stress, bending-moment stress, and tensile-stress formulas arepresented in Equation 3.2. I present the results of these calculations in Table3.7, where I have printed the values of most concern in bold print.
Bending StressMcI
MSection modulus
Tensile StressTensile force
Area
Shear StressShear force
Area
= =
=
=
Equation 3.2. Stress formulas used in the analytical analysis.
.375
.250
10.2
4.000
Neutral axis
6.945
y
x

43
The highest stresses at each of these areas are the bending stresses at section A-B(5,139 psi), the tensile stress at section C-D (4,128 psi), and the bending stress atsection E-F (4,876 psi). All three of these values are significantly lower than thematerial-yield strength (36,000 psi); therefore, I conclude that this section�sstrength is adequate.
3.2.3 Analytical Calculations for Lead-Lag Load Case
The free-body diagram used for the lead-lag load case is presented in Figure3.10. Summing the forces and moments in the free-body diagram yielded therelationships in Table 3.8. The magnitudes of the reactions are presented inTable 3.9.
Table 3.7. Loads and Stresses Due to the Flapwise Load Set
BendingMoment(lbf-in)
ShearForce (lbf)
Tension orCompression
(lbf)
Bending Stress(psi)
ShearStress(psi)
TensileStress(psi)
Section A-B 14,183 9,288 - 5,139 2,598 -Section C-D 0 0 9,288 0 0 4,128
Section E-F 32,350 9,288 - 4,876 2,293 -

44
Figure 3.10. Free-body front view for the lead-lag case.
Table 3.8. Load Relationships for the Lead-Lag Load Case
Action Relation (lbf)Summing the moments about the X-axis Rtzb= 6.86 Fwind
Summing the forces in the Z direction Rtza = Rtzb
Summing the forces in the Y direction Fwind = Rtya + Rtyb
Using symmetry arguments Rtya = Rtyb

45
Table 3.9. Input and Reaction Forces for the Hub Body Analytical Analysis for the Lead-Lag Load Case
From the reactions presented in Table 3.9, it is apparent that the horizontalreactions (Rtya and Rtyb) are small compared to the vertical reactions (Rtza andRtzb). Thus, I neglected the horizontal reactions. Furthermore, because thebarrel and teeter pin were assumed to be rigid, only the stresses in each webwere investigated. Figure 3.11 presents the free-body, shear, and bending-moment diagrams.
Input Load orReaction
Force (lbf)
Fwind (thrust on one blade) 1907Rtza 13087Rtzb 13087Rtya 953Rtyb 953

46
Figure 3.11. Free-body diagram of the web for the lead-lag load case.
The calculations for the lead-lag load case are summarized in Table 3.7, where Ihave printed the values of most concern in bold print. The highest stresses arethe bending stresses at section A-B, the tensile stress at section C-D, and thebending stress at section E-F.

47
Table 3.11 lists the largest stresses at each of the sections of interest for both thelead-lag and flapwise load cases. Section A-B is the critical section for both loadcases. Thus, I used section A-B to determine the safety factor for the hub body.The stress at section A-B from hurricane wind loads is 11,206 psi. The yieldstrength of ASTM A36 steel is 36,000 psi. Using the maximum-shear-stressfailure model, the analytical results predict that the hub has a safety factor ofthree against failure.
An additional margin of safety is due to the fact that yielding does notnecessarily constitute a hub failure in this application. The structure will mostlikely yield to a position that relieves some of the load. In addition, strainhardening will also produce localized strengthening. The magnitude of thesephenomena is difficult to predict, but they add to the margin of safety.
3.3 Finite-Element Analysis
I used the commercial finite-element analysis code ANSYS to perform a linearstatic analysis on the hub body. The simulation was performed at the University
Table 3.10. Load and Stress Calculation Summary for the Lead-Lag Load Case AnalyticalAnalysis
BendingMoment(lbf-in)
ShearForce(lbf)
Tension(lbf)
BendingStress(psi)
ShearStress(psi)
Tensile Stress(psi)
SectionA-B
39,614 13,087 - 11,206 3,661 -
SectionC-D
0 954 13,087 0 424 5,816
SectionE-F
65,213 13,087 - 9,829 3,231 -
Table 3.11. Summary of Results for the Analytical Analysis
Peak Stress in the FlapwiseLoad Case
Peak Stress in the Lead-Lag Load Case
Section A-B 5,139 11,206Section C-D 4,128 5,816Section E-F 4,876 9,829

48
of Texas Mechanical Engineering RISC Computer Laboratory using 32-Bit IBMPower Stations with 64 megabytes of RAM.
I used the distortion-energy theory (also called the shear-energy, von MisesHencky, or octahedral-shear-stress theories) to determine when the hub will fail.The distortion-energy theory predicts that yielding will occur when the effectivestress, σ�, is greater than or equal to the material shear stress. The effective stressis calculated using the three principal stresses (σ1, σ2, σ3) in the followingformula [21]:
σσ σ σ σ σ σ' ( ) ( ) ( )= − + − + −�
��
�
��
1 22
2 32
1 32
12
2Equation 3.3. Formula for the von Mises stress due to tri-axial stresses.
The von Mises stress requires more computation than calculating the maximumshear stress, but it gives more realistic (less conservative) stress values than themaximum-shear-stress theory. Thus, the distortion-energy-theory is well suitedto computational methods.
3.3.1 FEA Meshing and Modeling Assumptions
The finite element code I used was the university edition of ANSYS 5.3. Theuniversity edition limits the number of nodes in a meshed model to 8000 nodes.I experimented with several element types, meshes, and mesh density parametersto find a satisfactory mesh with fewer than 8000 nodes. The mesh I used wasmade of 10-noded, tetrahedral quadratic solid elements and had 7600 nodes.The following assumptions were necessary to reduce the model to a size I couldmesh.
Assumption 1) I modeled only one-half of the hub body because the hub iscomprised of two identical halves.
Assumption 2) I used symmetry boundary conditions. The hub body issymmetric across the barrel except that the web on one side ofthe barrel attaches to two journal bearing housings and the otherside of the barrel attaches to one journal bearing housing. Forthe finite-element analysis, I assumed that the hub wassymmetric about the barrel and that each web only attached to

49
one journal-bearing housing (see Figure 3.12). Thisassumption was conservative because it raised the stress valuesin the hub.
Assumption 3) I assumed the teeter-pin axis was on the same Y-Z plane as thebarrel centerline axis. On the prototype and final assembly, theX coordinate of the teeter-pin axis is positioned 2.5 indownwind of the barrel axis. Thus, on the prototype, the websare slanted (15° from vertical) so that they reach from the teeterpin to the top of the barrel. By assuming the teeter-pin axis wason the same Y-Z plane as the barrel centerline axis, the tuningforks could be positioned vertically. This was not aconservative assumption because it reduced the stress values inthe hub. However, it was necessary to make the model simpleenough to mesh.
Assumption 4) I excluded the hard-link mounts and test stand from the model.Modeling the hard link and test stand required too many nodes.Instead, I applied displacement constraints where the hub bodymounted to the test stand. That is, I restricted the motion of thehard-link mounts and teeter pin (see Figure 3.12). This was nota conservative assumption. The assumption neglected theflexure of the test stand and hard link. Therefore, thisassumption resulted in higher stress values.
Assumption 5) I constrained the blade-flapping degree of freedom at the teeterpin. The hub should have a rotational degree of freedom aboutthe Y-axis. However, the tetrahedral element I used has norotational degrees of freedom. This assumption caused bendingstresses on the hub body at the teeter pin. Therefore, thisassumption resulted in more conservative results.
Assumption 6) I applied the loads to a square beam, which represented thepitch shaft. The beam required fewer nodes to model than ashaft (see Figure 3.12). This assumption had little effect on theresults because the shaft and beam can both be considered rigidstructures.

50
3.3.2 Input Loads
I investigated the results of the aerodynamic scenarios I described in Section 3.1.I applied loads on the finite-element analysis model at the same location as onthe prototype I bench-tested. The center of the blade surface is 113 in from theteeter-pin axis; however, the beam used in the bench testing was only 60 in long.Thus, to apply an equivalent bending moment to the hub body, I increased themagnitude of the wind load applied to the 60-in beam. This had the effect ofincreasing the shear load on the hub; therefore, it is a conservative assumption.
Figure 3.12. Loads and boundary conditions for the finite-element analysis.

51
3.3.3 Finite-Element Analysis Results
In each case, solutions took approximately 20 minutes to reach. The error in theresults was estimated by creating a contour plot of the structural energy error, orSERR, in the solution. The energy error is similar in concept to strain energy.The ANSYS manual describes the SERR as �a measure of the discontinuity ofthe stress field from element to element� [22]. The structural energy error levelsat the areas of interest in my model were below 1.4%, which is acceptable forthis analysis.
I plotted contour plots of the von Mises stresses to determine the areas of highstresses. Figure 3.13 and Figure 3.14 are contour plots of the von Misesstresses for the flapwise and lead-lag load cases. The areas of interest in thefinite-element analysis are the same in the analytical analysis (see Figure 3.6). Ihave listed the peak von Mises stress at each of the sections of interest in Table3.12. I have also listed the deflection at the end of the beam where the loadswere applied.
Figure 3.13. Von Mises stress plot for the flapwise load case.

52
Figure 3.14. Von Mises stress plot for the lead-lag load case.
The distortion-energy theory predicts that the failure will occur when the vonMises stress exceeds the material-yield strength (36 kpsi in this case). In Table3.12, the stress at section C-D for the flapwise load case exceeds the material-yield strength. This stress value is misleading. The stress was caused by myassumption that I could neglect the Z-axis rotational degree of freedom at thesection C-D. By neglecting the Z-axis rotational degree of freedom, the momentabout the Z-axis caused bending stresses in section C-D. The bending stresses
Table 3.12. Summary of Results for the Numerical Analysis
Flapwise Load Case Lead-Lag Load Case
Peak von Misesstress (psi)
X deflectionat input load
(in)
Peak vonMises stress
(psi)
Z deflectionat input load
(in)Section A-B 11,017 - 10,500 -Section C-D 35,204 - 19,224 -Section E-F 10,789 - 13,300 -End of beam - .191 - .09224

53
caused the peak stress to occur at the edges of the section C-D as shown inFigure 3.13. If I could include the Z-axis rotational degree of freedom in thismodel, I would expect to see uniform tensile stress across section C-D of similarmagnitude to the stress I predicted analytically (4,128 psi).
3.4 Comparison of Analytical and Finite-Element Results
Table 3.13 presents a comparison of the analytical and numerical results. Withthe exception of the stress values at section C-D, the values agree reasonablywell considering the extent of my assumptions in each analysis.
I explained in the previous section that the stress levels for the flapwise loadcase at section C-D are high because I had to constrain the Y-axis rotationaldegree of freedom. However, for the lead-lag load case, the high stress values atsection C-D result from other factors. First, the area of section C-D is smaller inthe numerical model than the analytical model by 33%. (This difference ingeometry was necessary to obtain a model that could be meshed.) Thus, alltensile stresses in the numerical model were roughly 33% larger than those in theanalytical model. Second, the analytical model assumed there was no bendingmoment at section C-D about the Y-axis for the lead-lag load case. However, inthe numerical model, bending does occur at this section. These bending loadshave a significant effect on section C-D because the section modulus at thatsection is small (.065).
I believe the true stress at section C-D for the lead-lag load case is between whatthe analytical and numerical results predict. The analytical results tend to be lowbecause I neglected the bending in section C-D. On the other hand, thenumerical results tend to be high because I reduced the area of section C-D by33% in the finite-element analysis model. A more accurate finite-elementanalysis model would be necessary to better approximate the stress at thissection.
Table 3.13. Comparison of the Analytical and Numerical Stress Values
Flapwise Load Case Stresses Lead-Lag Load Case StressesAnalyticalCalculations
NumericalCalculations
AnalyticalCalculations
NumericalCalculations
Section A-B 5,139 11,017 11,206 10,500Section C-D 4,128 35,204 5,816 19,224Section E-F 4,876 10,789 9,829 13,300

54
4. Experimental Results
Bench testing of a hub body prototype was performed at The University of Texasat Austin Center for Electromechanics to verify the analytical results. Two loadcases were investigated. The load cases simulated the flapwise and lead-lag loadscenarios described in Chapter 3. This chapter discusses the setup, execution,and results of the testing.
4.1 Experiment Setup
Figure 4.1 is a photograph of the experiment. I designed a steel test stand usedto mount one-half of the hub. The test stand could be rotated 90° toaccommodate both load cases (see Figure 4.2 and Figure 4.3). The test standwas fabricated from 1-in-thick plate steel (see Figure 4.4). To secure the hub tothe test stand, a 2.5-in-diameter, SAE 1018 steel teeter pin was installed into thebearing housings. An aluminum teeter-pin clamp was machined to fasten theteeter pin onto the test stand. The test stand then was bolted to a load plate using1-in-diameter all-thread.
I used a 4-in by 2-in piece of SAE 1018 steel flat to simulate the hard link. Thesteel flat was pinned at one end to the aluminum teeter-pin clamp with a ¾-in-diameter grade 8 bolt and pinned at the other with a 5/8-in-diameter grade 8 boltthrough the hard-link mounts.

55
Figure 4.1. Photograph of the experiment setup.
Figure 4.2. Close-up photograph of the flapwise test configuration.

56
Figure 4.3. Close-up photograph of the lead-lag test configuration.

57
4.1.1 Load Application
A 4-in-diameter SAE 1018 steel bar was inserted into the barrel where the bladepitch shaft would normally be installed. The loads were applied to the end of thebar using an Enerpac brand hydraulic hand pump and cylinder. I applied theloads at the end of the steel bar 60 in from the teeter-pin axis (the same locationas in the numerical calculations).
Figure 4.4. Photograph of the test stand.

58
The loads, which were measured using the pressure gauge on the pump, wereobtained by multiplying the pressure by the effective area of the hydrauliccylinder. I used a different hydraulic cylinder for each load case because theheight of the hub changed when I rotated the test stand. The cylinder used forthe flapwise load case (model number RC 102) has an effective area of 2.24 in2
and a stroke of 2 in. The cylinder used for the lead-lag bending test (modelnumber RC 1010) has an effective area of 2.24 in2 and a stroke of 10 in. Thehand pump (model number P-392) was rated at 10,000 psi and had a 2000-psigauge installed with a resolution of 10 psi.
4.1.2 Data Acquisition
Originally, I intended to estimate the stresses and strains in the hub duringtesting using a brittle lacquer. This testing technique involves painting the hubwith a special lacquer paint that changes color under ultraviolet light as thestructure is strained. Unfortunately, the brittle lacquer paint was not available atthe time of testing. I also considered using strain gauges to estimate the strain inthe structure. However, time constraints prevented us from being able to installthe necessary strain gauges.
Ultimately, the hub body deflections were measured using dial gauges at fourdifferent locations. The precise locations of the dial gauges and the intendedfunction of each are presented in Table 4.1.
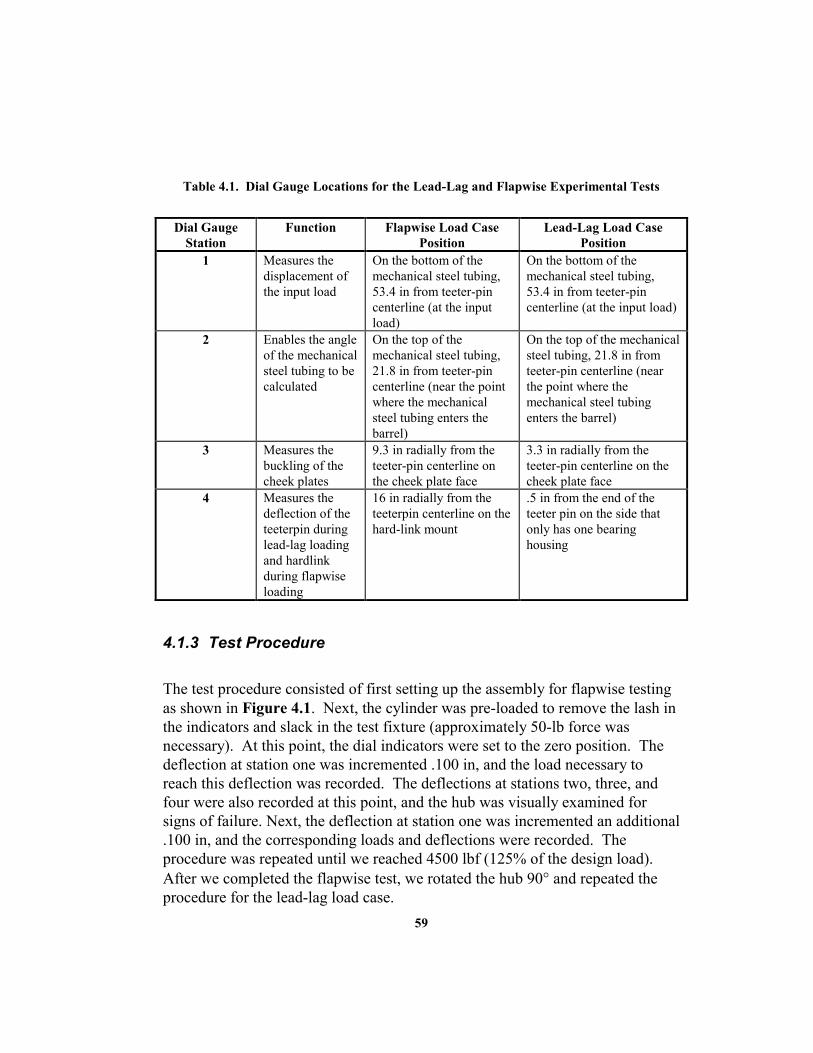
59
Table 4.1. Dial Gauge Locations for the Lead-Lag and Flapwise Experimental Tests
4.1.3 Test Procedure
The test procedure consisted of first setting up the assembly for flapwise testingas shown in Figure 4.1. Next, the cylinder was pre-loaded to remove the lash inthe indicators and slack in the test fixture (approximately 50-lb force wasnecessary). At this point, the dial indicators were set to the zero position. Thedeflection at station one was incremented .100 in, and the load necessary toreach this deflection was recorded. The deflections at stations two, three, andfour were also recorded at this point, and the hub was visually examined forsigns of failure. Next, the deflection at station one was incremented an additional.100 in, and the corresponding loads and deflections were recorded. Theprocedure was repeated until we reached 4500 lbf (125% of the design load).After we completed the flapwise test, we rotated the hub 90° and repeated theprocedure for the lead-lag load case.
Dial GaugeStation
Function Flapwise Load CasePosition
Lead-Lag Load CasePosition
1 Measures thedisplacement ofthe input load
On the bottom of themechanical steel tubing,53.4 in from teeter-pincenterline (at the inputload)
On the bottom of themechanical steel tubing,53.4 in from teeter-pincenterline (at the input load)
2 Enables the angleof the mechanicalsteel tubing to becalculated
On the top of themechanical steel tubing,21.8 in from teeter-pincenterline (near the pointwhere the mechanicalsteel tubing enters thebarrel)
On the top of the mechanicalsteel tubing, 21.8 in fromteeter-pin centerline (nearthe point where themechanical steel tubingenters the barrel)
3 Measures thebuckling of thecheek plates
9.3 in radially from theteeter-pin centerline onthe cheek plate face
3.3 in radially from theteeter-pin centerline on thecheek plate face
4 Measures thedeflection of theteeterpin duringlead-lag loadingand hardlinkduring flapwiseloading
16 in radially from theteeterpin centerline on thehard-link mount
.5 in from the end of theteeter pin on the side thatonly has one bearinghousing

60
4.2 Discussion and Comparison of the Flapwise Load Case Results
The experiment data are presented in Appendix A. This section presentsqualitative observations made during the experiment and a comparison of thepredicted results with the experimental results for the flapwise load case.
4.2.1 Hard-Link Mount Observations
I expected that the first failure signs on the hub body would be cracked welds atthe hard-link mounts. The hard-link mounts are made from an SAE 1018 steeltube with a 5/8-in inner diameter and a ¼-in wall thickness. The tubes arewelded to what I call �doublers.� The doublers are 3/8-in thick, SAE 1018 steeldisks that are welded to the tube and the hub (see Figure 4.5). Although theintent of the tubes and doublers is to spread the load from the hard-link pin tothe cheek plates, they make the stresses in the hard-link mounts difficult topredict. I anticipated that failure in the hard-link mounts would first becomeevident when the welds cracked or the bore in the tubes deformed.
Figure 4.5. Photograph of a hard-link mount.
Tube Doublers

61
In the experiment, a 4-in by 2-in piece of SAE 1018 steel flat was used tosimulate the hard link. The shank of a 5/8-in-diameter bolt simulated the hard-link pin. The bore in the flat for the bolt was approximately .05 in larger thanthe bolt shank. These clearances allowed the bolt to flex significantly during thetest.
The flexure of the hard-link bolts was visually apparent during the experiment.The bolts flexed so much that they yielded and were permanently bent. Althoughthe hard-link bolt yielded during testing, it did not fracture or crack. Because thebolt did not break, there was no need to increase the size or strength of the hard-link pin. In fact, it is desirable that a replaceable component, such as the hard-link pin, yield before a nonreplaceable component.
The hard-link bolt flexure had to be taken into account when comparing thenumerical and experimental results. The magnitudes of the bolt deflections weremeasured during testing using the dial gauge positioned on the hard-link mountat station four. At the peak load, the deflection of the hard-link bolts allowed thehard-link mount to translate .065 in.
4.2.2 Teeter-Pin Observations
At the peak test load, the teeter-pin clamp in the experiment exerted a bendingmoment on the teeter pin that caused bending stresses of approximately 40 kpsiin the teeter pin. The teeter-pin flexure that resulted from these bending stresseswas visually apparent during the experiment. Unfortunately, I did not record theflexure of the teeter pin because I did not deem that information important at thetime of testing. That data would have been useful for correcting the experimentalresults so that they could be compared to the numerical results.
I did not measure the teeter-pin flexure because I knew that the stress in theteeter pin would be more severe during bench-testing than during a windstorm.The deformation will be less during a windstorm because the hub will be parkedand yawed out of the wind. In this configuration, the two halves of the hub willapply bending moments in opposite directions, thus canceling the bendingeffects on the teeter pin.

62
4.2.3 Hub Body Observations
The hub body fared well during testing. I did not visually detect any crackedwelds or permanently deformed components. In fact, after the test wascompleted and the loads were relieved, the dial gauges on the mechanical steelbar and the cheek plates returned to their original readings. This implies that thehub body suffered primarily elastic deformations.
Further proof that the hub body suffered primarily elastic deformations is givenby Figure 4.6. This figure is a plot of the predicted and experimental loadsinduced when the hub is deflected in the flapwise direction. Figure 4.6 showsthat the relationship between the applied load and deflection is linear.
Figure 4.6. Predicted and experimental deflections for the flapwise load case.
Ideally, I could have compared the experimental results with the predictedresults using the stresses in the hub body. To make this comparison, I needed tomeasure or calculate the hub body stresses or strains during testing.Unfortunately, the four dial gauges used during testing did not provide enoughstrain information to calculate the stresses at the areas of interest. Thus, I couldnot compare the results using stress.
0500
100015002000250030003500400045005000
0.0 0.1 0.2 0.3 0.4 0.5 0.6 0.7 0.8 0.9 1.0 1.1 1.2
Deflection (in)
Load
(lbf
)
Flapwise experimental resuts Flapwise numerical resultsCorrected flapwise experimental results
63
However, I did compare the predicted and experimental results using stiffness.The stiffness of the hub was computed for the experimental results by findingthe slope of the curves in Figure 4.6. The stiffness for the predicted results wascalculated using the deflections from the finite-element simulation. To obtainthe predicted stiffness, I divided the load on the finite-element analysis model bythe corresponding deflection at the end of the mechanical bar. This calculationresults in a stiffness of 9,984 lbf/in for the flapwise load case.
Figure 4.6 presents raw data and corrected data for the flapwise test. I correctedthe experiment data so that I could better compare the predicted andexperimental results. During the experiment, the flexure of the hard-link bolts,teeter pin, and test stand reduced the apparent stiffness of the hub assembly. Icould not include this flexure in my finite-element analysis model because of thelimited version of ANSYS I used.
To correct for the flexure in the hard-link bolts, I used trigonometry to estimatethat station one (the input load) deflected 3.3 in for every inch the hard-link boltsdeflected. I corrected for the flexure by multiplying the measured translation ofthe hard-link mount by 3.3 and subtracting this figure from the deflectionsmeasured at station one. This correction amounted to a 25% increase in themeasured stiffness of the hub body.
I used strength-of-materials calculations to correct for the teeter-pin flexurebecause I did not measure the teeter-pin deflection during the flapwise test. Iassumed that the teeter pin was a cantilevered bar with an end load. I calculatedthe deflection of the teeterpin using the flexure formula given by Shigley andMischke [23]. I then related the deflection of the teeter pin back to thedeflection at the input load using trigonometric formulas. This correctionincreased the stiffness values by approximately 11%.
I believe that the test stand flexed because we did not properly tension the all-thread rod used to clamp it to the load plate. We did not use a torque wrench toproperly tighten the nuts on the all-thread. Thus, it is likely that the all-threadstretched during testing.
Unfortunately, I did not measure the test stand deflections during theexperiment. However, I did correct for the lengthening of the all-thread rod usedto fasten the test stand to the load plate. To calculate this correction, I assumed

64
that the bolts had no pre-tension. I approximated the deflection of the bolt usingthe equation for the extension of a uniform bar [24] under an axial load. I thenrelated the deflection of the test stand to the deflection at the input load usingtrigonometric formulas. This correction increased the stiffness values byapproximately 5%.
Table 4.2 presents the predicted and experimental flapwise stiffness of the hubbody. Although the corrections I made for the hard link, teeter pin, and teststand flexure increased the experimental stiffness by 53%, the experimentalstiffness is still 32% lower than the predicted stiffness.
I believe the remaining difference between the predicted and experimentalresults is primarily due to the simplifying assumptions I made on the finite-element model. As described in Section 3.2.1, I made several assumptions inthe finite-element model necessary to reduce the model to a manageable size.
One assumption I was not able to account for was the fifth assumption in section3.2.1. This assumption neglects the Y-axis rotational degree of freedom of theteeter pin. The hub was designed to rotate about the teeter pin. Thus, section C-D should have had an unconstrained rotational degree of freedom about the Y-axis. However, the tetrahedral element used in the finite element model has norotational degrees of freedom. Thus, the rotational degrees of freedom had to beneglected at this section. This assumption caused bending stresses to form atthe section C-D, which did not occur in the experiment. These bending stressesartificially increased the stiffness of the numerical model.
In summary, it was difficult to compare the numerical and experimental resultsbecause I had very little strain data from the experiment. In addition, the finite-element model was much simpler than the experiment. I corrected theexperiment data analytically, but the experimental stiffness was still 32% lessthan the experimental stiffness. A more valid comparison of the numericalmodel could have been made if I could have included the test fixture in the
Table 4.2. Flapwise Stiffness Values for the Hub Body
PredictedStiffness(lbf / in)
ExperimentalStiffness(lbf / in)
CorrectedExperimental Stiffness
(lbf / in)9,984 4,441 6,823

65
finite-element model or if the flexure of the test stand had been measured duringthe experiment.
Despite the 32% difference in the predicted and experimental results, the testwas still a success. I was able to ease my concern that the hard-link mountswould fail, and I learned that the hard-link pins are most likely the first item tofail.
4.3 Discussion and Comparison of the Lead-Lag Load CaseResults
This section presents the qualitative observations and quantitative results of thelead-lag testing, as well as a comparison of the predicted results with theexperimental results for the lead-lag load case. As in the previous section, Imade the comparison using the stiffness of the hub body.
4.3.1 Teeter-Pin Observations
The primary purpose of the lead-lag testing is to ensure the hub body structure isstructurally adequate in the lead-lag direction. Unlike the flapwise load case, theteeter-pin loading is negligible in the lead-lag load case because the bendingmoments from each half of the hub cancel each other. However, in theexperiment, only one-half of the hub was loaded. This uneven loading subjectedthe teeter pin to unrealistic bending moments. This teeter-pin loading caused theteeter pin to flex. At the peak load, this deflection amounted to .138 in. I had toaccount for this flexure when calculating the experimental stiffness of the hubbody.
4.3.2 Hub Body Observations
After the test was completed and the loads relieved, the dial gauges on themechanical steel bar and the cheek plates returned to their original readings.This implies that the hub body suffered primarily elastic deformations in thelead-lag load case. Further proof that the hub body structure suffered elasticdeformations is given by Figure 4.7. In this figure, the relationship between theapplied load and deflection is linear.
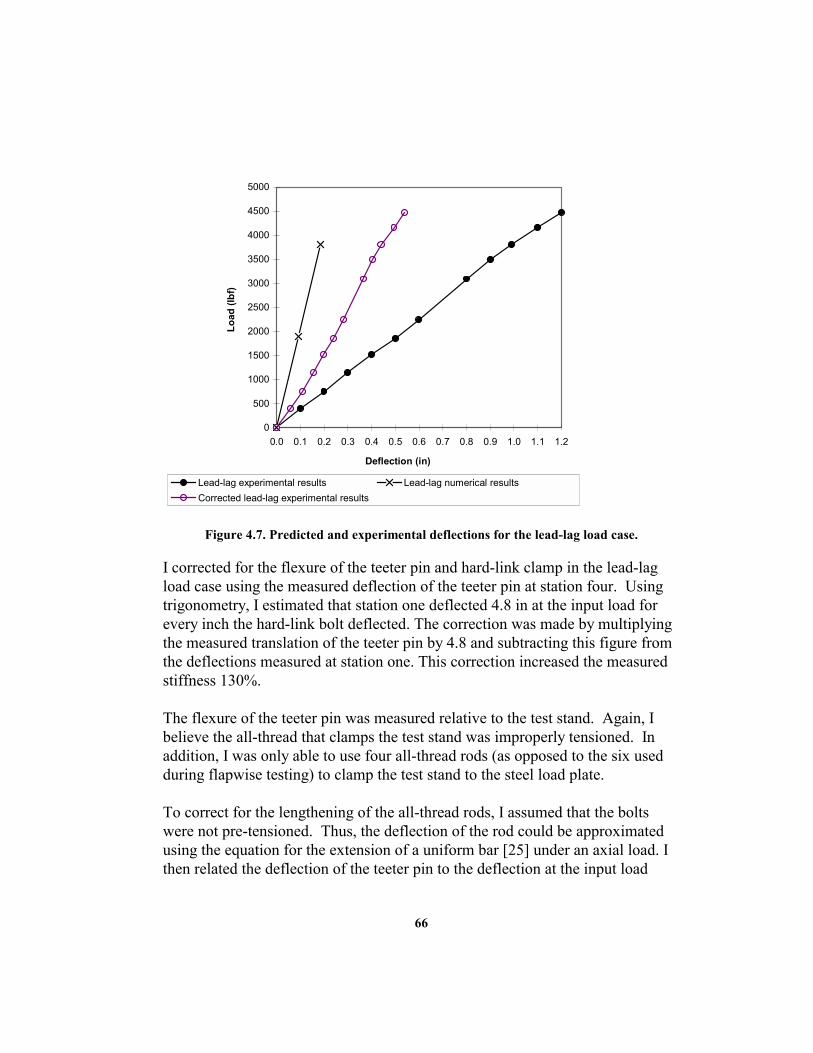
66
Figure 4.7. Predicted and experimental deflections for the lead-lag load case.
I corrected for the flexure of the teeter pin and hard-link clamp in the lead-lagload case using the measured deflection of the teeter pin at station four. Usingtrigonometry, I estimated that station one deflected 4.8 in at the input load forevery inch the hard-link bolt deflected. The correction was made by multiplyingthe measured translation of the teeter pin by 4.8 and subtracting this figure fromthe deflections measured at station one. This correction increased the measuredstiffness 130%.
The flexure of the teeter pin was measured relative to the test stand. Again, Ibelieve the all-thread that clamps the test stand was improperly tensioned. Inaddition, I was only able to use four all-thread rods (as opposed to the six usedduring flapwise testing) to clamp the test stand to the steel load plate.
To correct for the lengthening of the all-thread rods, I assumed that the boltswere not pre-tensioned. Thus, the deflection of the rod could be approximatedusing the equation for the extension of a uniform bar [25] under an axial load. Ithen related the deflection of the teeter pin to the deflection at the input load
0
500
1000
1500
2000
2500
3000
3500
4000
4500
5000
0.0 0.1 0.2 0.3 0.4 0.5 0.6 0.7 0.8 0.9 1.0 1.1 1.2
Deflection (in)
Load
(lbf
)
Lead-lag experimental results Lead-lag numerical resultsCorrected lead-lag experimental results

67
using trigonometric formulas. This all-thread correction increased the stiffnessvalues by approximately 9%.
Table 4.3 presents the stiffness of the hub body for the predicted andexperimental analyses for the lead-lag load case. Although the corrections Imade to the teeter pin and test stand increased the experimental stiffness valuesby 181%, the experimental stiffness is still approximately half of the predictedstiffness. I believe the remaining discrepancy between the two values is causedprimarily by flexure of the test stand and one of my simplifying assumptions forthe finite-element analysis model.
I did not measure the deflection of the test stand. The corrections I made for thedeflection of the test stand all-thread rods were analytical and are therefore onlyapproximate. A more valid comparison of the numerical model could be made ifthe test fixture was included in the finite-element model or if the flexure of thetest stand could be better measured during the experiment.
The third assumption in Section 3.2.1 assumes that the teeter-pin axis on thefinite-element model is on the same Y-Z plane as the barrel centerline axis. Onthe prototype, the X coordinate of the teeter-pin axis is positioned 2.5 indownwind of the barrel axis. Thus, the webs are slanted 15° from vertical sothat they reach from the teeter pin to the top of the barrel. This geometry causestorsion in the webs, which is not represented on the finite-element analysismodel.
Table 4.3. Structural Stiffness Values for the Hub Body during Lead-Lag Loading
NumericalStiffness(lbf / in)
ExperimentalStiffness(lbf / in)
CorrectedExperimental Stiffness
(lbf / in)20,630 3,792 10,668
In summary, like the flapwise load case, it is difficult to obtain a good agreementbetween the predicted and experimental results. This difficulty stems from thesimplicity of the numerical model and the lack of data recorded during theexperiment.
Despite the significant difference in the predicted and experimental results, thelead-lag test was still a success. I am now confident that the hub will withstandthe design load. Another benefit from the experiment is that I learned how to

68
design a test, and I gained experience in building finite-element models. Iffurther modeling of the hub is required, I will be able to better predict itsresponse because I have a better understanding of which data to collect. I willalso be able to create a more accurate finite-element analysis model.

69
5. Conclusions and RecommendationsIn this thesis, I presented the design, analysis, and testing of a two-bladed hub.This section discusses my conclusions and recommendations on my design,methodology, and testing techniques, as well as work on the hub that remains tobe completed.
5.1 Design Methodology
Although NREL has not yet installed and tested the hub, the design shouldsatisfy all the design specifications with only one known exception. The teeterangle range will be 18° rather than 20° as specified. The reason for thisdiscrepancy is that the final geometry of the hub body varies slightly from theintended design. Specifically, the barrel is positioned approximately .1 in lowerthan intended. Thus, the barrel strikes the adapter bolts 2° too early at each endof the teeter range.
I believe this deviation in hub geometry is due to my lack of emphasis oncreating a design with wide manufacturing tolerance margins. Specifically, thetolerances I specified for jigging and welding the hub could not be held. Oneway I could have increased size of the tolerance zone would have been to makethe hub shaft slightly longer, thus allowing the blades to rotate through the entireteeter range without hitting the bolts on the hub shaft. In future design work, Iwill emphasize keeping manufacturing tolerance margins as large as possible.
For future designs, I will also try to rely less on preferences to make importantdesign decisions. I followed the Phal and Bietz methodology whenever possible;however, time and resource constraints forced me to tailor the Phal and Bietzmethodology to my needs. One methodology compromise I had to make was toforgo using a quantitative set of evaluation criteria for the solution principles.Instead, I had to rely more on preference. One result of relying on preferencewas my premature dismissal of the box-style body principle. I regret notdeveloping this principle further because it would have been easier to construct,and it might have made it easier to mount the boom.
My lack of manufacturing experience also affected the design. One principle Ioverlooked during the conceptual design stage was to machine the entire hubfrom billet aluminum using computer numerically controlled machines.

70
Building the hub from billet may have been faster and less costly than jiggingand welding the hub body structure.
In future designs of this complexity, I will try to use a parametric solid-modelingpackage. I designed the hub during summer 1995 using AutoCAD Release 12on a computer with a 33-megahertz (MHz) 486 central processing unit and 16megabytes of RAM. I decided not to use solid-modeling features of AutoCADR12 because they were awkward and slow.
I now use a computer with 128 megabytes of RAM and a 133-MHz PentiumCPU; in addition, I routinely use the solid-modeling features of AutoCAD.With today�s hardware and software, I would strongly recommend using aparametric modeling tool such as AutoCAD Mechanical Desktop or ProEngineer.
As the hub design became increasingly complex, it became time consuming tomake any changes in the geometry of the structure. Such changes required manymodifications to each view of my two-dimensional model. A parametric solid-modeling package would have allowed me to update the model more quickly. IfI had used parametric modeling software, I believe I would have had more timeto investigate the solution principles. Furthermore, the solid models would havemade it easier for me to review my work with others.
I also recommend integrating finite-element modeling into the design process.When I began designing the hub, I had no experience with finite-elementanalysis software, and I did not have time to learn how to perform a finite-element analysis. However, if I had been able to use a finite-element analysispackage, I could have saved time by performing less extensive mechanics-of-solids calculations. In addition, I would have had a better understanding of whatdata needed to be collected during the bench-testing. For example, I could haveused the finite-element analysis results to determine where strain gauges shouldbe applied on the hub during the experiment.
Overall, I am satisfied with the design methodology I used. It helped me designa hub that meets all but one of the design specifications. In future designs, I willplace a greater emphasis on maintaining wide manufacturing-design margins andbe more wary of using preferences to select solution principles. I will also try toimplement design tools such as parametric solid modeling and finite-elementanalysis software, which will make the design processes more efficient.

71
5.2 Analysis and Testing
According to specifications, the hub should withstand 144 mph winds. Iconcluded from my stress analyses and bench-testing that the hub will meet thisspecification. The hub body components that were of questionable strength,however, were the hard-link mounts and the web structure of the hub body. Iperformed analytical and numerical calculations on these components, and Iverified the calculations by bench-testing a prototype of the hub.
The analytical calculations predicted that the peak stress in the hub body (11,200psi) will occur during the lead-lag load case in the web at section A-B. Thefinite-element analysis predicted a peak stress of 10,500 psi at this section. Thisstress is roughly one-third the yield strength of the steel used in the structure.Thus, the resulting safety factor against yielding is three.
Fatigue is not likely to be a problem in the hub body. The peak operating loadsmeasured on the three-bladed hub are roughly 20% of loads I designed the hubto withstand. Thus, I anticipate the operating loads will be roughly 20% of thedesign loads, or 2.1 kpsi. The endurance limit for A36 steel is approximately 30kpsi. Thus, the safety factor against fatigue in the hub body is nearly fifteen.
Ideally, I could have compared the predicted and experimental results for the hubbody based on stress; however, I could not collect sufficient strain informationduring the experiment to make this comparison. However, visual inspection ofhub body did not reveal any cracked welds or permanent deformation. A brittle-lacquer test or strain gauges would have been necessary to determine moreprecisely what the stresses on the hub body actually are.
I was able to compare the predicted and experimental results using stiffness.The difference between the predicted and experimental stiffness results isexplained by the differences in the models. The finite-element analysissimulation did not model the rigidity of the test stand or the flexure ofcomponents such as the teeter pin and hard-link pins. A more valid comparisonof the numerical model could be made if the test fixture was included in thefinite-element model or if the flexure of the test stand could be better measuredduring the experiment.

72
5.3 Future Work
Since 1992 the NWTC has been trying to obtain permission from the NationalAeronautics and Space Administration (NASA) to run the UnsteadyAerodynamics Experiment in the 120-ft by 80-ft NASA-Ames wind tunnel. In1996, NASA granted the NWTC tunnel time for the end of 1998. This testingwill be unprecedented in that it has enormous potential to lead to betterunderstanding of the aerodynamics of wind turbines.
Much work remains to be done to prepare the hub for testing. The scope of myproject did not include installing, instrumenting, or preparing the hub for theNASA-Ames test. However, after completing the design of the hub, NRELoffered me a one-year contract to help with this work.
At the time of this writing, I am designing the instrumentation mounts tomeasure the flap angle and pitch angle. I am also designing a blade-pitch hard-stop and limit-switch assembly. Another task I must complete is the design andconstruction of the pitch control system. NWTC engineer Lee J. Fingersh andmaster technician Dave Jager are currently working on this task.
We expect to remove the three-bladed Unsteady Aerodynamics Experiment rotorand install the two-bladed rotor by the end of 1997. The hub will be field-testedin 1998 and run in the 120-ft by 80-ft NASA-Ames wind tunnel in December1998.

73
Appendix A. Hub Body Experiment Data
This appendix includes the raw and corrected test data for the flapwise and lead-lag testing. Below is a table of contents for the appendix.
Table A1. Flapwise Test Data ������.��..74Table A2. Corrected Flapwise Test Data ����..75Table A3. Lead-Lag Test Data..��.������76Table A4. Corrected Lead-Lag Test Data ��.��77

74
Table A1. Flapwise Test Data
Flapwise Dial Gauge ReadingsPump
Pressure(psi)
CalculatedLoad(lbf)
Station 1(in)
Station 2(in)
Station 3(in)
Station 4(in)
0 0 0.000 0.100 0.0000 0.100140 314 0.100 0.130 0.0001 0.109310 694 0.200 0.162 -0.0043 0.120500 1120 0.300 0.193 -0.0158 0.126730 1635 0.400 0.225 -0.0165 0.131920 2061 0.500 0.258 -0.0165 0.137
1140 2554 0.600 0.290 -0.0200 0.1421340 3002 0.700 0.322 -0.0230 0.1481560 3494 0.800 0.356 -0.0260 0.1531740 3898 0.900 0.390 -0.0287 0.1581900 4256 1.000 0.425 -0.3200 0.1652000 4480 1.030 0.435 -0.3250 0.167
0 0 0.000 0.177 -0.0150 0.151

75
Table A2. Corrected Flapwise Test Data
Dial GaugeReadings at
Station 1(in)
Corrections for Station 1 Corrected DialGauge Readings
at Station 1(in)
Correction forTeeter-pin Bolt
Flexure
Correction forTeeter-pin
Flexure
Correction forStand-bolt
Flexure0.000 0.000 0.000 0.000 0.0000.100 -0.030 -0.007 -0.003 0.0600.200 -0.066 -0.016 -0.007 0.1110.300 -0.086 -0.025 -0.012 0.1770.400 -0.102 -0.037 -0.017 0.2430.500 -0.122 -0.047 -0.022 0.3090.600 -0.139 -0.058 -0.027 0.3770.700 -0.158 -0.068 -0.032 0.4420.800 -0.175 -0.079 -0.037 0.5090.900 -0.191 -0.088 -0.041 0.5791.000 -0.215 -0.096 -0.045 0.6441.030 -0.221 -0.101 -0.047 0.6600.000 -0.168 0.000 0.000 -0.168

76
Table A3. Lead-Lag Test Data
Lead-Lag Dial Gauge ReadingsPump
Pressure(psi)
CalculatedLoad (lbf)
Station 1(in)
Station 2(in)
Station 3(in)
Station 4(in)
0 0 0.000 0.500 0.000 0.0000180 403 0.100 0.470 0.005 0.0050340 762 0.200 0.436 0.012 0.0120510 1142 0.300 0.402 0.019 0.0190680 1523 0.400 0.368 0.027 0.0270830 1859 0.500 0.333 0.034 0.0340
1000 2240 0.600 0.298 0.042 0.04651380 3091 0.800 0.230 0.057 0.07061560 3494 0.900 0.195 0.064 0.07761700 3808 0.990 0.180 0.071 0.14861860 4166 1.100 0.127 0.079 0.15662000 4480 1.200 0.042 0.085 0.1626

77
Table A4. Corrected Lead-Lag Test Data
Dial GaugeReadings at
Station 1(in)
Corrections for Station 1 Corrected DialGauge Readings
at Station 1(in)
Correction forTeeter-Pin
Flexure
Correction forStand-Bolt
Flexure0 0.000 0.000 0.000
180 -0.041 -0.009 0.051340 -0.091 -0.016 0.093510 -0.144 -0.024 0.132680 -0.202 -0.032 0.166830 -0.259 -0.039 0.201
1000 -0.319 -0.047 0.2331380 -0.435 -0.066 0.3001560 -0.494 -0.074 0.3321700 -0.550 -0.081 0.3601860 -0.605 -0.088 0.4072000 -0.662 -0.095 0.443

78
Bibliography
1. De Renzo, D.J. (1979). Wind Power: Recent Developments. NewJersey:Noyes Data Corporation, pp. 5-7.
2. Gipe, P. (1995). Wind Energy Comes Of Age. John Wiley & Sons, pp. 12-13.
3. Gipe, P. (Spring 1997). Wind Stats Newsletter; Vol. 10, No. 2, p. 8.
4. U.S. Department of Energy. Wind Energy Program Overview. Fiscal Years1995 and 1996, p 2.
5. Ibid.
6. Hunt, D.V. (1981). Wind Power: A Handbook on Wind Energy Systems.Litton Educational Publishing, p. 527.
7. Gipe, P. (1995). Wind Energy Comes of Age. John Wiley & Sons, p. 172.
8. Ibid., p. 176.
9. Overview of NREL. (January 1997). http://www.nrel.gov/lab/overview.html.
10. Ibid.
11. Simms, D.A.; Butterfield, C.P. (1994). �Full-Scale Wind Turbine RotorAerodynamics Research.� European Wind Energy Conference�1994; October10-14, 1994; Thessaloniki, Greece. Golden, CO: National Renewable EnergyLaboratory; pp 1-2.
12. Phal, G; Bietz, W. (1988). Engineering Design a Systematic Approach.United Kingdom: Biddles Ltd; pp. 40-43.
13. Fingersh, L. J. (June 1995). Personal communication. NREL, Colorado.
14. Ibid.

79
15. Phal, G; Bietz, W. (1988). Engineering Design a Systematic Approach.United Kingdom: Biddles Ltd; pp. 40-43.
16. Ibid., p. 197
17. Garlock Bearings, Inc. Catalog #881, p 1.
18. AWT 26 Operation and Maintenance Manual. (1993).
19. Marks, Lionel S. (1987) Marks' standard handbook for mechanicalengineers. McGraw-Hill, pp. 8-125.
20. Mischke, C.R.; Shigley, J.E. (1989). Mechanical Engineering Design. 5th
edition. McGraw-Hill, p. 250.
21. Ibid.
22. ANSYS Basic Analysis Procedures Guide. (1995). pp. 5-34.
23. Mischke, C.R.; Shigley, J.E. (1989). Mechanical Engineering Design. 5th
edition. McGraw-Hill, p. 735.
24. Ibid., p. 93.
25. Ibid.

REPORT DOCUMENTATION PAGE
Form Approved OMB NO. 0704-0188
Public reporting burden for this collection of information is estimated to average 1 hour per response, including the time for reviewing instructions, searching existing data sources, gathering and maintaining the data needed, and completing and reviewing the collection of information. Send comments regarding this burden estimate or any other aspect of this collection of information, including suggestions for reducing this burden, to Washington Headquarters Services, Directorate for Information Operations and Reports, 1215 Jefferson Davis Highway, Suite 1204, Arlington, VA 22202-4302, and to the Office of Management and Budget, Paperwork Reduction Project (0704-0188), Washington, DC 20503. 1. AGENCY USE ONLY (Leave blank)
2. REPORT DATE
June 2002
3. REPORT TYPE AND DATES COVERED
Technical Report
4. TITLE AND SUBTITLE The Mechanical Design, Analysis, and Testing of a Two-Bladed Wind Turbine Hub
6. AUTHOR(S) Jason Rust Cotrell
5. FUNDING NUMBERS
TA: WER2.1460
7. PERFORMING ORGANIZATION NAME(S) AND ADDRESS(ES)
National Renewable Energy Laboratory 1617 Cole Blvd. Golden, CO 80401-3393
8. PERFORMING ORGANIZATION
REPORT NUMBER NREL/TP-500-26645
9. SPONSORING/MONITORING AGENCY NAME(S) AND ADDRESS(ES)
National Renewable Energy Laboratory 1617 Cole Blvd. Golden, CO 80401-3393
10. SPONSORING/MONITORING
AGENCY REPORT NUMBER NREL/TP-500-26645
11. SUPPLEMENTARY NOTES
12a. DISTRIBUTION/AVAILABILITY STATEMENT
National Technical Information Service U.S. Department of Commerce 5285 Port Royal Road
Springfield, VA 22161
12b. DISTRIBUTION CODE
13. ABSTRACT (Maximum 200 words) Researchers at the National Wind Technology Center (NWTC) in Golden, Colorado, began performing the Unsteady Aerodynamics Experiment in 1993 to better understand the unsteady aerodynamics and structural responses of horizontal-axis wind turbines. The experiment consists of an extensively instrumented, downwind, three-bladed, 20-kilowatt wind turbine. In May 1995, I received a request from the NWTC to design a two-bladed hub for the experiment. For my thesis, I present the results of the mechanical design, analysis, and testing of the hub. The hub I designed is unique because it runs in rigid, teetering, or independent blade-flapping modes. In addition, the design is unusual because it uses two servomotors to pitch the blades independently. These features are used to investigate new load reduction, noise reduction, blade pitch optimization, and yaw control techniques for two-bladed turbines. I used a methodology by G. Phal and W. Bietz to design the hub. The hub meets all the performance specifications except that it achieves only 90% of the specified teeter range. In my thesis, I focus on the analysis and testing of the hub body. I performed solid-mechanics calculations, ran a finite-element analysis simulation, and experimentally investigated the structural integrity of the hub body.
15. NUMBER OF PAGES
14. SUBJECT TERMS wind turbine; turbine testing; two-bladed wind turbine hub; wind turbine design analysis
16. PRICE CODE
17. SECURITY CLASSIFICATION
OF REPORT Unclassified
18. SECURITY CLASSIFICATION
OF THIS PAGE Unclassified
19. SECURITY CLASSIFICATION
OF ABSTRACT Unclassified
20. LIMITATION OF ABSTRACT
UL
NSN 7540-01-280-5500 Standard Form 298 (Rev. 2-89) Prescribed by ANSI Std. Z39-18 298-102