nrdc: still poisoning the well - atrazine continues to contaminate
TRANSCRIPT
Blank Page i
April 2010 Still Poisoning the Well
Atrazine Continues to Contaminate Surface Water and Drinking Water in the United States
AuthorsMae Wu
Mayra Quirindongo
Jennifer Sass
Andrew Wetzler
About NRDCThe Natural Resources Defense Council (NRDC) is a national nonprofit environmental organization with more than 1.3 million members and online activists. Since 1970, our lawyers, scientists, and other environmental specialists have worked to protect the world’s natural resources, public health, and the environment. NRDC has offices in New York City, Washington, D.C., Los Angeles, San Francisco, Chicago, Montana, and Beijing. Visit us at www.nrdc.org.
AcknowledgmentsThe Natural Resources Defense Council gratefully acknowledges the Park Foundation for its generous support of our work. The authors would also like to thank those people that provided review and comments on this report, including NRDC scientific staff and scientific experts from government and academia.
NRDC Director of Communications: Phil GutisNRDC Deputy Director of Communications: Lisa GoffrediNRDC Publications Director: Anthony ClarkProduction: Tanja Bos, [email protected]
Copyright 2010 by the Natural Resources Defense Council.
This report is printed on paper that is 100 percent post-consumer recycled fiber, processed chlorine free.
i
Table of Contents
Executive Summary ii
Chapter 1: A Fresh Look at the Harmful Effects of Atrazine 1
Chapter 2: Revisiting the Problem of Atrazine Contamination and Inadequate 4 Attempts to Address It
Chapter 3: Atrazine Contamination Continues to be a Widespread Problem 6
Chapter 4: Recommendations for Curbing Atrazine Contamination 14
Appendix (Full Atrazine Monitoring Program Data) 16
Endnotes 22
Still Poisoning the Well: Atrazine Continues to Contaminate Surface Water and Drinking Water in the United States
ii
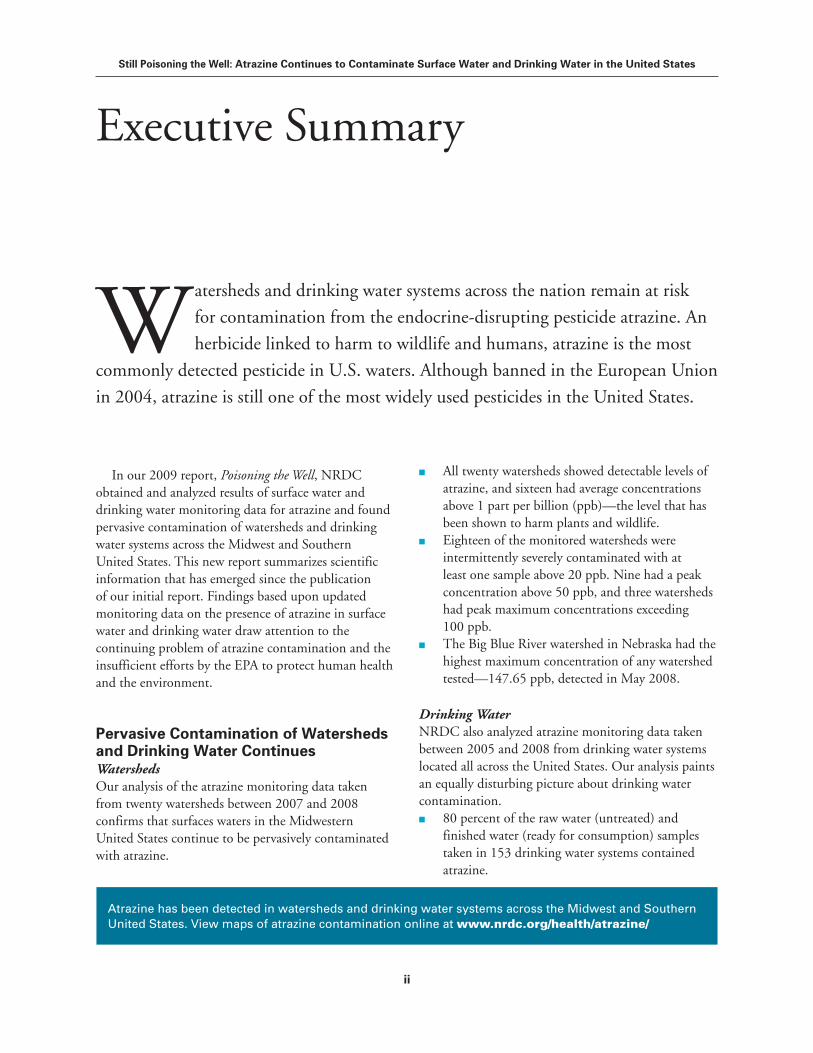
Executive Summary
Watersheds and drinking water systems across the nation remain at risk
for contamination from the endocrine-disrupting pesticide atrazine. An
herbicide linked to harm to wildlife and humans, atrazine is the most
commonly detected pesticide in U.S. waters. Although banned in the European Union
in 2004, atrazine is still one of the most widely used pesticides in the United States.
In our 2009 report, Poisoning the Well, NRDC obtained and analyzed results of surface water and drinking water monitoring data for atrazine and found pervasive contamination of watersheds and drinking water systems across the Midwest and Southern United States. This new report summarizes scientific information that has emerged since the publication of our initial report. Findings based upon updated monitoring data on the presence of atrazine in surface water and drinking water draw attention to the continuing problem of atrazine contamination and the insufficient efforts by the EPA to protect human health and the environment.
Pervasive Contamination of Watersheds and Drinking Water ContinuesWatershedsOur analysis of the atrazine monitoring data taken from twenty watersheds between 2007 and 2008 confirms that surfaces waters in the Midwestern United States continue to be pervasively contaminated with atrazine.
n All twenty watersheds showed detectable levels of atrazine, and sixteen had average concentrations above 1 part per billion (ppb)—the level that has been shown to harm plants and wildlife.
n Eighteen of the monitored watersheds were intermittently severely contaminated with at least one sample above 20 ppb. Nine had a peak concentration above 50 ppb, and three watersheds had peak maximum concentrations exceeding 100 ppb.
n The Big Blue River watershed in Nebraska had the highest maximum concentration of any watershed tested—147.65 ppb, detected in May 2008.
Drinking WaterNRDC also analyzed atrazine monitoring data taken between 2005 and 2008 from drinking water systems located all across the United States. Our analysis paints an equally disturbing picture about drinking water contamination. n 80 percent of the raw water (untreated) and
finished water (ready for consumption) samples taken in 153 drinking water systems contained atrazine.
Atrazine has been detected in watersheds and drinking water systems across the Midwest and Southern United States. View maps of atrazine contamination online at www.nrdc.org/health/atrazine/
Still Poisoning the Well: Atrazine Continues to Contaminate Surface Water and Drinking Water in the United States
iii
n Of the 153 drinking water systems monitored,100 systems had peak maximum concentrations of atrazine in their raw water that exceeded 3 ppb. Two-thirds of these 100 systems also had peak maximum concentrations of atrazine that exceeded 3 ppb in the finished water.
n Six water systems had high enough atrazine levels to exceed the EPA drinking water standard of 3 ppb.
These results represent only a sampling of public water systems in the United States. Thousands more drinking water systems may be unknowingly contaminated with atrazine, since the federal government only requires monitoring four times a year—compared to the more frequent weekly and bi-weekly monitoring data that we analyzed here. As such, the full extent of atrazine contamination of watersheds and drinking water systems across the United States is unknown.
Harm from Atrazine Exposure is Well DocumentedThe dangers associated with atrazine use have been well documented, and scientific data continue to emerge that further bolster the health concerns associated with atrazine exposure. The pesticide is an endocrine disruptor, impairs the immune system, and is associated with birth defects. The adverse effects of exposure to atrazine are particularly harmful during critical periods of development. And in the presence of other pesticides, atrazine works synergistically to increase the toxic effects stemming from expose to the harmful chemicals.
Current Regulations Do Not Adequately Protect Human HealthTwo statutes principally govern the regulation of atrazine. Under the Federal Insecticide, Fungicide, and Rodenticide Act (FIFRA), the EPA allows atrazine use both in agriculture (such as on corn, sorghum, and sugarcane) and at home (such as on lawns). Under the Safe Drinking Water Act, the EPA regulates the amount of atrazine that is allowed in drinking water. Specifically, only 3 ppb of atrazine (calculated based on a running annual average) is permitted in finished drinking water. NRDC believes a running annual
average approach for drinking water is inadequate to protect human health, because even one-time exposures to developmental toxins like atrazine during critical periods of development may cause harm.
Our analysis of the data reinforces the fact that the monitoring schedule, set by the drinking water regulations, fails to guard against high spikes in atrazine levels or even ensure that the EPA’s annual average limit on atrazine contamination is not being exceeded. Because public water systems are only required to take one to four samples per year, they are likely to miss a lot of the high spikes that we found. This means both that the EPA is ignoring high spikes of atrazine in drinking water and that the running annual average of atrazine in a system may actually be higher than suggested by four samples. Even short-duration exposures to atrazine should be regulated by the EPA.
Atrazine Use Imposes High Costs on Drinking Water SystemsSeveral studies have concluded that atrazine use provides only minimal benefits to crop production. On the other hand, the cost of treating drinking water for atrazine can add high costs to municipalities that have to install expensive treatment technology to remove the contaminant. Small systems located around agricultural areas where atrazine is frequently used may be particularly vulnerable to contamination problems and must spend a significant portion of their budgets to protect their customers from atrazine exposure. Water systems spend tens of thousands of dollars per year to maintain treatment systems that remove contaminants such as atrazine.
Recommendations for Reducing Atrazine ContaminationNRDC called for the phase-out of atrazine because of its harm to wildlife and potentially to people and because it has minimal or no benefits for crop production. Programs to improve water monitoring and encourage farmers to reduce their atrazine use are important next steps for addressing the problem of atrazine contamination while the EPA helps farmers transition away from the use of this pesticide altogether. NRDC recommends the following steps be taken to reduce atrazine contamination in U.S. waters
Still Poisoning the Well: Atrazine Continues to Contaminate Surface Water and Drinking Water in the United States
iv
and minimize its impacts on human health and the environment:
1. The United States should phase out the use of atrazine. NRDC strongly recommends that atrazine be phased out of all uses in the United States, including home gardens and golf courses. Evidence of atrazine’s toxic effects on sensitive wildlife species and its potential risk to human health is abundant. The monitoring data show that high contamination levels in the Midwestern and Southern United States are pervasive. There is little compelling evidence that atrazine is needed by farmers.
2. Farmers should take immediate interim steps to reduce their atrazine use. Farmers should take immediate steps to reduce their use of atrazine, including increasing reliance on a vari-ety of non-chemical techniques for weed control. These include crop rotation, the use of winter cover crops, alternating rows of different crops, and mechanical weed control methods. Additionally, timing fertilizer applications to coincide with periods of greatest nutri-ent uptake by crops can avoid unnecessary fertilizer use that would fuel weed growth.
3. The EPA should monitor all vulnerable water-sheds and require all future monitoring plans to identify worst case scenarios.The EPA should broaden the monitoring program to assess all watersheds identified as vulnerable. The monitoring data in this update represent less than 2 percent of all the watersheds that are at highest risk from atrazine contamination. Future monitoring plans should be designed to identify the worst case scenarios occurring in vulnerable watersheds and in public water systems. More frequent sampling and sampling after big rainstorms and after fields have been treated with atrazine is necessary to assess the impacts of atrazine use on waterways. Such monitoring would provide a much more realistic view of the actual severity of the atrazine problem.
4. The EPA should publish monitoring results for each watershed and public water system sampled.Monitoring results on the watersheds and the public water systems that were sampled under the two different monitoring programs were first made available to NRDC through Freedom of Information
Act (FOIA) requests and litigation. People who live downstream of atrazine-treated fields have a right to know about high levels of atrazine contamination in their watersheds or drinking water systems. A publicly available website posting sampling data as it is analyzed and that regularly reports spikes of atrazine contamination would be an important step in the right direction, providing accessible information to the public. An interactive map of the data used in Poisoning the Well on NRDC’s website allows users to see both watershed and drinking water data closest to their homes in graphical form.1 This format is an example of what the EPA could do. 5. The public should use home water filtration sys-tems and demand transparency of information from their water utilities. NRDC recommends that consumers concerned about atrazine contamination in their water use a simple and economical household water filter, such as one that fits on the tap. Consumers should make sure that the filter they choose is certified by NSF International to meet American National Standards Institute (ANSI) Standard 53 for atrazine. A list of NSF/ANSI53-certified drinking water filters is available at www.nsf.org/certified/dwtu.
Still Poisoning the Well: Atrazine Continues to Contaminate Surface Water and Drinking Water in the United States
1
Atrazine Harms the Hormone SystemAt least four scientific studies published in late 2009 offer significant new laboratory evidence that atrazine interferes with normal hormone function, including reduced sperm production, reduced steroid production, and insulin resistance. One study reported an increase in male steroid hormones associated with a single-dose of atrazine in male rats.1 In another study, male rats that ate atrazine-laced feed had significantly less sperm than rats not fed atrazine, even after only one or two weeks of eating the contaminated feed.2 Importantly, the damaging effect on sperm production was dose-dependent; the more atrazine the rats ate, the lower their sperm count. While a dose-response relationship does not prove the existence of a causal relationship, its presence increases the scientific confidence that the outcome (in this case, hormone effects) is caused by the treatment (atrazine).
CHAPtER 1
A Fresh Look at the Harmful Effects of Atrazine
In our original 2009 report, Poisoning the Well: How the EPA is Ignoring Atrazine
Contamination in Surface and Drinking Water in the Central United States,
NRDC described the well-documented problems caused by exposure to atrazine,
including hormone-disruption and immune system impairment in animals, and
potentially in humans. Additional studies have since been published that further
strengthen our conclusion that atrazine is harmful to wildlife and should not be in our
waterways or drinking water. In this update, NRDC reviews new scientific studies that
provide further evidence of the harmful effects of atrazine exposure to people
and wildlife.
A third study documented a dose-dependent decrease in male hormone levels in the testicles of rats that ate atrazine-contaminated feed.3 A fourth study reported effects of atrazine on a different hormone system leading to insulin-resistance and obesity after lab rats drank atrazine-laced water daily for five months.4
Adding to these findings, in early 2010, well-known frog expert Dr. Tyrone Hayes published a startling study. He reported that 10 percent of male frogs that were born and raised in water contaminated with only 2.5 ppb atrazine (less than the federal allowable standard for drinking water of 3 ppb) grew up with female sex characteristics, including reduced levels of male testosterone, reduced sperm levels, and eggs in their testes.5 Even more disturbing, these atrazine-feminized males showed female mating behavior, attracted normal males, mated with them, and
Still Poisoning the Well: Atrazine Continues to Contaminate Surface Water and Drinking Water in the United States
2
produced viable larvae that grew into male frogs. Although scientists employed by Syngenta (the manufacturer of atrazine) have strongly criticized the study,6, 7 Hayes’ findings are in general agreement with other reports in the scientific literature and cannot be discounted.
A 2010 article published by University of South Florida researchers analyzed the findings of more than 125 independently published research studies of atrazine effects on freshwater fish and amphibians.8 Their meta-analysis found that many of the studies reported the same health outcomes, even though the studies were in several wildlife species and used different research methods.9 In particular, atrazine affected the hormone systems of freshwater fish and amphibian species in most studies, including effects such as altered time of metamorphosis (delayed in some studies and accelerated in other studies), impaired sperm production, and abnormal gonadal development. The consistent finding of endocrine disruption effects of atrazine across diverse species and in different independent studies strengthens the conclusions of each experiment and increases the scientific confidence that the findings are generally true.
Atrazine Harms the Immune SystemIn addition to the hormone effects identified in the meta-analysis mentioned above, the review paper by Rohr and McCoy also reported that atrazine caused impaired immune function and increased infection rates in aquatic wildlife living in atrazine-contaminated water.10
Furthermore, atrazine has been shown to act synergistically with other chemicals to increase their toxic effects by impairing the immune system. In a 2009 study, when tiger salamander larvae were raised for two weeks in water containing atrazine (20 or 200 ppb) or the pesticide chlorpyrifos (2, 20, or 200 ppb), no increase in deaths was observed.11 However, when the larvae were exposed to the combination of atrazine and chlorpyrifos together, there was a significant increase in larval deaths from increased viral infection and disease. This study suggests that the two chemicals acting together can harm immune function more than either one alone. This finding is significant both because it is common for several pesticides to be found in waterbodies together and because many pesticide
products, including atrazine, are packaged and sold as pesticide mixtures.
Atrazine May Increase Risk of Poor Birth OutcomesNew evidence links atrazine to poor birth outcomes in people. A 2009 study found a significant correlation between prenatal atrazine exposure and reduced body weight at birth.12 The authors reviewed the birth records of more than 24,000 babies born in Indiana and localized each birth to the particular community water system where the mother lived. Their analysis showed that the mothers with the highest concentrations of atrazine in their tap water (above 0.7 ppb) for the duration of the pregnancy had a higher risk of having a baby with a low birth weight than those mothers with lower exposures (below 0.3 ppb). Low birth weight is associated with increased risk of infant illness and some diseases, such as cardiovascular disease and diabetes.13
Another 2009 study analyzed more than 30 million births across the United States and reported an increased risk of birth defects associated with mothers who became pregnant between April and July, when pesticides in waterways are at their highest levels.14 The authors reported that among the pesticides monitored in the waterways, the risk was most closely associated with atrazine contamination. While this study did not measure drinking water levels specifically, the fact that the risk is highest when conception is timed with peak pesticide contamination in rivers and streams raises red flags. In 2007, a study found a significant association between atrazine water contamination levels and birth defects in the gut wall of newborn babies in Indiana.15 In fact, this study found that the rate of this particular birth defect is higher in Indiana than the rate across the country. Although there are many water contaminants other than pesticides, such as pharmaceutical waste, that are likely to cause reproductive harm in Indiana and elsewhere, these other contaminants would not necessarily be expected to show the seasonal peaks that are found with agricultural use of pesticides.
These studies suggest that, in people, atrazine exposure during pregnancy may contribute to a higher risk of adverse birth outcomes when considered along with genetic factors and other environmental contaminants.
Still Poisoning the Well: Atrazine Continues to Contaminate Surface Water and Drinking Water in the United States
3
Farmers and Workers May Be Exposed to Unsafe Levels A recent study of Iowa farmers reported finding atrazine metabolites in the urine of farmers who had recently applied atrazine, proving that they had been dosed with the pesticide.16 Previous scientific studies have linked atrazine urine levels in farm workers and rural men to reproductive effects such as low sperm count and reduced sperm motility.17, 18, 19 Interestingly, the Iowa study reported that the amount of pesticide in the urine was related to the amount applied to the field. As such, significantly reducing the amount of atrazine applied (or phasing out its use altogether) would presumably provide an immediate positive effect for farmers by reducing the contamination of their bodies.
Still Poisoning the Well: Atrazine Continues to Contaminate Surface Water and Drinking Water in the United States
4
CHAPtER 2
Revisiting the Problem of Atrazine Contamination
In Poisoning the Well NRDC analyzed surface water data collected between 2004
and 2006 and drinking water data collected in 2003 and 2004 from watersheds
and water systems across the Midwestern and Southern United States pursuant
to a U.S. Environmental Protection Agency (EPA) mandate. Unfortunately, little has
changed in the way atrazine is regulated and overdue changes in how the government
monitors for atrazine contamination and attempts to protect public health have not
yet occurred.
NRDC’s Original Analysis Showed Contamination of Watersheds and Drinking WaterNRDC’s original report found that the surface waters of the Midwestern and Southern United States suffer from pervasive contamination with atrazine.1 In fact, all 40 watersheds tested showed detectable levels of atrazine, and 25 had average concentrations above 1 ppb, the concentration at which the primary production of aquatic non-vascular plants (such as algae) is reduced. We determined that the watersheds with the 10 highest peak concentrations of atrazine were in Indiana, Missouri, and Nebraska. We also noted that some watersheds had at least one sample of very high atrazine levels (ranging from 50 ppb to more than 200 ppb).
Our previous analysis of drinking water data also revealed high levels of atrazine contamination in the drinking water in some public water systems.2 More than 90 percent of the samples taken in 139 water
systems had measurable levels of atrazine in both 2003 and 2004. Fifty-four water systems had a one-time peak atrazine concentration above 3 ppb.
Poisoning the Well revealed that while water systems could claim to be in compliance with the 3 ppb annual average limit for atrazine in drinking water under the Safe Drinking Water Act when calculated using a running annual average, more frequent monitoring showed that some systems actually exceeded the federal standard. In fact, three of the systems analyzed had running annual averages that exceeded 3 ppb. The EPA only requires systems to take between one and four samples per year to determine whether they comply with the standard. As a result, high spikes of atrazine that last for a few weeks can easily be missed. Another problem with the EPA’s reliance on a running annual average is that it allows high spikes of atrazine in spring or summer to be offset by low or zero detections in the fall and winter. This update to last year’s report reconfirms the danger posed by the unabated and
Still Poisoning the Well: Atrazine Continues to Contaminate Surface Water and Drinking Water in the United States
5
widespread atrazine contamination of surface and drinking water in the United States and the EPA’s continued reliance on running annual averages that are based upon too few samples each year.
Action Undertaken by the EPA Remains InadequateIn its 2006 final re-registration decision for atrazine, the EPA acknowledged concerns about human exposure to atrazine. The EPA classified the chemical as a Restricted Use Pesticide because of its hazard to ground and surface water.3 As a result, atrazine can only be applied by a pesticide professional; however, there is an exception for lawn care, turf, and conifer trees, allowing homeowners to apply it themselves. According to the EPA’s own assessment, this exception may, nonetheless, lead to unsafe exposures that exceed its “level of concern” for homeowners who apply the products to their lawns.4 The EPA also expressed concern that children who play on atrazine-treated lawns are also at risk for potentially unsafe exposures.5
The EPA found that workers, including farmers, who mix, load, and apply pesticides, like atrazine, also risk unsafe exposures. It found that exposures can result from accidental spills and splashes onto the skin or clothing, or inhalation of fumes and small droplets when the chemical is being applied to the field. It noted that exposure can even occur when those applying the chemicals follow all the label requirements for using protective clothing and equipment.6
The EPA also acknowledged concerns about the adverse effects that atrazine can have on wildlife. After washing from the field into streams and rivers with rainfall, atrazine kills algae and other beneficial aquatic plants that provide food, shelter, and oxygen for aquatic animals. The EPA has found, for example, that the effects of atrazine on aquatic ecosystems “may be severe due to the loss of up to 60 to 95 percent of the vegetative cover, which provides habitat to conceal young fish and aquatic invertebrates from predators.”7 The EPA assessment goes on to note that “numerous studies have described the ability of atrazine to inhibit photosynthesis, change community structure,” and kill aquatic plants at concentrations between 20 and 500 ppm.8
The EPA’s conclusions likely underestimate the true extent of the problem. As part of ongoing consultations
under the federal Endangered Species Act, both the U.S. Fish and Wildlife Service and the National Marine Fisheries Service have concluded that atrazine concentrations below these levels are likely to have negative effects on aquatic plant communities, which have negative effects on threatened and endangered species.9
Moreover, the approved agricultural application rates for atrazine are likely to result in adverse effects to many endangered species. For example, the EPA determined that an application rate of 1.1 or 1.2 pounds of atrazine per acre on corn or sorghum fields is unsafe (that is, it exceeds the EPA’s acute toxicity level of concern) for some endangered aquatic invertebrates, endangered aquatic vascular plants, and endangered small herbivore mammals.10 Yet, the maximum legal application rate is four pounds of atrazine per acre for sugarcane, and two pounds per acre for corn and sorghum. Even if typical use rates for these crops were half of the maximum legal rate, they would still lead to unsafe exposures for many plants and aquatic animals.
Still Poisoning the Well: Atrazine Continues to Contaminate Surface Water and Drinking Water in the United States
6
For this update, we analyzed the Ecological Watershed Monitoring Program data collected by Syngenta between 2007 and 2008 from 20 watersheds in Illinois, Indiana, Missouri, Nebraska and Ohio. Data was collected from early spring through the summer or fall.2 Watersheds were chosen for monitoring in these two years based on earlier monitoring results obtained from 2004 to 2006 that showed elevated levels of atrazine approaching or exceeding the EPA’s level of concern.3 Some additional watersheds were chosen within or near those watersheds with high atrazine levels.
We also analyzed the Atrazine Monitoring Program drinking water data collected from 2005 to 2008.4 During this period, Syngenta collected more than 35,000 water samples taken from 153 public water systems in 12 states. The water systems are located in California (2), Florida (4), Illinois (30), Indiana (13),
CHAPtER 3
Atrazine Contamination Continues to be a Widespread Problem
Poisoning the Well was based on our analysis of data collected by the atrazine
manufacturer Syngenta in selected watersheds under the Ecological Watershed
Monitoring Program and from drinking water systems under the Atrazine
Monitoring Program. The EPA had required Syngenta to collect these data rather than
issue a rulemaking to reduce the use of atrazine. Findings in our 2009 report were
based on watershed data collected between 2004 and 2006 and drinking water data
collected between 2003 and 2004.1
Iowa (9), Kansas (31), Kentucky (4), Louisiana (4), Missouri (20), North Carolina (3), Ohio (22) and Texas (11). Testing was concentrated in the Midwest, where atrazine use is most common. Both raw water (untreated) and finished water (water ready for human consumption) were tested.5
Our updated analysis shows continuing pervasive contamination—at levels of concern—of both watersheds and drinking water that remains consistent with our original findings.
Watersheds Are Still Pervasively Contaminated with AtrazineMany of the watersheds monitored showed high atrazine spikes well in excess of levels that are harmful to plants and wildlife. High atrazine concentration spikes were found to be widespread: 18 watersheds
Still Poisoning the Well: Atrazine Continues to Contaminate Surface Water and Drinking Water in the United States
7
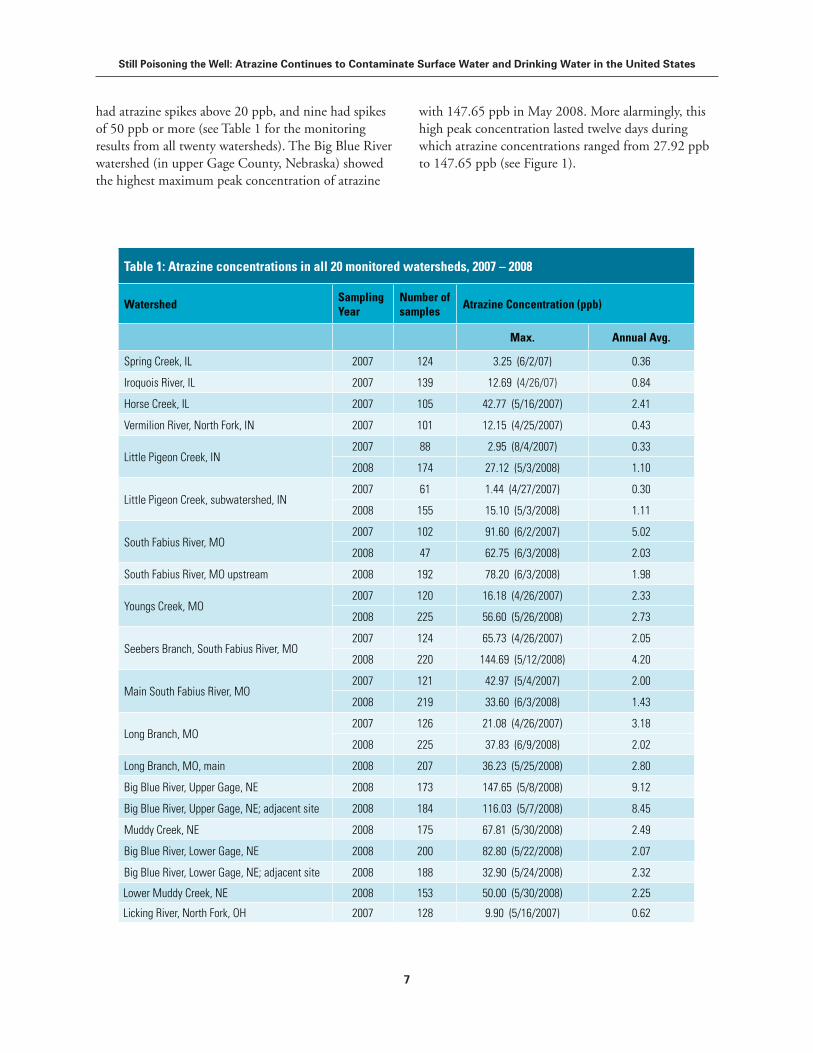
had atrazine spikes above 20 ppb, and nine had spikes of 50 ppb or more (see Table 1 for the monitoring results from all twenty watersheds). The Big Blue River watershed (in upper Gage County, Nebraska) showed the highest maximum peak concentration of atrazine
Table 1: Atrazine concentrations in all 20 monitored watersheds, 2007 – 2008
WatershedSamplingYear
Number of samples
Atrazine Concentration (ppb)
Max. Annual Avg.
Spring Creek, IL 2007 124 3.25 (6/2/07) 0.36
Iroquois River, IL 2007 139 12.69 (4/26/07) 0.84
Horse Creek, IL 2007 105 42.77 (5/16/2007) 2.41
Vermilion River, North Fork, IN 2007 101 12.15 (4/25/2007) 0.43
Little Pigeon Creek, IN2007 88 2.95 (8/4/2007) 0.33
2008 174 27.12 (5/3/2008) 1.10
Little Pigeon Creek, subwatershed, IN2007 61 1.44 (4/27/2007) 0.30
2008 155 15.10 (5/3/2008) 1.11
South Fabius River, MO2007 102 91.60 (6/2/2007) 5.02
2008 47 62.75 (6/3/2008) 2.03
South Fabius River, MO upstream 2008 192 78.20 (6/3/2008) 1.98
Youngs Creek, MO 2007 120 16.18 (4/26/2007) 2.33
2008 225 56.60 (5/26/2008) 2.73
Seebers Branch, South Fabius River, MO2007 124 65.73 (4/26/2007) 2.05
2008 220 144.69 (5/12/2008) 4.20
Main South Fabius River, MO 2007 121 42.97 (5/4/2007) 2.00
2008 219 33.60 (6/3/2008) 1.43
Long Branch, MO 2007 126 21.08 (4/26/2007) 3.18
2008 225 37.83 (6/9/2008) 2.02
Long Branch, MO, main 2008 207 36.23 (5/25/2008) 2.80
Big Blue River, Upper Gage, NE 2008 173 147.65 (5/8/2008) 9.12
Big Blue River, Upper Gage, NE; adjacent site 2008 184 116.03 (5/7/2008) 8.45
Muddy Creek, NE 2008 175 67.81 (5/30/2008) 2.49
Big Blue River, Lower Gage, NE 2008 200 82.80 (5/22/2008) 2.07
Big Blue River, Lower Gage, NE; adjacent site 2008 188 32.90 (5/24/2008) 2.32
Lower Muddy Creek, NE 2008 153 50.00 (5/30/2008) 2.25
Licking River, North Fork, OH 2007 128 9.90 (5/16/2007) 0.62
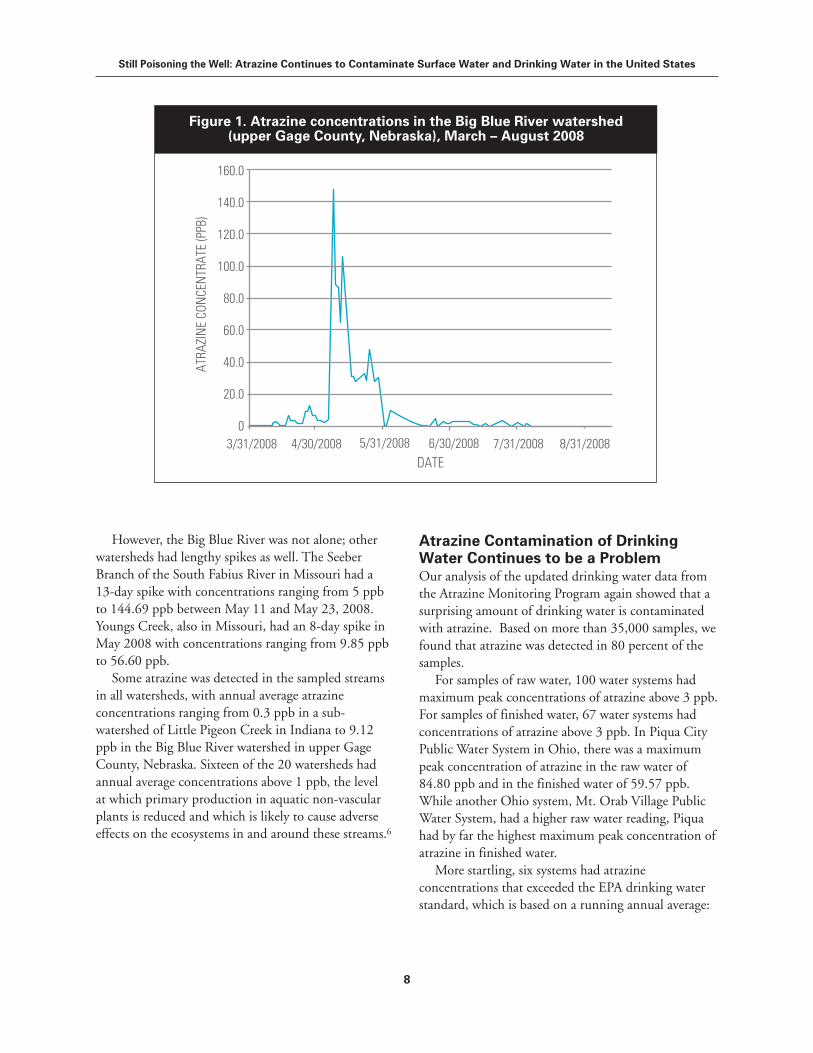
with 147.65 ppb in May 2008. More alarmingly, this high peak concentration lasted twelve days during which atrazine concentrations ranged from 27.92 ppb to 147.65 ppb (see Figure 1).
Still Poisoning the Well: Atrazine Continues to Contaminate Surface Water and Drinking Water in the United States
8
However, the Big Blue River was not alone; other watersheds had lengthy spikes as well. The Seeber Branch of the South Fabius River in Missouri had a 13-day spike with concentrations ranging from 5 ppb to 144.69 ppb between May 11 and May 23, 2008. Youngs Creek, also in Missouri, had an 8-day spike in May 2008 with concentrations ranging from 9.85 ppb to 56.60 ppb.
Some atrazine was detected in the sampled streams in all watersheds, with annual average atrazine concentrations ranging from 0.3 ppb in a sub-watershed of Little Pigeon Creek in Indiana to 9.12 ppb in the Big Blue River watershed in upper Gage County, Nebraska. Sixteen of the 20 watersheds had annual average concentrations above 1 ppb, the level at which primary production in aquatic non-vascular plants is reduced and which is likely to cause adverse effects on the ecosystems in and around these streams.6
Figure 1. Atrazine concentrations in the Big Blue River watershed (upper Gage County, Nebraska), March – August 2008
DATE
160.0
140.0
120.0
100.0
80.0
60.0
40.0
20.0
0
ATRA
ZIN
E CO
NCE
NTR
ATE
(PPB
)
3/31/2008 4/30/2008 5/31/2008 6/30/2008 7/31/2008 8/31/2008
Atrazine Contamination of Drinking Water Continues to be a ProblemOur analysis of the updated drinking water data from the Atrazine Monitoring Program again showed that a surprising amount of drinking water is contaminated with atrazine. Based on more than 35,000 samples, we found that atrazine was detected in 80 percent of the samples.
For samples of raw water, 100 water systems had maximum peak concentrations of atrazine above 3 ppb. For samples of finished water, 67 water systems had concentrations of atrazine above 3 ppb. In Piqua City Public Water System in Ohio, there was a maximum peak concentration of atrazine in the raw water of 84.80 ppb and in the finished water of 59.57 ppb. While another Ohio system, Mt. Orab Village Public Water System, had a higher raw water reading, Piqua had by far the highest maximum peak concentration of atrazine in finished water.
More startling, six systems had atrazine concentrations that exceeded the EPA drinking water standard, which is based on a running annual average:
Still Poisoning the Well: Atrazine Continues to Contaminate Surface Water and Drinking Water in the United States
9
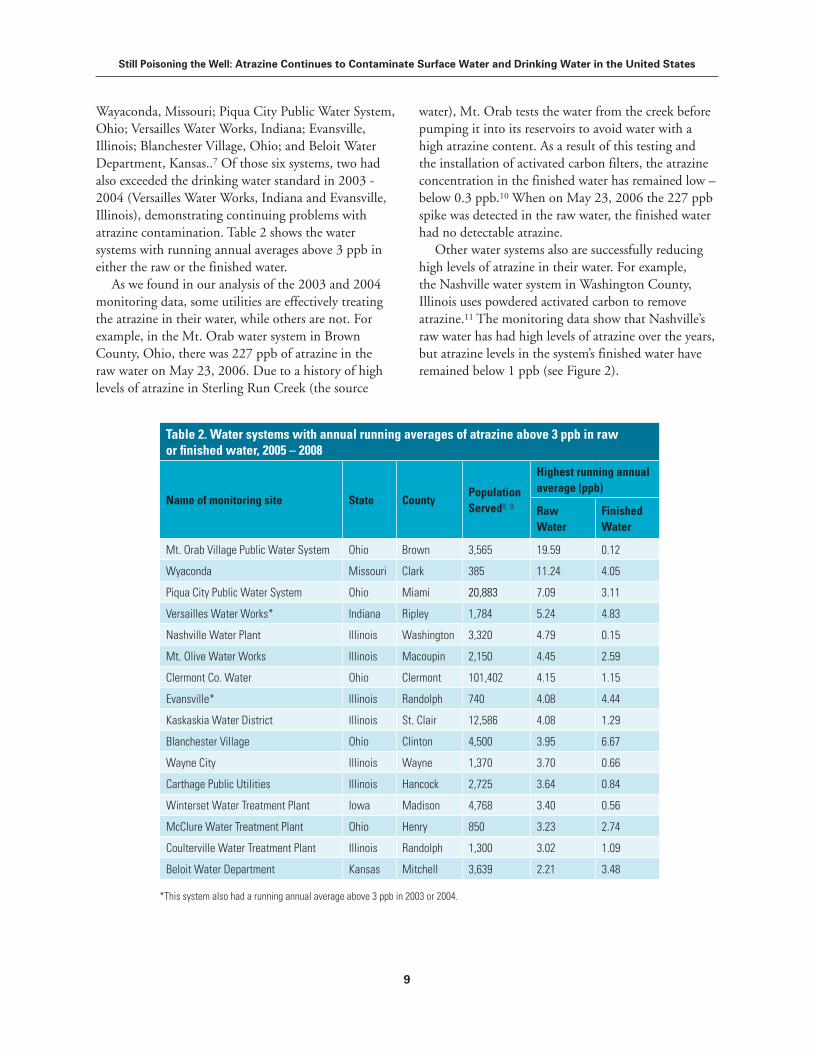
Wayaconda, Missouri; Piqua City Public Water System, Ohio; Versailles Water Works, Indiana; Evansville, Illinois; Blanchester Village, Ohio; and Beloit Water Department, Kansas..7 Of those six systems, two had also exceeded the drinking water standard in 2003 - 2004 (Versailles Water Works, Indiana and Evansville, Illinois), demonstrating continuing problems with atrazine contamination. Table 2 shows the water systems with running annual averages above 3 ppb in either the raw or the finished water.
As we found in our analysis of the 2003 and 2004 monitoring data, some utilities are effectively treating the atrazine in their water, while others are not. For example, in the Mt. Orab water system in Brown County, Ohio, there was 227 ppb of atrazine in the raw water on May 23, 2006. Due to a history of high levels of atrazine in Sterling Run Creek (the source
Table 2. Water systems with annual running averages of atrazine above 3 ppb in raw or finished water, 2005 – 2008
Name of monitoring site State CountyPopulation Served8, 9
Highest running annual average (ppb)
Raw Water
Finished Water
Mt. Orab Village Public Water System Ohio Brown 3,565 19.59 0.12
Wyaconda Missouri Clark 385 11.24 4.05
Piqua City Public Water System Ohio Miami 20,883 7.09 3.11
Versailles Water Works* Indiana Ripley 1,784 5.24 4.83
Nashville Water Plant Illinois Washington 3,320 4.79 0.15
Mt. Olive Water Works Illinois Macoupin 2,150 4.45 2.59
Clermont Co. Water Ohio Clermont 101,402 4.15 1.15
Evansville* Illinois Randolph 740 4.08 4.44
Kaskaskia Water District Illinois St. Clair 12,586 4.08 1.29
Blanchester Village Ohio Clinton 4,500 3.95 6.67
Wayne City Illinois Wayne 1,370 3.70 0.66
Carthage Public Utilities Illinois Hancock 2,725 3.64 0.84
Winterset Water Treatment Plant Iowa Madison 4,768 3.40 0.56
McClure Water Treatment Plant Ohio Henry 850 3.23 2.74
Coulterville Water Treatment Plant Illinois Randolph 1,300 3.02 1.09
Beloit Water Department Kansas Mitchell 3,639 2.21 3.48
*This system also had a running annual average above 3 ppb in 2003 or 2004.
water), Mt. Orab tests the water from the creek before pumping it into its reservoirs to avoid water with a high atrazine content. As a result of this testing and the installation of activated carbon filters, the atrazine concentration in the finished water has remained low – below 0.3 ppb.10 When on May 23, 2006 the 227 ppb spike was detected in the raw water, the finished water had no detectable atrazine.
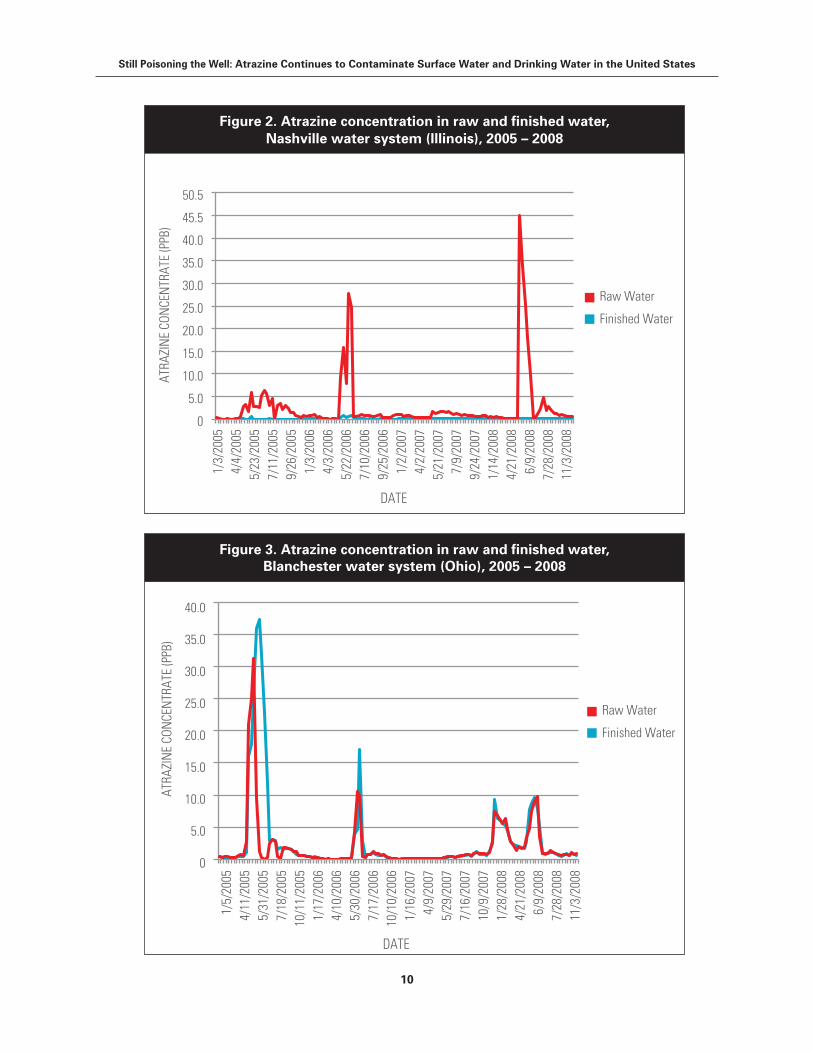
Other water systems also are successfully reducing high levels of atrazine in their water. For example, the Nashville water system in Washington County, Illinois uses powdered activated carbon to remove atrazine.11 The monitoring data show that Nashville’s raw water has had high levels of atrazine over the years, but atrazine levels in the system’s finished water have remained below 1 ppb (see Figure 2).
Still Poisoning the Well: Atrazine Continues to Contaminate Surface Water and Drinking Water in the United States
10
blanchester
40.0
35.0
30.0
25.0
20.0
15.0
10.0
5.0
0
ATRA
ZIN
E CO
NCE
NTR
ATE
(PPB
)
Raw Water
Finished Water
1/5/
2005
4/11
/200
55/
31/2
005
7/18
/200
510
/11/
2005
1/17
/200
64/
10/2
006
5/30
/200
67/
17/2
006
10/1
0/20
061/
16/2
007
4/9/
2007
5/29
/200
77/
16/2
007
10/9
/200
71/
28/2
008
4/21
/200
86/
9/20
087/
28/2
008
11/3
/200
8
DATE
Figure 2. Atrazine concentration in raw and finished water, Nashville water system (Illinois), 2005 – 2008
Figure 3. Atrazine concentration in raw and finished water, Blanchester water system (Ohio), 2005 – 2008
50.5
45.5
40.0
35.0
30.0
25.0
20.0
15.0
10.0
5.0
0
ATRA
ZIN
E CO
NCE
NTR
ATE
(PPB
)
Raw Water
Finished Water
1/3/
2005
4/4/
2005
5/23
/200
57/
11/2
005
9/26
/200
51/
3/20
064/
3/20
065/
22/2
006
7/10
/200
69/
25/2
006
1/2/
2007
4/2/
2007
5/21
/200
77/
9/20
079/
24/2
007
1/14
/200
84/
21/2
008
6/9/
2008
7/28
/200
811
/3/2
008
DATE
Still Poisoning the Well: Atrazine Continues to Contaminate Surface Water and Drinking Water in the United States
11
Unfortunately, not all systems have such effective treat-ments for atrazine. For example, the concentration of at-razine in the raw water and the finished water very closely mirrored one another in the water system in Blanchester, Ohio (see Figure 3). Four years of sampling data indi-cate that overall the system is not effectively treating for atrazine.
It is also interesting to note that some systems had running annual average concentrations in finished water that were higher than the concentrations in raw water (such as the Blanchester water system). This result may be due to the fact that samples of raw water are taken at different times than samples of finished water, so that high spikes in raw water are not detected, which further underscores that more frequent testing would catch high peak concentrations that may otherwise be missed.
To see the sampling results for all drinking water systems monitored between 2005 and 2008, see the Appendix.
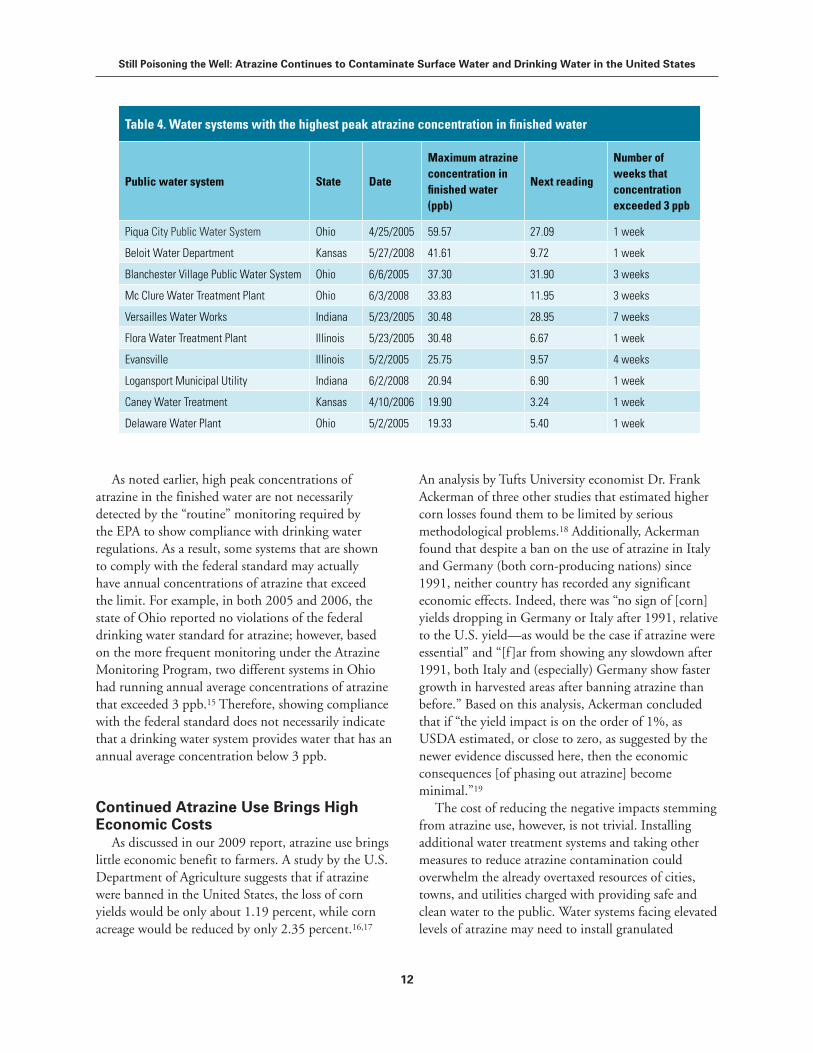
High Peak Concentrations of Atrazine Endanger Human HealthHigh, seasonal peak concentrations of atrazine are just as important—if not more so—than the annual average level. Exposure to high levels of hormone-disrupting chemicals such as atrazine during key windows of development are associated with permanent developmental and reproductive effects.12, 13, 14
Therefore, atrazine spikes in the finished water of public water systems—such as the spikes shown on Table 4—are a public health concern, especially to vulnerable populations, such as fetuses, infants, and children.
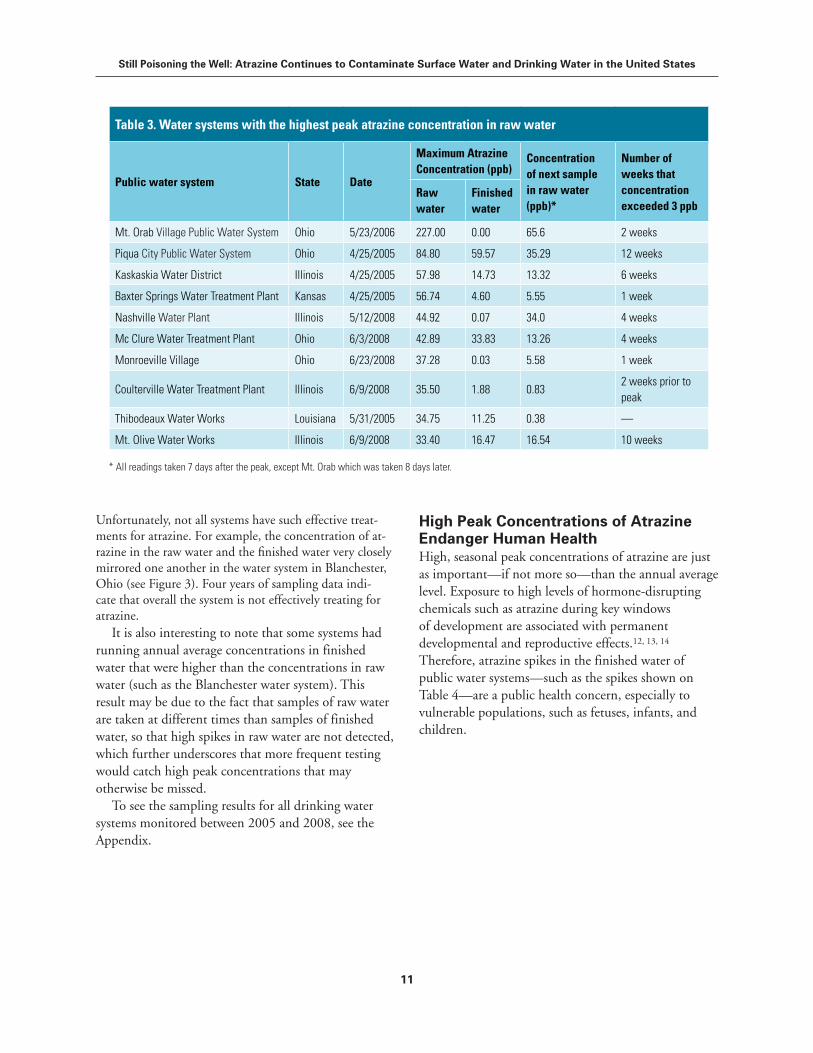
Table 3. Water systems with the highest peak atrazine concentration in raw water
Public water system State Date
Maximum Atrazine Concentration (ppb)
Concentration of next sample in raw water (ppb)*
Number of weeks that concentration exceeded 3 ppb
Raw water
Finished water
Mt. Orab Village Public Water System Ohio 5/23/2006 227.00 0.00 65.6 2 weeks
Piqua City Public Water System Ohio 4/25/2005 84.80 59.57 35.29 12 weeks
Kaskaskia Water District Illinois 4/25/2005 57.98 14.73 13.32 6 weeks
Baxter Springs Water Treatment Plant Kansas 4/25/2005 56.74 4.60 5.55 1 week
Nashville Water Plant Illinois 5/12/2008 44.92 0.07 34.0 4 weeks
Mc Clure Water Treatment Plant Ohio 6/3/2008 42.89 33.83 13.26 4 weeks
Monroeville Village Ohio 6/23/2008 37.28 0.03 5.58 1 week
Coulterville Water Treatment Plant Illinois 6/9/2008 35.50 1.88 0.832 weeks prior to peak
Thibodeaux Water Works Louisiana 5/31/2005 34.75 11.25 0.38 —
Mt. Olive Water Works Illinois 6/9/2008 33.40 16.47 16.54 10 weeks
* All readings taken 7 days after the peak, except Mt. Orab which was taken 8 days later.
Still Poisoning the Well: Atrazine Continues to Contaminate Surface Water and Drinking Water in the United States
12
As noted earlier, high peak concentrations of atrazine in the finished water are not necessarily detected by the “routine” monitoring required by the EPA to show compliance with drinking water regulations. As a result, some systems that are shown to comply with the federal standard may actually have annual concentrations of atrazine that exceed the limit. For example, in both 2005 and 2006, the state of Ohio reported no violations of the federal drinking water standard for atrazine; however, based on the more frequent monitoring under the Atrazine Monitoring Program, two different systems in Ohio had running annual average concentrations of atrazine that exceeded 3 ppb.15 Therefore, showing compliance with the federal standard does not necessarily indicate that a drinking water system provides water that has an annual average concentration below 3 ppb.
Continued Atrazine Use Brings High Economic Costs
As discussed in our 2009 report, atrazine use brings little economic benefit to farmers. A study by the U.S. Department of Agriculture suggests that if atrazine were banned in the United States, the loss of corn yields would be only about 1.19 percent, while corn acreage would be reduced by only 2.35 percent.16,17
Table 4. Water systems with the highest peak atrazine concentration in finished water
Public water system State Date
Maximum atrazine concentration in finished water (ppb)
Next reading
Number of weeks that concentration exceeded 3 ppb
Piqua City Public Water System Ohio 4/25/2005 59.57 27.09 1 week
Beloit Water Department Kansas 5/27/2008 41.61 9.72 1 week
Blanchester Village Public Water System Ohio 6/6/2005 37.30 31.90 3 weeks
Mc Clure Water Treatment Plant Ohio 6/3/2008 33.83 11.95 3 weeks
Versailles Water Works Indiana 5/23/2005 30.48 28.95 7 weeks
Flora Water Treatment Plant Illinois 5/23/2005 30.48 6.67 1 week
Evansville Illinois 5/2/2005 25.75 9.57 4 weeks
Logansport Municipal Utility Indiana 6/2/2008 20.94 6.90 1 week
Caney Water Treatment Kansas 4/10/2006 19.90 3.24 1 week
Delaware Water Plant Ohio 5/2/2005 19.33 5.40 1 week
An analysis by Tufts University economist Dr. Frank Ackerman of three other studies that estimated higher corn losses found them to be limited by serious methodological problems.18 Additionally, Ackerman found that despite a ban on the use of atrazine in Italy and Germany (both corn-producing nations) since 1991, neither country has recorded any significant economic effects. Indeed, there was “no sign of [corn] yields dropping in Germany or Italy after 1991, relative to the U.S. yield—as would be the case if atrazine were essential” and “[f ]ar from showing any slowdown after 1991, both Italy and (especially) Germany show faster growth in harvested areas after banning atrazine than before.” Based on this analysis, Ackerman concluded that if “the yield impact is on the order of 1%, as USDA estimated, or close to zero, as suggested by the newer evidence discussed here, then the economic consequences [of phasing out atrazine] become minimal.”19
The cost of reducing the negative impacts stemming from atrazine use, however, is not trivial. Installing additional water treatment systems and taking other measures to reduce atrazine contamination could overwhelm the already overtaxed resources of cities, towns, and utilities charged with providing safe and clean water to the public. Water systems facing elevated levels of atrazine may need to install granulated
Still Poisoning the Well: Atrazine Continues to Contaminate Surface Water and Drinking Water in the United States
13
activated carbon (GAC) filters to reduce levels of this pesticide, which can be a large expense. For example, the Mt. Orab water system in Ohio produces 372,000 gallons of drinking water per day for about 3,600 people. It has experienced the highest atrazine spikes in its source water among those systems analyzed in this report. To treat this water, Mt. Orab spends $50,000 per year just on carbon replacement for its GAC filters; that figure does not include the cost of purchasing the system or performing other needed maintenance.20 This level of expense may be expected for any system dealing with atrazine contamination. The small systems taking water from areas surrounded by agricultural lands on which atrazine is used may be most vulnerable to the contamination and be faced with paying these high costs.
Still Poisoning the Well: Atrazine Continues to Contaminate Surface Water and Drinking Water in the United States
14
Recommendation #1: the U.S. EPA Should Phase Out the Use of AtrazineAtrazine is not agriculturally necessary and does not produce economic benefits that justify its ecological and human health risks. In 2006, the EPA chose not to prohibit the use of atrazine, opting instead to require more monitoring. The results are in, and they show that atrazine contamination of drinking water sources is pervasive and occurs at concentrations that many affected water systems are unable to reduce to safe levels. In early 2010, the EPA began reexamining the data on atrazine. The EPA should take the next logical step to protect public health by removing atrazine from store shelves and curbing its release into our soil and waterways.
Recommendation #2: Farmers Should Be Encouraged to take Interim Steps to Reduce their Atrazine UseFarmers often choose to use atrazine and other pesticides not because they are more effective than
CHAPtER 4
Recommendations for Curbing Atrazine Contamination
The contamination of watersheds and drinking water with atrazine around
the United States continues to be a problem. Exceedingly high levels are still
being detected, levels which are likely having significant effects on wildlife
populations and potentially adverse health effects on humans. The few benefits of
using atrazine combined with the high cost of treating atrazine-contaminated water
further reinforces NRDC’s original recommendations.
other farming methods, but because they are familiar and cheap. Fortunately, there are concrete steps that many farmers are already taking to reduce their use of atrazine and other pesticides. Some farmers are reporting to us that they routinely use only half the amount of atrazine that the label allows, and it is just as effective. Encouraging farmers to follow these leaders and reduce atrazine application rates, especially by using targeted spraying or by applying atrazine in a narrow band in crop rows, is both effective and a money-saver.1 Other sustainable practices, such as applying atrazine after the corn has emerged, could reduce runoff by half.2
Using Integrated Pest Management (IPM) approaches for weed management relies on weed prevention, field monitoring, and the use of effective lower risk control methods. Farmers set an action threshold—the point at which the number of weeds reaches a level that indicates that control is necessary. Control methods are utilized only when the action threshold is exceeded. Controls could include mechanical and natural methods of weed control, and
Still Poisoning the Well: Atrazine Continues to Contaminate Surface Water and Drinking Water in the United States
15
low-risk pesticides. Conventional pesticides are used only as a last resort.3 IPM techniques may include:n Cover Crops: Winter cover crops are a prevention
strategy that can greatly reduce weed growth by competing with weeds for light, water, and nutrients, and protect soil from erosion. Legumes used as cover crops can also increase nitrogen in the soil.4
n Mechanical Weed Control Methods: Rotary hoes can be used after weed seeds have germinated, but before the weeds emerge, to significantly reduce weed growth; cultivators can remove emergent weeds before they become established. 5
n Delayed Fertilizer Application: Delaying application of half of the fertilizer used on corn crops until after the ears emerge can deprive weeds of nutrients during key periods of growth, while ensuring that these nutrients are available to the crop when it is best able to absorb them.6,7
n Intercrops: Alternating rows of different crops helps reduce weeds and results in higher crop yields.8
n Crop Rotation: Weed density and pesticide use can be reduced substantially by shifting from a two-year corn/soy rotation, typical of Midwestern agriculture, to a multispecies three- or four-year rotation that adds species such as alfalfa and oat.9, 10
Recommendation #3: the EPA Should Monitor All Vulnerable Watersheds and Require All Future Monitoring Plans to Identify Worst Case ScenariosAlthough the EPA identified 1,172 watersheds that are at highest risk from atrazine contamination, the monitoring data set included samples from only twenty watersheds. Any future monitoring plans should be designed to identify the worst case scenarios occurring in vulnerable watersheds and in public water systems. Monitoring programs should be designed to increase the chances of detecting contamination if it exists. This would include requiring samples to be taken within a certain time after big rainstorms and after fields have been treated with atrazine, which would increase the likelihood of determining the severity of the atrazine problem.
Recommendation #4: the EPA Should Publish timely Monitoring Results for Each Watershed and Public Water System Sampled Online in a User-Friendly FormatMonitoring results on the watersheds and the public water systems that were sampled under the two different monitoring programs were first made available to NRDC through Freedom of Information Act requests and through litigation by NRDC. However, the public has a right to know if there is an atrazine problem which they must treat, especially people who live downstream of atrazine-treated fields and who may have sensitive individuals—such as pregnant women and infants—in their households. A publicly available website with a searchable database posting sampling data as they are analyzed, or even regular reports about spikes of atrazine contamination, similar to the interactive map produced by NRDC,11 would make this information more accessible to the public than the EPA’s current method of posting large data files in an EPA docket. Furthermore, the data should be presented comprehensively, rather than just in summary form. For example, drinking water systems that have been monitored must be identified by name, along with the monitoring results.
Recommendation #5: the Public Should Use Home Water Filtration Systems and Demand transparency of Information from their Water UtilitiesNRDC recommends that consumers who are concerned about atrazine in their drinking water use a water filter certified by NSF International to meet NSF/American National Standards Institute (ANSI) Standard 53 for atrazine reduction. This standard includes some faucet-mounted charcoal filters. While filters that meet this certification do not always eliminate atrazine entirely, certified filters earning the NSF certification are able to reduce atrazine levels in drinking water from 9 ppb of atrazine to 3 ppb.12
Still Poisoning the Well: Atrazine Continues to Contaminate Surface Water and Drinking Water in the United States
16
Appendix: Still Poisoning the Well
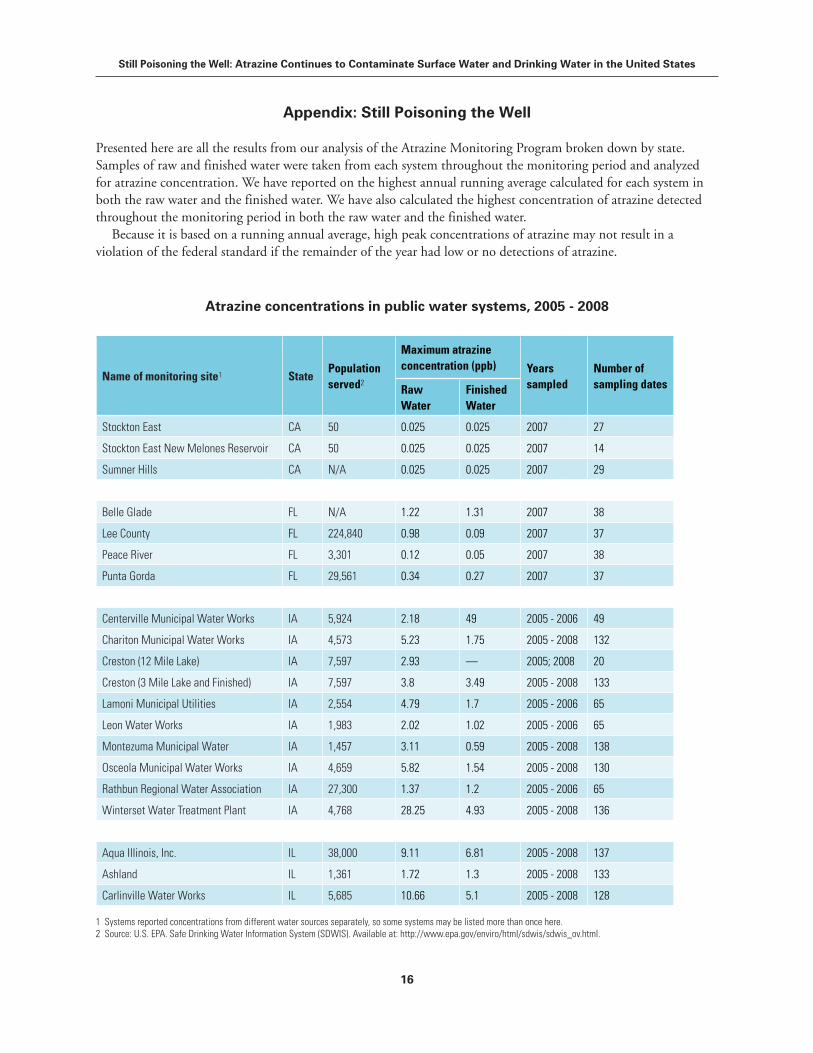
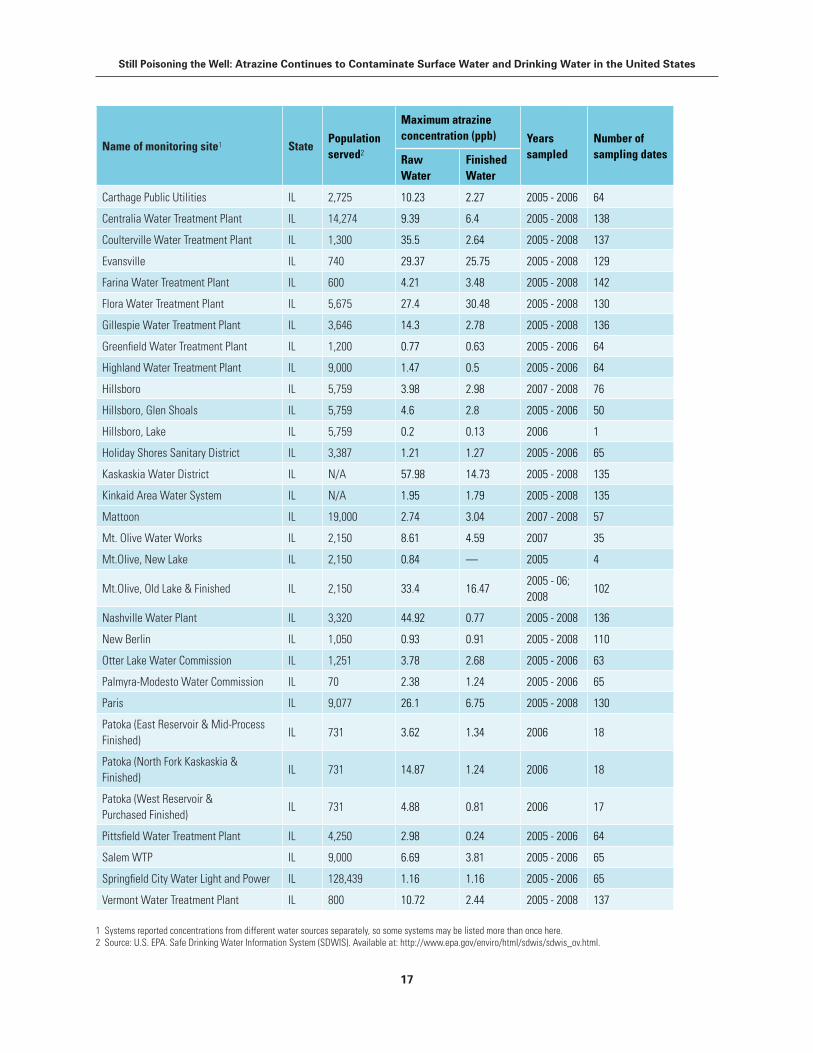
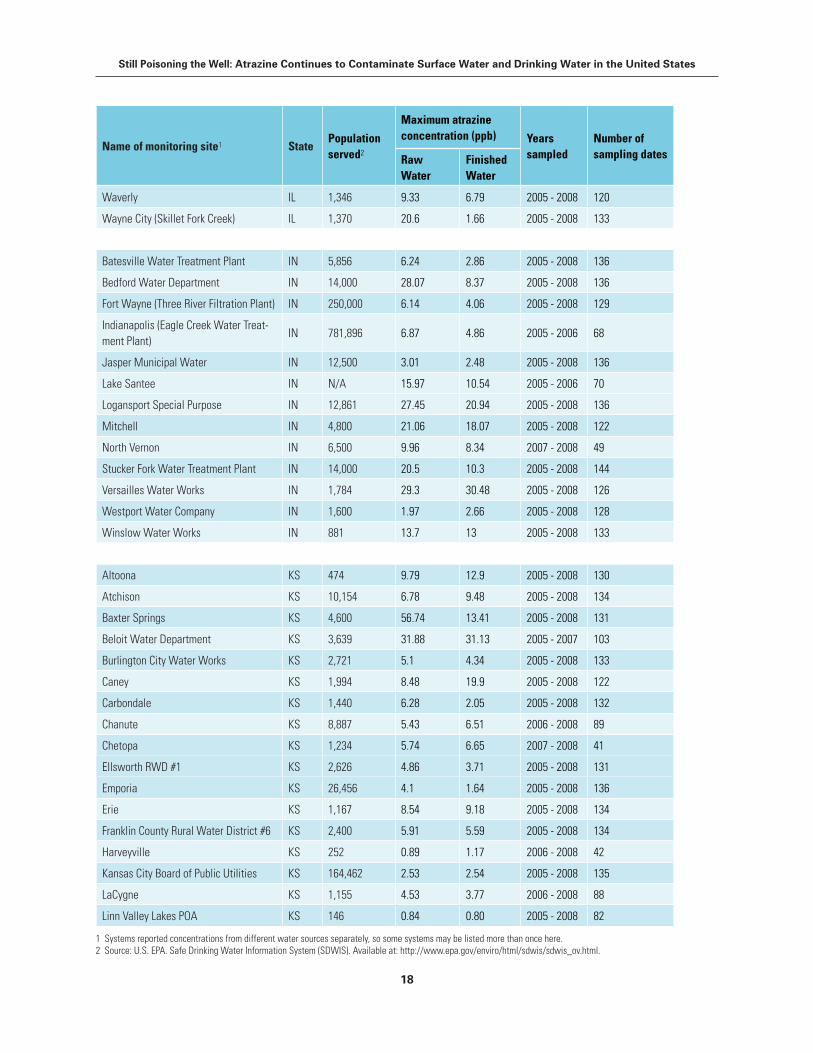
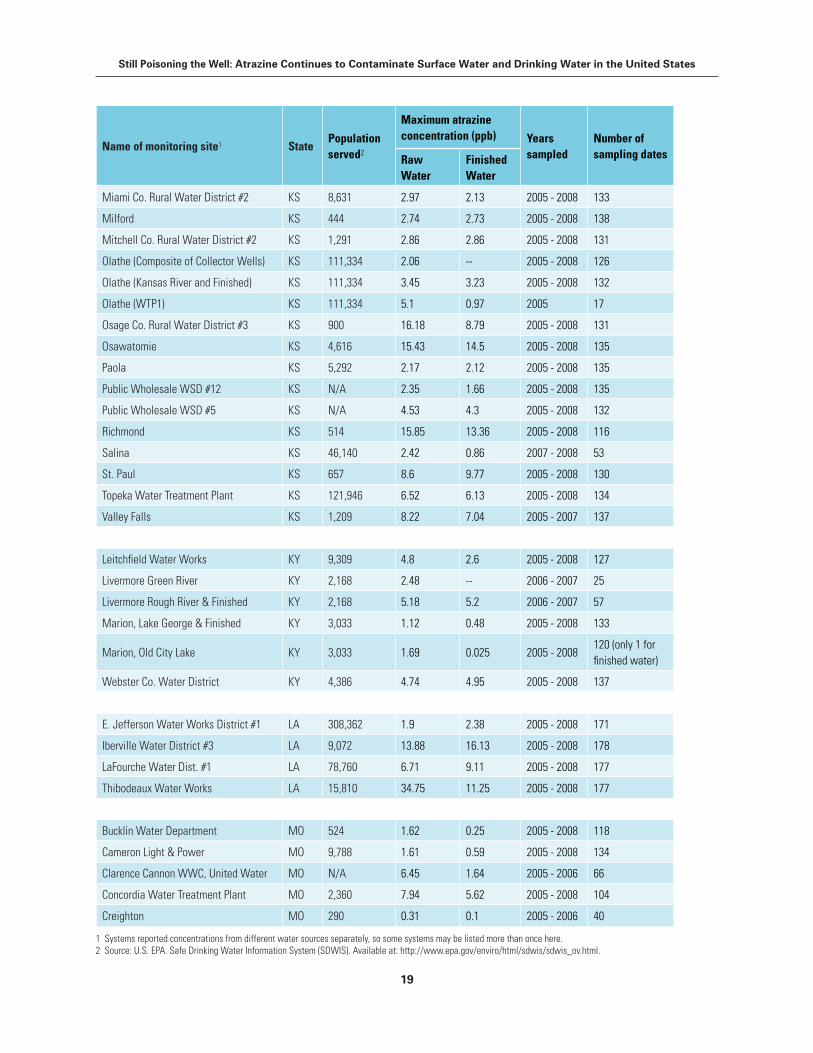
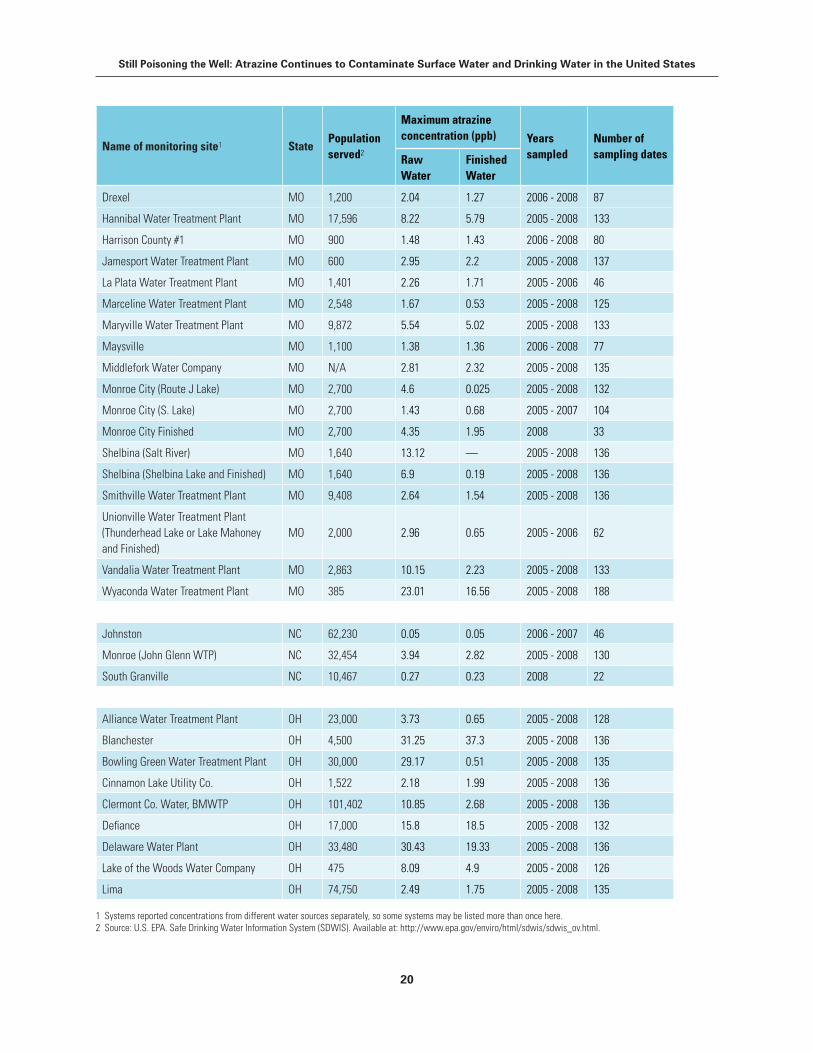
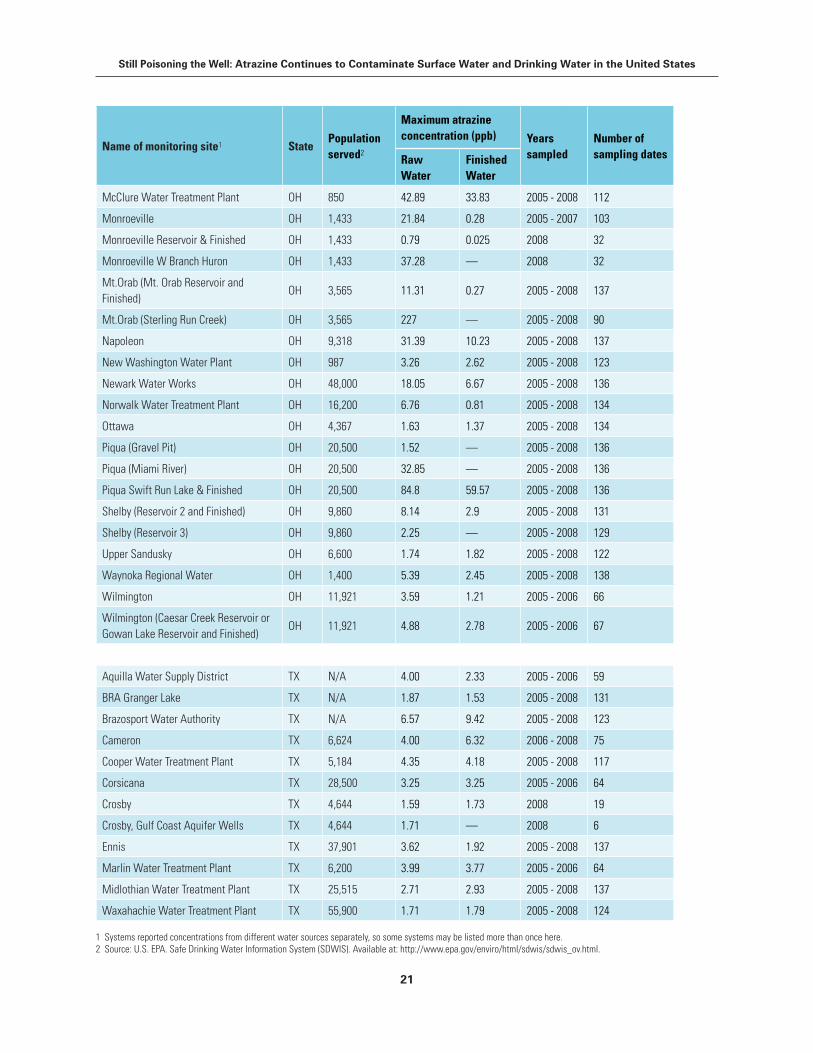
Presented here are all the results from our analysis of the Atrazine Monitoring Program broken down by state. Samples of raw and finished water were taken from each system throughout the monitoring period and analyzed for atrazine concentration. We have reported on the highest annual running average calculated for each system in both the raw water and the finished water. We have also calculated the highest concentration of atrazine detected throughout the monitoring period in both the raw water and the finished water.
Because it is based on a running annual average, high peak concentrations of atrazine may not result in a violation of the federal standard if the remainder of the year had low or no detections of atrazine.
Atrazine concentrations in public water systems, 2005 - 2008
Name of monitoring site1 StatePopulation served2
Maximum atrazine concentration (ppb) Years
sampledNumber of sampling datesRaw
WaterFinished Water
Stockton East CA 50 0.025 0.025 2007 27
Stockton East New Melones Reservoir CA 50 0.025 0.025 2007 14
Sumner Hills CA N/A 0.025 0.025 2007 29
Belle Glade FL N/A 1.22 1.31 2007 38
Lee County FL 224,840 0.98 0.09 2007 37
Peace River FL 3,301 0.12 0.05 2007 38
Punta Gorda FL 29,561 0.34 0.27 2007 37
Centerville Municipal Water Works IA 5,924 2.18 49 2005 - 2006 49
Chariton Municipal Water Works IA 4,573 5.23 1.75 2005 - 2008 132
Creston (12 Mile Lake) IA 7,597 2.93 — 2005; 2008 20
Creston (3 Mile Lake and Finished) IA 7,597 3.8 3.49 2005 - 2008 133
Lamoni Municipal Utilities IA 2,554 4.79 1.7 2005 - 2006 65
Leon Water Works IA 1,983 2.02 1.02 2005 - 2006 65
Montezuma Municipal Water IA 1,457 3.11 0.59 2005 - 2008 138
Osceola Municipal Water Works IA 4,659 5.82 1.54 2005 - 2008 130
Rathbun Regional Water Association IA 27,300 1.37 1.2 2005 - 2006 65
Winterset Water Treatment Plant IA 4,768 28.25 4.93 2005 - 2008 136
Aqua Illinois, Inc. IL 38,000 9.11 6.81 2005 - 2008 137
Ashland IL 1,361 1.72 1.3 2005 - 2008 133
Carlinville Water Works IL 5,685 10.66 5.1 2005 - 2008 128
1 Systems reported concentrations from different water sources separately, so some systems may be listed more than once here.2 Source: U.S. EPA. Safe Drinking Water Information System (SDWIS). Available at: http://www.epa.gov/enviro/html/sdwis/sdwis_ov.html.
Still Poisoning the Well: Atrazine Continues to Contaminate Surface Water and Drinking Water in the United States
17
Name of monitoring site1 StatePopulation served2
Maximum atrazine concentration (ppb) Years
sampledNumber of sampling datesRaw
WaterFinished Water
Carthage Public Utilities IL 2,725 10.23 2.27 2005 - 2006 64
Centralia Water Treatment Plant IL 14,274 9.39 6.4 2005 - 2008 138
Coulterville Water Treatment Plant IL 1,300 35.5 2.64 2005 - 2008 137
Evansville IL 740 29.37 25.75 2005 - 2008 129
Farina Water Treatment Plant IL 600 4.21 3.48 2005 - 2008 142
Flora Water Treatment Plant IL 5,675 27.4 30.48 2005 - 2008 130
Gillespie Water Treatment Plant IL 3,646 14.3 2.78 2005 - 2008 136
Greenfield Water Treatment Plant IL 1,200 0.77 0.63 2005 - 2006 64
Highland Water Treatment Plant IL 9,000 1.47 0.5 2005 - 2006 64
Hillsboro IL 5,759 3.98 2.98 2007 - 2008 76
Hillsboro, Glen Shoals IL 5,759 4.6 2.8 2005 - 2006 50
Hillsboro, Lake IL 5,759 0.2 0.13 2006 1
Holiday Shores Sanitary District IL 3,387 1.21 1.27 2005 - 2006 65
Kaskaskia Water District IL N/A 57.98 14.73 2005 - 2008 135
Kinkaid Area Water System IL N/A 1.95 1.79 2005 - 2008 135
Mattoon IL 19,000 2.74 3.04 2007 - 2008 57
Mt. Olive Water Works IL 2,150 8.61 4.59 2007 35
Mt.Olive, New Lake IL 2,150 0.84 — 2005 4
Mt.Olive, Old Lake & Finished IL 2,150 33.4 16.472005 - 06; 2008
102
Nashville Water Plant IL 3,320 44.92 0.77 2005 - 2008 136
New Berlin IL 1,050 0.93 0.91 2005 - 2008 110
Otter Lake Water Commission IL 1,251 3.78 2.68 2005 - 2006 63
Palmyra-Modesto Water Commission IL 70 2.38 1.24 2005 - 2006 65
Paris IL 9,077 26.1 6.75 2005 - 2008 130
Patoka (East Reservoir & Mid-Process Finished)
IL 731 3.62 1.34 2006 18
Patoka (North Fork Kaskaskia & Finished)
IL 731 14.87 1.24 2006 18
Patoka (West Reservoir & Purchased Finished)
IL 731 4.88 0.81 2006 17
Pittsfield Water Treatment Plant IL 4,250 2.98 0.24 2005 - 2006 64
Salem WTP IL 9,000 6.69 3.81 2005 - 2006 65
Springfield City Water Light and Power IL 128,439 1.16 1.16 2005 - 2006 65
Vermont Water Treatment Plant IL 800 10.72 2.44 2005 - 2008 137
1 Systems reported concentrations from different water sources separately, so some systems may be listed more than once here.2 Source: U.S. EPA. Safe Drinking Water Information System (SDWIS). Available at: http://www.epa.gov/enviro/html/sdwis/sdwis_ov.html.
Still Poisoning the Well: Atrazine Continues to Contaminate Surface Water and Drinking Water in the United States
18
Name of monitoring site1 StatePopulation served2
Maximum atrazine concentration (ppb) Years
sampledNumber of sampling datesRaw
WaterFinished Water
Waverly IL 1,346 9.33 6.79 2005 - 2008 120
Wayne City (Skillet Fork Creek) IL 1,370 20.6 1.66 2005 - 2008 133
Batesville Water Treatment Plant IN 5,856 6.24 2.86 2005 - 2008 136
Bedford Water Department IN 14,000 28.07 8.37 2005 - 2008 136
Fort Wayne (Three River Filtration Plant) IN 250,000 6.14 4.06 2005 - 2008 129
Indianapolis (Eagle Creek Water Treat-ment Plant)
IN 781,896 6.87 4.86 2005 - 2006 68
Jasper Municipal Water IN 12,500 3.01 2.48 2005 - 2008 136
Lake Santee IN N/A 15.97 10.54 2005 - 2006 70
Logansport Special Purpose IN 12,861 27.45 20.94 2005 - 2008 136
Mitchell IN 4,800 21.06 18.07 2005 - 2008 122
North Vernon IN 6,500 9.96 8.34 2007 - 2008 49
Stucker Fork Water Treatment Plant IN 14,000 20.5 10.3 2005 - 2008 144
Versailles Water Works IN 1,784 29.3 30.48 2005 - 2008 126
Westport Water Company IN 1,600 1.97 2.66 2005 - 2008 128
Winslow Water Works IN 881 13.7 13 2005 - 2008 133
Altoona KS 474 9.79 12.9 2005 - 2008 130
Atchison KS 10,154 6.78 9.48 2005 - 2008 134
Baxter Springs KS 4,600 56.74 13.41 2005 - 2008 131
Beloit Water Department KS 3,639 31.88 31.13 2005 - 2007 103
Burlington City Water Works KS 2,721 5.1 4.34 2005 - 2008 133
Caney KS 1,994 8.48 19.9 2005 - 2008 122
Carbondale KS 1,440 6.28 2.05 2005 - 2008 132
Chanute KS 8,887 5.43 6.51 2006 - 2008 89
Chetopa KS 1,234 5.74 6.65 2007 - 2008 41
Ellsworth RWD #1 KS 2,626 4.86 3.71 2005 - 2008 131
Emporia KS 26,456 4.1 1.64 2005 - 2008 136
Erie KS 1,167 8.54 9.18 2005 - 2008 134
Franklin County Rural Water District #6 KS 2,400 5.91 5.59 2005 - 2008 134
Harveyville KS 252 0.89 1.17 2006 - 2008 42
Kansas City Board of Public Utilities KS 164,462 2.53 2.54 2005 - 2008 135
LaCygne KS 1,155 4.53 3.77 2006 - 2008 88
Linn Valley Lakes POA KS 146 0.84 0.80 2005 - 2008 82
1 Systems reported concentrations from different water sources separately, so some systems may be listed more than once here.2 Source: U.S. EPA. Safe Drinking Water Information System (SDWIS). Available at: http://www.epa.gov/enviro/html/sdwis/sdwis_ov.html.
Still Poisoning the Well: Atrazine Continues to Contaminate Surface Water and Drinking Water in the United States
19
Name of monitoring site1 StatePopulation served2
Maximum atrazine concentration (ppb) Years
sampledNumber of sampling datesRaw
WaterFinished Water
Miami Co. Rural Water District #2 KS 8,631 2.97 2.13 2005 - 2008 133
Milford KS 444 2.74 2.73 2005 - 2008 138
Mitchell Co. Rural Water District #2 KS 1,291 2.86 2.86 2005 - 2008 131
Olathe (Composite of Collector Wells) KS 111,334 2.06 -- 2005 - 2008 126
Olathe (Kansas River and Finished) KS 111,334 3.45 3.23 2005 - 2008 132
Olathe (WTP1) KS 111,334 5.1 0.97 2005 17
Osage Co. Rural Water District #3 KS 900 16.18 8.79 2005 - 2008 131
Osawatomie KS 4,616 15.43 14.5 2005 - 2008 135
Paola KS 5,292 2.17 2.12 2005 - 2008 135
Public Wholesale WSD #12 KS N/A 2.35 1.66 2005 - 2008 135
Public Wholesale WSD #5 KS N/A 4.53 4.3 2005 - 2008 132
Richmond KS 514 15.85 13.36 2005 - 2008 116
Salina KS 46,140 2.42 0.86 2007 - 2008 53
St. Paul KS 657 8.6 9.77 2005 - 2008 130
Topeka Water Treatment Plant KS 121,946 6.52 6.13 2005 - 2008 134
Valley Falls KS 1,209 8.22 7.04 2005 - 2007 137
Leitchfield Water Works KY 9,309 4.8 2.6 2005 - 2008 127
Livermore Green River KY 2,168 2.48 -- 2006 - 2007 25
Livermore Rough River & Finished KY 2,168 5.18 5.2 2006 - 2007 57
Marion, Lake George & Finished KY 3,033 1.12 0.48 2005 - 2008 133
Marion, Old City Lake KY 3,033 1.69 0.025 2005 - 2008120 (only 1 for finished water)
Webster Co. Water District KY 4,386 4.74 4.95 2005 - 2008 137
E. Jefferson Water Works District #1 LA 308,362 1.9 2.38 2005 - 2008 171
Iberville Water District #3 LA 9,072 13.88 16.13 2005 - 2008 178
LaFourche Water Dist. #1 LA 78,760 6.71 9.11 2005 - 2008 177
Thibodeaux Water Works LA 15,810 34.75 11.25 2005 - 2008 177
Bucklin Water Department MO 524 1.62 0.25 2005 - 2008 118
Cameron Light & Power MO 9,788 1.61 0.59 2005 - 2008 134
Clarence Cannon WWC, United Water MO N/A 6.45 1.64 2005 - 2006 66
Concordia Water Treatment Plant MO 2,360 7.94 5.62 2005 - 2008 104
Creighton MO 290 0.31 0.1 2005 - 2006 40
1 Systems reported concentrations from different water sources separately, so some systems may be listed more than once here.2 Source: U.S. EPA. Safe Drinking Water Information System (SDWIS). Available at: http://www.epa.gov/enviro/html/sdwis/sdwis_ov.html.
Still Poisoning the Well: Atrazine Continues to Contaminate Surface Water and Drinking Water in the United States
20
Name of monitoring site1 StatePopulation served2
Maximum atrazine concentration (ppb) Years
sampledNumber of sampling datesRaw
WaterFinished Water
Drexel MO 1,200 2.04 1.27 2006 - 2008 87
Hannibal Water Treatment Plant MO 17,596 8.22 5.79 2005 - 2008 133
Harrison County #1 MO 900 1.48 1.43 2006 - 2008 80
Jamesport Water Treatment Plant MO 600 2.95 2.2 2005 - 2008 137
La Plata Water Treatment Plant MO 1,401 2.26 1.71 2005 - 2006 46
Marceline Water Treatment Plant MO 2,548 1.67 0.53 2005 - 2008 125
Maryville Water Treatment Plant MO 9,872 5.54 5.02 2005 - 2008 133
Maysville MO 1,100 1.38 1.36 2006 - 2008 77
Middlefork Water Company MO N/A 2.81 2.32 2005 - 2008 135
Monroe City (Route J Lake) MO 2,700 4.6 0.025 2005 - 2008 132
Monroe City (S. Lake) MO 2,700 1.43 0.68 2005 - 2007 104
Monroe City Finished MO 2,700 4.35 1.95 2008 33
Shelbina (Salt River) MO 1,640 13.12 — 2005 - 2008 136
Shelbina (Shelbina Lake and Finished) MO 1,640 6.9 0.19 2005 - 2008 136
Smithville Water Treatment Plant MO 9,408 2.64 1.54 2005 - 2008 136
Unionville Water Treatment Plant (Thunderhead Lake or Lake Mahoney and Finished)
MO 2,000 2.96 0.65 2005 - 2006 62
Vandalia Water Treatment Plant MO 2,863 10.15 2.23 2005 - 2008 133
Wyaconda Water Treatment Plant MO 385 23.01 16.56 2005 - 2008 188
Johnston NC 62,230 0.05 0.05 2006 - 2007 46
Monroe (John Glenn WTP) NC 32,454 3.94 2.82 2005 - 2008 130
South Granville NC 10,467 0.27 0.23 2008 22
Alliance Water Treatment Plant OH 23,000 3.73 0.65 2005 - 2008 128
Blanchester OH 4,500 31.25 37.3 2005 - 2008 136
Bowling Green Water Treatment Plant OH 30,000 29.17 0.51 2005 - 2008 135
Cinnamon Lake Utility Co. OH 1,522 2.18 1.99 2005 - 2008 136
Clermont Co. Water, BMWTP OH 101,402 10.85 2.68 2005 - 2008 136
Defiance OH 17,000 15.8 18.5 2005 - 2008 132
Delaware Water Plant OH 33,480 30.43 19.33 2005 - 2008 136
Lake of the Woods Water Company OH 475 8.09 4.9 2005 - 2008 126
Lima OH 74,750 2.49 1.75 2005 - 2008 135
1 Systems reported concentrations from different water sources separately, so some systems may be listed more than once here.2 Source: U.S. EPA. Safe Drinking Water Information System (SDWIS). Available at: http://www.epa.gov/enviro/html/sdwis/sdwis_ov.html.
Still Poisoning the Well: Atrazine Continues to Contaminate Surface Water and Drinking Water in the United States
21
Name of monitoring site1 StatePopulation served2
Maximum atrazine concentration (ppb) Years
sampledNumber of sampling datesRaw
WaterFinished Water
McClure Water Treatment Plant OH 850 42.89 33.83 2005 - 2008 112
Monroeville OH 1,433 21.84 0.28 2005 - 2007 103
Monroeville Reservoir & Finished OH 1,433 0.79 0.025 2008 32
Monroeville W Branch Huron OH 1,433 37.28 — 2008 32
Mt.Orab (Mt. Orab Reservoir and Finished)
OH 3,565 11.31 0.27 2005 - 2008 137
Mt.Orab (Sterling Run Creek) OH 3,565 227 — 2005 - 2008 90
Napoleon OH 9,318 31.39 10.23 2005 - 2008 137
New Washington Water Plant OH 987 3.26 2.62 2005 - 2008 123
Newark Water Works OH 48,000 18.05 6.67 2005 - 2008 136
Norwalk Water Treatment Plant OH 16,200 6.76 0.81 2005 - 2008 134
Ottawa OH 4,367 1.63 1.37 2005 - 2008 134
Piqua (Gravel Pit) OH 20,500 1.52 — 2005 - 2008 136
Piqua (Miami River) OH 20,500 32.85 — 2005 - 2008 136
Piqua Swift Run Lake & Finished OH 20,500 84.8 59.57 2005 - 2008 136
Shelby (Reservoir 2 and Finished) OH 9,860 8.14 2.9 2005 - 2008 131
Shelby (Reservoir 3) OH 9,860 2.25 — 2005 - 2008 129
Upper Sandusky OH 6,600 1.74 1.82 2005 - 2008 122
Waynoka Regional Water OH 1,400 5.39 2.45 2005 - 2008 138
Wilmington OH 11,921 3.59 1.21 2005 - 2006 66
Wilmington (Caesar Creek Reservoir or Gowan Lake Reservoir and Finished)
OH 11,921 4.88 2.78 2005 - 2006 67
Aquilla Water Supply District TX N/A 4.00 2.33 2005 - 2006 59
BRA Granger Lake TX N/A 1.87 1.53 2005 - 2008 131
Brazosport Water Authority TX N/A 6.57 9.42 2005 - 2008 123
Cameron TX 6,624 4.00 6.32 2006 - 2008 75
Cooper Water Treatment Plant TX 5,184 4.35 4.18 2005 - 2008 117
Corsicana TX 28,500 3.25 3.25 2005 - 2006 64
Crosby TX 4,644 1.59 1.73 2008 19
Crosby, Gulf Coast Aquifer Wells TX 4,644 1.71 — 2008 6
Ennis TX 37,901 3.62 1.92 2005 - 2008 137
Marlin Water Treatment Plant TX 6,200 3.99 3.77 2005 - 2006 64
Midlothian Water Treatment Plant TX 25,515 2.71 2.93 2005 - 2008 137
Waxahachie Water Treatment Plant TX 55,900 1.71 1.79 2005 - 2008 124
1 Systems reported concentrations from different water sources separately, so some systems may be listed more than once here.2 Source: U.S. EPA. Safe Drinking Water Information System (SDWIS). Available at: http://www.epa.gov/enviro/html/sdwis/sdwis_ov.html.
Still Poisoning the Well: Atrazine Continues to Contaminate Surface Water and Drinking Water in the United States
22
Endnotes
EXECUTIVE SUMMARY
1 http://www.nrdc.org/health/atrazine/
CHAPTER 1
2 Laws SC, Hotchkiss M, Ferrell J, Jayaraman S, Mills L, Modic W, Tinfo N, Fraites M, Stoker T, Cooper R. Chlorotriazine herbicides and metabolites activate an ACTH-dependent release of corticosterone in male Wistar rats. Toxicol Sci 2009 Nov;112(1):78-87.
3 Abarikwu SO, Adesiyan AC, Oyeloja TO, Oyeyemi MO, Farombi EO. Changes in Sperm Characteristics and Induction of Oxidative Stress in the Testis and Epididymis of Experimental Rats by a Herbicide, Atrazine. Arch Environ Contam Toxicol 2009 Aug 12.
4 Pogrmic K, Fa S, Dakic V, Kaisarevic S, Kovacevic R. Atrazine oral exposure of peripubertal male rats downregulates steroidogenesis gene expression in Leydig cells. Toxicol Sci 2009 Sep;111(1):189-97.
5 Lim S, Ahn SY, Song IC, Chung MH, Jang HC, Park KS, Lee KU, Pak YK, Lee HK. Chronic exposure to the herbicide, atrazine, causes mitochondrial dysfunction and insulin resistance. PLoS One 2009;4(4):e5186.
6 Hayes TB, Khoury V, Narayan A, Nazir M, Park A, Brown T, Adame L, Chan E, Buchholz D, Stueve T, Gallipeau S. Atrazine induces complete feminization and chemical castration in male African clawed frogs (Xenopus laevis). Proc Natl Acad Sci U S A 2010 Mar 9;107(10):4612-7.
7 USA Today. Tap water contaminant castrates frogs. Liz Szabo. March 1, 2010. http://www.usatoday.com/tech/science/2010-03-02-1Aatrazine02_ST_N.htm
8 CNN.com. Weed killer ‘castrates’ male frogs, study says. Azadeh Ansari. March 1, 2010. http://www.cnn.com/2010/TECH/science/03/01/pesticide.study.frogs/index.html
9 Rohr JR, McCoy KA. A qualitative meta-analysis reveals consistent effects of atrazine on freshwater fish and amphibians. Environ Health Perspect 2010 Jan;118(1):20-32.
10 Ibid.
11 Ibid.
12 Kerby JL, Storfer A. Combined effects of atrazine and chlorpyrifos on susceptibility of the tiger salamander to Ambystoma tigrinum virus. Ecohealth 2009 Mar;6(1):91-8.
13 Ochoa-Acuña H, Frankenberger J, Hahn L, Carbajo C. Drinking-water herbicide exposure in Indiana and prevalence of small-for-gestational-age and preterm delivery. Environ Health Perspect 2009 Oct;117(10):1619-24.
14 de Bie HM, Oostrom KJ, Delemarre-van de Waal HA. Brain development, intelligence and cognitive outcome in children born small for gestational age. Horm Res Paediatr 2010;73(1):6-14.
15 Winchester PD, Huskins J, Ying J. Agrichemicals in surface water and birth defects in the United States. Acta Paediatr 2009 Apr;98(4):664-9.
16 Mattix KD, Winchester PD, Scherer LR. Incidence of abdominal wall defects is related to surface water atrazine and nitrate levels. J Pediatr Surg 2007 Jun;42(6):947-9.
17 Bakke B, De Roos AJ, Barr DB, Stewart PA, Blair A, Freeman LB, Lynch CF, Allen RH, Alavanja MC, Vermeulen R. Exposure to atrazine and selected non-persistent pesticides among corn farmers during a growing season. J Expo Sci Environ Epidemiol 2009 Sep;19(6):544-54.
18 Swan SH, et al. 2003. Semen quality in relation to biomarkers of pesticide exposure. Environ Health Perspect 111:1478–84.
19 Swan SH. 2006. Semen quality in fertile US men in relation to geographical area and pesticide exposure. Int J Androl 29:62–8.
20 Curwin BD, et al. 2005. Urinary and hand wipe pesticide levels among farmers and nonfarmers in Iowa. 2005. J Expo Anal Environ Epidemiol (Nov) 15(6): 500–8.
CHAPTER 2
1 NRDC report. Atrazine: Poisoning the Well. How the EPA is ignoring atrazine contamination in the Central United States. August, 2009. http://www.nrdc.org/health/atrazine/default.asp
2 NRDC report. Atrazine: Poisoning the Well. How the EPA is ignoring atrazine contamination in the Central United States. August, 2009. http://www.nrdc.org/health/atrazine/default.asp
3 U.S. Environmental Protection Agency. 2006. Atrazine: Finalization of Interim Reregistration Eligibility Decision and Completion of Tolerance Reassessment and Reregistration Eligibility Process (April); p. 9. Available at http://www.epa.gov/oppsrrd1/REDs/atrazine_combined_docs.pdf. (Hereinafter referred to as “Atrazine RED”)
Still Poisoning the Well: Atrazine Continues to Contaminate Surface Water and Drinking Water in the United States
23
4 Atrazine RED, p. 2.
5 Ibid.
6 Atrazine RED, pgs. 3, 39.
7 Atrazine RED, p. 65.
8 Ibid.
9 Letter from Marjorie A. Nelson, U.S. Fish and Wildlife Service, to Arthur-Jean B. Williams, U.S. EPA, RE: Informal Consultation on the Effects of Atrazine Re-registration on the Endangered Alabama Sturgeon and Endangered Dwarf Wedgemussel. Dated February 11, 2008. FWS/AES/DCHRS/032435, p. 10; Letter from James H. Lecky, National Marine Fisheries Service, to Arthur-Jean Williams, U.S. EPA, RE: Request for Endangered Species Act Section 7 Informal Consultation on the Environmental Protection Agency’s Re-Registration and Use of Atrazine in the Chesapeake Bay Watershed, September 1, 2006. Dated May 29, 2007.
10 Atrazine RED, pgs. 58 and 63.
CHAPTER 3
1 Wu M, Quirindongo M, Sass J, and Wetzler A. Poisoning the Well: How the EPA is Ignoring Atrazine Contamination in Surface and Drinking Water in the Central United States. August 2009. Available at: http://www.nrdc.org/health/atrazine/files/atrazine.pdf.
2 Atrazine Midwestern Stream Monitoring Data. EPA Docket number EPA-HQ-OPP-2003-0367. June 29, 2009. Available at: http://www.regulations.com. Last accessed March 23, 2010.
3 EPA’s level of concern is based on a computer model and looks at effects on aquatic plants to determine cut-off points. As discussed in our 2009 report, this screening process is too permissive, and many more watersheds ought to have continued monitoring for atrazine contamination.
4 U.S. EPA. Atrazine Updates. Available at: http://www.epa.gov/oppsrrd1/reregistration/atrazine/atrazine_update.htm. Accessed March 15, 2010.
5 U.S. EPA. 2005 Atrazine Monitoring Program (AMP) Drinking Water Data. Available at http://www.epa.gov/oppsrrd1/reregistration/atrazine/atrazine_update.htm. Accessed March 15, 2010; U.S. EPA. 2006 Atrazine Monitoring Program (AMP) & Simazine Monitoring Program (SMP) Drinking Water Data. Available at http://www.epa.gov/oppsrrd1/reregistration/atrazine/atrazine_update.htm. Accessed March 15, 2010; U.S. EPA. 2007
Atrazine Monitoring Program (AMP), Simazine Monitoring Program (SMP) & Simazine Confirmatory Monitoring Program (SCMP) Drinking Water Data. Available at: http://www.epa.gov/oppsrrd1/reregistration/atrazine/atrazine_update.htm. Accessed March 15, 2010; U.S. EPA. 2008 Atrazine Monitoring Program (AMP) Drinking Water Data. Available at http://www.epa.gov/oppsrrd1/reregistration/atrazine/atrazine_update.htm. Accessed March 15, 2010.
6 Atrazine RED, p. 68.
7 The EPA drinking water standard is based on a running annual average, which is calculated by averaging the data from one date with all the data from the previous 365 days, then averaging the data from the next point and then previous 365 days, and so on. The standard is based on a one-time concentration of atrazine in the water if that system is only required to take one sample per year.
10 State of Ohio Environmental Protection Agency. Biological and Water Quality Study of the White Oak Creek Watershed, 2006; Highland and Brown Counties. December 12, 2008. EAS/2008-12-12. 118 pp. Available at: http://www.epa.state.oh.us/LinkClick.aspx?fileticket=uMOsu8L9YAU%3D&tabid=3816. Accessed March 15, 2010.
11 Illinois Environmental Protection Agency and U.S. Geological Survey. Source Water Assessment Program Fact Sheet. Nashville; Washington County. Available at: http://maps.epa.state.il.us/water/swap/FactSheets/il_swap/cws/washington/1890300.pdf. Last accessed March 23, 2010.
12 Colborn T. 2004. Neurodevelopment and endocrine disruption. Environ Health Perspect 112(9): 944–9. Review.
13 Crain DA, et al. 2008. Female reproductive disorders: the roles of endocrine-disrupting compounds and developmental timing. Fertility and Sterility 90(4): 911–40. Review.
14 Main KM, Skakkebaek NE, and Toppari J. 2009. Cryptorchidism as part of the testicular dysgenesis syndrome: the environmental connection. Endocrine Development. 14:167–73.
15 In 2005 the Blanchester Village Public Water System and in 2006 Piqua City Public Water System.
16 Ribaudo MO, and Bouzaher A. 1994. Atrazine: Environmental Characteristics and Economics of Management. United States Department of Agriculture (USDA) Agricultural Economic Report. Number 699. Washington, DC: USDA.

Still Poisoning the Well: Atrazine Continues to Contaminate Surface Water and Drinking Water in the United States
24
17 Ribaudo MO, and Hurley TM. 1997. Economic and environmental effects associated with reducing the use of atrazine: An example of cross-disciplinary research. J Agricultural and Applied Economics. 29:87–97.
18 Ackerman F. 2007. The economics of atrazine. International Journal of Occupational and Environmental Health. 13(4):437–45.
19 Ibid, p. 444.
20 State of Ohio Environmental Protection Agency. Biological and Water Quality Study of the White Oak Creek Watershed, 2006; Highland and Brown Counties. December 12, 2008. EAS/2008-12-12. 118 pp. Available at: http://www.epa.state.oh.us/LinkClick.aspx?fileticket=uMOsu8L9YAU%3D&tabid=3816. Accessed March 15, 2010.
CHAPTER 4
1 Land Stewardship Project. Land Stewardship Project Fact Sheet #18: Atrazine—Alternatives to a Controversial Herbicide. http://www.landstewardshipproject.org/pdf/factsheets/18_atrazine_alternatives_2009.pdf. Accessed May 4, 2009.
2 Ibid.
3 U.S. EPA. 2008. Integrated Pest Management (IPM) Principles. Factsheet. http://www.epa.gov/opp00001/factsheets/ipm.htm. Accessed August 15, 2008.
4 Liebman M and Davis AS. 2000. Integration of soil, crop and weed management in low-external-input farming systems. Weed Res 40:27–47.
5 Franti TG, et al. Agricultural Management Practices to Reduce Atrazine in Surface Water. 1996. Cooperative Extension, Institute of Agriculture and Natural Resources, University of Nebraska-Lincoln. http://www.p2pays.org/ref/09/08380.htm. Accessed August 14, 2008.
6 Liebman M and Davis AS. 2000. Integration of soil, crop and weed management in low-external-input farming systems. Weed Res 40:27–47.
7 Alkamper J, Pessios E, and Long DV. 1979. Einfluss der dungung auf die Entwicklung und Nahrstoffaufnahme verschiedener Unkrauter in Mais. Proceedings of the 3rd European Weed Research Society Symposium, Mainz, Germany, 181–92.
8 Liebman M and Davis AS. 2000. Integration of soil, crop and weed management in low-external-input farming systems. Weed Res 40:27–47.
9 Liebman M, et al. 2008. Argomic and economic performance characteristics of conventional and low-external-input cropping systems in the central corn belt. Agronomy J 100: 600–610.
10 Westerman P, et al. 2005. Are many little hammers effective? Velvetleaf (Abutilon theophrasti) population dynamics in two- and four-year crop rotation systems. Weed Science 53:382–392.
11 http://www.nrdc.org/health/atrazine
12 National Science Foundation (NSF). Contaminant Testing Protocols. http://www.nsf.org/consumer/drinking_water/dw_contaminant_protocols.asp?program=WaterTre

