noyce mathematics education teaching scholars:...
TRANSCRIPT

Evaluation of Noyce METS – May 23, 2013 i
Noyce Mathematics Education Teaching Scholars:
Evaluation Report 2012-2013
Prepared by
Jennifer Maxfield, M.A.
The William and Ida Friday Institute
for Educational Innovation
May 23, 2013
1890 Main Campus Drive Raleigh, NC 27606 919.513.8500 www.fi.ncsu.edu

Evaluation of Noyce METS – May 23, 2013 ii
Table of Contents EXECUTIVE SUMMARY ............................................................................................................ 4
I. INTRODUCTION ....................................................................................................................... 9
Program Description ................................................................................................................... 9
Evaluation Purpose ................................................................................................................... 10
Report Contents ........................................................................................................................ 10
II. DATA SOURCES AND METHODS ...................................................................................... 11
III. RESULTS ............................................................................................................................... 12
III-a. Preparation ....................................................................................................................... 12
III-b. Support............................................................................................................................. 17
III-c. Beliefs and Practices ........................................................................................................ 21
III-d. Teaching Experience ....................................................................................................... 28
III-e. Retention .......................................................................................................................... 34
IV. RECOMMENDATIONS ........................................................................................................ 40

Evaluation of Noyce METS – May 23, 2013 iii
List of Tables and Figures
Table 1: Cohorts, Scholars, and Program Timeline ........................................................................ 9
Table 2: Data Collection Methods ................................................................................................ 11
Table 3: How Well Prepared Scholars Feel to Do Instructional Activities .................................. 12
Table 4: How Well Qualified Scholars Feel to Teach Mathematics Topics ................................. 13
Figure 1: Percent of Scholars Who Felt They Were “Very Well Qualified” by Survey Year ..... 14
Table 5: Scholars’ Preparation for Teaching ................................................................................ 15
Table 7: Scholars’ Use of Noyce Benefit Funds ........................................................................... 17
Table 8: Scholars’ Perceptions of the Usefulness of Resources ................................................... 18
Table 9: Scholars’ Satisfaction with Support from Noyce METS ................................................ 19
Table 10: Scholars’ Beliefs about Teaching Practices .................................................................. 21
Table 11: Frequency of Instructional Activities ........................................................................... 22
Table 12: Frequency of Student Learning Activities .................................................................... 22
Table 13: Scholars’ Beliefs about Technology ............................................................................. 23
Table 14: Frequency of Technologies Used During Instruction ................................................... 25
Table 15: How Scholars Learned to Use Technological Products for Teaching .......................... 26
Table 16: Scholars’ Participation in Professional Activities ........................................................ 27
Table 17: Characteristics of Current Teaching Assignment ......................................................... 28
Table 17: Characteristics of Current Teaching Assignment, continued ....................................... 29
Table 18: Scholars’ Feelings of Being a Professional .................................................................. 29
Table 19: Scholars’ Perceptions of Collegiality ........................................................................... 31
Table 20: Scholars’ Satisfaction with Teaching Experience ........................................................ 33
Figure 2: Summary of Current Scholar Status .............................................................................. 35
Table 21: Summary of Current Scholar Status ............................................................................. 35

Evaluation of Noyce METS – May 23, 2013 4
EXECUTIVE SUMMARY
The Noyce Mathematics Education Teaching Scholars (METS) program at North Carolina State
University (NCSU) is designed to increase the number of highly qualified mathematics teachers
committed to working with students in high-needs schools. Eligible scholars include (a)
undergraduates pursuing a double degree in Mathematics Education and either Mathematics or
Statistics and (b) graduate students who hold a Bachelor’s degree in a mathematical science and
are pursuing a Master’s of Arts in Teaching for Mathematics or a Master’s degree in
Mathematics Education as well as licensure. The Noyce METS program provides scholarship
funds to support scholars’ tuition and living costs, as well as other benefit funds to support
professional development and technology purchases. In addition to the financial benefits, the
program also provides scholars a network of support staff, a community of fellow scholars, and
opportunities for professional development and classroom experience. In exchange for each year
of funding received, scholars commit to two years of teaching grades 9-12 in a high-need school
district.
Noyce METS contracted the Friday Institute for Educational Innovation at NCSU to conduct an
independent evaluation of the program. This report summarizes findings from the 2012-2013
evaluation, when the program was in its fifth year of the initial grant (METS I) and its planning
year of the second grant (METS II). The evaluation uses survey and interview data to address
evaluation questions about the program’s impact on the preparation, support, beliefs and
practices, teaching experience, and retention of Noyce Scholars. This evaluation fulfills the
funder’s (NSF’s) reporting requirements and provides useful information to the program staff to
help them improve the program and highlight their successes.
Methodology
The evaluation includes the 26 Noyce METS scholars from the first four cohorts that were
funded under the initial grant. At the time of our spring 2013 data collection, 19 of the scholars
were teaching or had taught earlier in the school year (including one who worked as a substitute
teacher), and the other seven had left the teaching profession, including three who had fulfilled
their teaching obligation. Of the four who left without fulfilling their obligation, two are
considering returning to teaching within the six years in which they have to fulfill their
obligation, whereas the other two do not plan to return and intend to re-pay the scholarship loan.
Data were collected through surveys and interviews with scholars. The Participant Survey
collected information from Noyce METS scholars (n=19) on their beliefs and practices, level of
preparation to teach, and perceptions of program support. The Demographic Follow-Up Survey
collected details from scholars who completed licensure requirements (n=21) about their current
or recent teaching placements. In addition, interviews were conducted with two scholars who had
decided to leave the profession after fulfilling their teaching obligation; they were interviewed
about the factors that led them to this decision.

Evaluation of Noyce METS – May 23, 2013 5
Results
Preparation
The majority of scholars reported feeling fairly or very well prepared to do a variety of
instructional activities. However, only a small percentage felt very well prepared to “manage
a class of students engaged in hands-on/project-based work” (21%) and to “teach groups that
are heterogeneous in ability” (16%).
The majority of scholars reported feeling very well qualified to teach each of the mathematics
topics (ranging from 53% for statistics to 89% for pre-algebra and algebra), with the
exception of calculus (42%) and topics from discrete mathematics (0%).
When asked how their involvement in Noyce METS has helped prepare them for teaching,
key themes included the following: having the opportunity to participate in professional
development; learning classroom strategies, techniques, and activities; gaining experience in
the classroom prior to teaching; being provided with a wealth of resources and tools; building
confidence in teaching; being exposed to educational technology; and receiving support and
insight from Noyce staff.
When asked how prepared they were for their current (or most recent) teaching experience,
just over half (53%) reported that they were fairly well prepared. An additional one-third
(33%) indicated they were very well prepared, and the remaining 13% said they were
somewhat prepared.
Scholars’ comments suggest that, for the most part, scholars felt well prepared; however, a
few had struggled with the amount of work and lack of time.
In order to prepare scholars for teaching, some scholars suggested spending more time in a
variety of classrooms and having some refreshers on math subjects.
Support
All of the scholars surveyed reported using at least one of the Noyce benefit funds
available to them. Specifically, 89% had used professional development funds, 68% had
used technology funds, and 42% had used flex funds for either technology or professional
development.
Most of the scholars indicated that the resource people associated with the Noyce program
(NCSU faculty and staff, Noyce Program Managers, community of scholars, and mentors)
had been somewhat or very useful to their development as a teacher. Scholars reported
benefiting from the advice, guidance, and support, as well as constructive feedback they
had received.
When asked how program resources could be made more useful, some scholars had unique
suggestions, including less work for school-based mentors, more observations of their
teaching, a class on re-learning content, and strategies for teaching lower-level students.
All but one of the scholars surveyed (or 94%) indicated they are very satisfied with the
support (financial and other) they have received from Noyce METS, and the other
respondent reported being somewhat satisfied.

Evaluation of Noyce METS – May 23, 2013 6
Beliefs and Practices
All of the scholars agreed or strongly agreed that both the content of the curriculum as well
as “sense-making” among students are important parts of instruction, and that it is
important to use various techniques and methods in teaching mathematics to students.
In terms of teaching practices, scholars reported doing the following instructional activities
on a frequent (often or all the time) basis: assigning mathematics homework (100%),
requiring students to explain their reasoning when giving an answer (93%), introducing
content through formal presentations (87%), and posing open-ended questions (80%). In
contrast, only 40% reported frequently doing each of the following: allowing students to
work at their own pace, asking students to consider alternative methods for solutions, and
asking students to use multiple representations.
Almost all the scholars (93%) reported that their students frequently take notes during
presentations given by the teacher. Most also indicated that their students frequently review
homework/worksheet assignments (80%) and answer textbook or worksheet questions
(80%).
When asked how their Noyce-related experience had informed their teaching, some
scholars mentioned incorporating educational technologies and lessons learned from
professional development sessions into their instruction, as well as attending more to
students’ conceptual understanding of mathematics.
Nearly all of the scholars surveyed (95%) agreed or strongly agreed that technology is an
essential tool in the teaching and learning of mathematics/statistics.
All scholars reported having the following technology tools available to them at school:
graphing calculators, laptops, information from the internet, communication tools (e.g.,
email, video conference), mathematics applets, Web 2.0 tools, and spreadsheets. In
addition, most scholars (87%) reported using graphing calculators frequently in their
instruction.
Scholars reported participating in a variety of professional activities (five on average), with
the most common ones being informal opportunities to share and discuss with others, as
well as attendance at professional conferences.
Teaching Experience
During the 2012-2013 academic year, a total of 18 scholars taught high school mathematics
full-time, and one additional scholar worked as a substitute teacher. Among those
surveyed, the most popular courses taught were Algebra 2 (53%) and Geometry (53%).
The majority of scholars reported teaching in a high-needs school district/system, defined
as one in which at least one school has: (a) a teacher attrition rate of 15% or more over the
last three school years (true for 53% of scholars with the other 47% unsure), and/or (b)
50% or more of the enrolled students eligible for free or reduced price lunch (true for 81%
of scholars with the other 19% unsure).

Evaluation of Noyce METS – May 23, 2013 7
Under half of the scholars (44%) had a Noyce Mentor Teacher who was also teaching
mathematics in their school.
Nearly all of the scholars (93%) agreed or strongly agreed that they feel like a professional
in their role as a teacher; however, a couple of scholars cited challenges with maintaining a
healthy work/life balance, being young, having to focus on testing, and experiencing a lack
of trust from administration as factors that have detracted from them feeling like a
professional.
Survey results suggest that most of the scholars teach in collegial environments with
teachers who regularly share ideas and materials and who work together on curriculum and
instruction; however, teachers do not regularly observe each other teaching.
Scholars commonly mentioned that the major success and reward of their teaching is
seeing their students grow and succeed. On the other hand, some of the major challenges
and frustrations include students’ apathy and lack of motivation or desire to learn,
problems with student behavior and classroom management, administrative duties that
detract from teaching, and not having enough time despite long work hours. Likewise,
some major surprises include the amount of extra duties outside of teaching, along with the
amount of time required, and how poor their students’ math skills were.
When asked how satisfied they were overall with their current teaching experience,
responses were split between two-thirds who reported being somewhat satisfied and one-
third who were very satisfied.
Retention
Of the 26 scholars funded through Noyce METS, 19 are currently teaching, representing a
73% rate of retaining scholars on the planned pipeline from recruitment to classroom.
As for the seven scholars who have fallen out of the planned pipeline, two are “early
exiters” who defaulted on their teaching obligation and intend to repay the scholarship.
Two are “temporary exiters” who, despite graduating and obtaining teaching licenses, have
yet to enter teaching, but still intend to fulfill their obligation within the six years allowed.
The other three are “experienced exiters” who decided to leave the teaching profession
after fulfilling their teaching obligations.
Both “early exiters” decided to default based on their early experiences in the classroom
volunteering and student teaching. They cited classroom management issues and lack of
administrative support as pivotal factors in their decisions to leave the teaching profession.
(Additional findings from the interviews with early exiters are provided in the 2011-2012
evaluation report.)
Two of the three “experienced exiters” discussed their decisions to leave the teaching
profession, describing frustrations with their school’s administration as the primary factor.
Neither of the “experienced exiters” believed there was anything that Noyce could have
done to help maintain their interest in the teaching profession.
In terms of how Noyce could help future applicants determine whether the teaching
profession would be a good fit for them, both of the exiters suggested increasing the

Evaluation of Noyce METS – May 23, 2013 8
opportunities for scholars to experience the classroom early on--even before applying, if
possible--and exposing them to a variety of different environments.
Recommendations
The following recommendations are drawn from evaluation findings:
Discuss the negative aspects of the teaching profession and help scholars develop strategies
and coping skills.
Provide even more opportunities for scholars to get classroom experience early on, especially
in a variety of environments.
Consider extending some supports beyond the scholars’ second year of teaching.
Consider whether Noyce METS could play a role in influencing broader changes at the
education policy and system levels in order to improve the nature of the teaching profession.

Evaluation of Noyce METS – May 23, 2013 9
I. INTRODUCTION
Program Description
The Noyce Mathematics Education Teaching Scholars (METS) program at North Carolina State
University (NCSU) is designed to increase the number of highly qualified mathematics teachers
committed to working with students in high-needs schools. Eligible scholars include (a)
undergraduates pursuing a double degree in Mathematics Education and either Mathematics or
Statistics and (b) graduate students who hold a Bachelor’s degree in a mathematical science and
are pursuing a Master’s of Arts in Teaching for Mathematics or a Master’s degree in
Mathematics Education as well as licensure. Noyce METS uses a formal application process and
selects scholars based on their academic background and desire to teach mathematics. The
program provides scholarship funds to support scholars’ tuition and living costs, as well as other
benefit funds to support professional development and technology purchases. In addition to the
financial benefits, the program also provides scholars a network of support staff, a community of
fellow scholars, and opportunities for professional development and classroom experience.
Noyce METS began funding scholars in 2008-09 and has since supported 26 scholars in four
cohorts (Table 1). The amount of financial support was increased from $20,000 for the first two
cohorts to $24,000 for Cohorts 3 and 4. Undergraduate scholars receive this scholarship over
their last two years of coursework ($6,000 for 4 semesters), while graduate scholars receive this
funding as a stipend for one year ($12,000 for two semesters). In exchange for each year of
funding received, scholars commit to two years of teaching grades 9-12 in a high-needs school
district. Hence, undergraduates are obligated to teach for four years, and graduates are obligated
to teach for two.
Table 1: Cohorts, Scholars, and Program Timeline
Cohort Status
Number of
scholars
Program Timeline Teaching
Obligation
Fulfilled in 2008-09 2009-10 2010-11 2011-12
1 Undergraduate 3 Coursework Coursework YR1 Teaching YR2 Teaching 2013-14
Graduate 2 Coursework YR1 Teaching YR2 Teaching -- 2010-11
2 Undergraduate 4 -- Coursework Coursework YR1 Teaching 2014-15
Graduate 5 -- Coursework YR1 Teaching YR2 Teaching 2011-12
3 Undergraduate 2 -- -- Coursework Coursework 2015-16
Graduate 4 -- -- Coursework YR1 Teaching 2012-13
4 Undergraduate 0 n/a n/a n/a n/a n/a
Graduate 6 -- -- -- Coursework 2013-14

Evaluation of Noyce METS – May 23, 2013 10
Evaluation Purpose
The evaluation uses survey and interview data to address five questions:
1. Preparation: How effective is Noyce METS at preparing its scholars for teaching careers?
2. Support: How well does Noyce METS support its scholars (a) during the program and (b) as
they fulfill their teaching obligation?
3. Beliefs and Practices: What are the teaching beliefs and practices of Noyce METS scholars?
4. Teaching Experience: What characterizes the experience of Noyce METS scholars during
their first couple of years as teachers?
5. Retention: To what extent do Noyce METS scholars remain in teaching careers?
Report Contents
This report summarizes findings from the 2012-2013 evaluation, when Noyce METS was in its
fifth year of the initial grant (METS I) and planning year of the second grant (METS II). The
report begins with a summary of the evaluation methods, including a description of the surveys
and interviews used. The results section then discusses evaluation findings related to the
preparation, support, beliefs and practices, teaching experience, and retention of scholars. The
final section provides some programmatic recommendations for consideration.

Evaluation of Noyce METS – May 23, 2013 11
II. DATA SOURCES AND METHODS
The evaluation includes the 26 Noyce METS scholars from the first four cohorts of the program.
At the time of our spring 2013 data collection, 19 of the scholars were teaching or had taught
earlier in the school year (including one who worked as a substitute teacher), and the other seven
had left the teaching profession, including three who had fulfilled their teaching obligation. Of
the four who left without fulfilling their obligation, two are considering returning to teaching
within the six years in which they have to fulfill their obligation, whereas the other two do not
plan to return and intend to re-pay the scholarship loan. Data were collected through surveys and
interviews with scholars. Details about each of the data collection methods – including the data
sources and response rates, evaluation questions addressed, information collected, and data
collection windows – are provided below in Table 2.
Table 2: Data Collection Methods
Method
Source and
Response Rate
Evaluation
Question(s)
Addressed Information Collected
Spring 2013
Data Collection
Window
Participant
Survey
All Noyce Scholars,
excluding scholars
who left the
teaching profession
after fulfilling their
obligation or
without plans to
return
Response rate:
19 of 22 (86%)
1. Preparation
2. Support
3. Beliefs and
Practices
4. Teaching
Experience
• Self-rating of preparedness to do instructional
activities
• Self-rating of qualifications to teach math topics
• Beliefs related to teaching and learning and
technology
• Participation in professional development
opportunities
• Characteristics of current or most recent teaching
experience
• Teaching practices
• Technology use
• Reflections about their teaching experience
• Helpful aspects of Noyce
• Aspects of Noyce that need improvement
February 5-24
Demographic
Follow-Up
Survey
Noyce Scholars who
have completed
licensure
requirements
Response rate:
21 of 24 (88%)
4. Teaching
Experience
5. Retention
• Scholar’s contact information
• Info about current teaching placement
• Info about Mentor Teacher
February 5-24
Exit Interview Former Noyce
Scholars who left
the profession after
fulfilling their
teaching obligation
Response rate:
2 of 3 (67%)
2. Support
5. Retention
• Factors that led to their decision to leave the
profession
• Suggestions for how to ensure the program is a
good fit and to maintain Scholars’ interest
March 4-8

Evaluation of Noyce METS – May 23, 2013 12
III. RESULTS
III-a. Preparation
The Participant Survey asked scholars to indicate how well prepared they felt to do specific
instructional activities (Table 3). The majority of scholars reported feeling fairly or very well
prepared to do each of the activities listed, although this percentage ranged from 63% to 95%
depending on the activity. The activities for which the largest percentage reported feeling very
well prepared included “using calculators/computers for drill and practice” (74%), “using
calculators/computers for simulations and applications” (61%), and “encouraging participation of
females in mathematics” (50%). On the other hand, only 21% felt very well prepared to “manage
a class of students engaged in hands-on/project-based work,” and only 16% felt very well
prepared to “teach groups that are heterogeneous in ability.” Moreover, a notable minority
(16%) reported feeling not adequately prepared to use the Internet in their mathematics teaching
for collaborative projects with classes/individuals in other schools.
Table 3: How Well Prepared Scholars Feel to Do Instructional Activities
Instructional activity
Percentage of Respondents (n=18-19)
Not
adequately
prepared
Somewhat
prepared
Fairly well
prepared
Very well
prepared
Use calculators/computers for drill and practice 0% 5% 21% 74%
Use calculators/computers for simulations and applications 6% 0% 33% 61%
Encourage participation of females in mathematics 0% 6% 44% 50%
Encourage participation of minorities in mathematics 0% 6% 50% 44%
Listen/ask questions as students work in order to gauge their
understanding 0% 5% 53% 42%
Develop students' conceptual understanding of mathematics 0% 11% 47% 42%
Use calculators/computers to collect and/or analyze data 5% 0% 53% 42%
Use calculators/computers to demonstrate mathematics principles 5% 5% 42% 47%
Use the textbook as a resource rather than the primary instructional tool 5% 11% 37% 47%
Encourage students' interests in mathematics 0% 11% 58% 32%
Take students' prior understanding into account when planning curriculum
and instruction 0% 16% 47% 37%
Lead a class of students using investigative strategies 0% 11% 58% 32%
Use calculators/computers for mathematics learning games 5% 5% 53% 37%
Recognize and respond to student cultural diversity 0% 16% 53% 32%
Make connections between mathematics and other disciplines 5% 16% 37% 42%
Have students work in cooperative learning groups 5% 21% 37% 37%
Manage a class of students engaged in hands-on/project-based work 5% 21% 53% 21%
Teach groups that are heterogeneous in ability 0% 37% 47% 16%
Use the Internet in your mathematics teaching for collaborative projects
with classes/individuals in other schools 16% 21% 37% 26%
Prompt: Please indicate how well prepared you currently feel to do each of the following instructional activities.

Evaluation of Noyce METS – May 23, 2013 13
In another survey question, scholars were provided with a list of mathematics topics and asked to
indicate how well qualified they felt to teach each of the topics at the grade level(s) they teach
regardless of whether the topics were part of their curriculum (Table 4). Most of the scholars
reported feeling very well qualified to teach pre-algebra (89%) and algebra (89%). In addition,
the majority of the scholars (53%-74%) reported feeling very well qualified to teach each of the
other topics, with the exception of calculus (42%) and topics from discrete mathematics (0%).
Table 4: How Well Qualified Scholars Feel to Teach Mathematics Topics
Percentage of Respondents (n=19)
Not well qualified
Adequately
qualified Very well qualified
Pre-algebra 0% 11% 89%
Algebra 0% 11% 89%
Computation 0% 26% 74%
Patterns and relationships 0% 37% 63%
Functions (including trigonometric
functions) and pre-calculus concepts 5% 32% 63%
Data collection and analysis 0% 42% 58%
Estimation 5% 37% 58%
Measurement 11% 26% 63%
Geometry and spatial sense 5% 37% 58%
Probability 16% 21% 63%
Statistics (e.g., hypothesis tests, curve
fitting, regression) 16% 32% 53%
Calculus 26% 32% 42%
Topics from discrete mathematics (e.g.,
combinatorics, graph theory, recursion) 63% 37% 0%
Prompt: How well qualified do you feel to teach each of the following topics at the grade level(s) you teach, whether
or not they are currently included in your curriculum?
Figure 1 presents survey results on scholars’ qualifications across years. Results shows that the
percentage of scholars who reported feeling very well qualified in the current survey year (2013)
was within range of the previous three years for most of the topics listed, but was notably higher
than in previous years (by ≥10 percentage points) for pre-algebra, probability, and statistics, and
was notably lower for topics from discrete mathematics. Note that these results are not directly
comparable because the sample of survey respondents changed somewhat from year to year.

Evaluation of Noyce METS – May 23, 2013 14
Figure 1: Percentage of Scholars Who Felt They Were “Very Well Qualified” to Teach Math
Topics, by Survey Year
In an open-ended survey question, the scholars were asked to describe how their involvement in
Noyce METS has helped prepare them for teaching. Key themes that emerged from scholars’
comments include having the opportunity to participate in professional development (e.g.,
conferences, seminars); learning classroom strategies, techniques, and activities; gaining
experience in the classroom prior to teaching; being provided with a wealth of resources and
42%
0%
53%
63%
58%
63%
58%
63%
89%
89%
63%
58%
74%
30%
13%
43%
48%
74%
48%
52%
57%
91%
78%
65%
65%
83%
53%
26%
37%
47%
53%
63%
68%
74%
84%
74%
68%
53%
79%
50%
14%
21%
29%
21%
21%
21%
57%
86%
64%
43%
50%
57%
Calculus
Topics from discrete mathematics
Statistics
Probability
Data collection and analysis
Functions and pre-calculus concepts
Geometry and spatial sense
Patterns and relationships
Algebra
Pre-algebra
Measurement
Estimation
Computation
2010 (n=14) 2011 (n=19) 2012 (n=23) 2013 (n=19)

Evaluation of Noyce METS – May 23, 2013 15
tools; building confidence in teaching; being exposed to educational technology; and receiving
support and insight from Noyce staff. Some of these themes are illustrated in the following
quote:
I had more experience in a high-needs school from the internship at Southeast and student
teaching than I would have [had] under the general Math Education placements. I also
had a supportive network of teachers and supervisors who could help with issues and
concerns I was having with my teaching. I also have been able to attend several
conferences to build on my knowledge of teaching practices.
In addition, scholars who taught full-time during the 2012-2013 academic year were asked how
prepared they were for their current (or most recent) teaching experience (Table 5). Just over half
(53%) reported that they were fairly well prepared. An additional one-third (33%) indicated they
were very well prepared, and the remaining 13% said they were somewhat prepared.
Table 5: Scholars’ Preparation for Teaching
Preparation Level Percentage of respondents (n=15)
Not adequately prepared 0%
Somewhat prepared 13%
Fairly well prepared 53%
Very well prepared 33%
Prompt: Overall, how prepared were you for your current (or most recent) teaching experience?
Scholars were asked to explain their response in a follow-up open-ended question. Comments
suggest that, for the most part, scholars felt well prepared; however, a few had struggled with the
amount of work and lack of time. In addition, several noted that they were as prepared as could
be, but that you can never be fully prepared for your first year of teaching. Some illustrative
quotes follow:
You can never be fully prepared for the amount of work and the lack of time. However,
considering the job, I think I had a lot of resources at my disposal.
Although you are not prepared for everything until you experience your own classroom,
Noyce has done a great job of preparing me for everyday teaching and classroom
management.
In another open-ended question, all the scholars (regardless of current teaching status) were
asked what additional supports would help (or would have helped) prepare them for teaching.
Several scholars did not have any ideas to share. Among those who had suggestions, the ideas
were rather varied, with several unique needs. Suggestions that were shared by a couple of
scholars included spending more time in a variety of classrooms and having some refreshers on
math subjects. Example quotes follow:
More time in various high school classrooms throughout the entire licensure program
would have helped.

Evaluation of Noyce METS – May 23, 2013 16
A small overview of basic math skills from each general math course I may teach at a
high school. For example, graphing polynomials, functions, probability, etc. Having short
sessions where we were reviewing material that we may have forgotten would have been
really helpful.

Evaluation of Noyce METS – May 23, 2013 17
III-b. Support
Financial Support
Scholarships
With the goal of helping scholars to cover their tuition and living costs, Noyce METS provides
financial support in the amount of $24,000 (previously $20,000), which is disbursed over the
course of two years for undergraduates and one year for graduate students.
Benefit Funds
In addition to the scholarship, Noyce METS provides other benefit funds to support professional
development and technology purchases. Survey results indicate that all of the respondents had
used at least one type of benefit funds. Specifically, 89% had used professional development
funds, 68% had used technology funds, and 42% had used flex funds for either technology or
professional development (Table 7).
Table 7: Scholars’ Use of Noyce Benefit Funds
Type of Funds Percentage of respondents indicating use (n=19)
Professional development funds 89%
Technology funds 68%
Flex funds for technology or professional
development (in-service teachers only) 42%
Total (Any type) 100%
Prompt: Which of the following Noyce benefit funds have you used?
The comments below illustrate some of the ways in which scholars have used Noyce benefit
funds:
These funds provided access to resources for my classroom and opportunities for me to
grow as a professional teacher by attending/participating in workshops, conferences, and
seminars.
I really enjoyed being able to purchase a new calculator so that I could see what it was
capable of and how I may want to incorporate it into my classroom. I like that I know I
have some money that I don't have to come up with out of my own pocket if I'm curious
about how I might use something for my classroom, like a tablet computer.
A couple of scholars suggested providing additional benefits funds to scholars after graduation,
particularly for ongoing professional development:
Some of the other benefits would have been better used after I graduated. In college you
don't see exactly how you need to grow [and] what you need to get better at. Now that
I've been teaching, I know what I need to look for and would like to work on.

Evaluation of Noyce METS – May 23, 2013 18
I would love to be able to have one or two days each semester away from work to do
professional development with professors at State. They really are my most valuable aid--
cutting edge research/techniques, they know the standards, and they know me.
People Support
The Participant Survey provided a list of Noyce-related resource people and asked the scholars to
indicate how useful each had been to their development as a teacher (Table 8). Of the five
resources listed, NCSU faculty and staff were rated by the largest percentage of scholars (79%)
to have been very useful to their development. In addition, most scholars found their NCSU-
based Noyce mentor to be either very (59%) or somewhat (35%) useful. Similarly, the Noyce
Program Managers were rated to be very useful by 53% and somewhat useful by 37%. On the
other hand, scholars were more likely to rate the community of fellow Noyce scholars as only
somewhat (74%) rather than very (21%) useful. Among the 10 scholars who reported having a
school-based Noyce mentor, 60% reported that their mentor had been very useful to their
development.
Table 8: Scholars’ Perceptions of the Usefulness of Resources to their Development as a
Teacher
Resource
Number for
whom the
resource was
applicable
Percentage of respondents
(out of those for whom the resource was
applicable)
Not at all
useful
Somewhat
useful Very useful
NCSU faculty and staff 19 0% 21% 79%
Your school-based Noyce mentor 10 20% 20% 60%
Your NCSU-based Noyce mentor 17 6% 35% 59%
The Noyce Program Managers 19 11% 37% 53%
The community of other NCSU Noyce
Scholars 19 5% 74% 21%
Prompt: How useful have the following been to your development as a teacher?
In a follow-up open-ended question, scholars were asked to describe how, if at all, these
resources have been useful to them. One key theme clearly stood out: scholars appreciated
receiving advice, guidance, and support from these resource people. For instance, some scholars
reported receiving help in dealing with classroom and career dilemmas. In addition, several
scholars mentioned benefiting from receiving constructive feedback after having their teaching
observed by the NCSU-based Noyce mentor. Some of these themes are illustrated in the
following quotes:
I have had questions and concerns on several occasions that were quickly answered, and I
have been given a tremendous amount of support during my first years of teaching. Even
when I have gone months without contact, I know that there are resources available any
time I need them.

Evaluation of Noyce METS – May 23, 2013 19
The program managers and my mentor have helped guide me through choosing a school
that would fit me. They have been encouraging and helpful. They work to help me
improve my teaching strategies and plans.
[The NCSU-based Noyce mentor has observed my class and] given me direct suggestions
about how to make specific lessons better. Her feedback is priceless since my
administrators don't really know all the math that I'm teaching! She suggests research-
based approaches and just common sense organization that I overlook in the day-to-day.
When asked how, if at all, these resources could be made more useful, the majority did not have
any suggestions to share. The minority who provided suggestions all had unique ideas, including
less work for school-based mentors, more observations of their teaching, a class on re-learning
content, and strategies for teaching lower-level students. These suggestions are detailed in the
following quotes:
If school-based mentors didn't have to do extra work for the Noyce program (not just
extra work helping me), I would have chosen one a long time ago. I know that my
colleagues have a lot on their plate, and I don't want them to have to do extra paper work
that wouldn't directly benefit me.
I would push for more observations from Noyce personnel once at a school.
There needs to be a class on re-learning algebra, geometry, algebra II, and discrete
content. As well as being real and learning how to approach this material as if you are
teaching lower level kids. The honors kids are easy to teach. It is the lower level kids that
need help.
Overall Support
The Participant Survey asked scholars to indicate their overall satisfaction with the support,
financial and other, that they have received from Noyce METS (Table 9). All but one of the
scholars surveyed (or 94%) indicated they are very satisfied, and the other respondent reported
being somewhat satisfied.
Table 9: Scholars’ Satisfaction with Support from Noyce METS
Satisfaction Level Percentage of respondents (n=18)
Not at all satisfied 0%
Somewhat satisfied 6%
Very satisfied 94%
Prompt: Overall, how satisfied are you with the support (financial and other) you have received from Noyce METS?
Scholars were asked to explain their response in a follow-up open-ended question. The one
scholar who reported being only somewhat satisfied felt that scholars should be afforded the
flexibility to use the funding designated for attending a national conference for other teaching
resources if preferred. In the explanations from those who felt very satisfied, the key theme was
the financial support, with several noting it had enabled them to take advantage of more
opportunities. Although less common, other themes included the community of support and
classroom preparation provided by Noyce. Some illustrative quotes follow:

Evaluation of Noyce METS – May 23, 2013 20
I think the monies offered by the Noyce program are more than adequate for supporting a
young teacher. I've been able to do so many things I never would have been able to
without the financial support of the Noyce program.
The support I received has been everything I expected and more. Whenever I had
questions or needed help, someone from Noyce was always there to aid me. Additionally,
Noyce allowed me to finish graduate school affordably.

Evaluation of Noyce METS – May 23, 2013 21
III-c. Beliefs and Practices
Teaching Beliefs and Practices
The Participant Survey asked scholars a series of questions on their beliefs about teaching (Table
10). All of the scholars agreed or strongly agreed that both the content of the curriculum as well
as “sense-making” among students are important parts of instruction. In addition, all of the
scholars agreed or strongly agreed that it is important to use various techniques and methods in
teaching mathematics to students, and most (89%) agreed or strongly agreed that it is important
to involve students in evaluating their own work and setting their own goals. In order to learn
mathematics/statistics deeply, most of the scholars (89%) agreed or strongly agreed that students
should have the opportunity to work with others, whereas only 26% agreed or strongly agreed
that students should work independently.
Table 10: Scholars’ Beliefs about Teaching Practices
Statement
Percentage of Respondents (n=19)
Disagree or
Strongly Disagree Neutral
Agree or Strongly
Agree
It is important to use various techniques and
methods in teaching mathematics to
students.
0% 0% 100%
"Sense-making" or thinking among students
is an important part of instruction. 0% 0% 100%
The content of the curriculum is an
important part of instruction. 0% 0% 100%
It is important to involve students in
evaluating their own work and setting their
own goals.
0% 11% 89%
To learn mathematics/statistics deeply,
students should have the opportunity to
work with others.
0% 11% 89%
To learn mathematics/statistics deeply,
students should work independently. 42% 32% 26%
Prompt: Please rate the extent to which you agree or disagree with the following statements.
In order to gain insight into scholars’ teaching practices, the Participant Survey provided a list of
instructional activities and asked scholars who were currently/recently teaching to indicate about
how frequently they do each one (Table 11). All scholars reported assigning mathematics
homework on a frequent basis, with 73% reporting they do this all or almost all the time and the
remaining 27% doing this often. Most scholars also reported frequently (on an often or all the
time basis) requiring students to explain their reasoning when giving an answer (93%),
introducing content through formal presentations (87%), and posing open-ended questions
(80%). In contrast, the majority of scholars reported doing the following activities on a less
frequent basis (done rarely or sometimes): allowing students to work at their own pace (60%),
asking students to consider alternative methods for solutions (60%), and asking students to use
multiple representations (60%). As for asking students to explain concepts to one another, most
scholars were split between those who reported doing this often (53%) and those who do this
sometimes (40%).

Evaluation of Noyce METS – May 23, 2013 22
Table 11: Frequency of Instructional Activities
Instructional Activity
Percentage of Respondents (n=15)
Never Rarely Sometimes Often
All or
almost all
the time
Assign mathematics homework 0% 0% 0% 27% 73%
Require students to explain their
reasoning when giving an answer 0% 0% 7% 67% 27%
Introduce content through formal
presentations 0% 0% 13% 67% 20%
Pose open-ended questions 0% 0% 20% 67% 13%
Ask students to explain concepts to one
another 0% 7% 40% 53% 0%
Allow students to work at their own pace 0% 7% 53% 33% 7%
Ask students to consider alternative
methods for solutions 0% 7% 53% 40% 0%
Ask students to use multiple
representations (e.g., numeric, graphic,
geometric, etc.)
0% 13% 47% 40% 0%
Prompt: About how often do you do each of the following in your mathematics instruction?
Scholars who were currently/recently teaching were also asked how often their students take part
in learning activities (Table 12). Almost all the scholars reported that their students frequently
take notes during presentations given by the teacher, with 67% reporting that their students do
this often and 27% reporting their students do this all or almost all the time. Most scholars also
reported that their students frequently (on an often or all the time basis) review
homework/worksheet assignments (80%) and answer textbook or worksheet questions (80%). In
contrast, most scholars reported that their students never (53%) or rarely (33%) read from a
mathematics textbook during class. Finally, scholars were most likely to report that their students
do the following learning activities on a sometimes or often basis: practicing routine
computations/algorithms (93%); following specific instruction in an activity using concrete
materials (93%); and recording, presenting, and/or analyzing data (87%).
Table 12: Frequency of Student Learning Activities
Student Learning Activity
Percentage of Respondents (n=15)
Never Rarely Sometimes Often
All or
almost all
the time
Listen and take notes during presentation
by teacher 0% 0% 7% 67% 27%
Review homework/worksheet
assignments 0% 0% 20% 53% 27%
Answer textbook or worksheet questions 0% 0% 20% 67% 13%
Practice routine computations/algorithms 0% 7% 27% 67% 0%
Follow specific instruction in an activity
using concrete materials 0% 7% 33% 60% 0%
Record, present, and/or analyze data 0% 13% 67% 20% 0%
Read from a mathematics textbook in
class 53% 33% 13% 0% 0%
Prompt: About how often do you do your students take part in the following types of activities?

Evaluation of Noyce METS – May 23, 2013 23
In an open-ended question, scholars who were currently/recently teaching were asked to share
any ways in which they have been able to use their Noyce-related experience to inform their
teaching. Several scholars mentioned incorporating lessons learned from professional
development sessions into their instruction. Other themes included incorporating educational
technologies and attending more to students’ conceptual understanding of mathematics. Some
example quotes follow:
Much of what I have learned about practical teaching I have learned from professional
development sessions which I attended using my Noyce funds.
I’ve used many of the technology-related activities that I learned during Noyce seminars
while teaching.
I've been able to use the ideas of reasoning and sense-making in my classroom to help
students understand the math better.
Technology beliefs and use
The Participant Survey asked scholars to rate their level of agreement or disagreement with
statements about technology use (Table 13). All but one of the respondents agreed or strongly
agreed that technology is an essential tool in the teaching and learning of mathematics/statistics.
In addition, most (84%) agreed or strongly agreed that students should be allowed to use
technology on classroom assessments, while the remaining 16% felt neutral about this issue.
Scholars were split on whether they believed that students would have a better understanding of
a new mathematical concept if they used technology to learn it; the most common response,
selected by just over half (53%), was neutral, followed by 42% who agreed or strongly agreed.
Opinions were even more mixed about whether students who regularly use technology in class
will be able to develop basic skills without becoming reliant on technology: only 16% agreed or
strongly agreed, with the rest split between those who felt neutral (42%) and those who disagreed
or strongly disagreed (42%).
Table 13: Scholars’ Beliefs about Technology
Statement
Percentage of Respondents (n=19)
Disagree or
Strongly
Disagree Neutral
Agree or
Strongly Agree
Technology, including graphing calculators and
computers, is an essential tool in the teaching and
learning of mathematics/statistics.
0% 5% 95%
Students should be allowed to use technology on
classroom assessments. 0% 16% 84%
If students use technology to learn a new
mathematical concept, then the students would
have a better understanding of the concept than if
students did not use technology.
5% 53% 42%
If students regularly use technology in the
mathematics/statistics class, they will be able to
develop basic skills without becoming reliant on
technology.
42% 42% 16%
Prompt: Please rate the extent to which you agree or disagree with the following statements.

Evaluation of Noyce METS – May 23, 2013 24
For scholars who were currently/recently teaching, the Participant Survey provided a list of
technologies and asked them to indicate about how frequently they have used each one during
their instruction in the last 12 months (Table 14). Out of the 19 technologies listed, only seven of
them were available to all of the scholars at their schools; these include graphing calculators,
laptops, information from the internet, communication tools (e.g., email, video conference),
mathematics applets, Web 2.0 tools, and spreadsheets. The one tool that most scholars reported
using frequently was graphing calculators, with 67% reporting they use them all or almost all the
time and an additional 20% using them often. In general, there was more variety in scholars’
responses for how frequently they have used the other technologies.

Evaluation of Noyce METS – May 23, 2013 25
Table 14: Frequency of Technologies Used During Instruction
Technology
Number who have
access to this
technology at
school (n=15)
Percentage of respondents
(Out of those who have access)
Never Rarely
Some-
times Often
All or
almost
all the
time
Graphing calculators 15 0% 0% 13% 20% 67%
Laptops 15 7% 7% 67% 0% 20%
Accessing lesson plans and
information for classroom use from
the internet
15 13% 27% 20% 20% 20%
Communication tools (email, video
conference) 15 20% 40% 0% 27% 13%
Mathematics Applets 15 13% 13% 67% 7% 0%
Web 2.0 tools (wiki, blogs, twitter,
voice thread, social networking) 15 27% 33% 7% 27% 7%
Spreadsheets 15 33% 40% 20% 7% 0%
Using videos/movies for mathematics
instruction 14 7% 21% 64% 7% 0%
Multi-media software (HyperStudio,
PowerPoint, GarageBand, iMovie) 13 8% 31% 15% 15% 31%
Creating and supporting web content
for instruction 13 0% 62% 15% 8% 15%
Dynamic Geometry software
(Sketchpad, Cabri, Geogebra) 12 17% 42% 33% 8% 0%
Interactive White Boards 11 0% 9% 27% 9% 55%
Data Collectors (CBL, CBR, MBL) 11 64% 9% 18% 9% 0%
Mobile phones 11 64% 18% 18% 0% 0%
Technology
Number who have
access to this
technology at
school (n=15)
Number of respondents
(Out of those who have access)
Never Rarely
Some-
times Often
All or
almost
all the
time
Tablets (iPad, NOOK Tablet) 9 5 1 3 0 0
Other mathematics specific software
(Green Globs, Probability Explorer,
Function Probe, Mathematica)
7 3 3 1 0 0
CAS (Computer Algebra Systems) 7 4 1 2 0 0
Dynamic Statistics software
(Tinkerplots, Fathom) 6 3 3 0 0 0
Using networked calculators (TI-
Navigator) or classroom management
system for networked computers
5 3 2 0 0 0
Prompt: About how often have you used the following technologies in your mathematics instruction in the past 12
months?
Evaluation of Noyce METS – May 23, 2013 26
Scholars were asked to provide some specific examples of ways in which they have used
technology to help students learn mathematics. Some examples follow:
I maintain a Schoology site for all my classes. With this site I can have students answer
discussion forum questions, access class notes, homework assignments, and communicate
with one another.
Most of my lessons are on PowerPoint, so when students are absent I will email the
lesson to them. We also use write-to-learn, so when students write math summaries I will
review them and write comments in them.
The students use [the] Study Island website for reviewing concepts. They also use iPads
for self-guided explorations of transformations and possibly triangles. My Statistics
students use their own computers often to produce graphs of data and to write
professional reports.
We explore concepts through applets (we use Illuminations a few times a year) and
calculators to compare and contrast graphs, solutions, or hypotheses we have made.
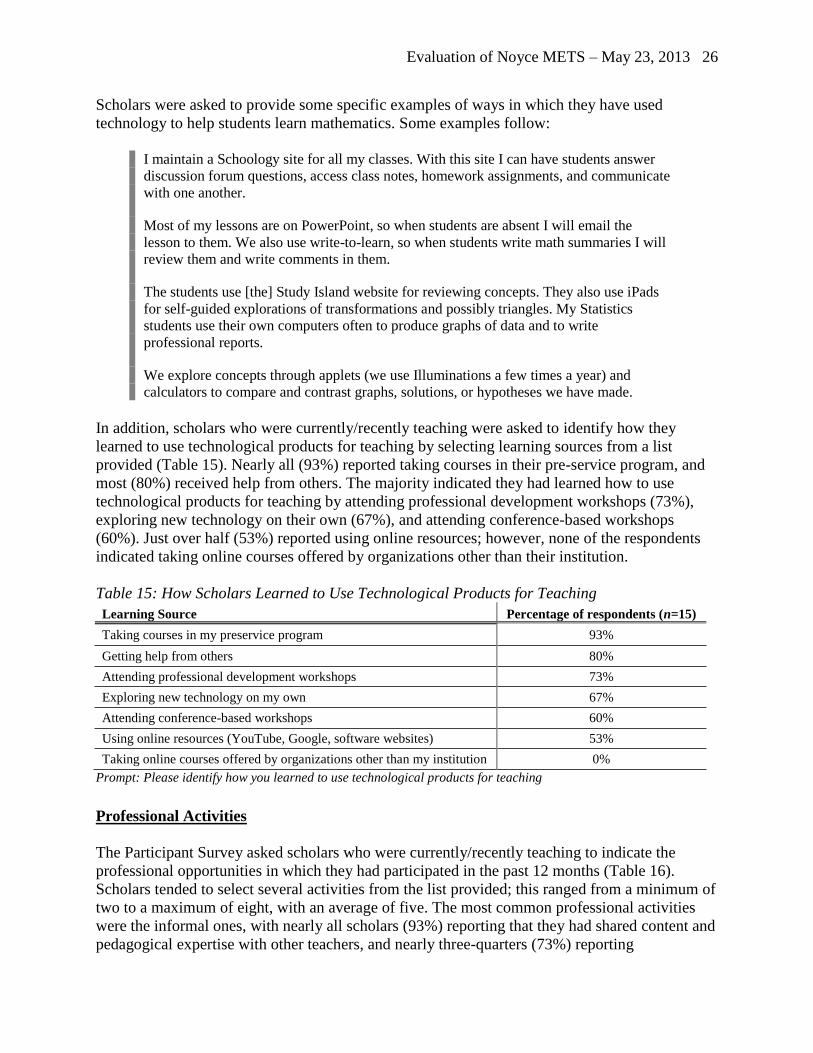
In addition, scholars who were currently/recently teaching were asked to identify how they
learned to use technological products for teaching by selecting learning sources from a list
provided (Table 15). Nearly all (93%) reported taking courses in their pre-service program, and
most (80%) received help from others. The majority indicated they had learned how to use
technological products for teaching by attending professional development workshops (73%),
exploring new technology on their own (67%), and attending conference-based workshops
(60%). Just over half (53%) reported using online resources; however, none of the respondents
indicated taking online courses offered by organizations other than their institution.
Table 15: How Scholars Learned to Use Technological Products for Teaching
Learning Source Percentage of respondents (n=15)
Taking courses in my preservice program 93%
Getting help from others 80%
Attending professional development workshops 73%
Exploring new technology on my own 67%
Attending conference-based workshops 60%
Using online resources (YouTube, Google, software websites) 53%
Taking online courses offered by organizations other than my institution 0%
Prompt: Please identify how you learned to use technological products for teaching
Professional Activities
The Participant Survey asked scholars who were currently/recently teaching to indicate the
professional opportunities in which they had participated in the past 12 months (Table 16).
Scholars tended to select several activities from the list provided; this ranged from a minimum of
two to a maximum of eight, with an average of five. The most common professional activities
were the informal ones, with nearly all scholars (93%) reporting that they had shared content and
pedagogical expertise with other teachers, and nearly three-quarters (73%) reporting

Evaluation of Noyce METS – May 23, 2013 27
participation in discussion about teaching practice and policy. The majority also indicated
participating in professional conferences (73%), local or state organizations (67%), and national
organizations (67%). Other activities were indicated by 13-47% of the scholars, with the
exception of Department Chair, which was not selected by any of the scholars.
Table 16: Scholars’ Participation in Professional Activities
Professional Activity
Percentage of respondents
indicating participation (n=15)
Shared content and pedagogical expertise with other teachers (e.g.,
professional learning team) 93%
Participated in discussion about teaching practice and policy 73%
Attended professional conferences 73%
Local or state organizations (e.g., NC Council of Teachers of Mathematics,
NC Association of Educators, Kenan Fellows) 67%
National organizations (e.g., National Council of Teachers of Mathematics,
National Education Association, Mathematical Association of America) 67%
School-based committee 47%
Presented at professional conferences 33%
School-based organizations (e.g., Student Council, National Honor Society) 27%
Led a session or workshop for other teachers 20%
School district level committee (e.g., textbook adoption committee,
assessment committee) 13%
Department Chair appointment 0%
Other 13%
Prompt: Please indicate the opportunities in which you have participated in the past 12 months.

Evaluation of Noyce METS – May 23, 2013 28
III-d. Teaching Experience
Characteristics of Teaching Positions
The Demographic Follow-Up Survey collected information from 21 of the 24 scholars who had
completed teaching licensure requirements as of spring 2012. Of those surveyed, 17 (or 81%)
taught full-time during the 2012-2013 academic year. Table 17 presents the characteristics of
their current (or most recent) teaching assignments. All but one of the scholars was teaching in
North Carolina. Almost all the scholars were teaching grades 9 (93%) and 10 (93%), and the
majority were also teaching grades 11 (80%) and 12 (73%). The most popular courses were
Algebra 2 and Geometry, each taught by about half (53%) of the scholars. When asked whether
their school district/system has at least one school whose teacher attrition rate has been 15% or
more over the last three school years, half responded affirmatively and the other half were
unsure. Moreover, 81% indicated that their school district/system has at least one school in
which 50% or more of the enrolled students are eligible for participation in the free and reduced
price lunch program, while the remaining 19% were unsure whether this is the case in their
district. Under half (44%) of the scholars reported having a Noyce Mentor Teacher who was also
teaching mathematics in their school.
Table 17: Characteristics of Current Teaching Assignment
Characteristics
Respondents (n=15-16)
Number Percentage
Location (n=16)
North Carolina 15 94%
Out of state 1 6%
Grade levels currently teaching (n=15)
9th
grade 14 93%
10th
grade 14 93%
11th
grade 12 80%
12th
grade 11 73%
Courses currently teaching (n=15)
Introduction to Mathematics 1 7%
Common Core Math I 2 13%
Algebra 1 3 20%
Algebra 2 8 53%
Geometry 8 53%
Advanced Functions and Modeling 4 27%
Statistics 1 7%
Pre-Calculus 3 20%

Evaluation of Noyce METS – May 23, 2013 29
Table 17: Characteristics of Current Teaching Assignment, continued
Characteristics
Respondents (n=16)
Number Percentage
School district/system has at least one school whose teacher attrition rate has been 15% or more over the last
3 school years
Yes 8 50%
Not sure 8 50%
School district/system has at least one school in which 50% or more of the enrolled students are eligible for
participation in the free and reduced price lunch program?
Yes 13 81%
Not sure 3 19%
Scholar has a Noyce Mentor Teacher
Yes 7 44%
No 9 56%
Professionalism
The Participant Survey asked scholars who were currently/recently teaching to rate the extent to
which they agree or disagree with the statement, “I feel like a professional in my role as a
teacher” (Table 18). All but one of the scholars (i.e., 93%) indicated that they agreed or strongly
agreed.
Table 18: Scholars’ Feelings of Being a Professional
“I feel like a professional in my role as a teacher” Percentage of respondents (n=15)
Strongly Disagree 7%
Disagree 0%
Neutral 0%
Agree 60%
Strongly Agree 33%
Scholars were asked to explain their response in an open-ended follow-up question. Among
those who agreed that they feel like a professional, some mentioned that they take their
responsibilities seriously, while others mentioned feeling respected or highly regarded at their
school. Example quotes follow:
I take the responsibilities of my job very seriously; to accept the responsibility of being a
teacher entails acknowledging it takes a professional to do my job. I am in charge of
educating many parents' children and I don't take that charge lightly.
I feel that I am a professional in my role as an educator because I have been very highly
regarded at my school. Taking up leadership roles in committees, dynamically
influencing what is taught and how content is taught in Algebra 1 with the new common
core standards.
I try to act professionally in my job, and I think my students respect that.

Evaluation of Noyce METS – May 23, 2013 30
On the other hand, a couple of scholars cited challenges with maintaining a healthy work/life
balance, being young, having to focus on testing, and experiencing a lack of trust from
administration as factors that have detracted from them feeling like a professional. The following
quotes illustrate these sentiments:
I feel like I do not always have enough time to prepare as a 'professional'. There is always
a struggle of work/home balance.
Because I am so young, and look so young, sometimes I feel as though (some) of the
parents look at me in disbelief that I am a highly qualified teacher. As the years go on,
and I have been working at the school for more than a year and a half, I am sure this will
decrease.
I am treated with respect from my supervisors and district, but I feel like my role has
become nothing more than a preparer of end-of-course testers.
The only people who make me feel professional are Noyce conference personnel. There
seems to be a lack of trust from administration to teachers at my school (not to me
personally, but we all tend to suffer for the sins of a few). The system as a whole does not
operate like other professions (I work a 60-hour week instead of 40 without extra
compensation, sometimes don't get a lunch break because there's no built-in time for me
to tutor students who need extra differentiated one-on-one time, I don't get a raise for
being a leader in the school with extra responsibilities, am given more work with less
time…, etc.). I feel as though a professional is trusted to do their job, and when shown to
do things well, is applauded instead of given more work. I constantly feel as though I
keep getting more work because I work hard, and yet receive no benefit for my
work…MY PERSONAL TIME IS NEVER VALUED. I understand many professionals
are given duties that require some weird exception days. However, cutting into my
personal time is a norm, and I don't think that's a professional expectation for your
workers.
In another open-ended question, scholars were asked to explain what being a professional
educator means to them. Two key themes emerged from scholars’ responses. First, being a
professional means striving for continuous improvement through ongoing professional
development (formal and informal). Second, a professional educator is knowledgeable, skilled,
and effective at helping students to succeed. In addition, a couple of scholars noted that
professional educators take their responsibilities seriously and respect and support their
colleagues and students. Some examples are provided below:
I think it means that I take the education and well-being of my students very seriously,
and I also respect the other teachers in my school and try to support them in their goals as
well. I try to learn new ways to teach better, and I am constantly trying to improve.
Someone who is well-versed in the area of teaching. They know how to teach all students
including diverse learners.
An accomplished teacher with consistently good results on standard tests. A leader at the
school and someone that is always looking to improve by taking advantage of
professional development.

Evaluation of Noyce METS – May 23, 2013 31
Collegiality
The Participant Survey presented scholars who were currently/recently teaching with a series of
statements designed to gauge their perceptions of collegiality at their schools (Table 19). All of
the scholars agreed or strongly agreed that they have regularly shared ideas and materials related
to mathematics teaching with their colleagues. Likewise, nearly all (93%) agreed or strongly
agreed that they have had time during the regular school week to work with colleagues on
mathematics curriculum and teaching. Despite these positive indications of collaborative
working environments, results also suggest that teachers do not regularly observe each other
teaching. Furthermore, opinions were mixed about whether most math teachers have contributed
to curricular decision making; although two-thirds (67%) agreed or strongly agreed, a notable
minority (27%) disagreed or strongly disagreed, and the remaining 7% were neutral. Results also
show relatively lower endorsement, although still supported by the majority, of statements about
school leadership consistently supporting teachers (67%) and their schools having an atmosphere
of trust and mutual respect (60%).
Table 19: Scholars’ Perceptions of Collegiality
Statement
Percentage of Respondents (n=15)
Disagree or
Strongly Disagree Neutral
Agree or Strongly
Agree
My colleagues and I regularly have shared
ideas and materials related to mathematics
teaching.
0% 0% 100%
I have had time during the regular school
week to work with my colleagues on
mathematics curriculum and teaching.
0% 7% 93%
The school leadership consistently supports
teachers. 13% 20% 67%
There is an atmosphere of trust and mutual
respect within this school. 13% 27% 60%
Most mathematics teachers in this school
have contributed actively to making
decisions about the mathematics curriculum.
27% 7% 67%
Mathematics teachers in this school regularly
have observed each other teaching classes as
part of sharing and improving instructional
strategies.
53% 47% 0%
Prompt: Please rate the extent to which you agree or disagree with the following statements.
Successes, Challenges, and Surprises
Scholars who were currently/recently teaching were asked a series of open-ended questions
about their teaching experience. First, they were asked what have been the major successes and
rewards. Scholars most commonly responded that their major success is seeing their students
grow and succeed. Several scholars considered it to be a major success when they were able to
inspire and motivate students to care about learning and to appreciate math more. In addition,
several have found it rewarding to build caring and supportive relationships with students. A
couple of examples are provided below:

Evaluation of Noyce METS – May 23, 2013 32
I feel like I've had a good impact on student learning and have built solid relationships
with my students that helped them mature.
I have been able to reach some students and change their ideas about mathematics. I have
also been able to deepen students’ understanding and inspire them to be better students.
These things are the most rewarding parts of my job.
Second, scholars were asked what have been the major challenges and frustrations of their
teaching experience. The following themes emerged from their comments: students’ apathy and
lack of motivation or desire to learn, problems with student behavior and classroom
management, administrative duties like meetings and paperwork that detract from teaching, and
not having enough time despite long work hours. In addition, a couple scholars mentioned the
challenge of working with students who come into their class with very low skills in
mathematics. Some illustrative quotes follow:
Student apathy has been the biggest frustration for me, followed by my time
management. I don't seem to have enough time in the day to do all of the things that I
want in the classroom. Couple that with students who don't really care about their grades,
and I am really pushed to the limit, trying to figure out new interesting ways to deliver
the material to the students.
Managing classroom behavior has been a challenge and a frustration. I feel like I have
built up a lot more patience than I had before and have learned to forgive easier than I
could before. Some students are incredibly disrespectful, and it's taken a while to get used
to the fact that there will be students like that in my classroom.
The unrealistic expectations of university professors and advisors of how students
"should" be taught are not possible in the majority of class settings - whether due to a
large amount of material to cover, complete lack of motivation by students, or because
students simply don't have the basic math skills necessary to do much of anything.
Third, scholars were asked what have been the major surprises of their teaching experience. For
the most part, their responses mirror the challenges they have experienced. Several shared that
they were surprised by the amount of extra duties outside of teaching (meetings, trainings,
initiatives, parents, observations, evaluations, etc.) and the amount of time required. A few were
surprised at how poor their students’ math skills were. Some examples are provided below:
I have been a little surprised with the politics and overarching stress that comes along
with teaching, outside of the classroom. From observations, evaluations, meetings, and
statistics, it has sometimes become overwhelming with all of the other things involved in
teaching other than just teaching.
How low most students are and how unwilling they are to do most, if any, work.
While most surprises were negative, a few scholars shared pleasant surprises:
My students doing so well at the end of last year. I almost didn't believe it. And being
nominated for teacher of the year.

Evaluation of Noyce METS – May 23, 2013 33
Students surprise me all the time, whether it is a pleasant surprise (coming up with a
brand new way to solve a problem, or doing an over-the-top great job on a project) or
unpleasant surprise (throwing glue sticks at my ceiling or lack of previous knowledge).
Job Satisfaction
The Participant Survey asked scholars who were currently/recently teaching to indicate how
satisfied they were overall with their current (or most recent) teaching experience (Table 20).
Responses were split between two-thirds who reported being somewhat satisfied and one-third
who were very satisfied.
Table 20: Scholars’ Satisfaction with Teaching Experience
Satisfaction Level Percentage of respondents (n=15)
Not at all satisfied 0%
Somewhat satisfied 67%
Very satisfied 33%
Prompt: Overall, how satisfied are you with your current (or most recent) teaching experience?
In a follow-up question, scholars were asked to explain their response. There were many unique
explanations, but one key theme emerged; several scholars reported that, despite the challenges,
they are generally satisfied because they enjoy their school and the students and faculty with
whom they work. This sentiment is illustrated in the following quote:
Although teaching is far from easy, I am very happy with the school I work at, the
students I teach, and the teachers I work with.
In addition, scholars were asked what additional supports, if any, would have made their
teaching experience more satisfying for them. Responses were unique, with no clear themes
emerging. Some examples are provided below:
More observations of other teachers at my school. I would love to see the different
methods and how other teachers interact with the same group of students. I think I would
learn a lot from that.
Consistency from administrators and other teachers.
I need to know more about the tests we are giving the students and how to help them be
successful in a course they are not prepared to take.
I think an afternoon workshop on all the little annoying things you have to do as a teacher
would have been helpful (signing paperwork, logging in to a million different services,
how to keep all this information organized, etc.).

Evaluation of Noyce METS – May 23, 2013 34
III-e. Retention
The goals of the Noyce METS program are not only to recruit and prepare high quality
mathematics teachers, but also to help keep them in the teaching profession. Results from last
year’s evaluation show that, as of spring 2012, Noyce METS had achieved a high retention rate,
with 92% of its scholars teaching or on track to teach. In other words, of the 26 scholars funded
through Noyce METS, only two had decided to leave the teaching profession at the time of last
year’s evaluation. However, this year saw an additional five scholars leave the profession,
bringing the retention rate down to 73% (note that this rate includes one scholar who works as a
substitute teacher; if you include only those who are full-time teachers, the retention rate is
69%).
A detailed representation of current scholar statuses is presented in Figure 2 and Table 21. Two
scholars exited early in the pipeline. One left the Noyce METS program before finishing the
mathematics education program coursework. The other finished the program coursework, but
decided against applying for licensure. At this point, neither of these scholars intends to pursue
teaching as a career; both decided to default on their teaching obligation, and as a consequence,
will have to repay the scholarship. As part of last year’s evaluation, interviews were conducted
with these two “early exiters” to gain insight into the factors that led them to default. Both came
to their decisions based on their early experience in the classroom volunteering and student
teaching. They cited classroom management issues and lack of administrative support as pivotal
factors in their decision to leave the profession. See last year’s evaluation report for additional
details.
Over the course of the past year, additional scholars have fallen out of the planned pipeline. Two
scholars graduated from the mathematics education program and obtained teaching licenses, but
have yet to enter teaching. Currently, one is pursuing a PhD in mathematics, and the other is
pursuing a non-teaching career. Nevertheless, both of these scholars have expressed intentions to
fulfill their Noyce teaching obligations within the six years they are given to do so. Therefore,
they have not yet officially defaulted, and are hoped to be “temporary exiters” who will indeed
become teachers in the near future.
Finally, three other scholars decided to leave the teaching profession after fulfilling their Noyce
teaching obligations. In order to gain insight into their reasons for leaving the profession,
interviews were conducted with two of these three “experienced exiters” as part of this year’s
evaluation (see results below).
The remaining 19 scholars (or 73%) have succeeded through the planned pipeline: that is, they
graduated from the mathematics education program, obtained their teaching licenses, entered
teaching, and are still teaching today.

Evaluation of Noyce METS – May 23, 2013 35
Figure 2: Summary of Current Scholar Status
Table 21: Summary of Current Scholar Status
Status n % of total
Left program before finishing coursework (“early exiter”) 1 4%
Finished coursework, but did not obtain licensure (“early exiter”) 1 4%
Finished coursework, and obtained licensure, but yet to teach (“temporary exiter”) 2 8%
Finished coursework, obtained licensure, and entered teaching, but left the
profession (“experienced exiter”) 3 12%
Total exiters 7 27%
Total current teachers: Finished coursework, obtained licensure, entered teaching,
and are still teaching 19 73%
Scholars funded through Noyce
METS
(n=26)
Left program before finishing coursework
(n=1, 4% of total)
Finished coursework
(n=25, 96% of total)
Did not obtain licensure
(n=1, 4% of those who finished
coursework, 4% of total)
Obtained licensure
(n=24, 96% of those who finished
coursework, 92% of total)
Yet to teach
(n=2, 8% of those who obtained
licensure, 8% of total)
Entered teaching
(n=22, 92% of those who obtained
licensure, 85% of total)
Left the profession
(n=3, 14% of those who entered
teaching, 12% of total)
Still teaching
(n=19, 85% of those who entered
teaching, 73% of total)

Evaluation of Noyce METS – May 23, 2013 36
Interviews with two of the three experienced exiters shed light on some of the factors that led
them to leave the teaching profession. For both exiters, their frustrations with their school’s
administration were pivotal in their decision to leave. As illustrated in the following interview
excerpts, both became disillusioned with the teaching profession due to a lack of strong
leadership on the part of their administration. They both expressed frustration with the way in
which administration handled problems, describing the lack of, or inconsistent, enforcement of
standards. Furthermore, both felt as though they did not have the support of their administration,
especially at critical moments when they needed it.
I was frustrated with leadership, not only at my school now, but at the school prior to that
too. I felt we were lacking in strong leadership, and it made it difficult to do our job. It
was disappointing to me…I felt they were far more concerned about the politics with how
they looked rather than the quality of education that was coming through…Standards
were supposedly set, but they never enforced them for teachers and students, lowering the
bar for them and making excuses for the students. Sometimes that’s necessary, but it
shouldn’t be the norm, it should be the fall back case. I had to defend myself more than
once to my administration, and the kid was always in the right. I told my second
principal, “You hired me as a professional to do my job. If you think I’m not doing it, let
me know, and if I am, you should trust me to be a professional and treat me as such. If
I’m not being a professional, then I don’t need to be there.” I felt that [my principal]
wasn’t handling that well personally.
It really was one isolated event…I stepped in [to stop a fight], and one [of the students]
came rushing back at me, got in my face cussing at me…Basically, it turned out he’s a
[kid with Behavioral Emotional Disturbance], and nothing happened to him. I think he
received one lunch detention for the incident, and it [was only] three weeks later [after]
me pressuring them and my Department Head sticking up for me…A week later a female
teacher friend of mine got cussed out, and that kid got suspended for five days. Just the
inequality of that. I understand they try to approach different kids in different ways, but I
just thought they’re letting some of these kids get away with whatever they
want...Because of my stature, [the assistant principal] thought I can handle it, even
though I’m sitting there stewing and essentially scared to go to my job because,
apparently, if they aren’t going to do anything, a student could hit me…The lack of
support was enough… My administration didn’t support me because they didn’t have the
school system support…At that point, I just kind of lost interest.
Other key factors impacting their decisions included needing a better work/life balance for one
and being offered his/her old job back for the other:
One on a personal level, a lot of stuff is going on in my life, and I found it very difficult
to juggle that and teaching. Because of my personality, it takes a lot of my time, and I put
a lot of energy into it and a lot of stress. I worried about things I probably shouldn’t have,
but I did. The personal part was family, and I had to choose family over teaching.
I knew [my old company] was looking. One of my coworkers [told them that I] might be
interested in coming back, so they told me to come in and talk. So I met with them and
they were like, “We want you back.”

Evaluation of Noyce METS – May 23, 2013 37
Both exiters emphasized that there was nothing about their experience in Noyce METS that
drove them to want to leave the teaching profession. On the contrary, both viewed their Noyce
experiences positively and were grateful for the supports that were extended to them once they
entered teaching:
No, I think the Noyce thing was great. It helped me a lot knowing that I had not only the
people in charge of it, if I needed anything, but also the other ones that did it. Another
teacher that went through Noyce worked with me at [my school]. We went in together
and kind of supported each other a lot. Everything with that was great. It just boiled down
to that [one incident].
I don’t feel any of the Noyce things led me to leave; if anything, they supported me. They
were on my list of why I should stay, not why I should leave…If anything, [Noyce] was
the reason I stayed as long as I did. I apologized to my mentor; I felt like I had let people
down. They had done so much for me, I wanted to return that, but it just wasn’t there.
The exiters were asked whether the decision to leave teaching was easy or difficult for them.
Both indicated that it was a difficult decision, citing a sense of obligation and a persisting desire
to teach or work with students in some capacity, as factors that made it difficult:
It was [difficult]…It was about a two-month time period that I actually thought about it,
and the whole time I waffled back and forth…I told them I wanted to finish the school
year if nothing else because I felt obligated to the kids…I liked the people I taught
with...I do really enjoy working with the kids. Those two things [made my decision
difficult]. When I turned in my resignation, I dropped the idea that I’d be willing to stay
on and help with the swim team. That kind of made it easier so I could still work with the
kids… I feel bad leaving. I’m not ruling out the option of going back. I needed to step
away for a while. The positiv[ity] of what I was doing was just outweighed a great deal
by the county crap.
Very difficult. I still want to teach in a way, another avenue. The part of me that led me to
teach is still there; that part of me hasn’t changed. I had so many great teachers along the
way and support through the mentorship, not only Noyce, but at the schools. I didn’t want
to let anybody down. It was a commitment I made and I felt strongly about it. It was
definitely a difficult decision.
Neither of the exiters believed there was anything Noyce could have done to help maintain their
interest in the teaching profession because, according to both, the factors that drove them to
leave the profession were outside of anyone’s control:
I can’t imagine unless they could set up scenarios, but you can never tell what’s going to
happen on a daily basis…I don’t think they can bring in kids to fake being jerks…I don’t
think you could have told me certain things would have happened. I loved the teaching. I
had a blast doing it. It was just the events outside of my control.
For me particularly, I don’t think so. The part that drove me to it, the final nail in the
coffin, was out of anybody’s control.

Evaluation of Noyce METS – May 23, 2013 38
In terms of how Noyce could help future applicants determine whether the program would be a
good fit for them, both of the exiters suggested increasing the opportunities for scholars to
experience the classroom early on--even before applying, if possible--and exposing them to a
variety of different environments.
I really think getting us into the schools early in the teaching process [is]
good…Maintaining [that part] of the program and just getting Noyce scholars in front of
the class as much as possible even before student teaching would be great. And they did
that; they did mini lessons. Knowing that sooner than later is key, just having that
exposure as much as we can in different environments, maybe different schools as well to
get a variety, to see what’s out there.
The only thing I can think of maybe is just more classroom opportunities to observe and
visit. I know there are enough Noyce people out there now, if they could somehow get
[prospective scholars] out there with teachers to see how it is… to observe or tutor or do
a mini lesson with them there. I think the more exposure you get to that, the easier it
makes it jumping in…That’s hard to do during the application process, but if somehow
they could get people into classrooms before they even apply, that might give them a
better idea…
Survey responses from scholars who are currently teaching also provide some useful insights
regarding retention. Although the Participant Survey did not directly ask scholars about their
intentions to leave or stay in the profession, scholar’s responses to open-ended questions about
job satisfaction and the challenges they have faced help to shed light on some factors that could
drive scholars to leave the profession in the future. These factors include inconsistent
expectations, students’ apathy and lack of motivation, students’ misbehavior, long hours,
inflexibility, and low pay, among others. The following quotes illustrate these themes:
I am somewhat satisfied in that most days I enjoy my job. When I can close my door and
just do my job in the classroom. I am not very satisfied because I still believe I cannot
teach for the rest of my life. There is too much inconsistency at my school. I feel like I
can do what I want, which is good when I work so hard to teach well for my students and
no one says no, but that also means that no one says no to the teachers that are really just
earning money while they babysit. If I don't think about those teachers that make more
money but do a lot less for their students, then I would say almost very satisfied, but I
cannot.
I'm not sold on teaching. I am sold on helping teenagers get through life and being there
for them. However, trying to sell them the idea of mathematics is stressful.
My first semester was very rough and I was ready to quit. I still am working about 10
hours a day plus about 8 more hours each weekend and was not prepared for the
inflexibility of the job. My second semester is going better because I only have one prep
and I do not have the behavior issues I had my first semester. However, the hours are still
very long, the lack of student motivation is frustrating, and the pay is (of course) way
below what I was previously making.

Evaluation of Noyce METS – May 23, 2013 39
In addition, the following quotes illustrate the important role that Noyce--and in particular, the
teaching obligation, the quality preparation, and the programmatic supports--has played in
helping to maintain scholars’ motivation to teach.
Very early in my full-time teaching position, I became overwhelmed and started
questioning whether I was going to be able to fulfill my Noyce requirement of 2 years of
service, much less have a career in education. Due to being sick and losing my
confidence in the classroom, I thought I was going to have to quit. However, with the
help of my friends and family, particularly those who had teaching experience, I realized
I was not alone in feeling like this and was able to turn the corner and am having a
successful semester. Again, the most important service Noyce provides is a community of
caring individuals because that is the greatest resource for any young teacher.
During my teacher training, it allowed me to focus on becoming a better teacher. Now
that I have graduated, and am having difficulty finding a full-time teaching job, my
Noyce contract is extra incentive to not give up and try a new career path.
At the same time, with fewer Noyce supports available after the second year of teaching, it is
possible that some scholars will question whether they want to remain in teaching beyond that
point, as suggested by the following quote:
The support I receive, in the classroom and financially, has been beyond what I expected
I was going to get. This program has kept me in the profession when so many are
quitting. I feel that Noyce and my masters make me a better teacher, and thus, I feel as
though as I should be valued more in the school system. If I could ensure that these
supports would continue, I would feel more valued and would most likely stay in the
profession. However, with my Noyce support ending soon, I am pondering quitting
teaching to pursue a PhD to teach at a post-secondary institution.

Evaluation of Noyce METS – May 23, 2013 40
IV. RECOMMENDATIONS
This section discusses recommendations drawn from evaluation findings.
Discuss the negative aspects of the teaching profession and help scholars develop strategies
and coping skills. Scholars’ responses to open-ended questions about the challenges,
frustrations, and surprises they have faced suggest some areas on which Noyce METS may want
to focus additional discussion. Scholars reported that some of their greatest challenges and
frustrations have dealt with student apathy and lack of motivation, student misbehavior and
classroom management, low skill levels of students coming into their classes, lack of trust and
support from administration, extra duties that detract from teaching, lack of time to fulfill duties
despite long work hours, and difficulty maintaining a health work/life balance. In order to help
prepare scholars for facing these challenges and to help minimize frustrations, Noyce METS
could devote more time to exposing scholars to the negative aspects of teaching through
observations, discussions, and/or role-playing scenarios. In addition to equipping scholars with
strategies for dealing with difficult situations, Noyce METS could also help scholars develop
coping skills to strengthen their resilience against circumstances that are difficult or slow to
change. Moreover, Noyce METS could help scholars develop skills in managing the potentially
conflicting demands of work life and home life.
Provide even more opportunities for scholars to get classroom experience early on, especially
in a variety of environments. Several scholars reported that their early experiences in the
classroom were crucial to their preparation. When asked what Noyce METS could do to help
prepare scholars for teaching, some scholars suggested providing even more opportunities for
scholars to spend time in a variety of different classroom environments. Furthermore, because
classroom experience helps scholars determine whether the teaching profession is right for them,
it is important for scholars to get this experience early on. In fact, one scholar recommended
extending this opportunity to prospective scholars even before they apply, if possible. Therefore,
Noyce METS should continue its partnership with a local high school and encourage both
scholars and applicants to get classroom experience as early as possible. In addition, Noyce
METS could establish additional opportunities by reaching out to scholars who are currently in
the field.
Consider extending some supports beyond the scholars’ second year of teaching. In addition to
the financial and other supports provided to scholars during their schooling, Noyce METS also
provides some supports (e.g., flex funds, mentors) to scholars during their first two years of
teaching. Scholars in the field reported appreciating these program supports, with some noting
that the supports have helped them to stay in the profession. On the one hand, this is an
encouraging finding, but on the other hand, one implication is that some scholars might question
whether they want to remain in teaching once the Noyce supports have come to an end. Although
it is understood that the program cannot support scholars indefinitely given limited resources, the
program might want to consider extending some supports beyond the second year and reducing
the amount of support more gradually.

Evaluation of Noyce METS – May 23, 2013 41
Consider whether Noyce METS could play a role in influencing broader changes at the
education policy and system levels in order to improve the nature of the teaching profession. The overall conclusion that can be drawn from scholar feedback about their teaching experiences
is that the nature of the teaching profession is difficult. Scholars reported that Noyce METS did
an excellent job of preparing them for the challenges; however, even the best preparation alone
cannot guarantee job satisfaction. That is one reason why Noyce METS supplements preparation
with programmatic supports that extend to scholars during their first two years of teaching.
Indeed, these supports have contributed to scholars’ job satisfaction, and according to a couple,
have been a factor in their retention. However, for those that have left the profession, the
negative conditions they experienced overshadowed their motivations to teach. The factors that
drove them to leave, while unique, also reflect the broader challenges facing the profession. As it
stands, these challenges seem outside the range of influence held by Noyce METS. According to
exiters, there is nothing Noyce could have done to help maintain their interest in the teaching
profession because the factors that drove them to leave were outside of anyone’s control. These
findings suggest that, in order for Noyce METS to increase its impact on scholar retention, the
program may need to expand its influence. In other words, program staff may want to consider
whether there are any roles that Noyce METS could play in improving the broader conditions
that are driving highly qualified teachers to leave the profession. For instance, as a starting point,
perhaps Noyce scholars and staff could help organize action groups around the lessons learned
through this evaluation.