now i know who moved your cheese - sascommunity · now i know who moved your cheese ... zmúltiple...
TRANSCRIPT

1
2
Now I know who moved your Cheese
Using SAS to improve development Costs
European SAS Forum
Geneve, May 2006
Ignacio Fernández MontolíCompetence Center
Gas Natural Informática [email protected]

3
4
Contents
1. Now I know who moved your cheese
2. Who are we
3. MOOD initiative
4. Using SAS to provide metrics
5. AUTPLAN project
6. Conclusions and… maybe questions?

5
Now I know who moved your Cheese

6
Now I know who moved your CheeseTransforming I.T. organizations to cut off costs and to improve
efficiency and qualityby Dr. Prof. Frank k. Lee
Story based on the book…

7
An Incredible Tale…

8
Four Adventurers following a dream…
Wanda Doolittle
Joe WatersAndrew Essal
Gus Nathan Gus Nathan

9
A great adventure…
10
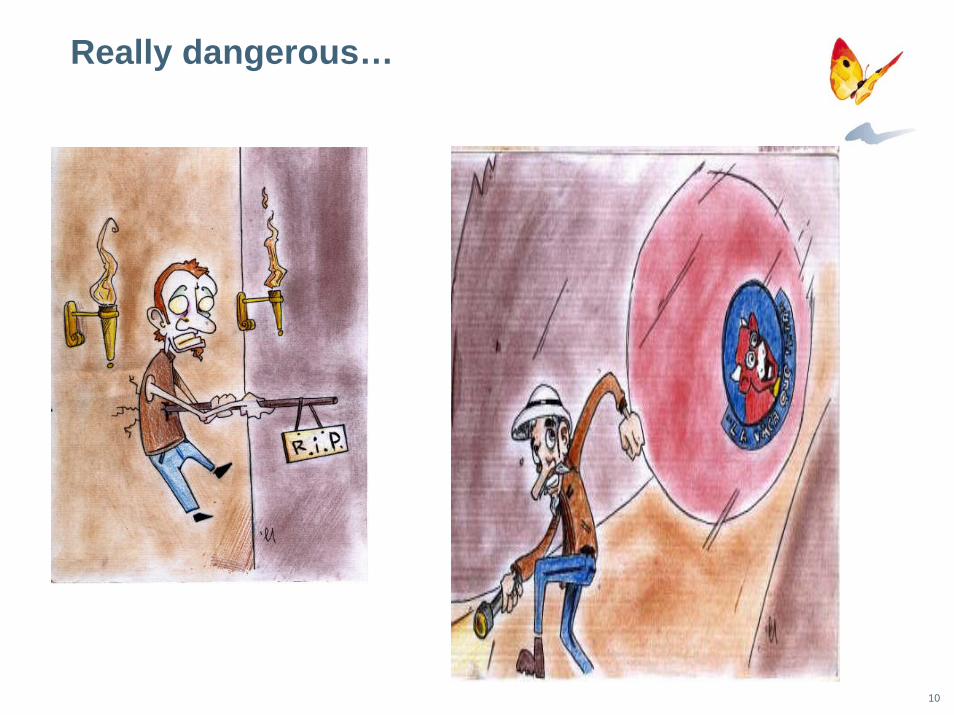
Really dangerous…

11
The conquest of the Treasure…
12
But keeping the secret was not so easy…
• They would deny the existence of the treasure …
• But the legend was true…
• They had found their mission on the life…
• Each one would create a cattle exploitation and build a cheese factory
• Full agreement was not possible…
• Therefore, each one opted for a different solution …

13
Body Shopping…
Boys’n Shopping Corp.
14
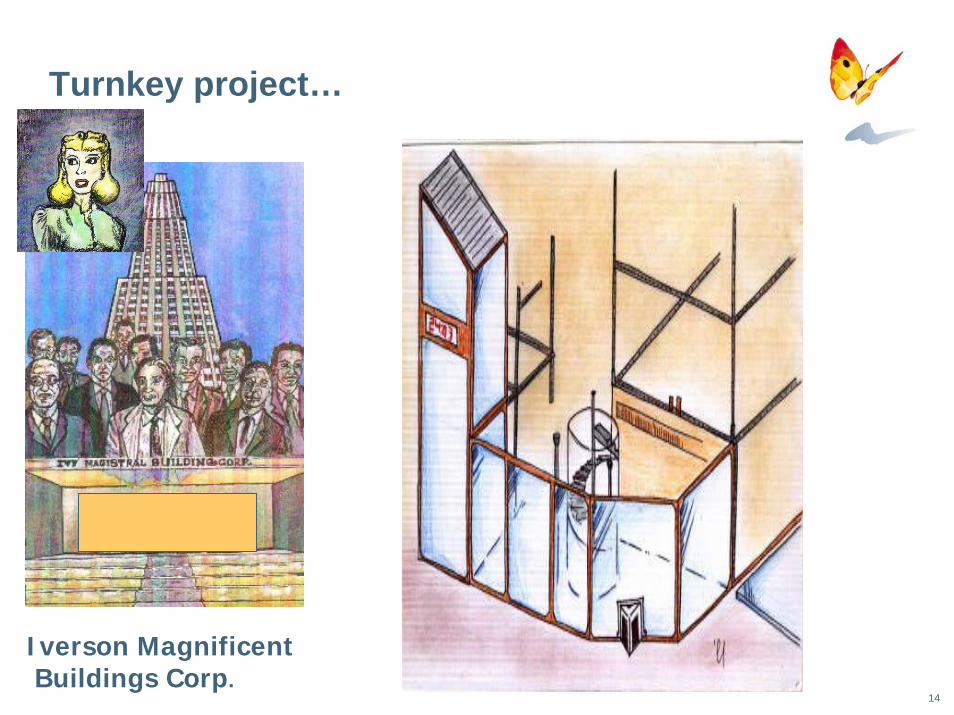
Turnkey project…
Iverson MagnificentBuildings Corp.

15
Outsourcing…
Axel C. Sturion Associates
16
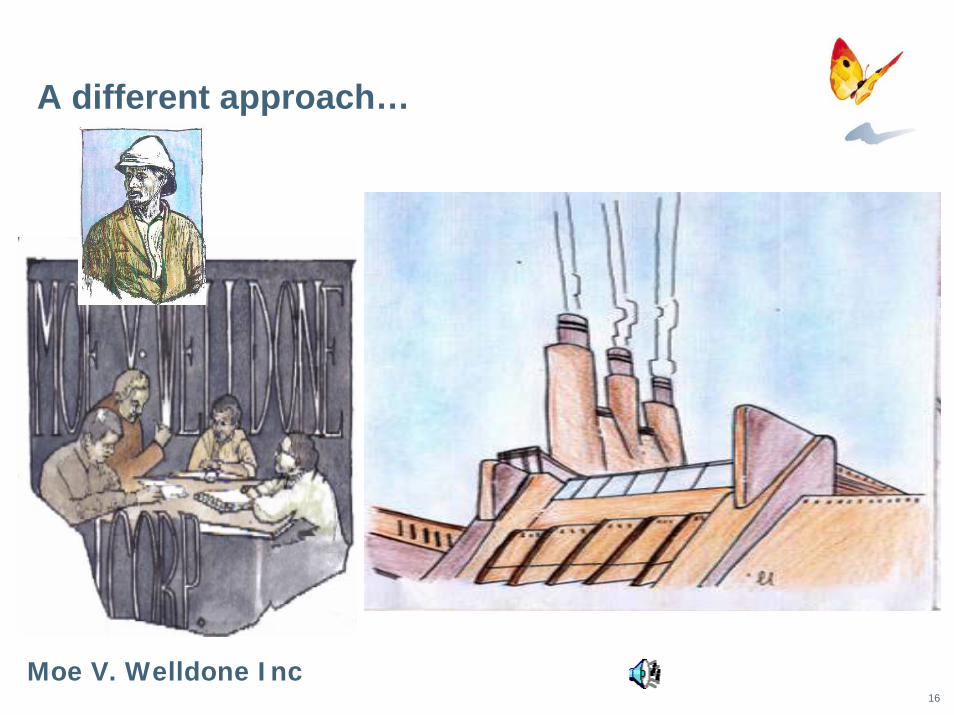
A different approach…
Moe V. Welldone Inc

17
The moral to the story…
• All the approaches are neither good nor bad, they depend on what are used for and how they are used.
• Projects need control and supervision, independently of the way they are contracted.
• It is fundamental to guarantee the quality and skills of the resources.
• Contracting strategy and Service Level Agreements are fundamental.
• Things can be done well or as always.
• It is necessary to distinguish among participating in a project and to be implied in it.
• Contrary to Caesar's woman, it is not about seeming good, but ofbeing good.

18
Who are we

19
Who are we
Main gas distribution and supplier group in SpainOperates in 11 countries
Spain, Portugal, France, ItalyMorocco, ArgeliaBrazil, Argentina, Colombia, México, Puerto Rico
Multi-utility orientedGas, Electricity, Services, Maintenance, etc
10 Million Customers
Gas Natural SDG

20
Who are we
Company of the group responsible for software development services, exploitation and management of data and voice communications.Multiple platforms : Mainframe, Unix, Linux, Windows XPMúltiple tecnologíes: SAP, Siebel ERM y CRM, GIS, SAS, Microstrategy, J2EE, Fatwire, Natural, Cognos, MQ,etc.International communications network4 DPC’s ( 2 in BRS configuration), 1.000 Mips747 servers, 200 in DPC100 Tb of Disk+8.000 Users, 6.935 PC’s117 Local área networks, 415 comm. linesMore than 700.000 hours/year in application development andmaintenance
Gas Natural Informática S.A.

21
MOOD Initiative

22
Introduction
The changing situation ,both in the regulatory environment and in Gas Natural SDG itself, forced GNI to an internal reflexion on the developmentstrategy oriented to :
Adapt to the changing market conditions
Improve our response to our internal customer’s demands
Adapt our structure to GN’s new reality
Reinforce the proper use of emerging technologies

23
Introduction (2…)
Structure of development groups was out of date
Relationship between end users and developers was not efficient
Implication of end users should be increased
Software quality culture should be promoted
Complexity of current systems , both at hardware and software leveldemanded new approaches

24
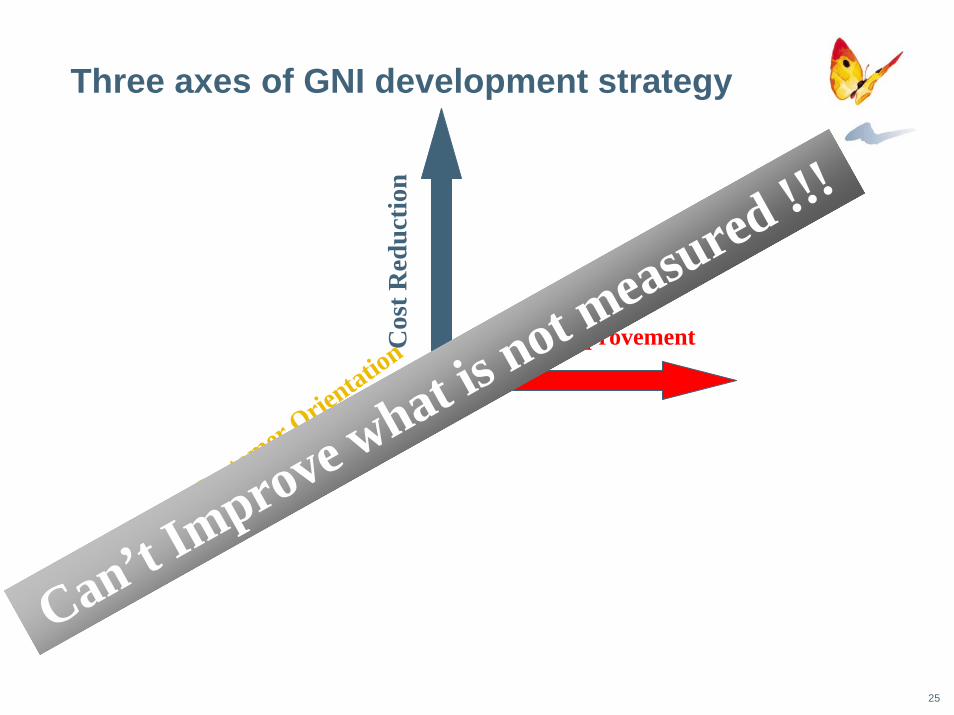
Three axes of GNI development strategy
Customer
Orientation C
ostR
educ
tion
Quality Improvement
Need for Improvement !!! Need for Improvement !!!
But….
25
Three axes of GNI development strategy
Customer
Orientation C
ostR
educ
tion
Quality Improvement
Can’t Improve what is
not measured !!!

26
MOOD Initiative
Standardize Products and ActivitiesStandardize Products and Activities
Develop tools to collect measurementsDevelop tools to collect measurements
Develop tools to report and analyze resultsDevelop tools to report and analyze results
Implement relationship modelsImplement relationship models
Start improving !!!Start improving !!!

27
Standardize products and activities
Common development methodologyCommon development methodology
Technical and political proceduresTechnical and political procedures
QA policy and toolsQA policy and tools
Standard products and process Standard products and process
Best practices from CMM, ITIL, Cobit, etcBest practices from CMM, ITIL, Cobit, etc
28
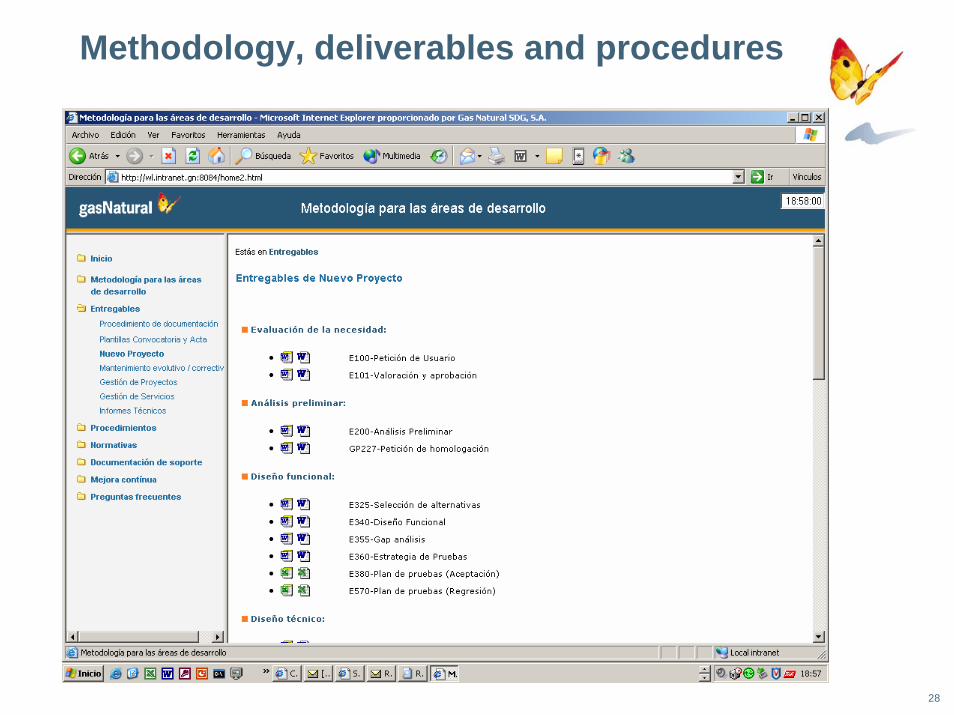
Methodology, deliverables and procedures
29
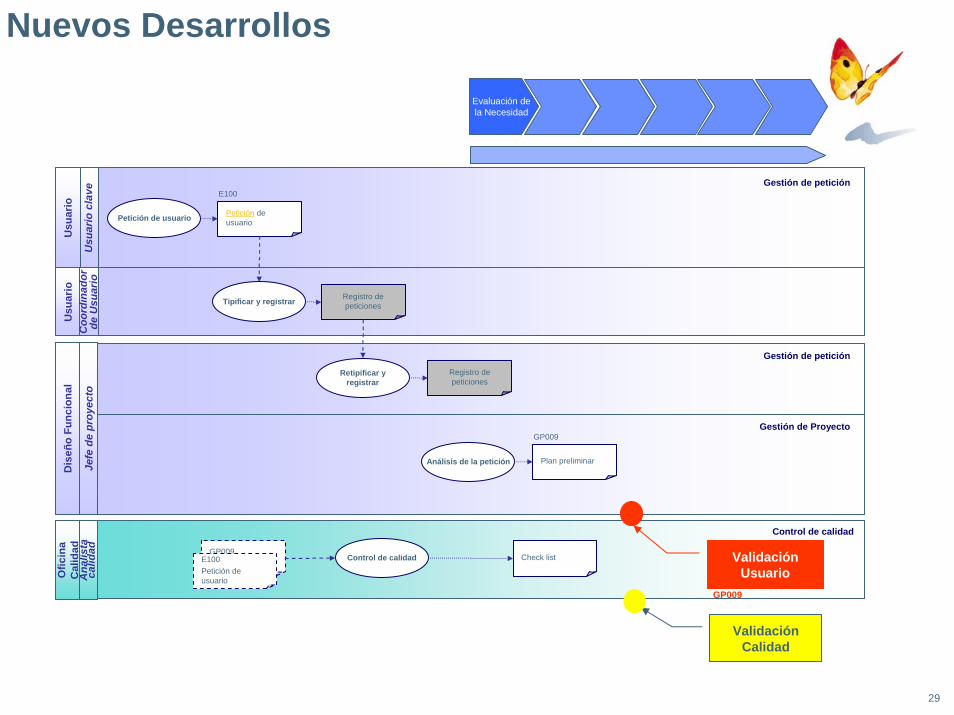
Nuevos Desarrollos
Evaluación dela Necesidad
Petición de usuario
Análisis de la petición Plan preliminar
GP009
Petición de usuario
E100
Gestión de Proyecto
Usu
ario
cla
ve
Usu
ario
Validación Usuario
GP009
Gestión de petición
Tipificar y registrar Registro de peticiones
Retipificar yregistrar
Registro de peticiones
Usu
ario
Coo
rdin
ador
de
Usu
ario
Gestión de petición
Jefe
de
proy
ecto
Dis
eño
Func
iona
lA
nalis
ta
calid
ad
Ofic
ina
Cal
idad
Control de calidad Check listGP009Plan preliminarE100
Petición de usuario
Control de calidad
Validación Calidad
30
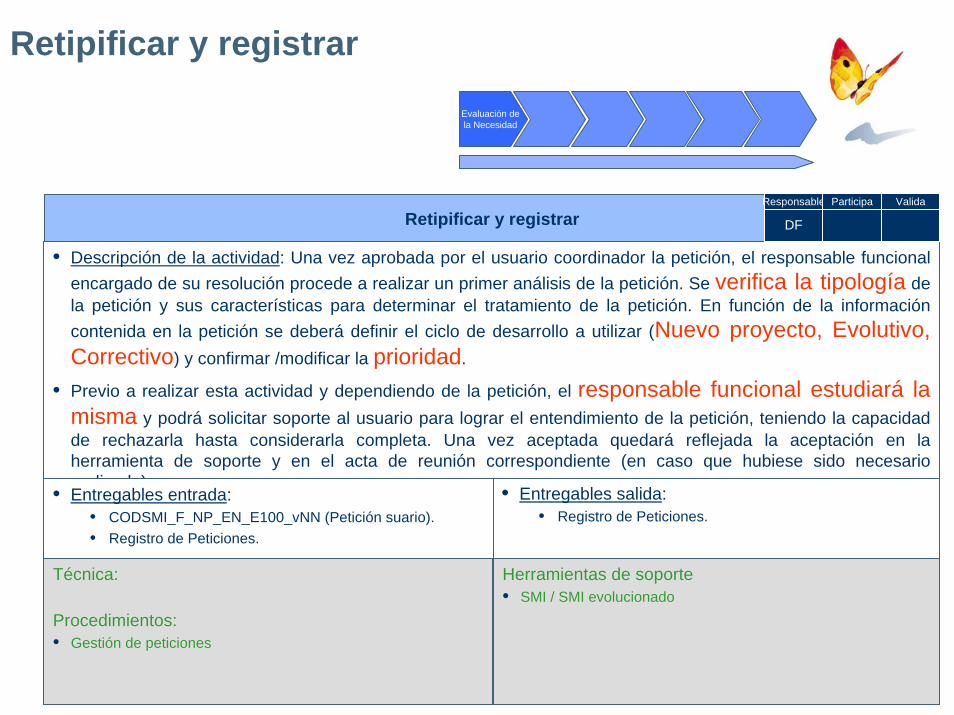
Retipificar y registrar
Evaluación dela Necesidad
Retipificar y registrar
• Entregables salida:• Registro de Peticiones.
Técnica:
Procedimientos:• Gestión de peticiones
• Descripción de la actividad: Una vez aprobada por el usuario coordinador la petición, el responsable funcional encargado de su resolución procede a realizar un primer análisis de la petición. Se verifica la tipología de la petición y sus características para determinar el tratamiento de la petición. En función de la información contenida en la petición se deberá definir el ciclo de desarrollo a utilizar (Nuevo proyecto, Evolutivo, Correctivo) y confirmar /modificar la prioridad.
• Previo a realizar esta actividad y dependiendo de la petición, el responsable funcional estudiará la misma y podrá solicitar soporte al usuario para lograr el entendimiento de la petición, teniendo la capacidad de rechazarla hasta considerarla completa. Una vez aceptada quedará reflejada la aceptación en la herramienta de soporte y en el acta de reunión correspondiente (en caso que hubiese sido necesario realizarla).• Entregables entrada:
• CODSMI_F_NP_EN_E100_vNN (Petición suario).• Registro de Peticiones.
DF
Responsable Participa Valida
Herramientas de soporte• SMI / SMI evolucionado
31
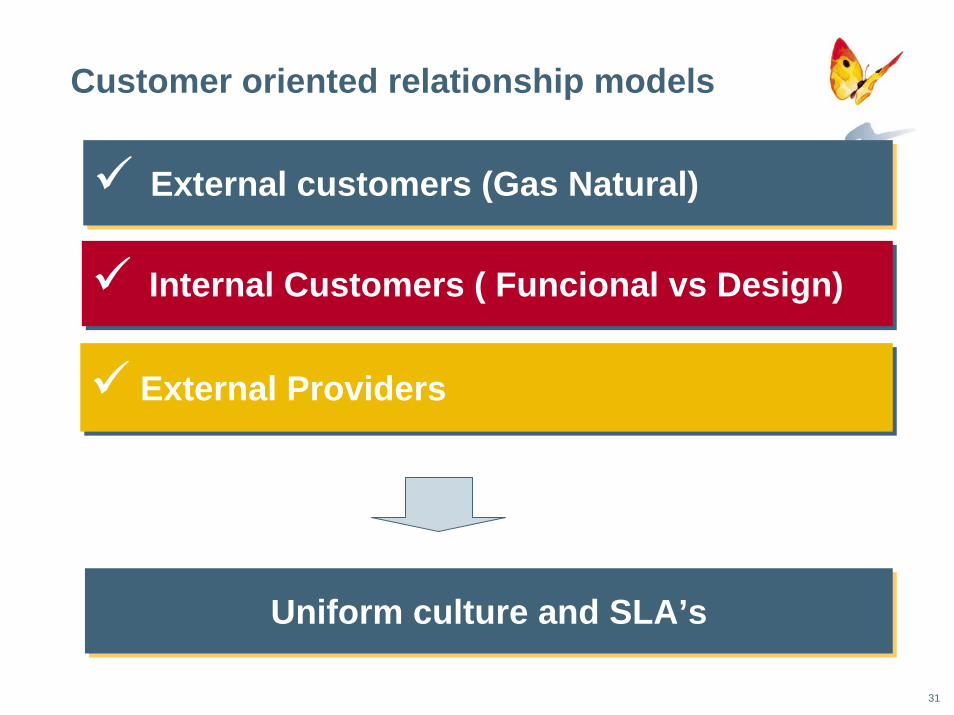
Customer oriented relationship models
External customers (Gas Natural)External customers (Gas Natural)
Internal Customers ( Funcional vs Design)Internal Customers ( Funcional vs Design)
External ProvidersExternal Providers
Uniform culture and SLA’s Uniform culture and SLA’s
32
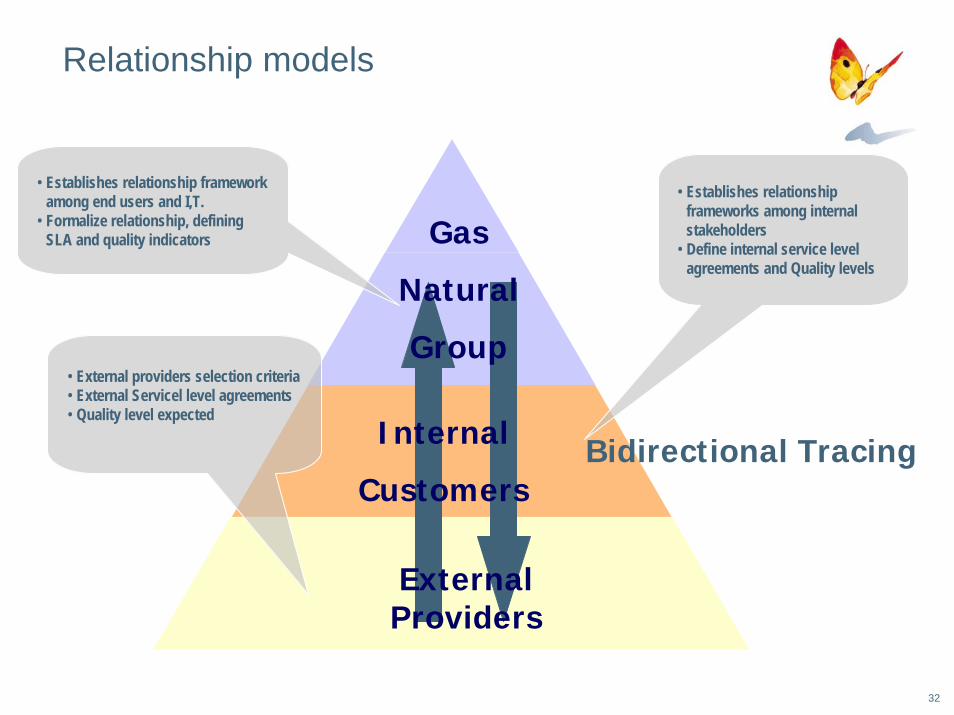
Relationship models
• Establishes relationship frameworkamong end users and I,T.
• Formalize relationship, definingSLA and quality indicators
• Establishes relationshipframeworks among internalstakeholders
• Define internal service levelagreements and Quality levels
• External providers selection criteria• External Servicel level agreements• Quality level expected
ExternalProviders
Internal
Customers
Gas
Natural
Group
Bidirectional Tracing
33
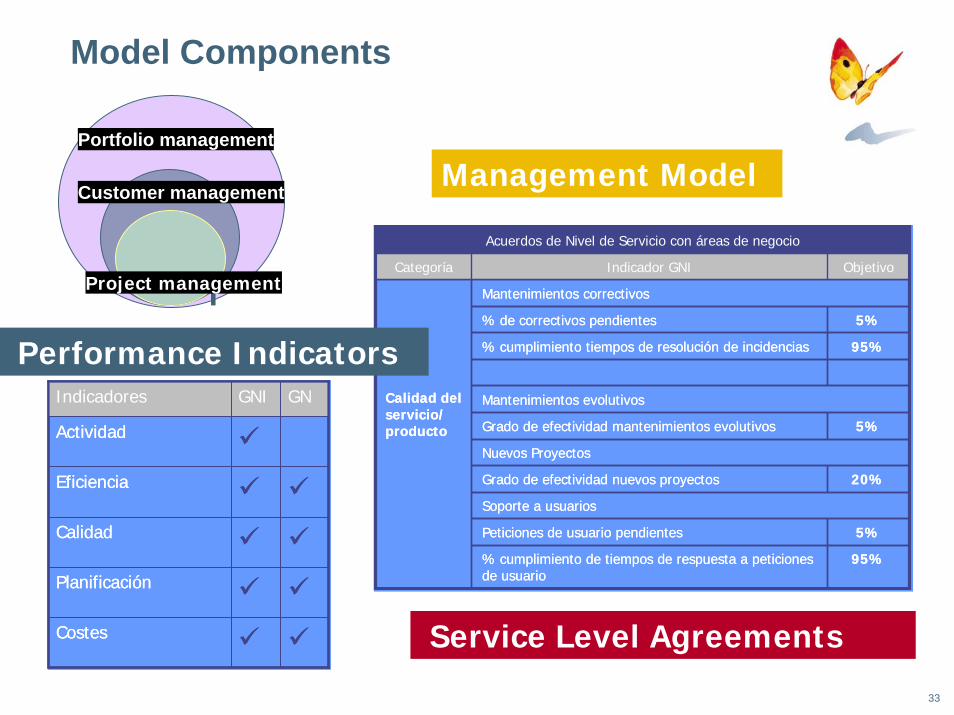
Model Components
*
Customer management
*Project management
Portfolio management
Management Model
95%% cumplimiento tiempos de resolución de incidencias
5%% de correctivos pendientes
5%Peticiones de usuario pendientes
Soporte a usuarios
20%Grado de efectividad nuevos proyectos
Mantenimientos evolutivos
Mantenimientos correctivos
Calidad del servicio/ producto
Nuevos Proyectos
Acuerdos de Nivel de Servicio con áreas de negocio
5%Grado de efectividad mantenimientos evolutivos
95%% cumplimiento de tiempos de respuesta a peticiones de usuario
ObjetivoIndicador GNICategoría
Planificación
Calidad
Costes
Eficiencia
Actividad
GNGNIIndicadores
Planificación
Calidad
Costes
Eficiencia
Actividad
GNGNIIndicadores
Service Level Agreements
Performance Indicators

34
Tools for data collection and measurement
Activity tracking and timesheetActivity tracking and timesheet
Activity reportingActivity reporting
DashboardsDashboards
Metrics, forecast, estimates!!! Metrics, forecast, estimates!!!
Data analtyticsData analtytics

35
Development Life cycle management
Planning managementLoad managementChange managementFunctional version managementAssociated documentation generation and storageEffort trackingOutsourced, turnkey and body shopping projects managementMethodology integration
Request Manager SYD

36
Request manager SYD

37
Request manager SYD

38
Activity reporting

39
Activity reporting

40
Dashboards

41
Using SAS to provide metrics
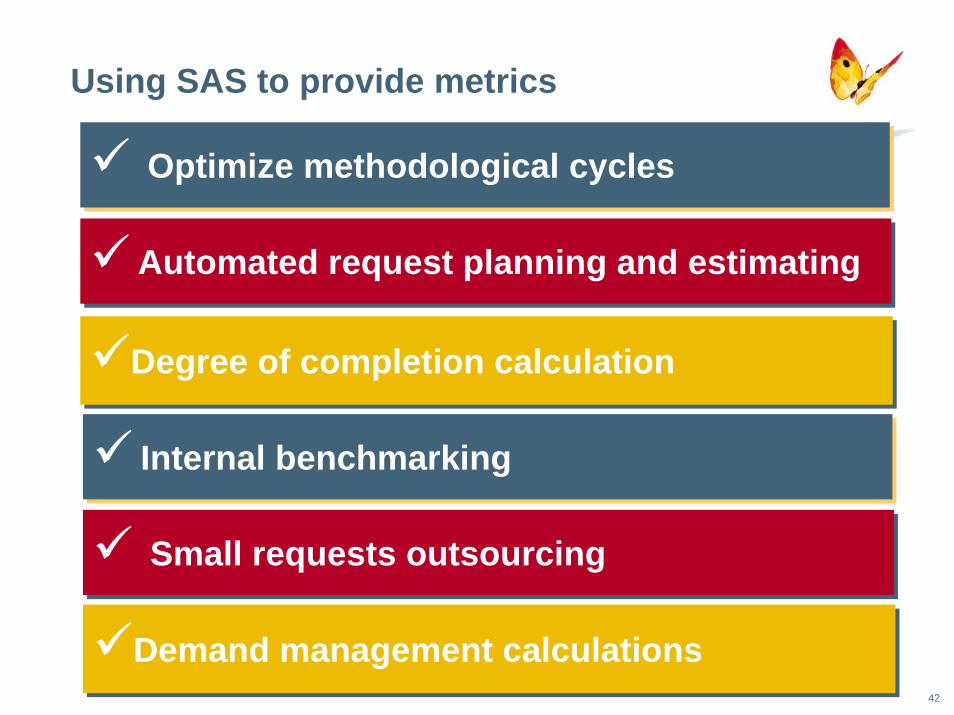
42
Using SAS to provide metrics
Optimize methodological cyclesOptimize methodological cycles
Automated request planning and estimatingAutomated request planning and estimating
Degree of completion calculationDegree of completion calculation
Small requests outsourcingSmall requests outsourcing
Internal benchmarkingInternal benchmarking
Demand management calculationsDemand management calculations

43
Optimize methodology cycles
Corrective maintenance distribution

44
Evaluationof user needs
UserR
quest
Diseñofuncional
Diseño técnico
Construcción ImplantaciónAnálisispreliminar
Project cycle
Diseño técnico
Construcción Implantación
Corrective maintenance cycle
Short Evolutive cycle
Short corrective cycle
Ultra short evolutive cycle
Ultra short corrective cycle
Evolutive maintenance cycle
Diseñofuncional
Diseño técnico
Construcción Implantación
Methodology cycles
45
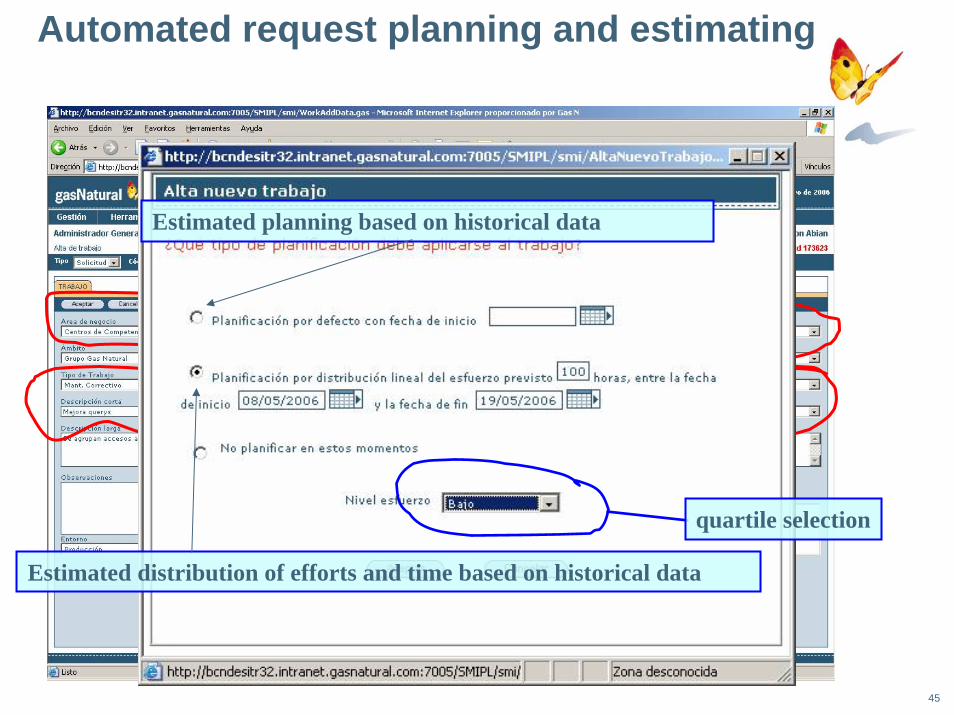
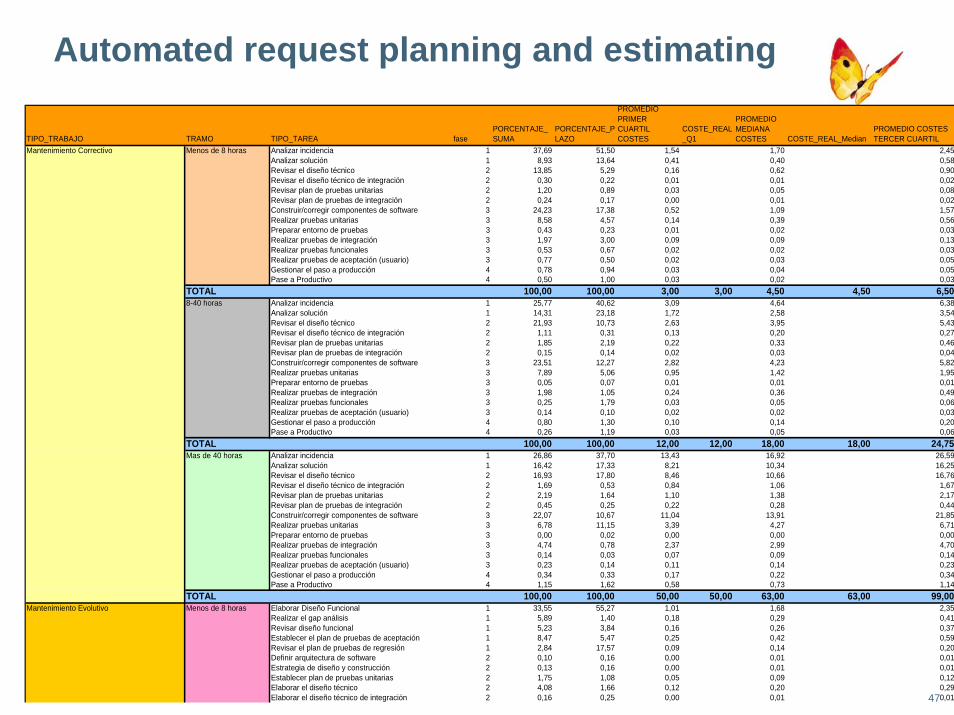
Automated request planning and estimating
Request Categorization
Application affected
quartile selection
Estimated planning based on historical data
Estimated distribution of efforts and time based on historical data
46
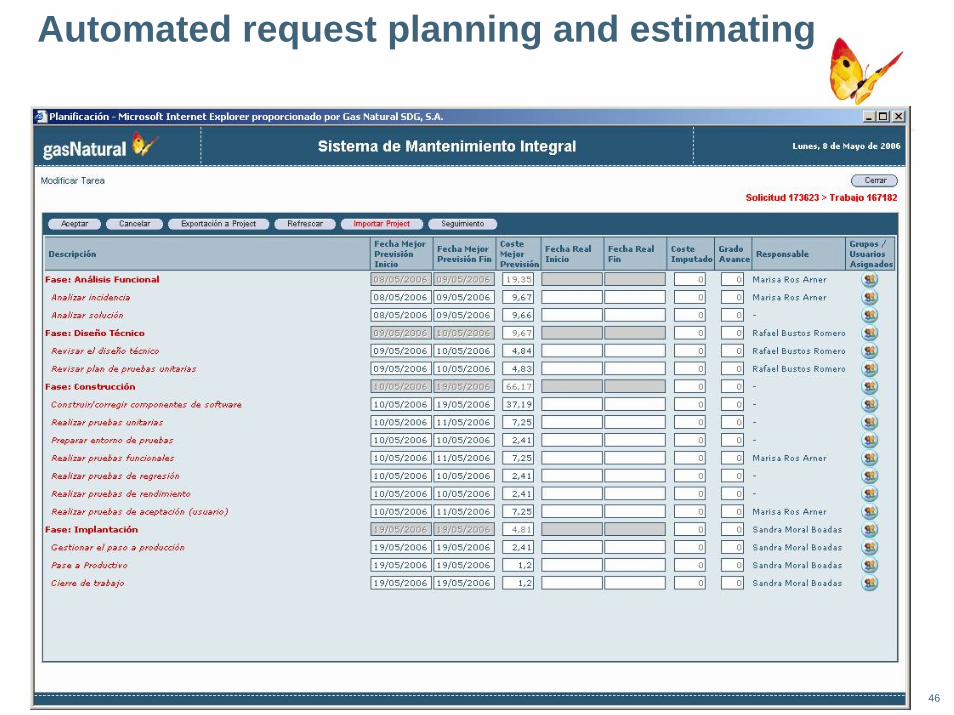
Automated request planning and estimating
47
TIPO_TRABAJO TRAMO TIPO_TAREA fasePORCENTAJE_SUMA
PORCENTAJE_PLAZO
PROMEDIO PRIMER CUARTIL COSTES
COSTE_REAL_Q1
PROMEDIO MEDIANA COSTES COSTE_REAL_Median
PROMEDIO COSTES TERCER CUARTIL
Mantenimiento Correctivo Menos de 8 horas Analizar incidencia 1 37,69 51,50 1,54 1,70 2,45Analizar solución 1 8,93 13,64 0,41 0,40 0,58Revisar el diseño técnico 2 13,85 5,29 0,16 0,62 0,90Revisar el diseño técnico de integración 2 0,30 0,22 0,01 0,01 0,02Revisar plan de pruebas unitarias 2 1,20 0,89 0,03 0,05 0,08Revisar plan de pruebas de integración 2 0,24 0,17 0,00 0,01 0,02Construir/corregir componentes de software 3 24,23 17,38 0,52 1,09 1,57Realizar pruebas unitarias 3 8,58 4,57 0,14 0,39 0,56Preparar entorno de pruebas 3 0,43 0,23 0,01 0,02 0,03Realizar pruebas de integración 3 1,97 3,00 0,09 0,09 0,13Realizar pruebas funcionales 3 0,53 0,67 0,02 0,02 0,03Realizar pruebas de aceptación (usuario) 3 0,77 0,50 0,02 0,03 0,05Gestionar el paso a producción 4 0,78 0,94 0,03 0,04 0,05Pase a Productivo 4 0,50 1,00 0,03 0,02 0,03
TOTAL 100,00 100,00 3,00 3,00 4,50 4,50 6,508-40 horas Analizar incidencia 1 25,77 40,62 3,09 4,64 6,38
Analizar solución 1 14,31 23,18 1,72 2,58 3,54Revisar el diseño técnico 2 21,93 10,73 2,63 3,95 5,43Revisar el diseño técnico de integración 2 1,11 0,31 0,13 0,20 0,27Revisar plan de pruebas unitarias 2 1,85 2,19 0,22 0,33 0,46Revisar plan de pruebas de integración 2 0,15 0,14 0,02 0,03 0,04Construir/corregir componentes de software 3 23,51 12,27 2,82 4,23 5,82Realizar pruebas unitarias 3 7,89 5,06 0,95 1,42 1,95Preparar entorno de pruebas 3 0,05 0,07 0,01 0,01 0,01Realizar pruebas de integración 3 1,98 1,05 0,24 0,36 0,49Realizar pruebas funcionales 3 0,25 1,79 0,03 0,05 0,06Realizar pruebas de aceptación (usuario) 3 0,14 0,10 0,02 0,02 0,03Gestionar el paso a producción 4 0,80 1,30 0,10 0,14 0,20Pase a Productivo 4 0,26 1,19 0,03 0,05 0,06
TOTAL 100,00 100,00 12,00 12,00 18,00 18,00 24,75Mas de 40 horas Analizar incidencia 1 26,86 37,70 13,43 16,92 26,59
Analizar solución 1 16,42 17,33 8,21 10,34 16,25Revisar el diseño técnico 2 16,93 17,80 8,46 10,66 16,76Revisar el diseño técnico de integración 2 1,69 0,53 0,84 1,06 1,67Revisar plan de pruebas unitarias 2 2,19 1,64 1,10 1,38 2,17Revisar plan de pruebas de integración 2 0,45 0,25 0,22 0,28 0,44Construir/corregir componentes de software 3 22,07 10,67 11,04 13,91 21,85Realizar pruebas unitarias 3 6,78 11,15 3,39 4,27 6,71Preparar entorno de pruebas 3 0,00 0,02 0,00 0,00 0,00Realizar pruebas de integración 3 4,74 0,78 2,37 2,99 4,70Realizar pruebas funcionales 3 0,14 0,03 0,07 0,09 0,14Realizar pruebas de aceptación (usuario) 3 0,23 0,14 0,11 0,14 0,23Gestionar el paso a producción 4 0,34 0,33 0,17 0,22 0,34Pase a Productivo 4 1,15 1,62 0,58 0,73 1,14
TOTAL 100,00 100,00 50,00 50,00 63,00 63,00 99,00Mantenimiento Evolutivo Menos de 8 horas Elaborar Diseño Funcional 1 33,55 55,27 1,01 1,68 2,35
Realizar el gap análisis 1 5,89 1,40 0,18 0,29 0,41Revisar diseño funcional 1 5,23 3,84 0,16 0,26 0,37Establecer el plan de pruebas de aceptación 1 8,47 5,47 0,25 0,42 0,59Revisar el plan de pruebas de regresión 1 2,84 17,57 0,09 0,14 0,20Definir arquitectura de software 2 0,10 0,16 0,00 0,01 0,01Estrategia de diseño y construcción 2 0,13 0,16 0,00 0,01 0,01Establecer plan de pruebas unitarias 2 1,75 1,08 0,05 0,09 0,12Elaborar el diseño técnico 2 4,08 1,66 0,12 0,20 0,29Elaborar el diseño técnico de integración 2 0,16 0,25 0,00 0,01 0,01
Automated request planning and estimating
48
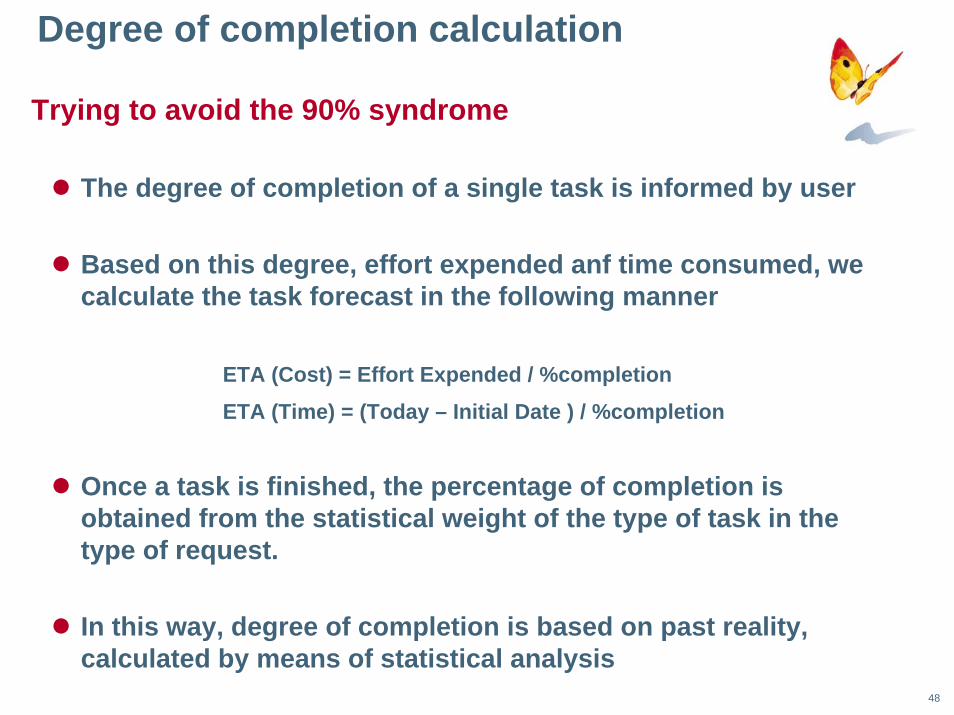
Trying to avoid the 90% syndrome
The degree of completion of a single task is informed by user
Based on this degree, effort expended anf time consumed, wecalculate the task forecast in the following manner
ETA (Cost) = Effort Expended / %completion
ETA (Time) = (Today – Initial Date ) / %completion
Once a task is finished, the percentage of completion isobtained from the statistical weight of the type of task in thetype of request.
In this way, degree of completion is based on past reality, calculated by means of statistical analysis
Degree of completion calculation

49
Current usage
Small corrective and evolutive requests developed in outsourcing mode are estimated based on effort ranges
Requested effort to be paid is the statistical mean of therange selectedCost is calculated using effort and tariff means
Ranges are updated in six month frecuency and new means are established, the same as redefining ranges, depending onexisting data.
Working in this way, it’s very easy to negociate, estimate and manage these small tasks.
Small request outsourcing

50
Small request outsourcing
Task group to outsource
Outsurcer assigned
Effort range

51
Small request outsourcing
Requested finish date
Effort and fee to be paid

52
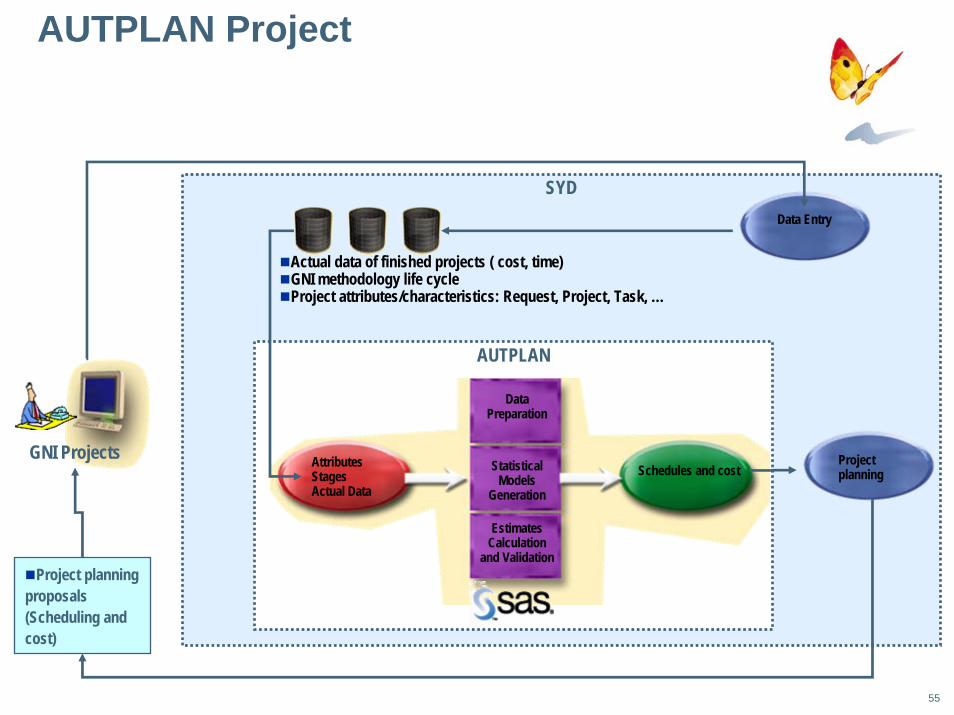
AUTPLAN project

53
ObjectivesAUTPLAN is configured as an additional SYD module, integrated with SAS Analytical model, to provide:
Statistic models for effort and timings for new project, atevery stage of the life cycle
Based on multivariable analysisUsing historic metrics, both qualitative and quantitativeReadjustment of forecast, based on real information offinished stages of the project
AUTPLAN Project

54
Input / Output DataIndependent variables:
Qualitative (Business , Technologies, Request type, complexity, effort range, etc)Quantitative (number of requirements, functionalities, entidades, interfases, etc..)Quantitative variables will be extracted from the deliverablesvia XML)Closing project qualitative variables ( Final complexity, usercollaboration, lessons learned, etc)
Dependent variables:EffortTime
Precalculated models for each project stage
AUTPLAN Project
55
AUTPLAN Project
GNI Projects
SYD
Actual data of finished projects ( cost, time)GNI methodology life cycleProject attributes/characteristics: Request, Project, Task, …
AUTPLAN
AttributesStagesActual Data
Data Preparation
StatisticalModels
Generation
Project planning proposals(Scheduling andcost)
EstimatesCalculation
and Validation
Schedules and cost
Data Entry
Project planning
56
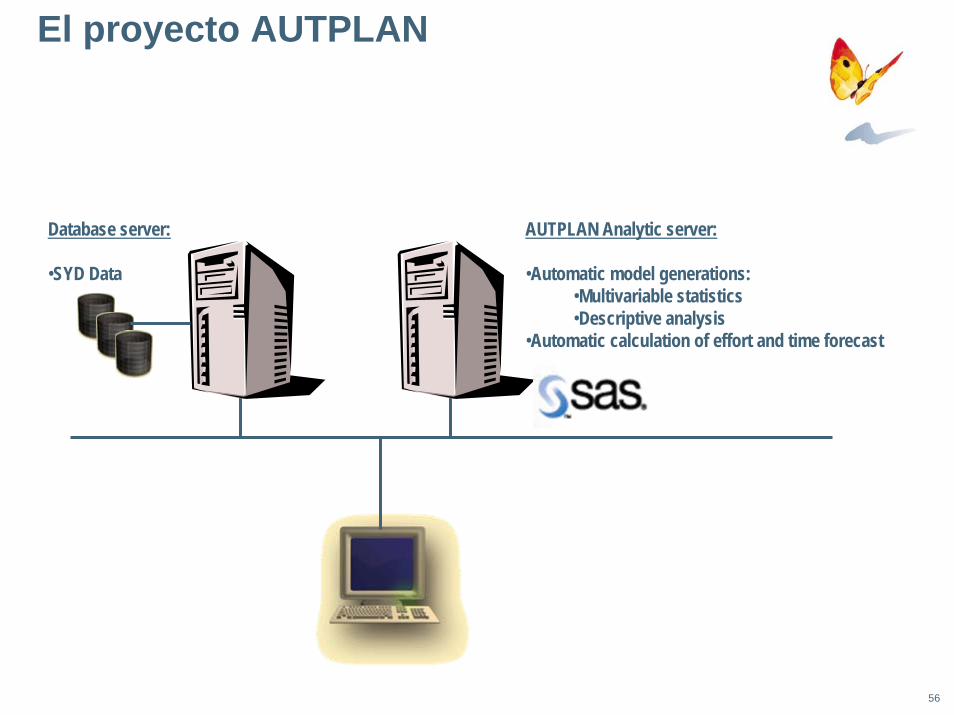
El proyecto AUTPLAN
AUTPLAN Analytic server:
•Automatic model generations:•Multivariable statistics•Descriptive analysis
•Automatic calculation of effort and time forecast
Database server:
•SYD Data

57
Questions ???
Thank you very much !!!
and that’s all, folks!!!
58
Esta presentación es propiedad del Grupo Gas Natural. Tanto su contenido temático como diseño gráfico es para uso exclusivo de su personal.
©Copyright Gas Natural SDG, S.A.